79
Monetary Policy Council July 2017 Inflation Report
Monetary Policy Council
July 2017
Inflation Report
Inflation Report – July 2017
2
The Inflation Report presents the Monetary Policy Council's assessment of the macroeconomic developments
influencing inflation. The projection of inflation and GDP presented in Chapter 4 was prepared at the
Economic Analysis Department of Narodowy Bank Polski (NBP). In terms of the contents, works on the
projection were supervised by Piotr Szpunar, Director of the Economic Analysis Department. The projection
was prepared with the use of the NECMOD macroeconomic model. The NBP Management Board approved
the submission of the projection to the Monetary Policy Council. The inflation projection is one of the inputs
to the Monetary Policy Council's decision-making process.
The time frame of the analysis presented in the Report is conditioned by the availability of macroeconomic
data. In turn, the periodisation of the analysis (breakdown into sub-periods) is conditioned by the
development of particular variables. The cut-off date for the data in this Report was 22 June 2017.
This Inflation Report is a translation of NBP’s Raport o inflacji in Polish. In case of discrepancies, the original
prevails.
3
Summary 5
External developments 7 1
1.1 Economic activity abroad 7
1.2 Inflationary developments abroad 8
1.3 Global commodity markets 9
1.4 Monetary policy abroad 10
Box 1: Czech National Bank discontinues its exchange rate commitment 11
1.5 International financial markets 13
Box 2: Decline in stock price volatility in the US stock market 15
Domestic economy 19 2
2.1 Consumer prices 19
2.2 Demand and output 20
2.3 Financial situation in the enterprise sector 25
2.4 Labour market 26
2.5 Asset markets 28
2.6 Money and credit 30
2.7 Balance of payments 32
Monetary policy in March – July 2017 33 3
Projection of inflation and GDP 45 4
4.1 Summary 46
4.2 External environment 48
4.3 Polish economy in 2017-2019 53
4.4 Current versus previous projection 68
4.5 Forecast uncertainty sources 71
The voting of the Monetary Policy Council members in March – May 2017 77 5
Contents

Inflation Report – July 2017
4
Summary
5
Summary
Signs of improvement in the global economy are strengthening, particularly in industry and trade.
Economic growth abroad, including Poland's major trading partners, has accelerated somewhat recently,
yet it remains lower than before the global financial crisis. In the euro area, the economy has been
recovering over the past few quarters, while in the United States, GDP growth decelerated in quarterly
terms in 2017 Q1. In Poland’s largest emerging market trading partners, economic conditions have
improved somewhat, yet remain relatively weak.
Price growth in advanced economies, following a noticeable acceleration at the turn of 2016 and 2017,
has stabilised at a moderate level, primarily due to dissipating impact of an earlier rise in commodity
prices. At the same time, improving economic conditions in the advanced economies are reflected in
higher core inflation.
Monetary policy of the major central banks remains expansionary. The European Central Bank (ECB) is
keeping the interest rates close to zero, including the deposit rates below zero, and continues its asset
purchase programme, albeit, starting from April 2017, at a slower pace. In turn, the Federal Reserve
(Fed) is tightening its monetary policy by raising interest rates. At the same time, the Fed is reinvesting
principal payments from its holdings of securities purchased under the quantitative easing programme,
yet intends to gradually reduce the scale of the reinvestment.
As a result of better global economic conditions and still expansionary monetary policy of the major
central banks, sentiment in the international financial markets has improved over recent months, while
financial asset price volatility has declined. Against this background, stock indices have risen
significantly to reach record highs in several advanced economies, government bond yields have
declined, and emerging market currencies, including Central and Eastern European ones, have
appreciated.
In Poland, following a significant rise at the beginning of 2017, annual consumer price growth has
stabilised at a moderate level, as the impact of the earlier rise in global commodity prices has been
fading, while core inflation have risen against early 2017 levels on better domestic economic conditions,
and the food price growth rate has accelerated. Unit labour costs growth has been moderate, remaining
close to the average from recent years.
In 2017 Q1, GDP growth accelerated noticeably following a temporary slowdown in 2016. Economic
growth is driven primarily by increasing consumer demand, supported by rising employment and
wages, very good consumer sentiment and disbursement of benefits, with near-zero investment growth
rate. Also contribution of net exports to GDP growth was close to zero, in spite of still significant pace of
increase in exports and imports. Leading economic indicators as well as developments in industry and
retail trade suggest that in 2017 Q2 GDP growth will be close to the previous quarter.
In spite of improving economic conditions, lending is growing steadily in line with nominal GDP
growth. Loans to households, both consumer and housing loans, remain the most important component
of lending growth to the non-financial sector, accompanied by an ongoing rise in loans to the corporate
sector.
6
Inflation Report – July 2017
Against this background, the Monetary Policy Council has been keeping the NBP interest rates
unchanged since March 2015, including the reference rate at 1.5%. Market participants expect stable level
of the interest rates also in the coming quarters.
Polish government bond yields declined over recent months, mainly as a result of a fall in the term
premium as well as an improving sentiment in the international financial markets. In addition, the zloty
has appreciated and stock prices have increased to reach the highest level since 2007 in May. Residential
real estate prices remain relatively stable, notwithstanding their slight pick-up in several cities.
In spite of the acceleration in GDP growth, external imbalances are not accumulating. In 2017 Q1 current
account balance (in relation to GDP, in terms of a four-quarter rolling sum) rose to around zero. Other
external imbalance indicators are also at favourable levels.
The Report is structured as follows: Chapter 1 presents the analysis of economic conditions in the external
environment of the Polish economy in terms of their impact on inflation developments in Poland. These
developments and the domestic factors that might affect them have been described in Chapter 2. Minutes
of the Monetary Policy Council decision-making meetings held in March – June 2017, together with the
Information from the meeting of the Monetary Policy Council in July 2017 are presented in Chapter 3. Minutes
of the MPC meeting held in July will be published on 24 August 2017 and so will be included in the next
Report. The Monetary Policy Council voting records from the meetings held in March – May 2017 can be
found in Chapter 5. This Report also includes two boxes: Czech National Bank discontinues its exchange rate
commitment and Decline in stock price volatility in the US stock market.
Chapter 4 of the Report presents the projection for inflation and GDP based on the NECMOD model,
which is one of the inputs into the Council's decision-making process on the NBP interest rates. In line
with the March projection – prepared under the assumption of unchanged NBP interest rates and taking
into account data available until 14 June 2017 – there is a 50-per cent probability that the annual price
growth will be in the range of 1.6 – 2.3% in 2017 (compared to 1.6 – 2.5% in the March 2017 projection),
1.1 – 2.9% in 2018 (as against 0.9 – 2.9%) and 1.3 – 3.6% in 2019 (versus 1.2 – 3.5%). The annual GDP
growth – under this projection – will be, with a 50-per cent probability, in the range of 3.4 – 4.7% in 2017
(as compared to 3.4 – 4.0% in the March 2017 projection), 2.5 – 4.5% in 2018 (as against 2.4 – 4.5%) and 2.3
– 4.3% in 2019 (versus 2.3 – 4.4%).
7
1. External developments
External developments 1
1.1 Economic activity abroad
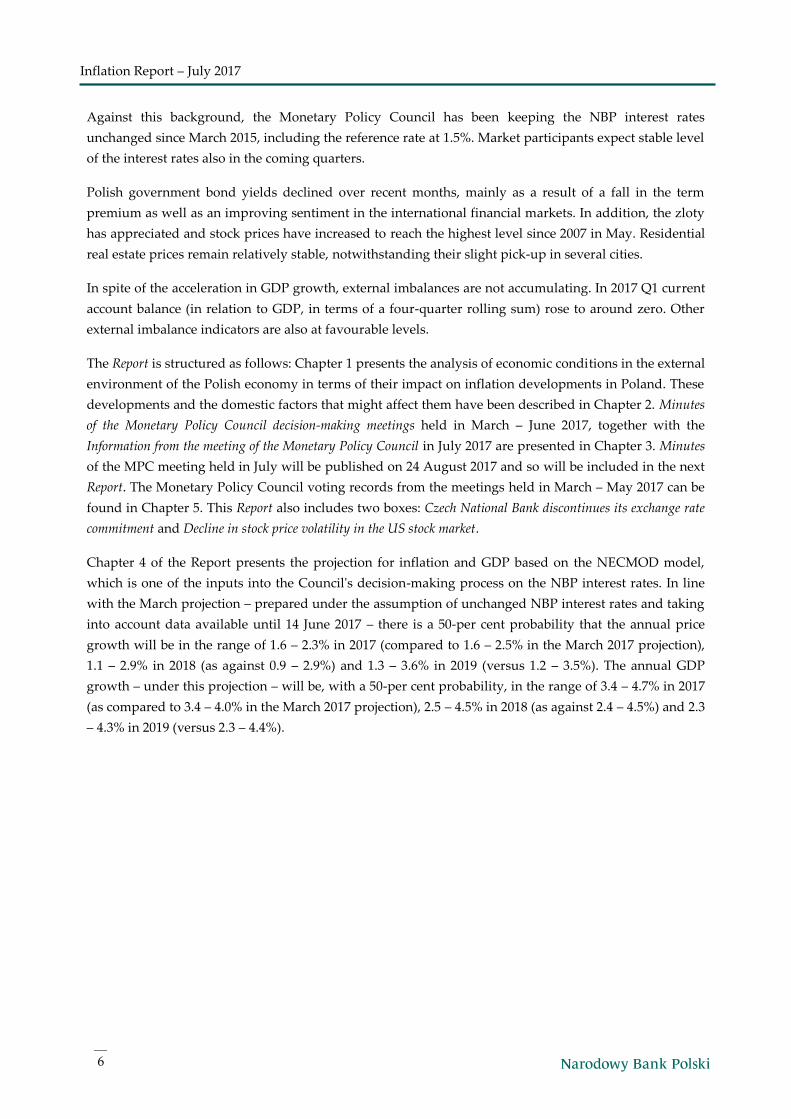
Signs of improvement in the global economy are
strengthening, particularly in industry and trade
(Figure 1.1, Figure 1.2). Economic growth abroad,
including in Poland's major trading partners, has
accelerated somewhat recently, yet it remains
lower than before the global financial crisis.
In the euro area, the economy has been recovering
over the past few quarters (Figure 1.3), supported
by stable rise in private consumption amid
improving labour market conditions in many euro
area member states. Expansionary monetary policy
of the ECB (see Chapter 1.4 Monetary policy
abroad) and easy fiscal policy in many member
states have also been contributing to economic
growth in the euro area. Another factor of recovery
in this economy is higher turnover in the
international trade. Investment activity, though
growing, remains below its pre-crisis level.
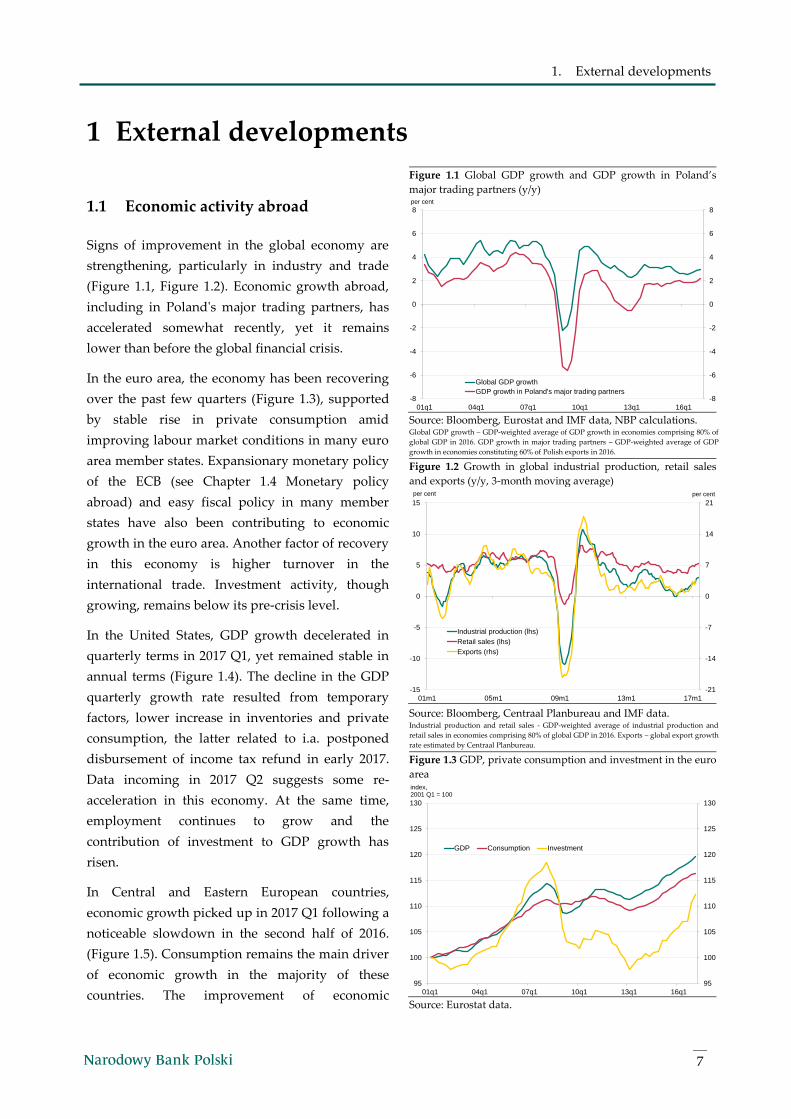
In the United States, GDP growth decelerated in
quarterly terms in 2017 Q1, yet remained stable in
annual terms (Figure 1.4). The decline in the GDP
quarterly growth rate resulted from temporary
factors, lower increase in inventories and private
consumption, the latter related to i.a. postponed
disbursement of income tax refund in early 2017.
Data incoming in 2017 Q2 suggests some re-
acceleration in this economy. At the same time,
employment continues to grow and the
contribution of investment to GDP growth has
risen.
In Central and Eastern European countries,
economic growth picked up in 2017 Q1 following a
noticeable slowdown in the second half of 2016.
(Figure 1.5). Consumption remains the main driver
of economic growth in the majority of these
countries. The improvement of economic
Figure 1.1 Global GDP growth and GDP growth in Poland’s
major trading partners (y/y)
Source: Bloomberg, Eurostat and IMF data, NBP calculations. Global GDP growth – GDP-weighted average of GDP growth in economies comprising 80% of
global GDP in 2016. GDP growth in major trading partners – GDP-weighted average of GDP
growth in economies constituting 60% of Polish exports in 2016.
Figure 1.2 Growth in global industrial production, retail sales
and exports (y/y, 3-month moving average)
Source: Bloomberg, Centraal Planbureau and IMF data. Industrial production and retail sales - GDP-weighted average of industrial production and
retail sales in economies comprising 80% of global GDP in 2016. Exports – global export growth
rate estimated by Centraal Planbureau.
Figure 1.3 GDP, private consumption and investment in the euro
area
Source: Eurostat data.
-8
-6
-4
-2
0
2
4
6
8
-8
-6
-4
-2
0
2
4
6
8
01q1 04q1 07q1 10q1 13q1 16q1
per cent
Global GDP growth
GDP growth in Poland's major trading partners
-21
-14
-7
0
7
14
21
-15
-10
-5
0
5
10
15
01m1 05m1 09m1 13m1 17m1
per centper cent
Industrial production (lhs)
Retail sales (lhs)
Exports (rhs)
95
100
105
110
115
120
125
130
95
100
105
110
115
120
125
130
01q1 04q1 07q1 10q1 13q1 16q1
index, 2001 Q1 = 100
GDP Consumption Investment
Inflation Report – July 2017
8
1 The decline in headline and core CPI inflation in the United States in the recent period was to a large extent a result of the fall in vehicle prices (new
and used) and the slowdown in the growth in prices of medical and transportation services.
conditions in the region was also supported by
recovery in investment and the increase in global
trade turnover.
In other emerging market economies being
Poland’s major trading partners, economic
conditions have slightly improved, though they are
still relatively weak. In China, GDP growth picked
up in 2017 Q1, yet the recent data, particularly
from the industrial sector, does not indicate a
sustained acceleration in growth. In addition,
imbalances continue to build up in the Chinese real
estate sector, which limits the long-term economic
growth outlook for this country. Russia has
emerged from recession. However, economic
conditions in this country are still largely
dependent from oil prices, which decreased over
recent months.
1.2 Inflationary developments abroad
After significant growth at the turn of 2016 and
2017, inflation in the global economy has stabilised
at a moderate level.
The stabilisation of global inflation reflects mainly
the gradually fading effects of the earlier increase
in commodity prices (see Chapter 1.3 Global
commodity markets). In particular, this concerns the
immediate environment of the Polish economy, i.e.
the euro area and Central and Eastern European
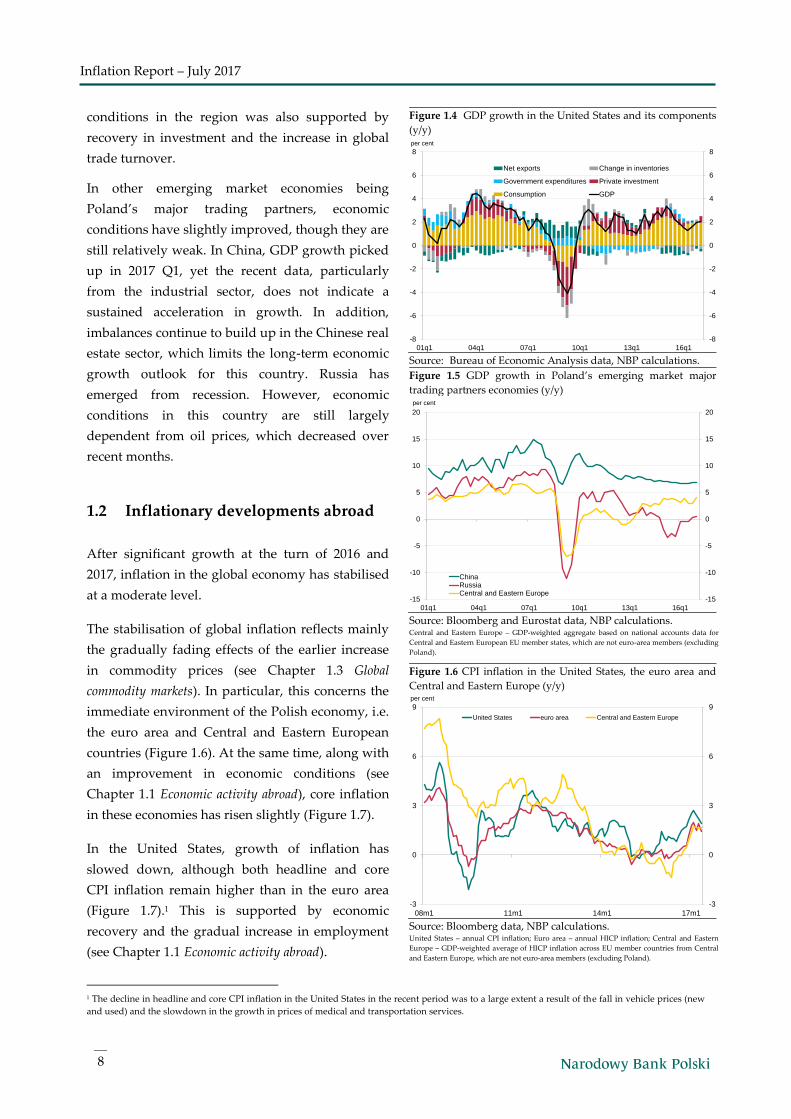
countries (Figure 1.6). At the same time, along with
an improvement in economic conditions (see
Chapter 1.1 Economic activity abroad), core inflation
in these economies has risen slightly (Figure 1.7).
In the United States, growth of inflation has
slowed down, although both headline and core
CPI inflation remain higher than in the euro area
(Figure 1.7).1 This is supported by economic
recovery and the gradual increase in employment
(see Chapter 1.1 Economic activity abroad).
Figure 1.4 GDP growth in the United States and its components
(y/y)
Source: Bureau of Economic Analysis data, NBP calculations.
Figure 1.5 GDP growth in Poland’s emerging market major
trading partners economies (y/y)
Source: Bloomberg and Eurostat data, NBP calculations. Central and Eastern Europe – GDP-weighted aggregate based on national accounts data for
Central and Eastern European EU member states, which are not euro-area members (excluding
Poland).
Figure 1.6 CPI inflation in the United States, the euro area and
Central and Eastern Europe (y/y)
Source: Bloomberg data, NBP calculations. United States – annual CPI inflation; Euro area – annual HICP inflation; Central and Eastern
Europe – GDP-weighted average of HICP inflation across EU member countries from Central
and Eastern Europe, which are not euro-area members (excluding Poland).
-8
-6
-4
-2
0
2
4
6
8
-8
-6
-4
-2
0
2
4
6
8
01q1 04q1 07q1 10q1 13q1 16q1
per cent
Net exports Change in inventories
Government expenditures Private investment
Consumption GDP
-15
-10
-5
0
5
10
15
20
-15
-10
-5
0
5
10
15
20
01q1 04q1 07q1 10q1 13q1 16q1
per cent
ChinaRussiaCentral and Eastern Europe
-3
0
3
6
9
-3
0
3
6
9
08m1 11m1 14m1 17m1
per cent
United States euro area Central and Eastern Europe
9
1. External developments
In the emerging economies, particularly in Brazil
and Russia, inflation has fallen significantly lately.
Apart from the waning effects of the earlier rise in
commodity prices, this was also caused by the
appreciation of the currencies of these countries
(see Chapter 1.5 International financial markets). In
China, in turn, inflation has risen slightly in recent
months, although it is still running below the long-
term average.
1.3 Global commodity markets
In the first half of 2017, prices of energy
commodities declined (Figure 1.8). The fall in oil
prices was driven by growing supply of this
commodity caused by an extension of the
agreement on oil production cuts by the
Organisation of Petroleum Exporting Countries
(OPEC) and a rise in shale production in the
United States. In addition, natural gas prices have
fallen due to lower demand for this commodity. At
the same time, despite a rise in production, coal
prices decreased only modestly, contained by an
upward revision in coal demand forecasts after
United States had withdrawn from the Paris
climate agreement.
Global agricultural commodity prices have
stabilised. This was due, on the one hand, to a drag
on these prices from growing supply of milk,
sugar, coffee, cocoa and orange juice, and on the
other hand, a rise in the prices of other agricultural
commodities. In particular, prices of pork have
increased considerably, triggered by growing
demand from emerging market economies amid
some improvement in economic conditions in
these countries (see Chapter 1.1 Economic activity
abroad). Wheat prices have also risen on the back of
lower wheat supply forecasts.
Figure 1.7 Core inflation indices in the United States, the euro
area and Central and Eastern Europe (y/y)
Source: Bloomberg data, NBP calculations. United States – annual CPI inflation excluding food and energy. Euro area – annual HICP
inflation excluding the prices of unprocessed food and energy. Central and Eastern Europe –
GDP-weighted average of HICP inflation excluding the prices of unprocessed food and energy
across EU member countries from Central and Eastern Europe, which are not euro-area
members (excluding Poland).
Figure 1.8 Price indices of agricultural and energy commodities
Source: Bloomberg data, NBP calculations. The agricultural commodity index comprises of prices for wheat, colza, pork, potatoes, sugar,
cocoa, coffee, skimmed milk powder, butter and frozen orange juice concentrate. Weights
reflect the consumption structure of Polish households. The energy commodity index
comprises of prices for coal, oil and gas. Weights reflect the consumption of primary energy
sources in the Polish economy.
0
1
2
3
4
5
6
0
1
2
3
4
5
6
08m1 11m1 14m1 17m1
per cent
United States euro area Central and Eastern Europe
50
100
150
200
250
300
350
50
100
150
200
250
300
350
08m1 11m1 14m1 17m1
index, Jan-07=100
Energy commoditiesAgricultural commodities
Inflation Report – July 2017
10
2 The Fed intends to introduce monthly limits on non-reinvested funds in the amount of USD 6 billion for Treasury bonds and USD 4 billion for other
securities purchased under the quantitative easing programme. Then, every three months, the Fed is to increase these limits by USD 6 billion and
USD 4 billion respectively, to USD 30 billion and USD 20 billion monthly. The FOMC expects that it will start to limit reinvestment this year. 3 From January 2015 (i.e. from the moment the extension of the asset purchase programme was announced) to March 2016, the Eurosystem were
purchasing EUR 60 billion assets per month. Then, it decided to increase the monthly rate of purchases to EUR 80 billion. Since April 2017, the
Eurosystem has again been purchasing EUR 60 billion assets monthly.
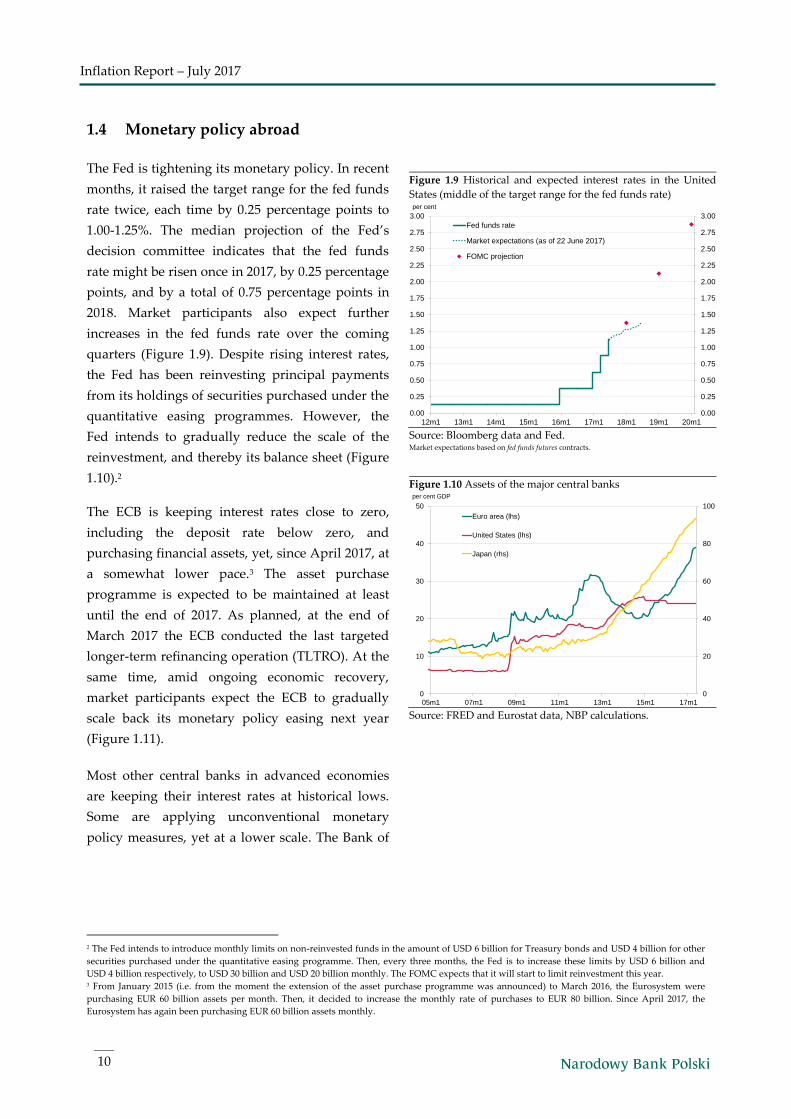
1.4 Monetary policy abroad
The Fed is tightening its monetary policy. In recent
months, it raised the target range for the fed funds
rate twice, each time by 0.25 percentage points to
1.00-1.25%. The median projection of the Fed’s
decision committee indicates that the fed funds
rate might be risen once in 2017, by 0.25 percentage
points, and by a total of 0.75 percentage points in
2018. Market participants also expect further
increases in the fed funds rate over the coming
quarters (Figure 1.9). Despite rising interest rates,
the Fed has been reinvesting principal payments
from its holdings of securities purchased under the
quantitative easing programmes. However, the
Fed intends to gradually reduce the scale of the
reinvestment, and thereby its balance sheet (Figure
1.10).2
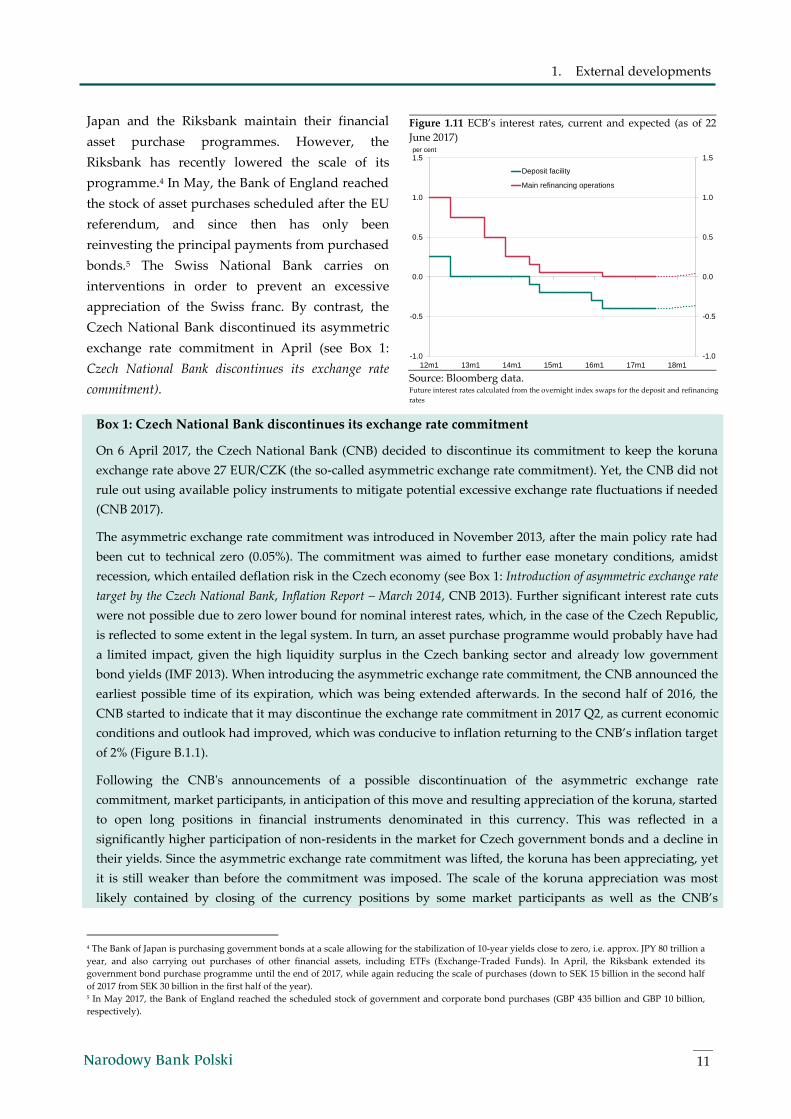
The ECB is keeping interest rates close to zero,
including the deposit rate below zero, and
purchasing financial assets, yet, since April 2017, at
a somewhat lower pace.3 The asset purchase
programme is expected to be maintained at least
until the end of 2017. As planned, at the end of
March 2017 the ECB conducted the last targeted
longer-term refinancing operation (TLTRO). At the
same time, amid ongoing economic recovery,
market participants expect the ECB to gradually
scale back its monetary policy easing next year
(Figure 1.11).
Most other central banks in advanced economies
are keeping their interest rates at historical lows.
Some are applying unconventional monetary
policy measures, yet at a lower scale. The Bank of
Figure 1.9 Historical and expected interest rates in the United
States (middle of the target range for the fed funds rate)
Source: Bloomberg data and Fed. Market expectations based on fed funds futures contracts.
Figure 1.10 Assets of the major central banks
Source: FRED and Eurostat data, NBP calculations.
0.00
0.25
0.50
0.75
1.00
1.25
1.50
1.75
2.00
2.25
2.50
2.75
3.00
0.00
0.25
0.50
0.75
1.00
1.25
1.50
1.75
2.00
2.25
2.50
2.75
3.00
12m1 13m1 14m1 15m1 16m1 17m1 18m1 19m1 20m1
Fed funds rate
Market expectations (as of 22 June 2017)
FOMC projection
per cent
0
20
40
60
80
100
0
10
20
30
40
50
05m1 07m1 09m1 11m1 13m1 15m1 17m1
Euro area (lhs)
United States (lhs)
Japan (rhs)
per cent GDP
11
1. External developments
4 The Bank of Japan is purchasing government bonds at a scale allowing for the stabilization of 10-year yields close to zero, i.e. approx. JPY 80 trillion a
year, and also carrying out purchases of other financial assets, including ETFs (Exchange-Traded Funds). In April, the Riksbank extended its
government bond purchase programme until the end of 2017, while again reducing the scale of purchases (down to SEK 15 billion in the second half
of 2017 from SEK 30 billion in the first half of the year). 5 In May 2017, the Bank of England reached the scheduled stock of government and corporate bond purchases (GBP 435 billion and GBP 10 billion,
respectively).
Japan and the Riksbank maintain their financial
asset purchase programmes. However, the
Riksbank has recently lowered the scale of its
programme.4 In May, the Bank of England reached
the stock of asset purchases scheduled after the EU
referendum, and since then has only been
reinvesting the principal payments from purchased
bonds.5 The Swiss National Bank carries on
interventions in order to prevent an excessive
appreciation of the Swiss franc. By contrast, the
Czech National Bank discontinued its asymmetric
exchange rate commitment in April (see Box 1:
Czech National Bank discontinues its exchange rate
commitment).
Figure 1.11 ECB’s interest rates, current and expected (as of 22
June 2017)
Source: Bloomberg data. Future interest rates calculated from the overnight index swaps for the deposit and refinancing
rates
Box 1: Czech National Bank discontinues its exchange rate commitment
On 6 April 2017, the Czech National Bank (CNB) decided to discontinue its commitment to keep the koruna
exchange rate above 27 EUR/CZK (the so-called asymmetric exchange rate commitment). Yet, the CNB did not
rule out using available policy instruments to mitigate potential excessive exchange rate fluctuations if needed
(CNB 2017).
The asymmetric exchange rate commitment was introduced in November 2013, after the main policy rate had
been cut to technical zero (0.05%). The commitment was aimed to further ease monetary conditions, amidst
recession, which entailed deflation risk in the Czech economy (see Box 1: Introduction of asymmetric exchange rate
target by the Czech National Bank, Inflation Report – March 2014, CNB 2013). Further significant interest rate cuts
were not possible due to zero lower bound for nominal interest rates, which, in the case of the Czech Republic,
is reflected to some extent in the legal system. In turn, an asset purchase programme would probably have had
a limited impact, given the high liquidity surplus in the Czech banking sector and already low government
bond yields (IMF 2013). When introducing the asymmetric exchange rate commitment, the CNB announced the
earliest possible time of its expiration, which was being extended afterwards. In the second half of 2016, the
CNB started to indicate that it may discontinue the exchange rate commitment in 2017 Q2, as current economic
conditions and outlook had improved, which was conducive to inflation returning to the CNB’s inflation target
of 2% (Figure B.1.1).
Following the CNB's announcements of a possible discontinuation of the asymmetric exchange rate
commitment, market participants, in anticipation of this move and resulting appreciation of the koruna, started
to open long positions in financial instruments denominated in this currency. This was reflected in a
significantly higher participation of non-residents in the market for Czech government bonds and a decline in
their yields. Since the asymmetric exchange rate commitment was lifted, the koruna has been appreciating, yet
it is still weaker than before the commitment was imposed. The scale of the koruna appreciation was most
likely contained by closing of the currency positions by some market participants as well as the CNB’s
-1.0
-0.5
0.0
0.5
1.0
1.5
-1.0
-0.5
0.0
0.5
1.0
1.5
12m1 13m1 14m1 15m1 16m1 17m1 18m1
Deposit facility
Main refinancing operations
per cent
Inflation Report – July 2017
12
6 This is related to the high degree of openness of the Czech economy. In the Czech Republic, the sum of exports and imports amounts to 153% of
GDP, compared with 84% of GDP in the entire European Union. 7 In the Czech Republic, in 2002-2012, 84% of the variation in the annual growth rate in import prices was explained by the annual growth rate in PPI
in the euro area and the EUR/CZK exchange rate. Between October and December 2013, the annual EUR/CZK growth rate increased by 6.3 percentage
points, while import price growth rate picked up by 5.5 percentage points. This compares with the rise of PPI inflation in the euro area by a mere 0.5
percentage points. 8 It has to be noted that the difference in price growth between the Czech Republic and the euro area was contained by the changes in the
administered prices and taxes, whose joint impact on the consumer prices in the Czech Republic in 2014-2015 was negative at 0.6 percentage points. 9 The overall value of foreign exchange interventions in this period amounted to EUR 75.2 billion. The remaining growth in the reserve assets resulted
from other currency operations.
communication signalling the possibility to use measures mitigating potential excessive exchange rate
fluctuations.
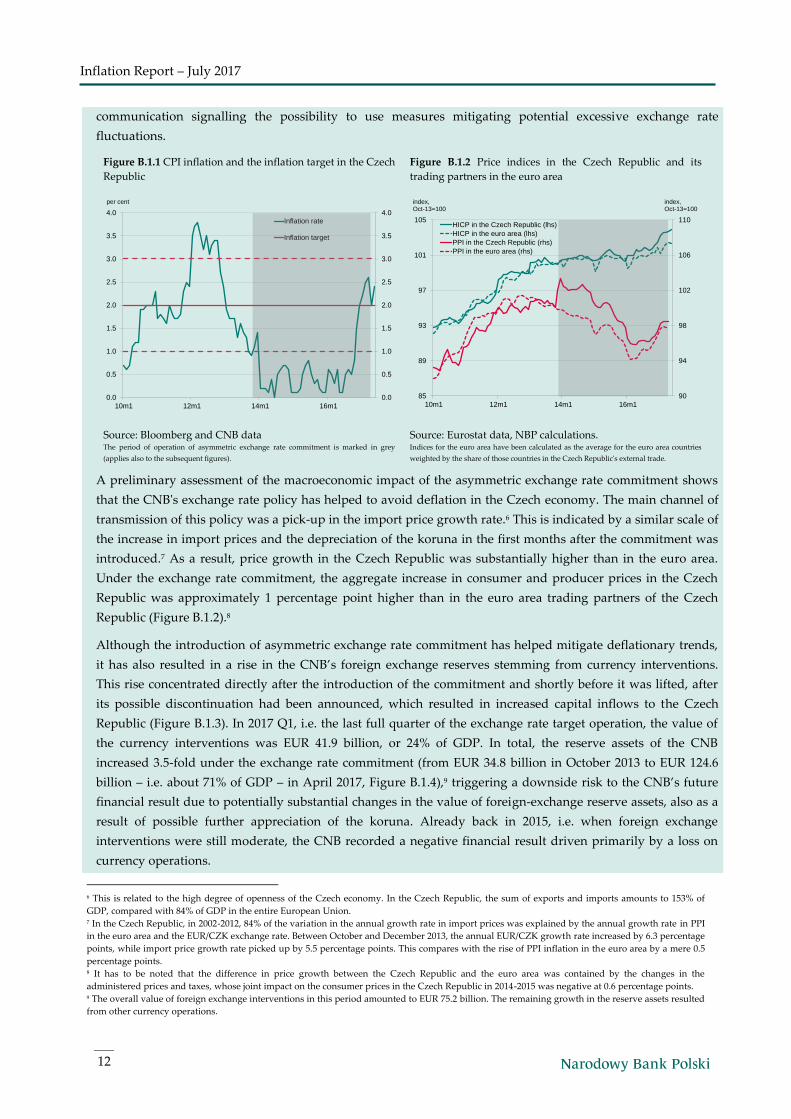
Figure B.1.1 CPI inflation and the inflation target in the Czech
Republic
Figure B.1.2 Price indices in the Czech Republic and its
trading partners in the euro area
Source: Bloomberg and CNB data The period of operation of asymmetric exchange rate commitment is marked in grey
(applies also to the subsequent figures).
Source: Eurostat data, NBP calculations. Indices for the euro area have been calculated as the average for the euro area countries
weighted by the share of those countries in the Czech Republic's external trade.
A preliminary assessment of the macroeconomic impact of the asymmetric exchange rate commitment shows
that the CNB's exchange rate policy has helped to avoid deflation in the Czech economy. The main channel of
transmission of this policy was a pick-up in the import price growth rate.6 This is indicated by a similar scale of
the increase in import prices and the depreciation of the koruna in the first months after the commitment was
introduced.7 As a result, price growth in the Czech Republic was substantially higher than in the euro area.
Under the exchange rate commitment, the aggregate increase in consumer and producer prices in the Czech
Republic was approximately 1 percentage point higher than in the euro area trading partners of the Czech
Republic (Figure B.1.2).8
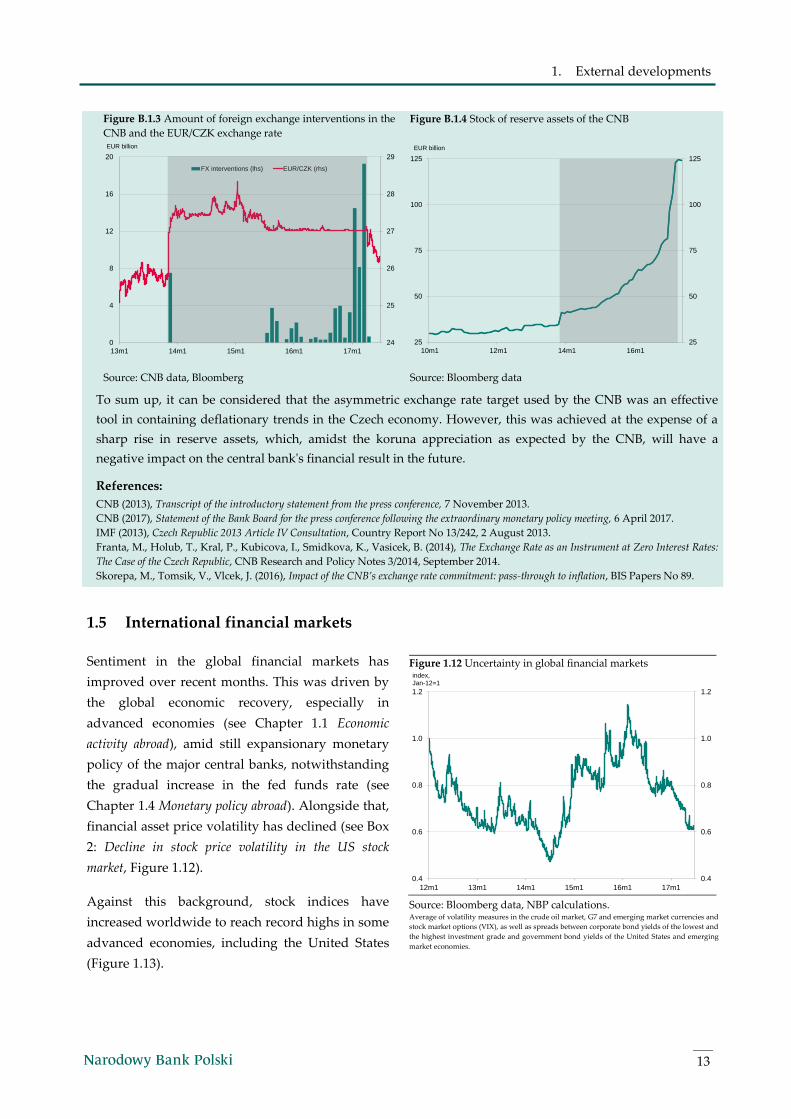
Although the introduction of asymmetric exchange rate commitment has helped mitigate deflationary trends,
it has also resulted in a rise in the CNB’s foreign exchange reserves stemming from currency interventions.
This rise concentrated directly after the introduction of the commitment and shortly before it was lifted, after
its possible discontinuation had been announced, which resulted in increased capital inflows to the Czech
Republic (Figure B.1.3). In 2017 Q1, i.e. the last full quarter of the exchange rate target operation, the value of
the currency interventions was EUR 41.9 billion, or 24% of GDP. In total, the reserve assets of the CNB
increased 3.5-fold under the exchange rate commitment (from EUR 34.8 billion in October 2013 to EUR 124.6
billion – i.e. about 71% of GDP – in April 2017, Figure B.1.4),9 triggering a downside risk to the CNB’s future
financial result due to potentially substantial changes in the value of foreign-exchange reserve assets, also as a
result of possible further appreciation of the koruna. Already back in 2015, i.e. when foreign exchange
interventions were still moderate, the CNB recorded a negative financial result driven primarily by a loss on
currency operations.
0.0
0.5
1.0
1.5
2.0
2.5
3.0
3.5
4.0
0.0
0.5
1.0
1.5
2.0
2.5
3.0
3.5
4.0
10m1 12m1 14m1 16m1
Inflation rate
Inflation target
per cent
90
94
98
102
106
110
85
89
93
97
101
105
10m1 12m1 14m1 16m1
HICP in the Czech Republic (lhs)
HICP in the euro area (lhs)
PPI in the Czech Republic (rhs)
PPI in the euro area (rhs)
index,Oct-13=100
index,Oct-13=100
13
1. External developments
Figure B.1.3 Amount of foreign exchange interventions in the
CNB and the EUR/CZK exchange rate
Figure B.1.4 Stock of reserve assets of the CNB
Source: CNB data, Bloomberg Source: Bloomberg data
To sum up, it can be considered that the asymmetric exchange rate target used by the CNB was an effective
tool in containing deflationary trends in the Czech economy. However, this was achieved at the expense of a
sharp rise in reserve assets, which, amidst the koruna appreciation as expected by the CNB, will have a
negative impact on the central bank's financial result in the future.
References:
CNB (2013), Transcript of the introductory statement from the press conference, 7 November 2013.
CNB (2017), Statement of the Bank Board for the press conference following the extraordinary monetary policy meeting, 6 April 2017.
IMF (2013), Czech Republic 2013 Article IV Consultation, Country Report No 13/242, 2 August 2013.
Franta, M., Holub, T., Kral, P., Kubicova, I., Smidkova, K., Vasicek, B. (2014), The Exchange Rate as an Instrument at Zero Interest Rates:
The Case of the Czech Republic, CNB Research and Policy Notes 3/2014, September 2014.
Skorepa, M., Tomsik, V., Vlcek, J. (2016), Impact of the CNB’s exchange rate commitment: pass-through to inflation, BIS Papers No 89.
1.5 International financial markets
Sentiment in the global financial markets has
improved over recent months. This was driven by
the global economic recovery, especially in
advanced economies (see Chapter 1.1 Economic
activity abroad), amid still expansionary monetary
policy of the major central banks, notwithstanding
the gradual increase in the fed funds rate (see
Chapter 1.4 Monetary policy abroad). Alongside that,
financial asset price volatility has declined (see Box
2: Decline in stock price volatility in the US stock
market, Figure 1.12).
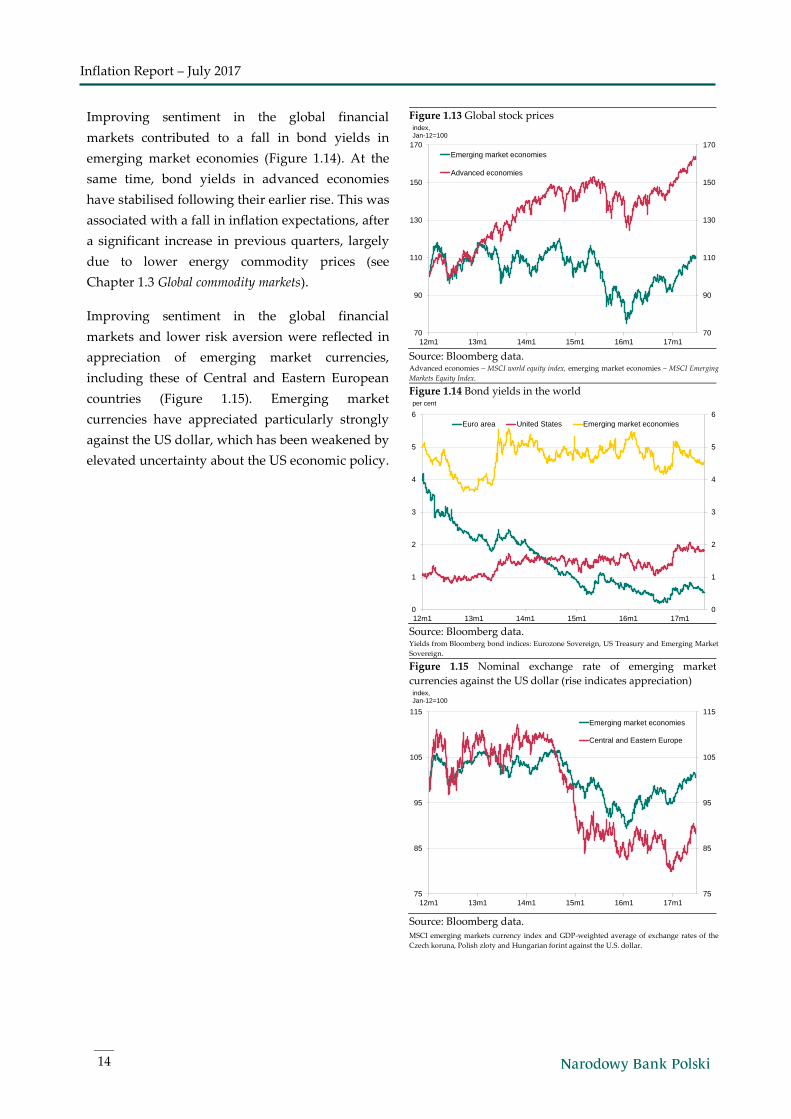
Against this background, stock indices have
increased worldwide to reach record highs in some
advanced economies, including the United States
(Figure 1.13).
Figure 1.12 Uncertainty in global financial markets
Source: Bloomberg data, NBP calculations. Average of volatility measures in the crude oil market, G7 and emerging market currencies and
stock market options (VIX), as well as spreads between corporate bond yields of the lowest and
the highest investment grade and government bond yields of the United States and emerging
market economies.
24
25
26
27
28
29
0
4
8
12
16
20
13m1 14m1 15m1 16m1 17m1
FX interventions (lhs) EUR/CZK (rhs)
EUR billion
25
50
75
100
125
25
50
75
100
125
10m1 12m1 14m1 16m1
EUR billion
0.4
0.6
0.8
1.0
1.2
0.4
0.6
0.8
1.0
1.2
12m1 13m1 14m1 15m1 16m1 17m1
index, Jan-12=1
Inflation Report – July 2017
14
Improving sentiment in the global financial
markets contributed to a fall in bond yields in
emerging market economies (Figure 1.14). At the
same time, bond yields in advanced economies
have stabilised following their earlier rise. This was
associated with a fall in inflation expectations, after
a significant increase in previous quarters, largely
due to lower energy commodity prices (see
Chapter 1.3 Global commodity markets).
Improving sentiment in the global financial
markets and lower risk aversion were reflected in
appreciation of emerging market currencies,
including these of Central and Eastern European
countries (Figure 1.15). Emerging market
currencies have appreciated particularly strongly
against the US dollar, which has been weakened by
elevated uncertainty about the US economic policy.
Figure 1.13 Global stock prices
Source: Bloomberg data. Advanced economies – MSCI world equity index, emerging market economies – MSCI Emerging
Markets Equity Index.
Figure 1.14 Bond yields in the world
Source: Bloomberg data. Yields from Bloomberg bond indices: Eurozone Sovereign, US Treasury and Emerging Market
Sovereign.
Figure 1.15 Nominal exchange rate of emerging market
currencies against the US dollar (rise indicates appreciation)
Source: Bloomberg data. MSCI emerging markets currency index and GDP-weighted average of exchange rates of the
Czech koruna, Polish zloty and Hungarian forint against the U.S. dollar.
70
90
110
130
150
170
70
90
110
130
150
170
12m1 13m1 14m1 15m1 16m1 17m1
Emerging market economies
Advanced economies
index,Jan-12=100
0
1
2
3
4
5
6
0
1
2
3
4
5
6
12m1 13m1 14m1 15m1 16m1 17m1
Euro area United States Emerging market economies
per cent
75
85
95
105
115
75
85
95
105
115
12m1 13m1 14m1 15m1 16m1 17m1
Emerging market economies
Central and Eastern Europe
index,Jan-12=100
15
1. External developments
10 See e.g. Minutes of the FOMC meeting held on 14-15 March 2017. 11 Technically, the VIX expresses the expected value of the annualised standard deviation of daily returns of the S&P 500.
Box 2: Decline in stock price volatility in the US stock market
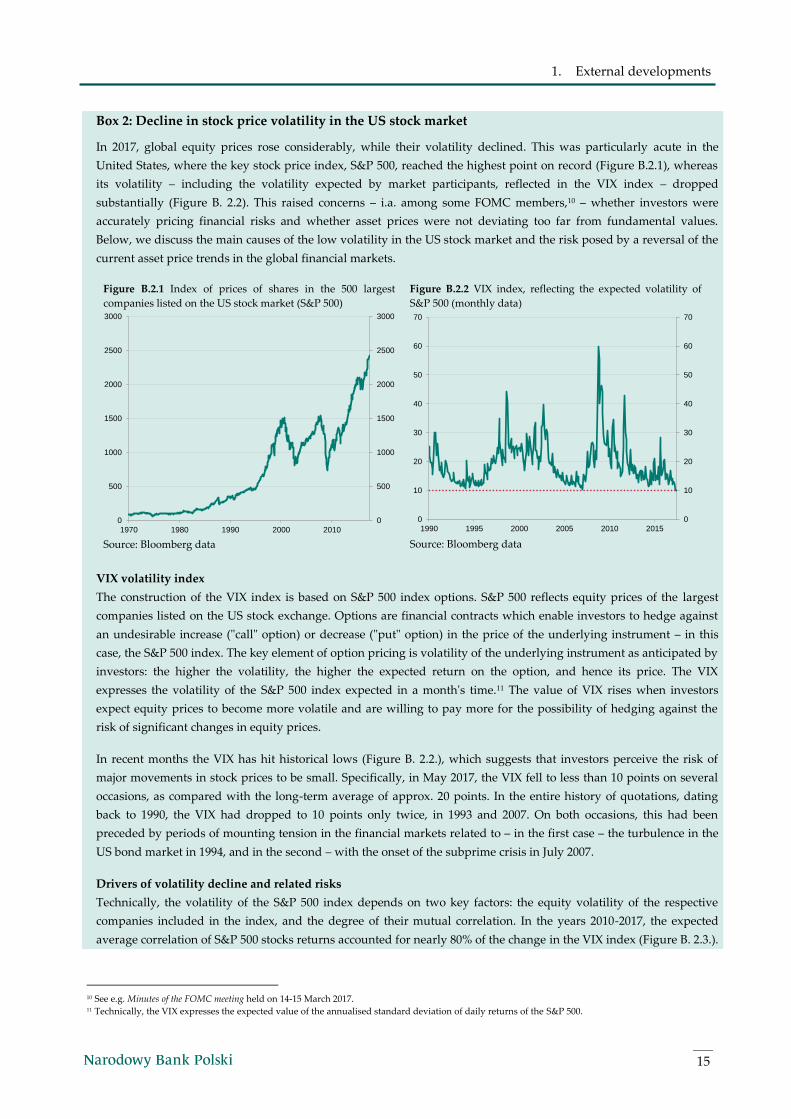
In 2017, global equity prices rose considerably, while their volatility declined. This was particularly acute in the
United States, where the key stock price index, S&P 500, reached the highest point on record (Figure B.2.1), whereas
its volatility – including the volatility expected by market participants, reflected in the VIX index – dropped
substantially (Figure B. 2.2). This raised concerns – i.a. among some FOMC members,10 – whether investors were
accurately pricing financial risks and whether asset prices were not deviating too far from fundamental values.
Below, we discuss the main causes of the low volatility in the US stock market and the risk posed by a reversal of the
current asset price trends in the global financial markets.
Figure B.2.1 Index of prices of shares in the 500 largest
companies listed on the US stock market (S&P 500)
Source: Bloomberg data
Figure B.2.2 VIX index, reflecting the expected volatility of
S&P 500 (monthly data)
Source: Bloomberg data
VIX volatility index
The construction of the VIX index is based on S&P 500 index options. S&P 500 reflects equity prices of the largest
companies listed on the US stock exchange. Options are financial contracts which enable investors to hedge against
an undesirable increase ("call" option) or decrease ("put" option) in the price of the underlying instrument – in this
case, the S&P 500 index. The key element of option pricing is volatility of the underlying instrument as anticipated by
investors: the higher the volatility, the higher the expected return on the option, and hence its price. The VIX
expresses the volatility of the S&P 500 index expected in a month's time.11 The value of VIX rises when investors
expect equity prices to become more volatile and are willing to pay more for the possibility of hedging against the
risk of significant changes in equity prices.
In recent months the VIX has hit historical lows (Figure B. 2.2.), which suggests that investors perceive the risk of
major movements in stock prices to be small. Specifically, in May 2017, the VIX fell to less than 10 points on several
occasions, as compared with the long-term average of approx. 20 points. In the entire history of quotations, dating
back to 1990, the VIX had dropped to 10 points only twice, in 1993 and 2007. On both occasions, this had been
preceded by periods of mounting tension in the financial markets related to – in the first case – the turbulence in the
US bond market in 1994, and in the second – with the onset of the subprime crisis in July 2007.
Drivers of volatility decline and related risks
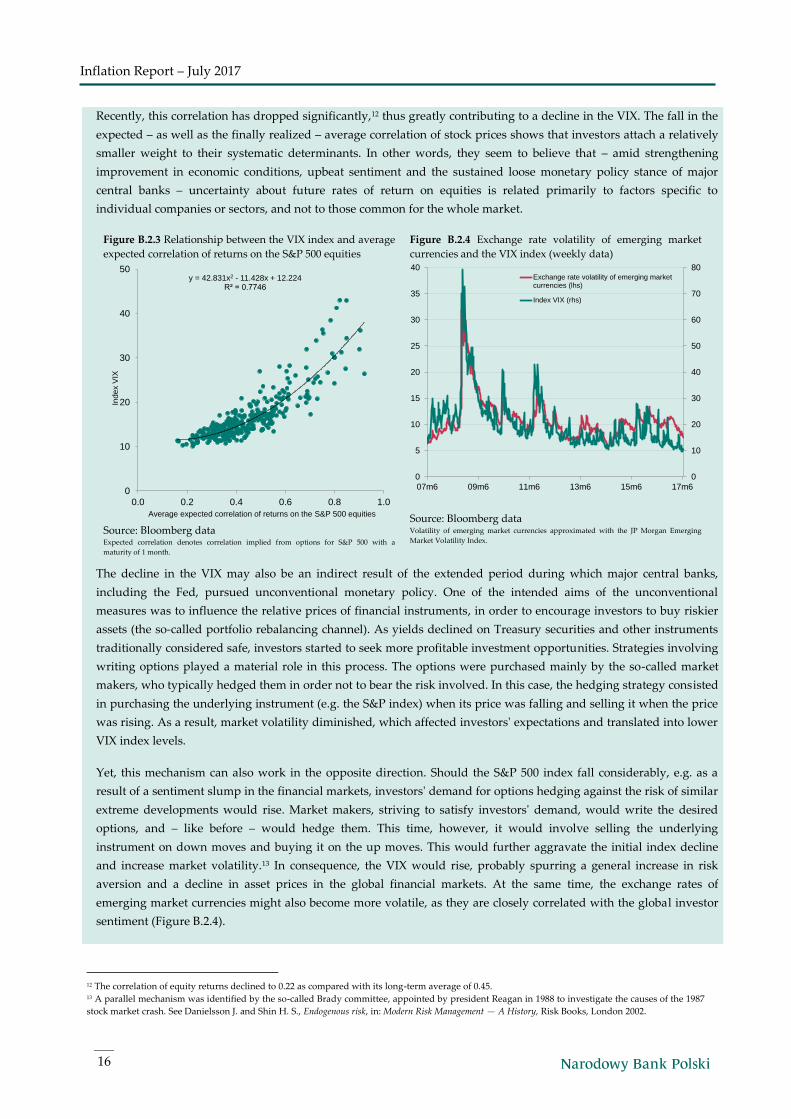
Technically, the volatility of the S&P 500 index depends on two key factors: the equity volatility of the respective
companies included in the index, and the degree of their mutual correlation. In the years 2010-2017, the expected
average correlation of S&P 500 stocks returns accounted for nearly 80% of the change in the VIX index (Figure B. 2.3.).
0
500
1000
1500
2000
2500
3000
0
500
1000
1500
2000
2500
3000
1970 1980 1990 2000 2010
0
10
20
30
40
50
60
70
0
10
20
30
40
50
60
70
1990 1995 2000 2005 2010 2015
Inflation Report – July 2017
16
12 The correlation of equity returns declined to 0.22 as compared with its long-term average of 0.45. 13 A parallel mechanism was identified by the so-called Brady committee, appointed by president Reagan in 1988 to investigate the causes of the 1987
stock market crash. See Danielsson J. and Shin H. S., Endogenous risk, in: Modern Risk Management — A History, Risk Books, London 2002.
Recently, this correlation has dropped significantly,12 thus greatly contributing to a decline in the VIX. The fall in the
expected – as well as the finally realized – average correlation of stock prices shows that investors attach a relatively
smaller weight to their systematic determinants. In other words, they seem to believe that – amid strengthening
improvement in economic conditions, upbeat sentiment and the sustained loose monetary policy stance of major
central banks – uncertainty about future rates of return on equities is related primarily to factors specific to
individual companies or sectors, and not to those common for the whole market.
Figure B.2.3 Relationship between the VIX index and average
expected correlation of returns on the S&P 500 equities
Source: Bloomberg data Expected correlation denotes correlation implied from options for S&P 500 with a
maturity of 1 month.
Figure B.2.4 Exchange rate volatility of emerging market
currencies and the VIX index (weekly data)
Source: Bloomberg data Volatility of emerging market currencies approximated with the JP Morgan Emerging
Market Volatility Index.
The decline in the VIX may also be an indirect result of the extended period during which major central banks,
including the Fed, pursued unconventional monetary policy. One of the intended aims of the unconventional
measures was to influence the relative prices of financial instruments, in order to encourage investors to buy riskier
assets (the so-called portfolio rebalancing channel). As yields declined on Treasury securities and other instruments
traditionally considered safe, investors started to seek more profitable investment opportunities. Strategies involving
writing options played a material role in this process. The options were purchased mainly by the so-called market
makers, who typically hedged them in order not to bear the risk involved. In this case, the hedging strategy consisted
in purchasing the underlying instrument (e.g. the S&P index) when its price was falling and selling it when the price
was rising. As a result, market volatility diminished, which affected investors' expectations and translated into lower
VIX index levels.
Yet, this mechanism can also work in the opposite direction. Should the S&P 500 index fall considerably, e.g. as a
result of a sentiment slump in the financial markets, investors' demand for options hedging against the risk of similar
extreme developments would rise. Market makers, striving to satisfy investors' demand, would write the desired
options, and – like before – would hedge them. This time, however, it would involve selling the underlying
instrument on down moves and buying it on the up moves. This would further aggravate the initial index decline
and increase market volatility.13 In consequence, the VIX would rise, probably spurring a general increase in risk
aversion and a decline in asset prices in the global financial markets. At the same time, the exchange rates of
emerging market currencies might also become more volatile, as they are closely correlated with the global investor
sentiment (Figure B.2.4).
y = 42.831x2 - 11.428x + 12.224R² = 0.7746
0
10
20
30
40
50
0.0 0.2 0.4 0.6 0.8 1.0
Average expected correlation of returns on the S&P 500 equities
Ind
ex
VIX
0
10
20
30
40
50
60
70
80
0
5
10
15
20
25
30
35
40
07m6 09m6 11m6 13m6 15m6 17m6
Exchange rate volatility of emerging marketcurrencies (lhs)
Index VIX (rhs)
17
1. External developments
To sum up, recent months’ decline in stock price volatility to the lowest levels on record reflects very strong
investors’ sentiment and high propensity to bear risks. This is related to improved global business conditions, amid
the still very loose monetary conditions across the world. Low volatility may also partially result from the strategies
applied by investors and market makers, which enhance shocks in the financial markets. In these circumstances, a
sharp decline in stock prices might significantly boost volatility and dampen the sentiment in the global financial
markets. For this reason, trends in the US stock markets will probably play an important part when deciding about
the pace of a further monetary policy tightening in the United States.

Inflation Report – July 2017
18
2. Domestic economy
19
Domestic economy 2
14 According to CPI flash estimate, which was published after the cut-off date for this Report, annual CPI inflation in June 2017 stood at 1.5% against
1.9% a month before. The final June inflation data, along with the decomposition, will be released on 11 July 2017. 15 In 2017, the annual growth in the prices of services was also fuelled by statistical effects, including the positive base effect connected with a decline
in the radio and television fees in March and April 2016.
2.1 Consumer prices
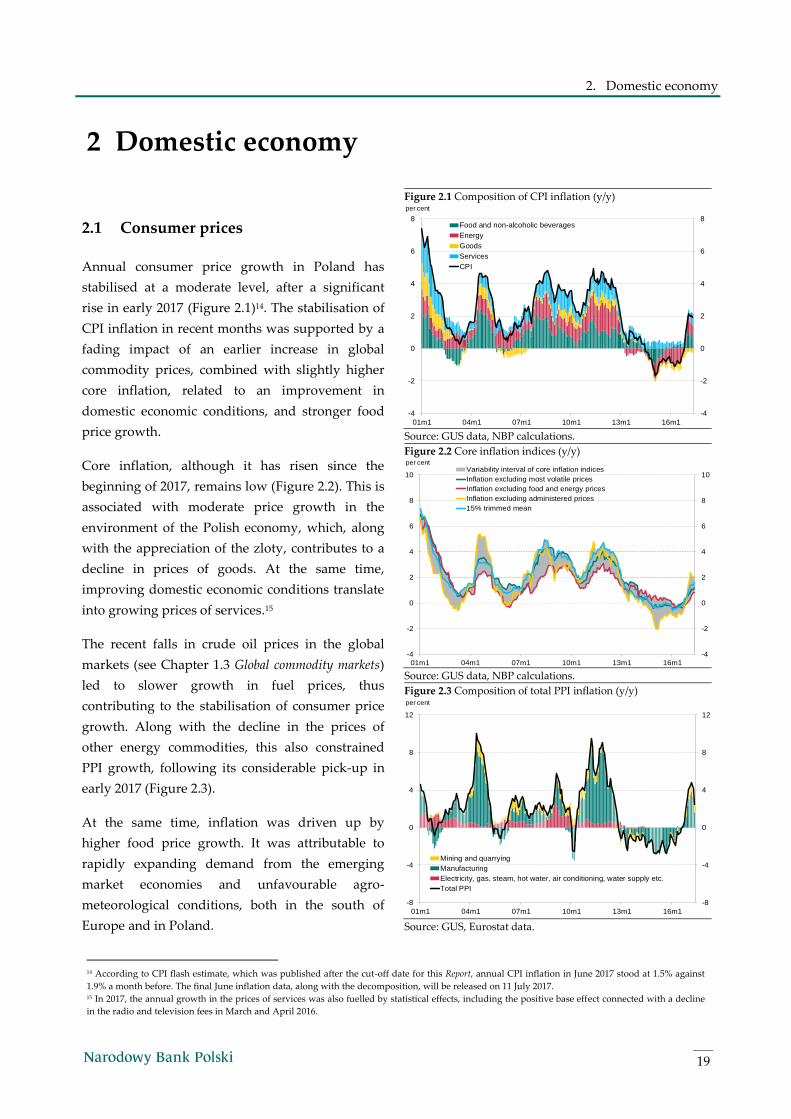
Annual consumer price growth in Poland has
stabilised at a moderate level, after a significant
rise in early 2017 (Figure 2.1)14. The stabilisation of
CPI inflation in recent months was supported by a
fading impact of an earlier increase in global
commodity prices, combined with slightly higher
core inflation, related to an improvement in
domestic economic conditions, and stronger food
price growth.
Core inflation, although it has risen since the
beginning of 2017, remains low (Figure 2.2). This is
associated with moderate price growth in the
environment of the Polish economy, which, along
with the appreciation of the zloty, contributes to a
decline in prices of goods. At the same time,
improving domestic economic conditions translate
into growing prices of services.15
The recent falls in crude oil prices in the global
markets (see Chapter 1.3 Global commodity markets)
led to slower growth in fuel prices, thus
contributing to the stabilisation of consumer price
growth. Along with the decline in the prices of
other energy commodities, this also constrained
PPI growth, following its considerable pick-up in
early 2017 (Figure 2.3).
At the same time, inflation was driven up by
higher food price growth. It was attributable to
rapidly expanding demand from the emerging
market economies and unfavourable agro-
meteorological conditions, both in the south of
Europe and in Poland.
Figure 2.1 Composition of CPI inflation (y/y)
Source: GUS data, NBP calculations.
Figure 2.2 Core inflation indices (y/y)
Source: GUS data, NBP calculations.
Figure 2.3 Composition of total PPI inflation (y/y)
Source: GUS, Eurostat data.
-4
-2
0
2
4
6
8
-4
-2
0
2
4
6
8
01m1 04m1 07m1 10m1 13m1 16m1
per cent
Food and non-alcoholic beverages
Energy
Goods
Services
CPI
-4
-2
0
2
4
6
8
10
-4
-2
0
2
4
6
8
10
01m1 04m1 07m1 10m1 13m1 16m1
per centVariability interval of core inflation indices
Inflation excluding most volatile prices
Inflation excluding food and energy prices
Inflation excluding administered prices
15% trimmed mean
-8
-4
0
4
8
12
-8
-4
0
4
8
12
01m1 04m1 07m1 10m1 13m1 16m1
per cent
Mining and quarrying
Manufacturing
Electricity, gas, steam, hot water, air conditioning, water supply etc.
Total PPI
Inflation Report – July 2017
20
16 In 2016 Q4, payments of child benefits increased the growth rate of household disposable income by 2.1 percentage points (see Sytuacja finansowa
sektora gospodarstw domowych w IV kw. 2016, NBP, June 2017, not available in English).
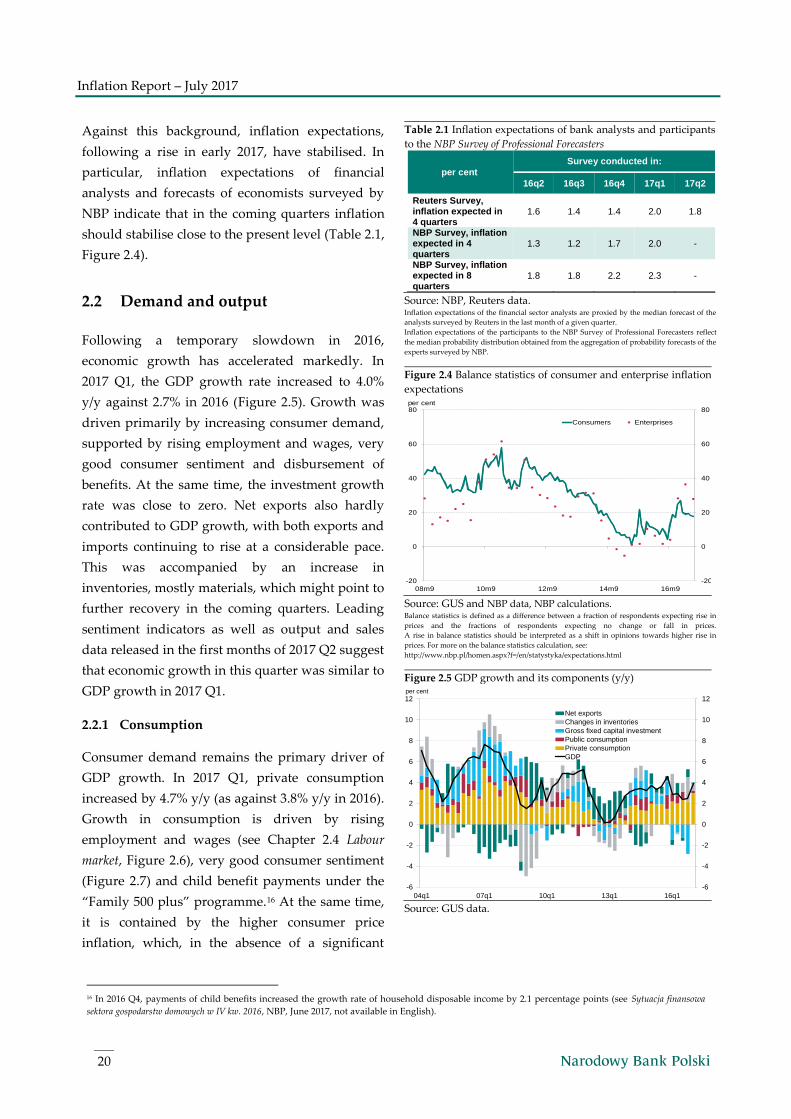
Against this background, inflation expectations,
following a rise in early 2017, have stabilised. In
particular, inflation expectations of financial
analysts and forecasts of economists surveyed by
NBP indicate that in the coming quarters inflation
should stabilise close to the present level (Table 2.1,
Figure 2.4).
2.2 Demand and output
Following a temporary slowdown in 2016,
economic growth has accelerated markedly. In
2017 Q1, the GDP growth rate increased to 4.0%
y/y against 2.7% in 2016 (Figure 2.5). Growth was
driven primarily by increasing consumer demand,
supported by rising employment and wages, very
good consumer sentiment and disbursement of
benefits. At the same time, the investment growth
rate was close to zero. Net exports also hardly
contributed to GDP growth, with both exports and
imports continuing to rise at a considerable pace.
This was accompanied by an increase in
inventories, mostly materials, which might point to
further recovery in the coming quarters. Leading
sentiment indicators as well as output and sales
data released in the first months of 2017 Q2 suggest
that economic growth in this quarter was similar to
GDP growth in 2017 Q1.
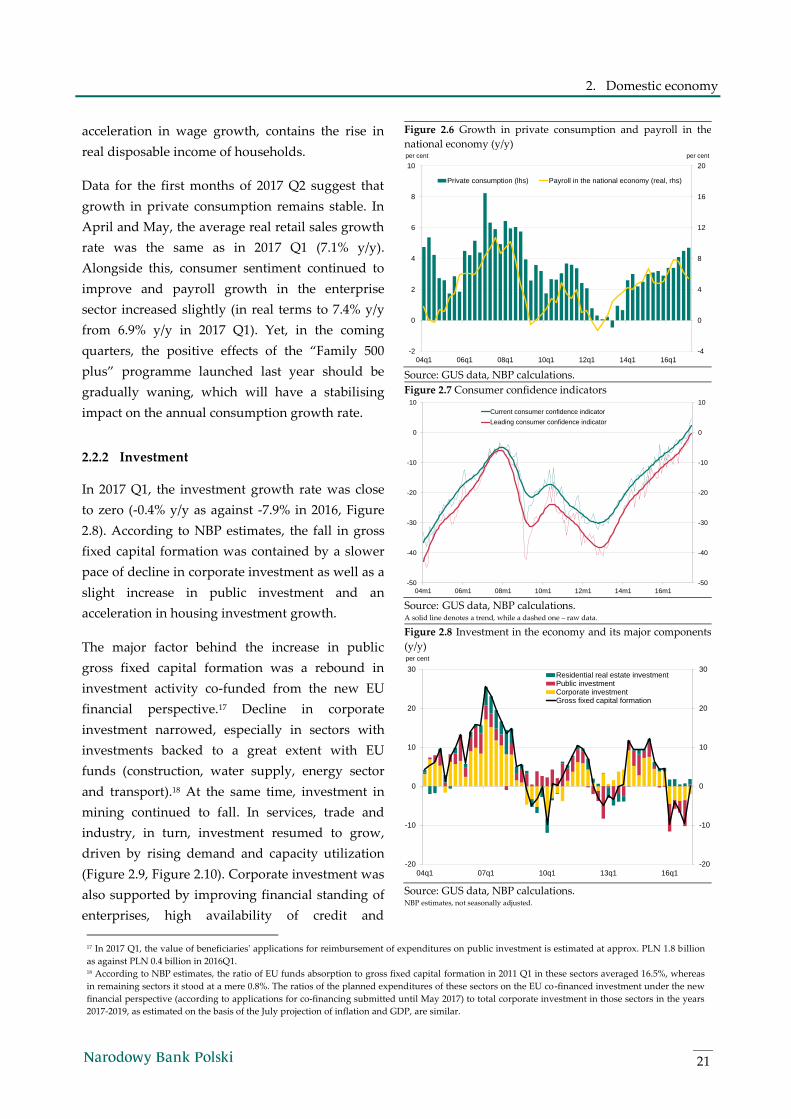
2.2.1 Consumption
Consumer demand remains the primary driver of
GDP growth. In 2017 Q1, private consumption
increased by 4.7% y/y (as against 3.8% y/y in 2016).
Growth in consumption is driven by rising
employment and wages (see Chapter 2.4 Labour
market, Figure 2.6), very good consumer sentiment
(Figure 2.7) and child benefit payments under the
“Family 500 plus” programme.16 At the same time,
it is contained by the higher consumer price
inflation, which, in the absence of a significant
Table 2.1 Inflation expectations of bank analysts and participants
to the NBP Survey of Professional Forecasters
per cent
Survey conducted in:
16q2 16q3 16q4 17q1 17q2
Reuters Survey, inflation expected in 4 quarters
1.6 1.4 1.4 2.0 1.8
NBP Survey, inflation expected in 4 quarters
1.3 1.2 1.7 2.0 -
NBP Survey, inflation expected in 8 quarters
1.8 1.8 2.2 2.3 -
Source: NBP, Reuters data. Inflation expectations of the financial sector analysts are proxied by the median forecast of the
analysts surveyed by Reuters in the last month of a given quarter.
Inflation expectations of the participants to the NBP Survey of Professional Forecasters reflect
the median probability distribution obtained from the aggregation of probability forecasts of the
experts surveyed by NBP.
Figure 2.4 Balance statistics of consumer and enterprise inflation
expectations
Source: GUS and NBP data, NBP calculations. Balance statistics is defined as a difference between a fraction of respondents expecting rise in
prices and the fractions of respondents expecting no change or fall in prices.
A rise in balance statistics should be interpreted as a shift in opinions towards higher rise in
prices. For more on the balance statistics calculation, see:
http://www.nbp.pl/homen.aspx?f=/en/statystyka/expectations.html
Figure 2.5 GDP growth and its components (y/y)
Source: GUS data.
-20
0
20
40
60
80
-20
0
20
40
60
80
08m9 10m9 12m9 14m9 16m9
Consumers Enterprises
per cent
-6
-4
-2
0
2
4
6
8
10
12
-6
-4
-2
0
2
4
6
8
10
12
04q1 07q1 10q1 13q1 16q1
per cent
Net exports
Changes in inventories
Gross fixed capital investment
Public consumption
Private consumption
GDP
2. Domestic economy
21
17 In 2017 Q1, the value of beneficiaries' applications for reimbursement of expenditures on public investment is estimated at approx. PLN 1.8 billion
as against PLN 0.4 billion in 2016Q1. 18 According to NBP estimates, the ratio of EU funds absorption to gross fixed capital formation in 2011 Q1 in these sectors averaged 16.5%, whereas
in remaining sectors it stood at a mere 0.8%. The ratios of the planned expenditures of these sectors on the EU co-financed investment under the new
financial perspective (according to applications for co-financing submitted until May 2017) to total corporate investment in those sectors in the years
2017-2019, as estimated on the basis of the July projection of inflation and GDP, are similar.
acceleration in wage growth, contains the rise in
real disposable income of households.
Data for the first months of 2017 Q2 suggest that
growth in private consumption remains stable. In
April and May, the average real retail sales growth
rate was the same as in 2017 Q1 (7.1% y/y).
Alongside this, consumer sentiment continued to
improve and payroll growth in the enterprise
sector increased slightly (in real terms to 7.4% y/y
from 6.9% y/y in 2017 Q1). Yet, in the coming
quarters, the positive effects of the “Family 500
plus” programme launched last year should be
gradually waning, which will have a stabilising
impact on the annual consumption growth rate.
2.2.2 Investment
In 2017 Q1, the investment growth rate was close
to zero (-0.4% y/y as against -7.9% in 2016, Figure
2.8). According to NBP estimates, the fall in gross
fixed capital formation was contained by a slower
pace of decline in corporate investment as well as a
slight increase in public investment and an
acceleration in housing investment growth.
The major factor behind the increase in public
gross fixed capital formation was a rebound in
investment activity co-funded from the new EU
financial perspective.17 Decline in corporate
investment narrowed, especially in sectors with
investments backed to a great extent with EU
funds (construction, water supply, energy sector
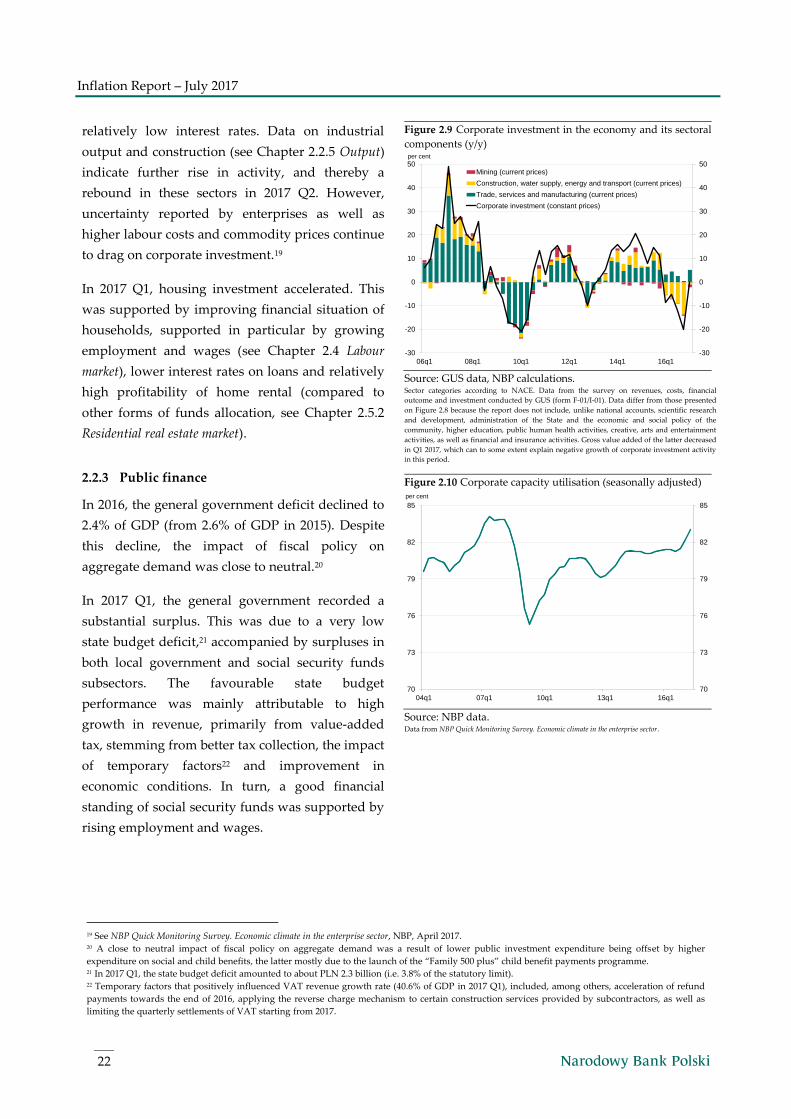
and transport).18 At the same time, investment in
mining continued to fall. In services, trade and
industry, in turn, investment resumed to grow,
driven by rising demand and capacity utilization
(Figure 2.9, Figure 2.10). Corporate investment was
also supported by improving financial standing of
enterprises, high availability of credit and
Figure 2.6 Growth in private consumption and payroll in the
national economy (y/y)
Source: GUS data, NBP calculations.
Figure 2.7 Consumer confidence indicators
Source: GUS data, NBP calculations. A solid line denotes a trend, while a dashed one – raw data.
Figure 2.8 Investment in the economy and its major components
(y/y)
Source: GUS data, NBP calculations. NBP estimates, not seasonally adjusted.
-4
0
4
8
12
16
20
-2
0
2
4
6
8
10
04q1 06q1 08q1 10q1 12q1 14q1 16q1
per centper cent
Private consumption (lhs) Payroll in the national economy (real, rhs)
-50
-40
-30
-20
-10
0
10
-50
-40
-30
-20
-10
0
10
04m1 06m1 08m1 10m1 12m1 14m1 16m1
Current consumer confidence indicator
Leading consumer confidence indicator
-20
-10
0
10
20
30
-20
-10
0
10
20
30
04q1 07q1 10q1 13q1 16q1
per cent
Residential real estate investmentPublic investmentCorporate investmentGross fixed capital formation
Inflation Report – July 2017
22
19 See NBP Quick Monitoring Survey. Economic climate in the enterprise sector, NBP, April 2017. 20 A close to neutral impact of fiscal policy on aggregate demand was a result of lower public investment expenditure being offset by higher
expenditure on social and child benefits, the latter mostly due to the launch of the “Family 500 plus” child benefit payments programme. 21 In 2017 Q1, the state budget deficit amounted to about PLN 2.3 billion (i.e. 3.8% of the statutory limit). 22 Temporary factors that positively influenced VAT revenue growth rate (40.6% of GDP in 2017 Q1), included, among others, acceleration of refund
payments towards the end of 2016, applying the reverse charge mechanism to certain construction services provided by subcontractors, as well as
limiting the quarterly settlements of VAT starting from 2017.
relatively low interest rates. Data on industrial
output and construction (see Chapter 2.2.5 Output)
indicate further rise in activity, and thereby a
rebound in these sectors in 2017 Q2. However,
uncertainty reported by enterprises as well as
higher labour costs and commodity prices continue
to drag on corporate investment.19
In 2017 Q1, housing investment accelerated. This
was supported by improving financial situation of
households, supported in particular by growing
employment and wages (see Chapter 2.4 Labour
market), lower interest rates on loans and relatively
high profitability of home rental (compared to
other forms of funds allocation, see Chapter 2.5.2
Residential real estate market).
2.2.3 Public finance
In 2016, the general government deficit declined to
2.4% of GDP (from 2.6% of GDP in 2015). Despite
this decline, the impact of fiscal policy on
aggregate demand was close to neutral.20
In 2017 Q1, the general government recorded a
substantial surplus. This was due to a very low
state budget deficit,21 accompanied by surpluses in
both local government and social security funds
subsectors. The favourable state budget
performance was mainly attributable to high
growth in revenue, primarily from value-added
tax, stemming from better tax collection, the impact
of temporary factors22 and improvement in
economic conditions. In turn, a good financial
standing of social security funds was supported by
rising employment and wages.
Figure 2.9 Corporate investment in the economy and its sectoral
components (y/y)
Source: GUS data, NBP calculations. Sector categories according to NACE. Data from the survey on revenues, costs, financial
outcome and investment conducted by GUS (form F-01/I-01). Data differ from those presented
on Figure 2.8 because the report does not include, unlike national accounts, scientific research
and development, administration of the State and the economic and social policy of the
community, higher education, public human health activities, creative, arts and entertainment
activities, as well as financial and insurance activities. Gross value added of the latter decreased
in Q1 2017, which can to some extent explain negative growth of corporate investment activity
in this period.
Figure 2.10 Corporate capacity utilisation (seasonally adjusted)
Source: NBP data. Data from NBP Quick Monitoring Survey. Economic climate in the enterprise sector.
-30
-20
-10
0
10
20
30
40
50
-30
-20
-10
0
10
20
30
40
50
06q1 08q1 10q1 12q1 14q1 16q1
per cent
Mining (current prices)
Construction, water supply, energy and transport (current prices)
Trade, services and manufacturing (current prices)
Corporate investment (constant prices)
70
73
76
79
82
85
70
73
76
79
82
85
04q1 07q1 10q1 13q1 16q1
per cent
2. Domestic economy
23
23 Convergence Programme 2017 Update assumes expenditure on gross capital formation to increase in total by 1.2% of GDP, of which expenditure not
subject to refund from the EU budget, by around 0.4% GDP. 24 The financial consequences of the restoration of the general retirement age (65 years for men and 60 years for women) are estimated by the
government to reach 0.1% of GDP in 2017 (according to ESA2010). 25 In line with the information of the Ministry of Family, Labour and Social Policy, in 2016 beneficiaries of the “Family 500 plus” programme received
a total of above PLN 17 billion (approx. 0.9% of GDP), and in 2017 Q1 close to PLN 6 billion (approx. 0.3% of GDP). 26 According to ESA2010 methodology, EU-financed revenues and expenditures have no impact on general government sector balance, but they have
an impact on aggregate demand. 27 GUS data on the value of exports and imports of goods expressed in the Polish zloty are analysed in this chapter. Trends in trade of services are not
discussed broadly due to a lack of detailed breakdowns by destination or type of services. Yet, it should be noted that according to NBP data, the
growth rate of the export of services (10.7% y/y) remained markedly above that of the import of services (7.4% y/y).
In the coming months, a widening of the general
government deficit can be expected on the back of,
among other factors, a marked growth in public
investment,23 which in recent years were primarily
carried out in the second half of the year. In the last
quarter of 2017, the lowering of the general
retirement age (to 60 years for women and 65 for
men)24 will also contribute to higher growth of
public spending. Another factor which will
negatively impact the general government balance,
as compared with 2016, will be the full-year costs
of the “Family 500 plus” programme.25 However,
the general government deficit will remain below
3% of GDP.
As a consequence of the higher than a year before
public investment, including investment financed
with EU funds,26 as well as higher social benefit
payments, fiscal policy will most probably have a
positive, albeit moderate, impact on aggregate
demand in 2017.
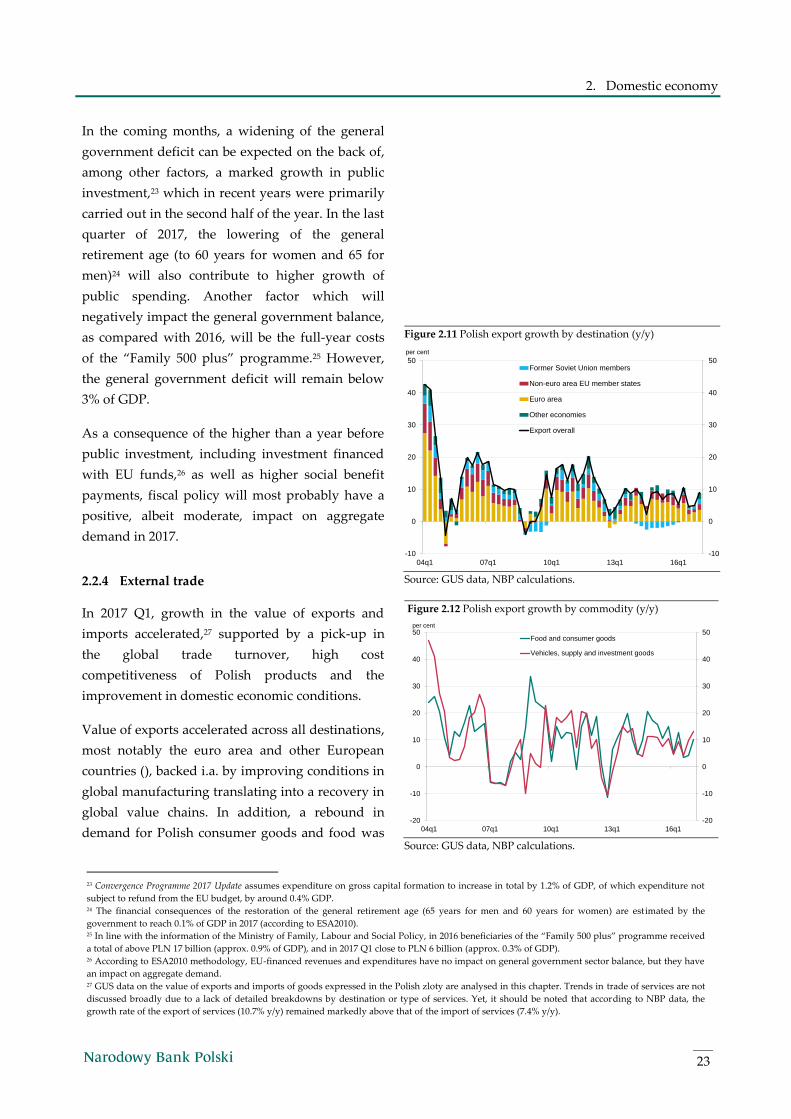
2.2.4 External trade
In 2017 Q1, growth in the value of exports and
imports accelerated,27 supported by a pick-up in
the global trade turnover, high cost
competitiveness of Polish products and the
improvement in domestic economic conditions.
Value of exports accelerated across all destinations,
most notably the euro area and other European
countries (), backed i.a. by improving conditions in
global manufacturing translating into a recovery in
global value chains. In addition, a rebound in
demand for Polish consumer goods and food was
Figure 2.11 Polish export growth by destination (y/y)
Source: GUS data, NBP calculations.
Figure 2.12 Polish export growth by commodity (y/y)
Source: GUS data, NBP calculations.
-10
0
10
20
30
40
50
-10
0
10
20
30
40
50
04q1 07q1 10q1 13q1 16q1
per cent
Former Soviet Union members
Non-euro area EU member states
Euro area
Other economies
Export overall
-20
-10
0
10
20
30
40
50
-20
-10
0
10
20
30
40
50
04q1 07q1 10q1 13q1 16q1
per cent
Food and consumer goods
Vehicles, supply and investment goods
Inflation Report – July 2017
24
28 The average price level in Poland remains lower than in Hungary, Czech Republic and Slovakia, by 7%, 21% and 23%, respectively. Average hourly
labour costs are lower by 4%, 21% and 19%, respectively. 29 NBP Quick Monitoring Survey. Economic climate in the enterprise sector, NBP, April 2017.
observed in European economies (Figure 2.11). The
growth in exports was also supported by a slight
recovery in demand in the major emerging market
economies (see Chapter 1.1 Economic activity
abroad).
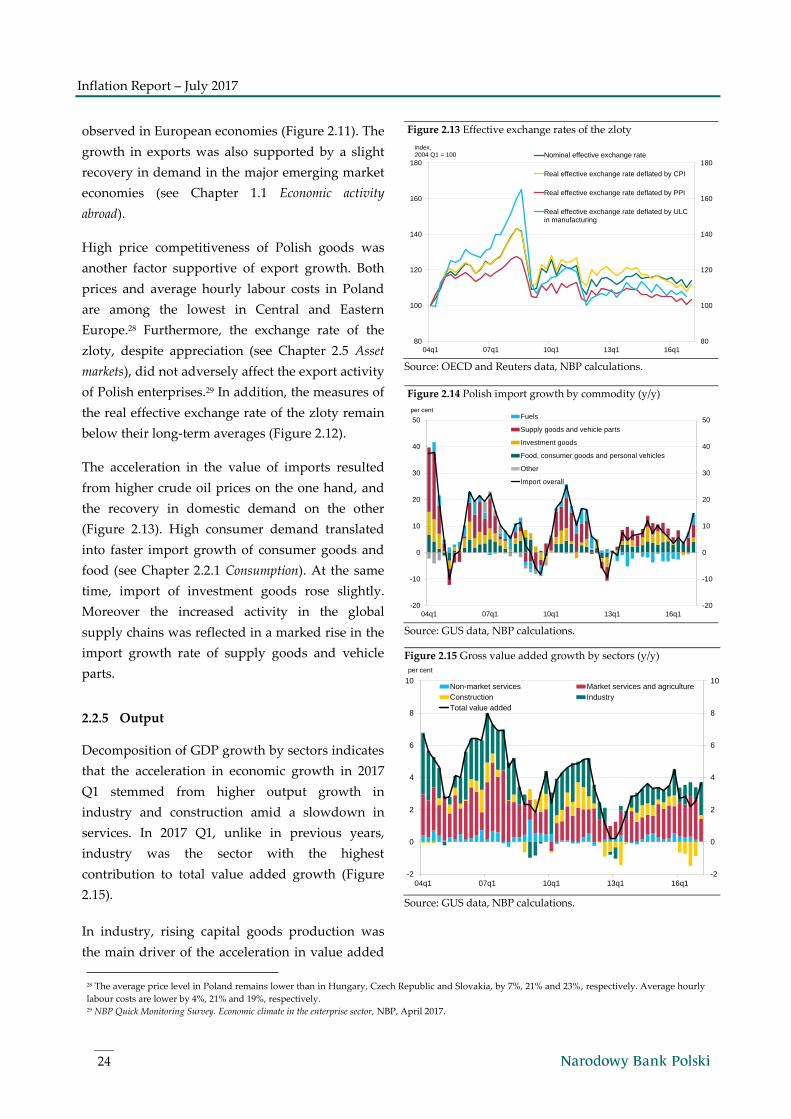
High price competitiveness of Polish goods was
another factor supportive of export growth. Both
prices and average hourly labour costs in Poland
are among the lowest in Central and Eastern
Europe.28 Furthermore, the exchange rate of the
zloty, despite appreciation (see Chapter 2.5 Asset
markets), did not adversely affect the export activity
of Polish enterprises.29 In addition, the measures of
the real effective exchange rate of the zloty remain
below their long-term averages (Figure 2.12).
The acceleration in the value of imports resulted
from higher crude oil prices on the one hand, and
the recovery in domestic demand on the other
(Figure 2.13). High consumer demand translated
into faster import growth of consumer goods and
food (see Chapter 2.2.1 Consumption). At the same
time, import of investment goods rose slightly.
Moreover the increased activity in the global
supply chains was reflected in a marked rise in the
import growth rate of supply goods and vehicle
parts.
2.2.5 Output
Decomposition of GDP growth by sectors indicates
that the acceleration in economic growth in 2017
Q1 stemmed from higher output growth in
industry and construction amid a slowdown in
services. In 2017 Q1, unlike in previous years,
industry was the sector with the highest
contribution to total value added growth (Figure
2.15).
In industry, rising capital goods production was
the main driver of the acceleration in value added
Figure 2.13 Effective exchange rates of the zloty
Source: OECD and Reuters data, NBP calculations.
Figure 2.14 Polish import growth by commodity (y/y)
Source: GUS data, NBP calculations.
Figure 2.15 Gross value added growth by sectors (y/y)
Source: GUS data, NBP calculations.
80
100
120
140
160
180
80
100
120
140
160
180
04q1 07q1 10q1 13q1 16q1
Nominal effective exchange rate
Real effective exchange rate deflated by CPI
Real effective exchange rate deflated by PPI
Real effective exchange rate deflated by ULCin manufacturing
index,2004 Q1 = 100
-20
-10
0
10
20
30
40
50
-20
-10
0
10
20
30
40
50
04q1 07q1 10q1 13q1 16q1
per centFuels
Supply goods and vehicle parts
Investment goods
Food, consumer goods and personal vehicles
Other
Import overall
-2
0
2
4
6
8
10
-2
0
2
4
6
8
10
04q1 07q1 10q1 13q1 16q1
per cent
Non-market services Market services and agriculture
Construction Industry
Total value added
2. Domestic economy
25
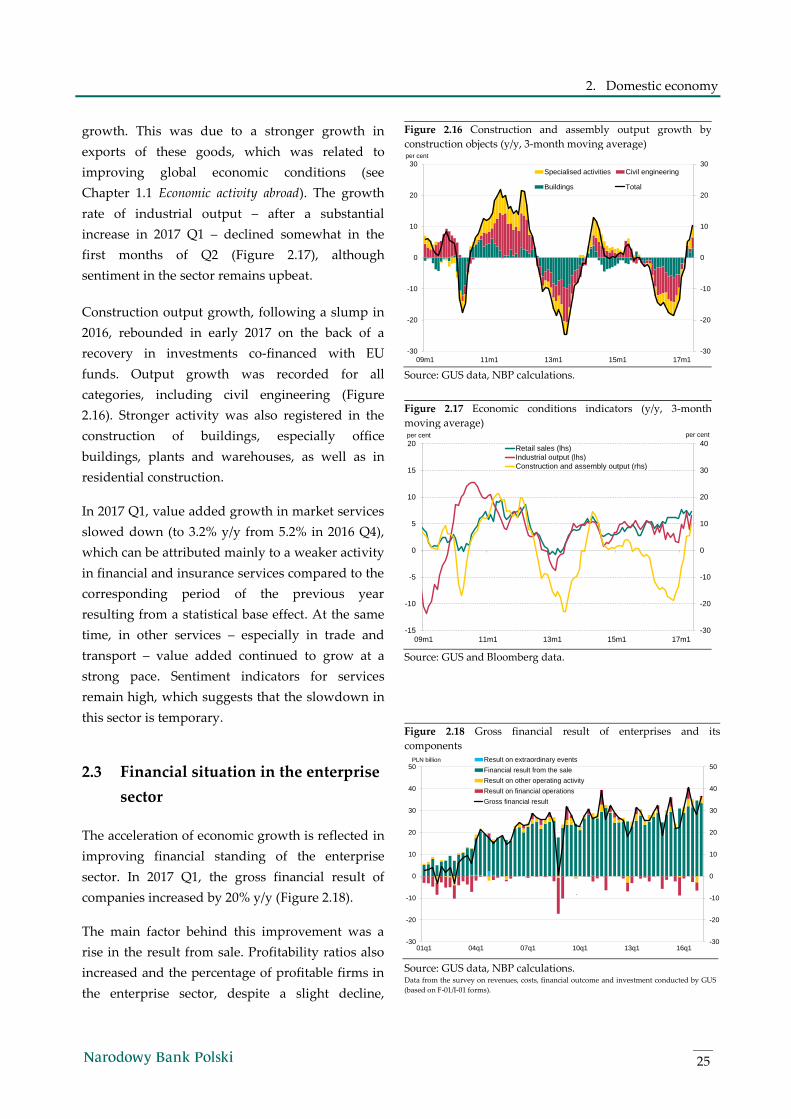
growth. This was due to a stronger growth in
exports of these goods, which was related to
improving global economic conditions (see
Chapter 1.1 Economic activity abroad). The growth
rate of industrial output – after a substantial
increase in 2017 Q1 – declined somewhat in the
first months of Q2 (Figure 2.17), although
sentiment in the sector remains upbeat.
Construction output growth, following a slump in
2016, rebounded in early 2017 on the back of a
recovery in investments co-financed with EU
funds. Output growth was recorded for all
categories, including civil engineering (Figure
2.16). Stronger activity was also registered in the
construction of buildings, especially office
buildings, plants and warehouses, as well as in
residential construction.
In 2017 Q1, value added growth in market services
slowed down (to 3.2% y/y from 5.2% in 2016 Q4),
which can be attributed mainly to a weaker activity
in financial and insurance services compared to the
corresponding period of the previous year
resulting from a statistical base effect. At the same
time, in other services – especially in trade and
transport – value added continued to grow at a
strong pace. Sentiment indicators for services
remain high, which suggests that the slowdown in
this sector is temporary.
2.3 Financial situation in the enterprise
sector
The acceleration of economic growth is reflected in
improving financial standing of the enterprise
sector. In 2017 Q1, the gross financial result of
companies increased by 20% y/y (Figure 2.18).
The main factor behind this improvement was a
rise in the result from sale. Profitability ratios also
increased and the percentage of profitable firms in
the enterprise sector, despite a slight decline,
Figure 2.16 Construction and assembly output growth by
construction objects (y/y, 3-month moving average)
Source: GUS data, NBP calculations.
Figure 2.17 Economic conditions indicators (y/y, 3-month
moving average)
Source: GUS and Bloomberg data.
Figure 2.18 Gross financial result of enterprises and its
components
Source: GUS data, NBP calculations. Data from the survey on revenues, costs, financial outcome and investment conducted by GUS
(based on F-01/I-01 forms).
-30
-20
-10
0
10
20
30
-30
-20
-10
0
10
20
30
09m1 11m1 13m1 15m1 17m1
per cent
Specialised activities Civil engineering
Buildings Total
-30
-20
-10
0
10
20
30
40
-15
-10
-5
0
5
10
15
20
09m1 11m1 13m1 15m1 17m1
per centper cent
Retail sales (lhs)
Industrial output (lhs)
Construction and assembly output (rhs)
-30
-20
-10
0
10
20
30
40
50
-30
-20
-10
0
10
20
30
40
50
01q1 04q1 07q1 10q1 13q1 16q1
PLN billion Result on extraordinary events
Financial result from the sale
Result on other operating activity
Result on financial operations
Gross financial result
`
Inflation Report – July 2017
26
30 The annual LFS employment growth rate is lower than the annual growth rate of corporate employment due to a shift from temporary forms of
employment to permanent job contracts. In 2017 Q1, the number of temporary employees declined by 3.1% y/y, while the number of permanent
employees increased by 3.8%. In addition, the Central Statistical Office updated the sample of companies with more than nine employees at the
beginning of 2017, which also contributed to relatively high corporate employment growth rate in 2017 Q1.
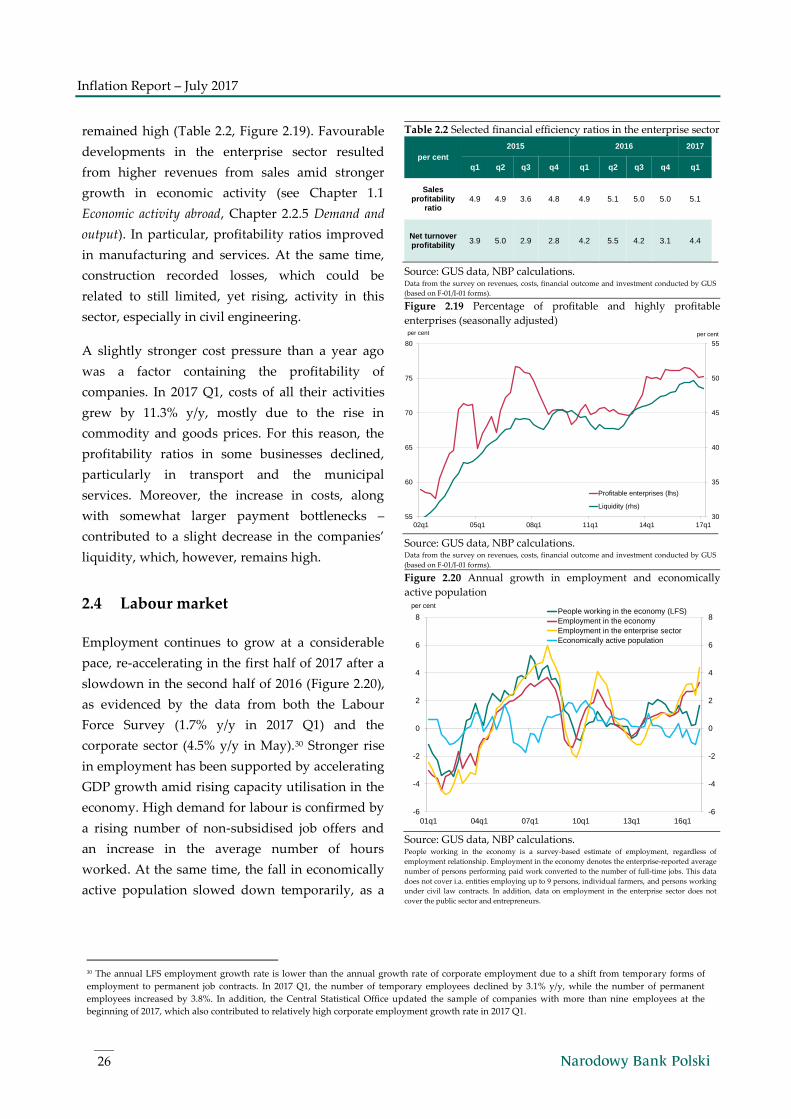
remained high (Table 2.2, Figure 2.19). Favourable
developments in the enterprise sector resulted
from higher revenues from sales amid stronger
growth in economic activity (see Chapter 1.1
Economic activity abroad, Chapter 2.2.5 Demand and
output). In particular, profitability ratios improved
in manufacturing and services. At the same time,
construction recorded losses, which could be
related to still limited, yet rising, activity in this
sector, especially in civil engineering.
A slightly stronger cost pressure than a year ago
was a factor containing the profitability of
companies. In 2017 Q1, costs of all their activities
grew by 11.3% y/y, mostly due to the rise in
commodity and goods prices. For this reason, the
profitability ratios in some businesses declined,
particularly in transport and the municipal
services. Moreover, the increase in costs, along
with somewhat larger payment bottlenecks –
contributed to a slight decrease in the companies’
liquidity, which, however, remains high.
2.4 Labour market
Employment continues to grow at a considerable
pace, re-accelerating in the first half of 2017 after a
slowdown in the second half of 2016 (Figure 2.20),
as evidenced by the data from both the Labour
Force Survey (1.7% y/y in 2017 Q1) and the
corporate sector (4.5% y/y in May).30 Stronger rise
in employment has been supported by accelerating
GDP growth amid rising capacity utilisation in the
economy. High demand for labour is confirmed by
a rising number of non-subsidised job offers and
an increase in the average number of hours
worked. At the same time, the fall in economically
active population slowed down temporarily, as a
Table 2.2 Selected financial efficiency ratios in the enterprise sector
per cent
2015 2016 2017
q1 q2 q3 q4 q1 q2 q3 q4 q1
Sales profitability
ratio 4.9 4.9 3.6 4.8 4.9 5.1 5.0 5.0 5.1
Net turnover profitability
3.9 5.0 2.9 2.8 4.2 5.5 4.2 3.1 4.4
Source: GUS data, NBP calculations. Data from the survey on revenues, costs, financial outcome and investment conducted by GUS
(based on F-01/I-01 forms).
Figure 2.19 Percentage of profitable and highly profitable
enterprises (seasonally adjusted)
Source: GUS data, NBP calculations. Data from the survey on revenues, costs, financial outcome and investment conducted by GUS
(based on F-01/I-01 forms).
Figure 2.20 Annual growth in employment and economically
active population
Source: GUS data, NBP calculations. People working in the economy is a survey-based estimate of employment, regardless of
employment relationship. Employment in the economy denotes the enterprise-reported average
number of persons performing paid work converted to the number of full-time jobs. This data
does not cover i.a. entities employing up to 9 persons, individual farmers, and persons working
under civil law contracts. In addition, data on employment in the enterprise sector does not
cover the public sector and entrepreneurs.
30
35
40
45
50
55
55
60
65
70
75
80
02q1 05q1 08q1 11q1 14q1 17q1
per cent
Profitable enterprises (lhs)
Liquidity (rhs)
per cent
-6
-4
-2
0
2
4
6
8
-6
-4
-2
0
2
4
6
8
01q1 04q1 07q1 10q1 13q1 16q1
per centPeople working in the economy (LFS)
Employment in the economy
Employment in the enterprise sector
Economically active population
2. Domestic economy
27
31 According to the LFS, the fall in the working age population continued in 2017 Q1, although its scale diminished (-0.3% y/y against -0.9% in 2016
Q4). At the same time, following a slight decline in previous quarters, the labour force participation rate increased by 0.15 percentage points.
Consequently, economically active population remained almost unchanged compared to the last year's level. 32 In the past few quarters, the fall in unemployment was largely a result of the decline in economically active population. 33 NBP Quick Monitoring Survey. Economic climate in the enterprise sector, NBP, April 2017. 34 In 2017, the minimum monthly wage rose from PLN 1850 to PLN 2000, or by 8.1%. In addition, an hourly minimum wage was introduced for the
self-employed and the employed under civil law contracts. 35 In 2017 Q1, the unit labour cost growth rate in the economy stood at 1.8% and it was equal to the average for the past five years.
result of which the limitations for employment
growth resulting from shrinking labour supply
subsided.31
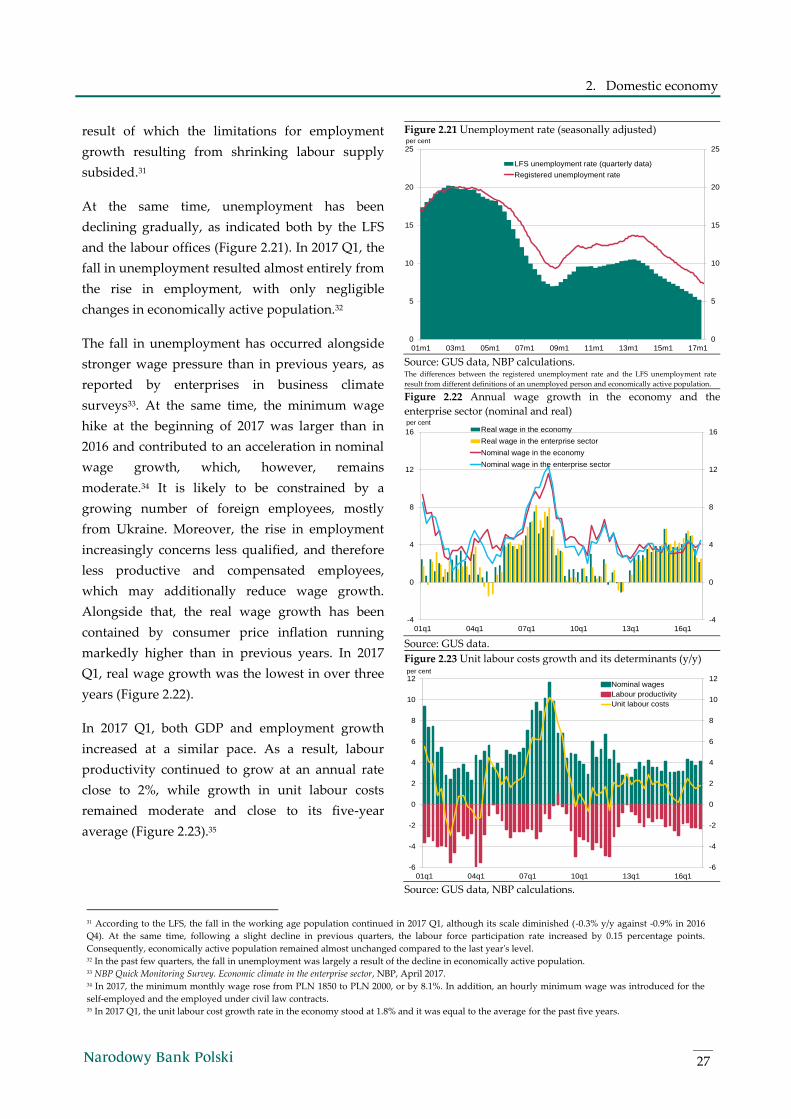
At the same time, unemployment has been
declining gradually, as indicated both by the LFS
and the labour offices (Figure 2.21). In 2017 Q1, the
fall in unemployment resulted almost entirely from
the rise in employment, with only negligible
changes in economically active population.32
The fall in unemployment has occurred alongside
stronger wage pressure than in previous years, as
reported by enterprises in business climate
surveys33. At the same time, the minimum wage
hike at the beginning of 2017 was larger than in
2016 and contributed to an acceleration in nominal
wage growth, which, however, remains
moderate.34 It is likely to be constrained by a
growing number of foreign employees, mostly
from Ukraine. Moreover, the rise in employment
increasingly concerns less qualified, and therefore
less productive and compensated employees,
which may additionally reduce wage growth.
Alongside that, the real wage growth has been
contained by consumer price inflation running
markedly higher than in previous years. In 2017
Q1, real wage growth was the lowest in over three
years (Figure 2.22).
In 2017 Q1, both GDP and employment growth
increased at a similar pace. As a result, labour
productivity continued to grow at an annual rate
close to 2%, while growth in unit labour costs
remained moderate and close to its five-year
average (Figure 2.23).35
Figure 2.21 Unemployment rate (seasonally adjusted)
Source: GUS data, NBP calculations. The differences between the registered unemployment rate and the LFS unemployment rate
result from different definitions of an unemployed person and economically active population.
Figure 2.22 Annual wage growth in the economy and the
enterprise sector (nominal and real)
Source: GUS data.
Figure 2.23 Unit labour costs growth and its determinants (y/y)
Source: GUS data, NBP calculations.
0
5
10
15
20
25
0
5
10
15
20
25
01m1 03m1 05m1 07m1 09m1 11m1 13m1 15m1 17m1
per cent
LFS unemployment rate (quarterly data)
Registered unemployment rate
-4
0
4
8
12
16
-4
0
4
8
12
16
01q1 04q1 07q1 10q1 13q1 16q1
per centReal wage in the economy
Real wage in the enterprise sector
Nominal wage in the economy
Nominal wage in the enterprise sector
-6
-4
-2
0
2
4
6
8
10
12
-6
-4
-2
0
2
4
6
8
10
12
01q1 04q1 07q1 10q1 13q1 16q1
per cent
Nominal wages
Labour productivity
Unit labour costs
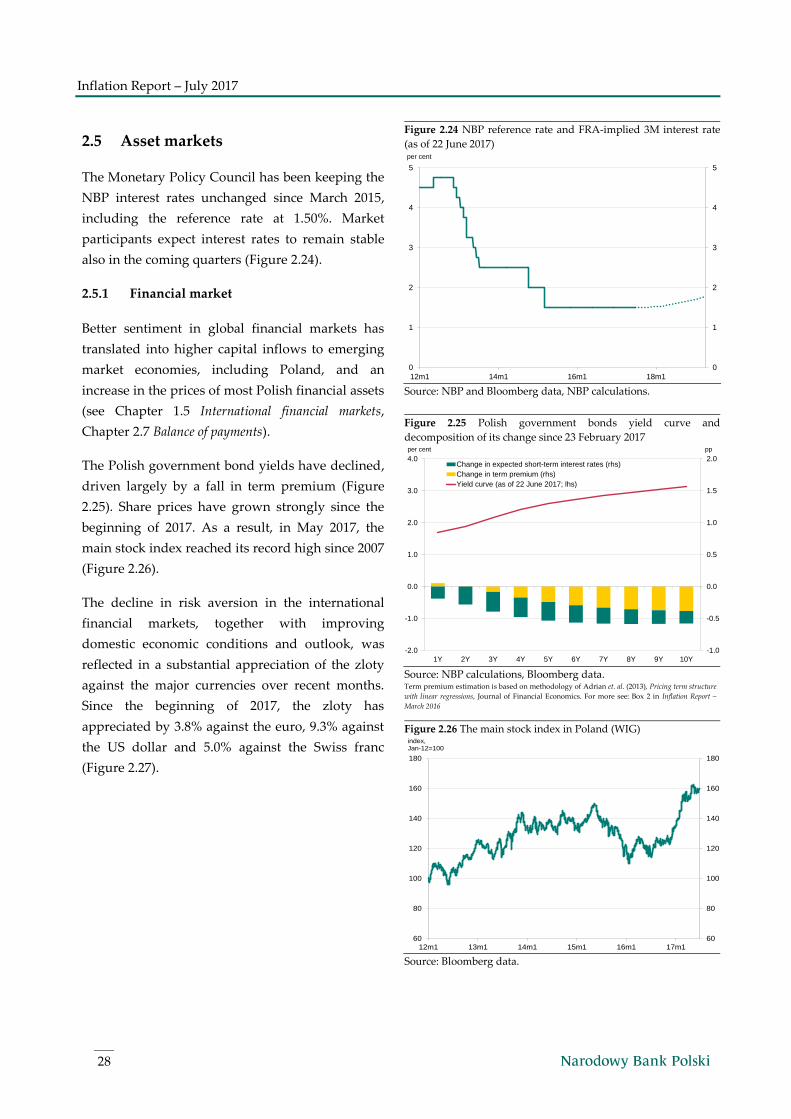
Inflation Report – July 2017
28
2.5 Asset markets
The Monetary Policy Council has been keeping the
NBP interest rates unchanged since March 2015,
including the reference rate at 1.50%. Market
participants expect interest rates to remain stable
also in the coming quarters (Figure 2.24).
2.5.1 Financial market
Better sentiment in global financial markets has
translated into higher capital inflows to emerging
market economies, including Poland, and an
increase in the prices of most Polish financial assets
(see Chapter 1.5 International financial markets,
Chapter 2.7 Balance of payments).
The Polish government bond yields have declined,
driven largely by a fall in term premium (Figure
2.25). Share prices have grown strongly since the
beginning of 2017. As a result, in May 2017, the
main stock index reached its record high since 2007
(Figure 2.26).
The decline in risk aversion in the international
financial markets, together with improving
domestic economic conditions and outlook, was
reflected in a substantial appreciation of the zloty
against the major currencies over recent months.
Since the beginning of 2017, the zloty has
appreciated by 3.8% against the euro, 9.3% against
the US dollar and 5.0% against the Swiss franc
(Figure 2.27).
Figure 2.24 NBP reference rate and FRA-implied 3M interest rate
(as of 22 June 2017)
Source: NBP and Bloomberg data, NBP calculations.
Figure 2.25 Polish government bonds yield curve and
decomposition of its change since 23 February 2017
Source: NBP calculations, Bloomberg data. Term premium estimation is based on methodology of Adrian et. al. (2013), Pricing term structure
with linear regressions, Journal of Financial Economics. For more see: Box 2 in Inflation Report –
March 2016
Figure 2.26 The main stock index in Poland (WIG)
Source: Bloomberg data.
0
1
2
3
4
5
0
1
2
3
4
5
12m1 14m1 16m1 18m1
per cent
-1.0
-0.5
0.0
0.5
1.0
1.5
2.0
-2.0
-1.0
0.0
1.0
2.0
3.0
4.0
1Y 2Y 3Y 4Y 5Y 6Y 7Y 8Y 9Y 10Y
Change in expected short-term interest rates (rhs)
Change in term premium (rhs)
Yield curve (as of 22 June 2017; lhs)
per cent pp
60
80
100
120
140
160
180
60
80
100
120
140
160
180
12m1 13m1 14m1 15m1 16m1 17m1
index, Jan-12=100
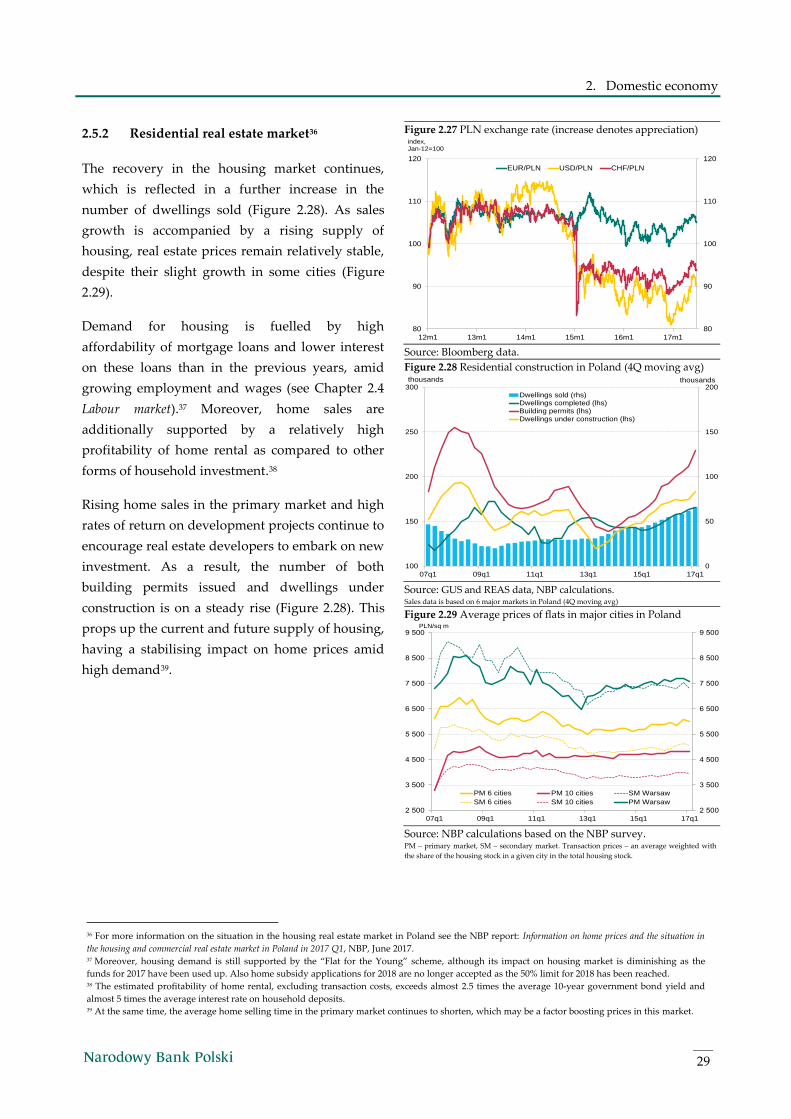
2. Domestic economy
29
36 For more information on the situation in the housing real estate market in Poland see the NBP report: Information on home prices and the situation in
the housing and commercial real estate market in Poland in 2017 Q1, NBP, June 2017. 37 Moreover, housing demand is still supported by the “Flat for the Young” scheme, although its impact on housing market is diminishing as the
funds for 2017 have been used up. Also home subsidy applications for 2018 are no longer accepted as the 50% limit for 2018 has been reached. 38 The estimated profitability of home rental, excluding transaction costs, exceeds almost 2.5 times the average 10-year government bond yield and
almost 5 times the average interest rate on household deposits. 39 At the same time, the average home selling time in the primary market continues to shorten, which may be a factor boosting prices in this market.
2.5.2 Residential real estate market36
The recovery in the housing market continues,
which is reflected in a further increase in the
number of dwellings sold (Figure 2.28). As sales
growth is accompanied by a rising supply of
housing, real estate prices remain relatively stable,
despite their slight growth in some cities (Figure
2.29).
Demand for housing is fuelled by high
affordability of mortgage loans and lower interest
on these loans than in the previous years, amid
growing employment and wages (see Chapter 2.4
Labour market).37 Moreover, home sales are
additionally supported by a relatively high
profitability of home rental as compared to other
forms of household investment.38
Rising home sales in the primary market and high
rates of return on development projects continue to
encourage real estate developers to embark on new
investment. As a result, the number of both
building permits issued and dwellings under
construction is on a steady rise (Figure 2.28). This
props up the current and future supply of housing,
having a stabilising impact on home prices amid
high demand39.
Figure 2.27 PLN exchange rate (increase denotes appreciation)
Source: Bloomberg data.
Figure 2.28 Residential construction in Poland (4Q moving avg)
Source: GUS and REAS data, NBP calculations. Sales data is based on 6 major markets in Poland (4Q moving avg)
Figure 2.29 Average prices of flats in major cities in Poland
Source: NBP calculations based on the NBP survey. PM – primary market, SM – secondary market. Transaction prices – an average weighted with
the share of the housing stock in a given city in the total housing stock.
80
90
100
110
120
80
90
100
110
120
12m1 13m1 14m1 15m1 16m1 17m1
EUR/PLN USD/PLN CHF/PLN
index, Jan-12=100
0
50
100
150
200
100
150
200
250
300
07q1 09q1 11q1 13q1 15q1 17q1
Tys
iące
Dwellings sold (rhs)Dwellings completed (lhs)Building permits (lhs)Dwellings under construction (lhs)
thousands thousands
2 500
3 500
4 500
5 500
6 500
7 500
8 500
9 500
2 500
3 500
4 500
5 500
6 500
7 500
8 500
9 500
07q1 09q1 11q1 13q1 15q1 17q1
PLN/sq m
PM 6 cities PM 10 cities SM Warsaw
SM 6 cities SM 10 cities PM Warsaw
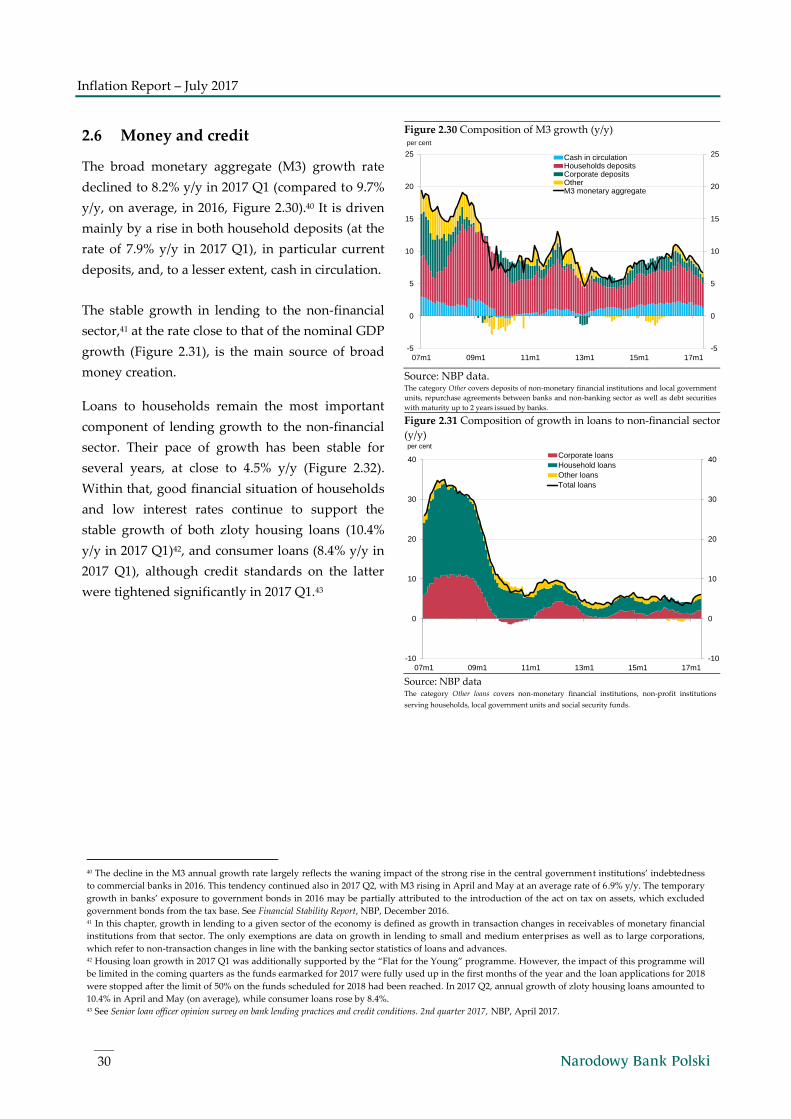
Inflation Report – July 2017
30
40 The decline in the M3 annual growth rate largely reflects the waning impact of the strong rise in the central government institutions’ indebtedness
to commercial banks in 2016. This tendency continued also in 2017 Q2, with M3 rising in April and May at an average rate of 6.9% y/y. The temporary
growth in banks’ exposure to government bonds in 2016 may be partially attributed to the introduction of the act on tax on assets, which excluded
government bonds from the tax base. See Financial Stability Report, NBP, December 2016. 41 In this chapter, growth in lending to a given sector of the economy is defined as growth in transaction changes in receivables of monetary financial
institutions from that sector. The only exemptions are data on growth in lending to small and medium enterprises as well as to large corporations,
which refer to non-transaction changes in line with the banking sector statistics of loans and advances. 42 Housing loan growth in 2017 Q1 was additionally supported by the “Flat for the Young” programme. However, the impact of this programme will
be limited in the coming quarters as the funds earmarked for 2017 were fully used up in the first months of the year and the loan applications for 2018
were stopped after the limit of 50% on the funds scheduled for 2018 had been reached. In 2017 Q2, annual growth of zloty housing loans amounted to
10.4% in April and May (on average), while consumer loans rose by 8.4%. 43 See Senior loan officer opinion survey on bank lending practices and credit conditions. 2nd quarter 2017, NBP, April 2017.
2.6 Money and credit
The broad monetary aggregate (M3) growth rate
declined to 8.2% y/y in 2017 Q1 (compared to 9.7%
y/y, on average, in 2016, Figure 2.30).40 It is driven
mainly by a rise in both household deposits (at the
rate of 7.9% y/y in 2017 Q1), in particular current
deposits, and, to a lesser extent, cash in circulation.
The stable growth in lending to the non-financial
sector,41 at the rate close to that of the nominal GDP
growth (Figure 2.31), is the main source of broad
money creation.
Loans to households remain the most important
component of lending growth to the non-financial
sector. Their pace of growth has been stable for
several years, at close to 4.5% y/y (Figure 2.32).
Within that, good financial situation of households
and low interest rates continue to support the
stable growth of both zloty housing loans (10.4%
y/y in 2017 Q1)42, and consumer loans (8.4% y/y in
2017 Q1), although credit standards on the latter
were tightened significantly in 2017 Q1.43
Figure 2.30 Composition of M3 growth (y/y)
Source: NBP data. The category Other covers deposits of non-monetary financial institutions and local government
units, repurchase agreements between banks and non-banking sector as well as debt securities
with maturity up to 2 years issued by banks.
Figure 2.31 Composition of growth in loans to non-financial sector
(y/y)
Source: NBP data The category Other loans covers non-monetary financial institutions, non-profit institutions
serving households, local government units and social security funds.
-5
0
5
10
15
20
25
-5
0
5
10
15
20
25
07m1 09m1 11m1 13m1 15m1 17m1
Cash in circulationHouseholds depositsCorporate depositsOtherM3 monetary aggregate
per cent
-10
0
10
20
30
40
-10
0
10
20
30
40
07m1 09m1 11m1 13m1 15m1 17m1
Corporate loans
Household loans
Other loans
Total loans
per cent
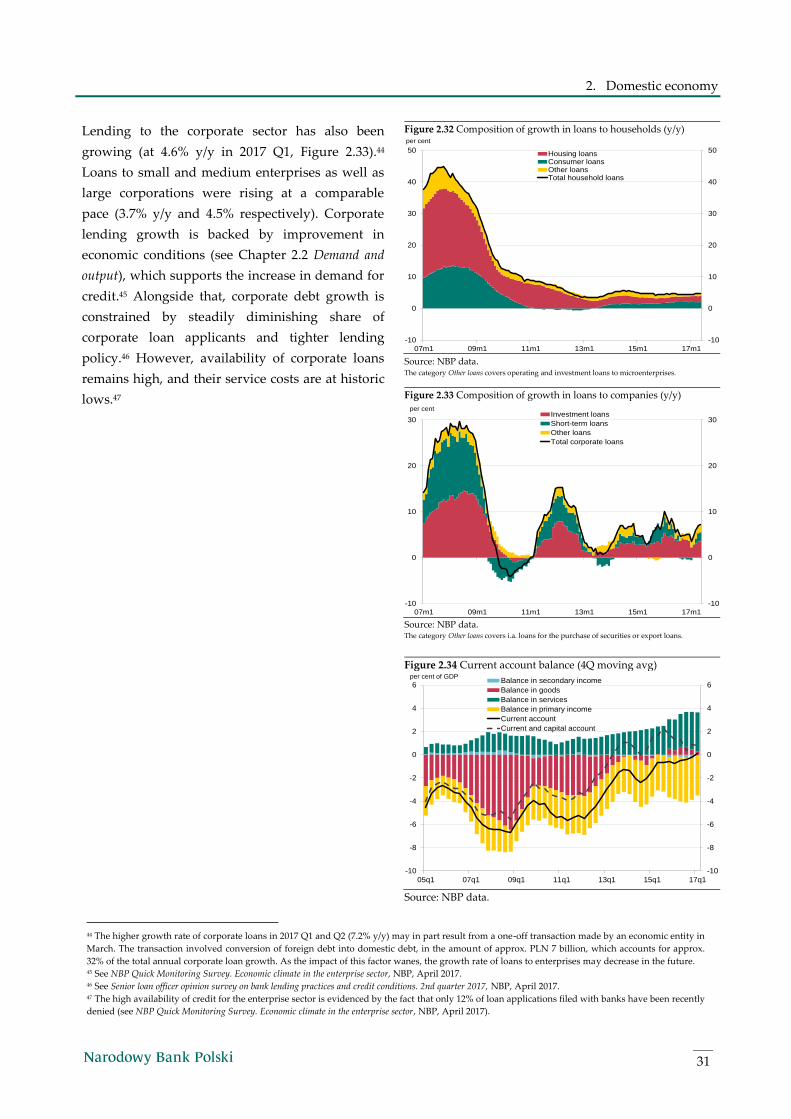
2. Domestic economy
31
44 The higher growth rate of corporate loans in 2017 Q1 and Q2 (7.2% y/y) may in part result from a one-off transaction made by an economic entity in
March. The transaction involved conversion of foreign debt into domestic debt, in the amount of approx. PLN 7 billion, which accounts for approx.
32% of the total annual corporate loan growth. As the impact of this factor wanes, the growth rate of loans to enterprises may decrease in the future. 45 See NBP Quick Monitoring Survey. Economic climate in the enterprise sector, NBP, April 2017. 46 See Senior loan officer opinion survey on bank lending practices and credit conditions. 2nd quarter 2017, NBP, April 2017. 47 The high availability of credit for the enterprise sector is evidenced by the fact that only 12% of loan applications filed with banks have been recently
denied (see NBP Quick Monitoring Survey. Economic climate in the enterprise sector, NBP, April 2017).
Lending to the corporate sector has also been
growing (at 4.6% y/y in 2017 Q1, Figure 2.33).44
Loans to small and medium enterprises as well as
large corporations were rising at a comparable
pace (3.7% y/y and 4.5% respectively). Corporate
lending growth is backed by improvement in
economic conditions (see Chapter 2.2 Demand and
output), which supports the increase in demand for
credit.45 Alongside that, corporate debt growth is
constrained by steadily diminishing share of
corporate loan applicants and tighter lending
policy.46 However, availability of corporate loans
remains high, and their service costs are at historic
lows.47
Figure 2.32 Composition of growth in loans to households (y/y)
Source: NBP data. The category Other loans covers operating and investment loans to microenterprises.
Figure 2.33 Composition of growth in loans to companies (y/y)
Source: NBP data. The category Other loans covers i.a. loans for the purchase of securities or export loans.
Figure 2.34 Current account balance (4Q moving avg)
Source: NBP data.
-10
0
10
20
30
40
50
-10
0
10
20
30
40
50
07m1 09m1 11m1 13m1 15m1 17m1
Housing loansConsumer loansOther loansTotal household loans
per cent
-10
0
10
20
30
-10
0
10
20
30
07m1 09m1 11m1 13m1 15m1 17m1
Investment loans
Short-term loans
Other loans
Total corporate loans
per cent
-10
-8
-6
-4
-2
0
2
4
6
-10
-8
-6
-4
-2
0
2
4
6
05q1 07q1 09q1 11q1 13q1 15q1 17q1
per cent of GDPBalance in secondary income
Balance in goods
Balance in services
Balance in primary income
Current account
Current and capital account
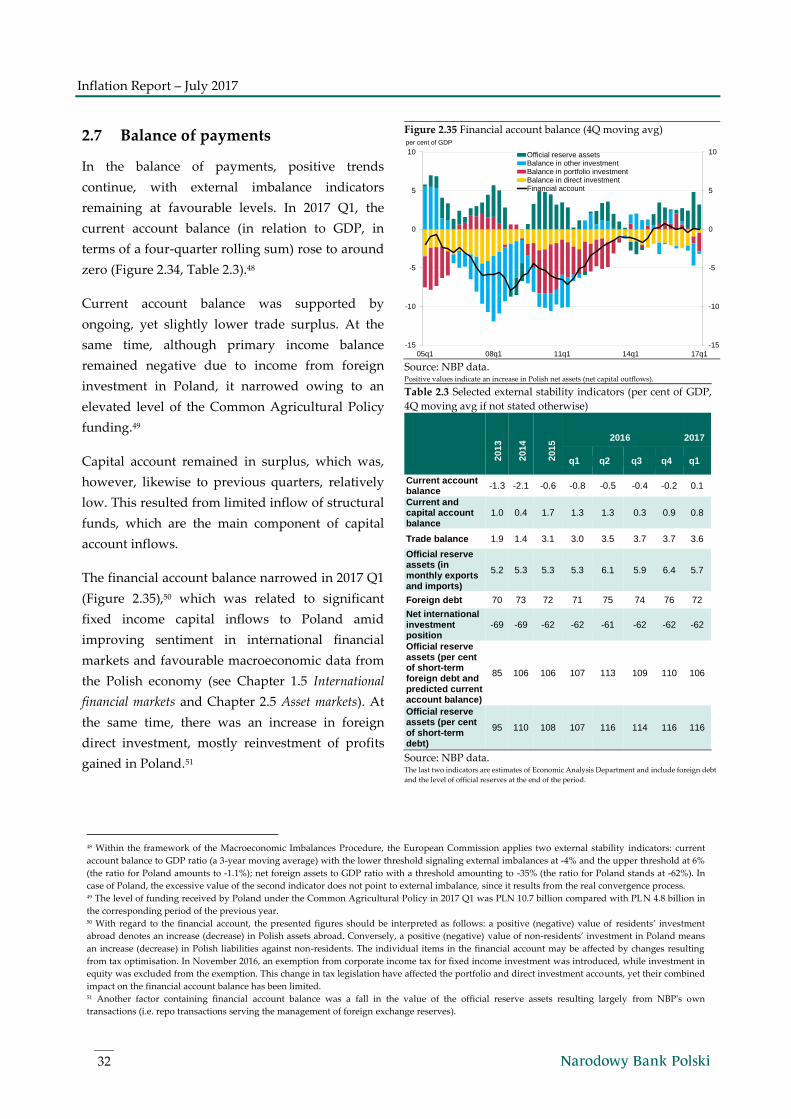
Inflation Report – July 2017
32
48 Within the framework of the Macroeconomic Imbalances Procedure, the European Commission applies two external stability indicators: current
account balance to GDP ratio (a 3-year moving average) with the lower threshold signaling external imbalances at -4% and the upper threshold at 6%
(the ratio for Poland amounts to -1.1%); net foreign assets to GDP ratio with a threshold amounting to -35% (the ratio for Poland stands at -62%). In
case of Poland, the excessive value of the second indicator does not point to external imbalance, since it results from the real convergence process. 49 The level of funding received by Poland under the Common Agricultural Policy in 2017 Q1 was PLN 10.7 billion compared with PLN 4.8 billion in
the corresponding period of the previous year. 50 With regard to the financial account, the presented figures should be interpreted as follows: a positive (negative) value of residents’ investment
abroad denotes an increase (decrease) in Polish assets abroad. Conversely, a positive (negative) value of non-residents’ investment in Poland means
an increase (decrease) in Polish liabilities against non-residents. The individual items in the financial account may be affected by changes resulting
from tax optimisation. In November 2016, an exemption from corporate income tax for fixed income investment was introduced, while investment in
equity was excluded from the exemption. This change in tax legislation have affected the portfolio and direct investment accounts, yet their combined
impact on the financial account balance has been limited. 51 Another factor containing financial account balance was a fall in the value of the official reserve assets resulting largely from NBP's own
transactions (i.e. repo transactions serving the management of foreign exchange reserves).
2.7 Balance of payments
In the balance of payments, positive trends
continue, with external imbalance indicators
remaining at favourable levels. In 2017 Q1, the
current account balance (in relation to GDP, in
terms of a four-quarter rolling sum) rose to around
zero (Figure 2.34, Table 2.3).48
Current account balance was supported by
ongoing, yet slightly lower trade surplus. At the
same time, although primary income balance
remained negative due to income from foreign
investment in Poland, it narrowed owing to an
elevated level of the Common Agricultural Policy
funding.49
Capital account remained in surplus, which was,
however, likewise to previous quarters, relatively
low. This resulted from limited inflow of structural
funds, which are the main component of capital
account inflows.
The financial account balance narrowed in 2017 Q1
(Figure 2.35),50 which was related to significant
fixed income capital inflows to Poland amid
improving sentiment in international financial
markets and favourable macroeconomic data from
the Polish economy (see Chapter 1.5 International
financial markets and Chapter 2.5 Asset markets). At
the same time, there was an increase in foreign
direct investment, mostly reinvestment of profits
gained in Poland.51
Figure 2.35 Financial account balance (4Q moving avg)
Source: NBP data. Positive values indicate an increase in Polish net assets (net capital outflows).
Table 2.3 Selected external stability indicators (per cent of GDP,
4Q moving avg if not stated otherwise)
201
3
201
4
201
5 2016 2017
q1 q2 q3 q4 q1
Current account balance
-1.3 -2.1 -0.6 -0.8 -0.5 -0.4 -0.2 0.1
Current and capital account balance
1.0 0.4 1.7 1.3 1.3 0.3 0.9 0.8
Trade balance 1.9 1.4 3.1 3.0 3.5 3.7 3.7 3.6
Official reserve assets (in monthly exports and imports)
5.2 5.3 5.3 5.3 6.1 5.9 6.4 5.7
Foreign debt 70 73 72 71 75 74 76 72
Net international investment position
-69 -69 -62 -62 -61 -62 -62 -62
Official reserve assets (per cent of short-term foreign debt and predicted current account balance)
85 106 106 107 113 109 110 106
Official reserve assets (per cent of short-term debt)
95 110 108 107 116 114 116 116
Source: NBP data. The last two indicators are estimates of Economic Analysis Department and include foreign debt
and the level of official reserves at the end of the period.
-15
-10
-5
0
5
10
-15
-10
-5
0
5
10
05q1 08q1 11q1 14q1 17q1
per cent of GDP
Official reserve assetsBalance in other investmentBalance in portfolio investmentBalance in direct investmentFinancial account
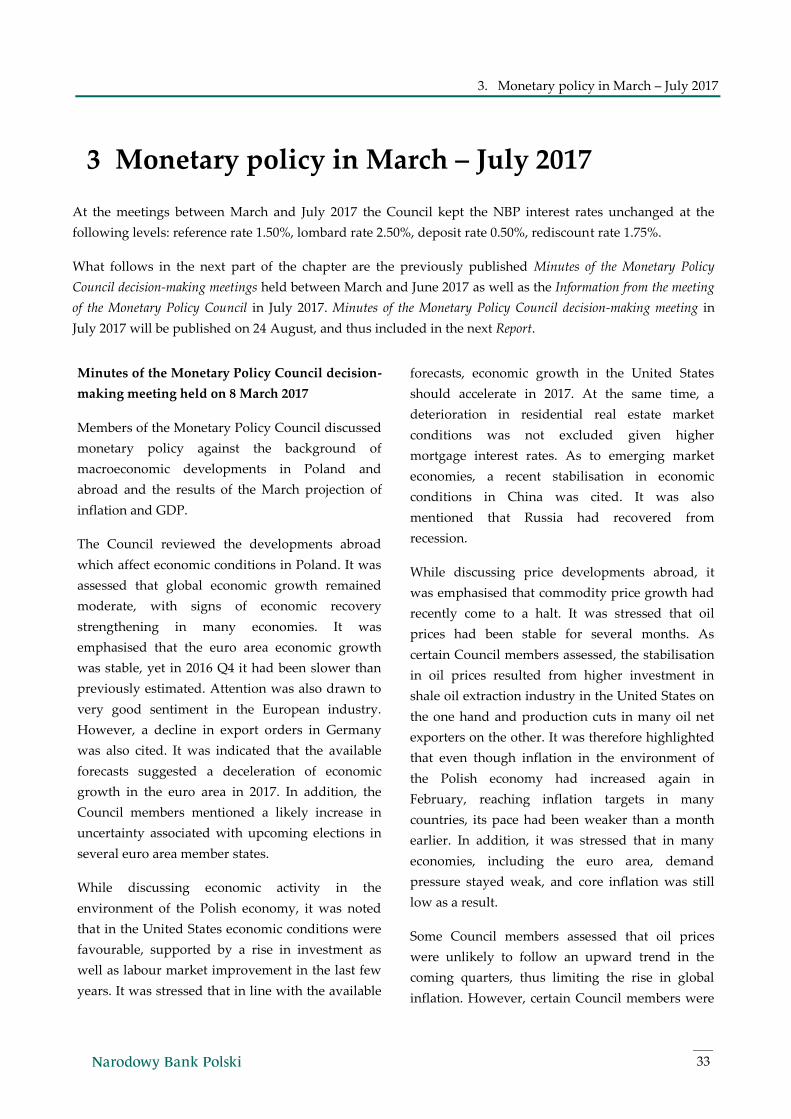
3. Monetary policy in March – July 2017
33
Monetary policy in March – July 2017 3
At the meetings between March and July 2017 the Council kept the NBP interest rates unchanged at the
following levels: reference rate 1.50%, lombard rate 2.50%, deposit rate 0.50%, rediscount rate 1.75%.
What follows in the next part of the chapter are the previously published Minutes of the Monetary Policy
Council decision-making meetings held between March and June 2017 as well as the Information from the meeting
of the Monetary Policy Council in July 2017. Minutes of the Monetary Policy Council decision-making meeting in
July 2017 will be published on 24 August, and thus included in the next Report.
Minutes of the Monetary Policy Council decision-
making meeting held on 8 March 2017
Members of the Monetary Policy Council discussed
monetary policy against the background of
macroeconomic developments in Poland and
abroad and the results of the March projection of
inflation and GDP.
The Council reviewed the developments abroad
which affect economic conditions in Poland. It was
assessed that global economic growth remained
moderate, with signs of economic recovery
strengthening in many economies. It was
emphasised that the euro area economic growth
was stable, yet in 2016 Q4 it had been slower than
previously estimated. Attention was also drawn to
very good sentiment in the European industry.
However, a decline in export orders in Germany
was also cited. It was indicated that the available
forecasts suggested a deceleration of economic
growth in the euro area in 2017. In addition, the
Council members mentioned a likely increase in
uncertainty associated with upcoming elections in
several euro area member states.
While discussing economic activity in the
environment of the Polish economy, it was noted
that in the United States economic conditions were
favourable, supported by a rise in investment as
well as labour market improvement in the last few
years. It was stressed that in line with the available
forecasts, economic growth in the United States
should accelerate in 2017. At the same time, a
deterioration in residential real estate market
conditions was not excluded given higher
mortgage interest rates. As to emerging market
economies, a recent stabilisation in economic
conditions in China was cited. It was also
mentioned that Russia had recovered from
recession.
While discussing price developments abroad, it
was emphasised that commodity price growth had
recently come to a halt. It was stressed that oil
prices had been stable for several months. As
certain Council members assessed, the stabilisation
in oil prices resulted from higher investment in
shale oil extraction industry in the United States on
the one hand and production cuts in many oil net
exporters on the other. It was therefore highlighted
that even though inflation in the environment of
the Polish economy had increased again in
February, reaching inflation targets in many
countries, its pace had been weaker than a month
earlier. In addition, it was stressed that in many
economies, including the euro area, demand
pressure stayed weak, and core inflation was still
low as a result.
Some Council members assessed that oil prices
were unlikely to follow an upward trend in the
coming quarters, thus limiting the rise in global
inflation. However, certain Council members were
Inflation Report – July 2017
34
of the opinion that the signs of global economic
recovery observed in recent quarters could
translate into higher demand pressure in many
economies, resulting in a rise in inflation. In the
opinion of certain Council members, a likely rise in
wage growth associated with upcoming elections
in some euro area member states was posing an
additional upside risk to inflation in this economy.
Referring to monetary policy abroad, it was
pointed out that the Federal Reserve had indicated
a further rise in interest rates in 2017. It was
pointed out that the probability of a hike in fed
funds rate in March had increased of late. At the
same time, it was assessed that tighter monetary
policy in the United States had been translating
into higher government bond yields in many
countries, including in Poland. Yet, it was
underlined that the rise in yields had been
contained by ongoing quantitative easing and
negative interest rates in the euro area.
While discussing the developments in Poland’s real
economy, it was emphasised that GDP growth in
2016 Q4 had been slightly higher than a quarter
earlier. It was indicated that economic growth had
been mainly driven by increasing consumer
demand, supported by improving labour market,
very good consumer sentiment as well as child and
social benefit payments. It was underlined that in
2016 Q4 a fall in investment had narrowed due to
higher absorption of EU funds. Certain Council
members mentioned in addition an ongoing
expansion in housing investment.
Council members stressed that recent economic
data had been indicating further recovery.
Attention was drawn to an acceleration in
industrial output and retail sales growth in January
2017. It was highlighted that construction and
assembly output had posted a growth in annual
terms in January for the first time in over a year. It
was emphasised, however, that sentiment in
manufacturing had weakened somewhat in
February 2017. In addition, it was noted that better
data readings in January had resulted to some
extent from statistical effects. Some Council
members also drew attention to a slowdown in
corporate lending over recent months, suggesting
that this might indicate still weak investment
demand. In this context, certain Council members
pointed to spare capacity in the economy.
While discussing the labour market conditions,
attention was drawn to accelerating employment
and wage growth in the enterprise sector in
January 2017. At the same time, it was indicated
that data for the entire economy was suggesting
rather weak rise in the number of working persons
and a slower increase in wages in 2016 Q4,
translating into slower growth in unit labour costs.
Regarding the Poland’s macroeconomic outlook, it
was emphasised that – according to the March
GDP projection – economic growth in 2017 should
pick up markedly, supported by a significant rise in
investment amid higher inflow of EU funds, as well
as ongoing robust consumption growth. Certain
Council members indicated that a substantial
acceleration in gross fixed capital formation in 2017
would result mostly from a stronger rise in
infrastructural investment, with only a moderate
increase in corporate investment. These Council
members were of the opinion that such
composition of the increase in gross fixed capital
formation might be less supportive of economic
growth over the medium term. Other Council
members assessed, however, that corporate
investment growth might be aided by lower legal
uncertainty.
It was indicated that NBP’s GDP projection for
2017 was higher than external forecasts. Yet, it was
stressed that GDP growth, having picked up
considerably in 2017, might weaken slightly in the
coming years and should not exceed potential
output growth to a large extent. Some Council
members pointed to downside risks to economic
3. Monetary policy in March – July 2017
35
activity in the coming years, i.a. a likely negative
impact of higher commodity prices on household
consumption growth.
While analysing price developments in Poland, it
was highlighted that annual consumer price
growth had picked up considerably over recent
months. It was stressed that price growth had
resulted mainly from higher global commodity
prices translating into a rise in energy prices, as
well as from increase in agricultural commodity
prices reflected in higher food price growth. It was
emphasised that core inflation was still low,
indicating ongoing weak demand pressure. It was
pointed out that wage pressure was also limited,
which was reflected in still moderate unit labour
costs.
The Council members underlined that – in line
with the March inflation projection – following a
considerable increase in the first months of the
year, inflation would stabilise at a moderate level
in the following quarters. Certain Council members
judged that in the coming quarters inflation might
be higher than envisaged in the March projection.
On the one hand, these Council members did not
exclude stronger demand pressure, and on the
other hand, they pointed to upside risks to wage
growth related to a possible decline in labour force
participation after the reduction of the statutory
retirement age in Poland. They also drew attention
to stronger cost pressure in recent months, reflected
in rising PPI, which may translate into higher
consumer price growth. Other Council members
indicated, however, that as the effects of higher
global commodity prices dissipated, cost pressure
should be fading out. Moreover, some Council
members assessed that domestic inflationary
pressure would grow only gradually, as economic
growth was to run close to potential product
growth in the coming years and there was still
spare capacity in the economy. In addition, certain
Council members expressed an opinion that wage
pressure in the Polish economy would probably
stay subdued due to weak bargaining position of
Polish employees.
While discussing NBP’s monetary policy, the
Council decided that the interest rates should be
left unchanged at the current meeting. In the
opinion of the Council, given the current data and
forecasts, including the March inflation projection,
the risk of inflation running persistently above the
target in the medium term was limited. At the same
time, the decline in the real interest rates, related to
higher inflation, would support the acceleration of
economic growth in 2017. The Council confirmed
its assessment that the stabilisation of the nominal
interest rates helped to keep the Polish economy on
a sustainable growth path and maintain
macroeconomic balance.
The majority of the Council members judged that
in light of available information stabilisation of the
NBP interest rates was likely also in the following
quarters. Yet, certain Council members were of the
opinion that should incoming data and forecasts
suggest stronger inflationary pressure than
assumed in the March projection, it might be
justified to consider an increase in the NBP interest
rates. According to certain Council members, the
interest rate decisions ought to reflect the impact of
real interest rates on asset prices and savings in
Poland. However, other Council members
emphasised that the level of the real interest rates
was not the main factor determining the savings
rate and asset prices in the Polish economy.
Moreover, certain Council members stressed that
the interest rate increases might adversely affect
corporate investment growth. Certain Council
members underlined that in the coming months the
analysis of the robustness and scale of the recovery
and the resulting price developments should factor
in the impact of the negative real interest rates on
macroeconomic developments and asset prices.
Other Council members pointed out that a more
comprehensive assessment of the monetary policy
Inflation Report – July 2017
36
outlook would be possible after the following
projections of inflation and GDP.
The Council decided to keep the NBP interest rates
unchanged: the reference rate at 1.50%, the
lombard rate at 2.50%, the deposit rate at 0.50% and
the rediscount rate at 1.75%.
Minutes of the Monetary Policy Council decision-
making meeting held on 5 April 2017
Members of the Monetary Policy Council discussed
monetary policy against the background of
macroeconomic developments in Poland and
abroad.
The Council reviewed the developments abroad
which affect economic conditions in Poland. It was
assessed that the rise in global economic activity
remained moderate, with signs of recovery
strengthening in many economies. It was
emphasised that growth in the euro area was
stable, although it had slowed down slightly in
2016 Q4. Nonetheless, very strong sentiment in the
European economy was also brought to attention.
It was noted that in the United States economic
conditions were favourable, supported by
improving labour market and a rebound in
investment, i.a. in shale oil extraction industry, yet
recent data was indicating somewhat weaker GDP
growth in 2017 Q1. It was pointed out that in China
economic growth was stable and the risk of a more
notable slowdown had diminished. However, it
was underlined that GDP growth, in line with
forecasts presented by the Chinese authorities, was
to decelerate in 2017. It was also highlighted that in
Russia economic conditions were still weak,
despite the end of the recession.
Referring to price developments abroad, it was
noted that, although the annual inflation rates in
many countries were significantly higher than in
2016, their rise had recently come to a halt.
Attention was drawn particularly to a notable
decline in inflation in the euro area in March. It was
assessed that the halt in inflation growth had
resulted from abating effects of the earlier rise in
global commodity prices. In this context, a fall in
global commodity prices in March was cited.
Certain Council members argued that the major
factors behind lower energy commodity prices
included higher shale oil production and falling
extraction costs of this commodity in the United
States, as well as measures taken by some oil
producers to maintain their market share. During
the discussion on price developments abroad, it
was also stressed that core inflation was still low in
many economies, and in the case of the euro area it
had even posted a decline in March.
Turning to monetary policy abroad, attention was
drawn to lower monthly pace of asset purchases by
the ECB starting from April. However, it was
underlined that the ECB’s monetary policy was still
expansionary, with its interest rates close to zero,
including the deposit rate below zero. It was also
pointed out that, although the Federal Reserve had
increased its interest rates, it was indicating that
monetary policy tightening would proceed at a
similar pace to previously expected. It was noted
that sentiment in the global financial markets had
been positive, and many emerging market
currencies, including the zloty, had appreciated as
a result, while share prices had risen, also on the
Warsaw Stock Exchange.
While discussing developments in Poland's real
economy, it was highlighted that recent data had
been pointing to an improvement in economic
conditions in 2017 Q1. It was judged that GDP
growth in 2017 Q1 had been slightly higher than in
previous quarter, albeit still moderate. It was
emphasised that economic growth was mainly
driven by increasing consumer demand, supported
by improving labour market conditions, reflected
in further growth in employment and wages, and
also by very good consumer sentiment and the
child benefit payments. It was underlined that
ongoing sound increase in consumer demand in
3. Monetary policy in March – July 2017
37
2017 Q1 was indicated by a rapid rise in retail sales.
However, attention was also drawn to a
deceleration in annual industrial production
growth as well as a fall in construction and
assembly output in February. At the same time, it
was stressed that both could be attributed mainly
to statistical effects. Certain Council members also
pointed to industrial sector sentiment in 2017 Q1,
which was the strongest in a year.
Regarding Poland’s economic outlook, the Council
members underlined that in the coming quarters
GDP growth should accelerate at a similar pace to
the March GDP projection path. Economic growth
will be supported by expected rise in investment
resulting from higher inflows of EU funds, amid a
steady rise in consumption. In this context, certain
Council members pointed to an increasing number
of contracts on the use of EU funds signed by local
government units. In their opinion, good fiscal
position recorded in previous years by local
governments should be supportive of their
investment expenditures in the coming quarters.
According to certain Council members, it could not
be excluded that economic growth in 2017 would
be higher than envisaged in the March projection.
Certain Council members judged, however, that
the pace of corporate investment growth in the
coming quarters was still uncertain. In addition, it
was indicated that further acceleration in
consumption growth could be contained by slower
increase in real wages resulting from higher price
growth compared to a year before.
When analysing inflation developments in Poland,
it was stressed that the annual consumer price
growth, after a significant rise at the beginning of
the year, had declined somewhat in March. It was
assessed that lower inflation had probably resulted
from a fall in food prices and waning effects of the
earlier global commodity price increases. Certain
Council members cited a further rise in annual
growth of producer prices in February, which, in
their opinion, could point to intensifying cost
pressure. According to certain Council members,
improving economic conditions were contributing
to a rise in demand pressure. Other Council
members, however, emphasised that, given still
negative output gap and spare capacity in the
economy, demand pressure was still limited. It was
also underlined that, despite improving labour
market and a minimum wage hike at the beginning
of 2017, wage growth, and hence the increase in
unit labour costs, were still moderate. Some
Council members noted in addition that the rise in
the annual producer price growth rate in February
originated mainly from a low base effect. In their
assessment, this could indicate that the growth in
cost pressure might have levelled off.
The majority of the Council members assessed that
inflation would stabilise at a moderate level in the
following quarters. They indicated that this would
be supported by only gradual growth in domestic
inflationary pressure related to improving
economic conditions in Poland as well as
decelerating growth in energy and food prices
resulting from dissipating effects of the earlier
increase in energy and agricultural commodity
prices. At the same time, in the assessment of
certain Council members, inflation might be higher
than envisaged by forecasts available at the time of
the meeting. These Council members did not
exclude a stronger rise in demand pressure. They
also pointed to an increase in inflation expectations
in early 2017. Hence, they did not rule out that
improving labour market could translate into
stronger wage growth, and higher consumer price
growth as a result.
While discussing NBP’s monetary policy, the
Council decided that the interest rates should
remain unchanged. This decision was primarily
justified by limited risk of inflation running
persistently above the target in the medium term.
At the same time, a decline in the real interest rates,
related to higher inflation, should support the
acceleration of economic growth in 2017. The
Inflation Report – July 2017
38
Council confirmed its assessment that, given the
available information, the stabilisation of the
nominal interest rates helped to keep the Polish
economy on a sustainable growth path and
maintain macroeconomic balance.
The majority of the Council members assessed that
in light of available information stabilisation of the
NBP interest rates was likely also in the following
quarters. According to certain Council members,
should data and forecasts incoming in the
following quarters suggest stronger inflationary
pressure than expected at the time of the meeting,
it might be justified to consider an increase in the
NBP interest rates. In the opinion of these Council
members, the interest rate decisions ought to
reflect, in particular, the impact of negative real
interest rates on asset prices and the savings rate in
the Polish economy. These Council members drew
attention to a gradual deceleration in household
deposit growth over the previous six months,
which, starting from early 2017, was accompanied
by higher inflows to investment funds from the
household sector.
Other Council members emphasised, however, that
the level of the real interest rates was not the main
factor determining the savings rate and asset
prices. They highlighted that the real interest rates
in Poland were higher than in other European
economies, while interest on loans in real terms
was still markedly positive, which contained a risk
of excessive lending growth. In this context, they
pointed to moderate lending growth and relatively
stable residential real estate prices, despite ongoing
recovery in that market.
Certain Council members assessed that a more
comprehensive assessment of the impact of lower
real interest rates on the economy, and hence on
the monetary policy outlook, would be possible
after the July inflation and GDP projection.
The Council decided to keep the NBP interest rates
unchanged: the reference rate at 1.50%, the
lombard rate at 2.50%, the deposit rate at 0.50%, the
rediscount rate at 1.75%.
Minutes of the Monetary Policy Council decision-
making meeting held on 17 May 2017
Members of the Monetary Policy Council discussed
monetary policy against the background of current
and future macroeconomic developments in
Poland and abroad.
The Council reviewed the developments abroad
which affect economic conditions in Poland.
Further signs of global recovery, particularly in
industry and international trade, were observed. It
was noted that in the euro area economic recovery
continued, albeit still at a moderate pace, and that
investment growth was estimated to decelerate in
2017 Q1. It was stressed that sentiment indicators
in the euro area had improved substantially in
recent months, which, however, had not yet been
fully reflected in data on economic activity. The
decline in the 2017 Q1 growth rate in the United
States was also cited, with an emphasis on its
temporary nature. The Council members also
pointed to an unexpected pick-up in the GDP
growth rate in China, yet stressed that the latest
data did not indicate a sustained acceleration of
growth in this economy.
With reference to price developments abroad, it
was observed that in many countries the annual
inflation rates were markedly higher than in 2016.
Yet, it was emphasised that a bulk of the increase
had taken place in early 2017, while more recently
inflation had stabilised. It was assessed, however,
that this had resulted mainly from fading effects of
the earlier rise in energy commodity prices, which
had been propping up the annual price growth
rates over preceding months. A decrease in energy
commodity prices since the previous Council
meeting was cited in this context. During
3. Monetary policy in March – July 2017
39
discussion on inflation, it was stressed that in many
economies, including the euro area, wage growth
was still moderate, and inflation expectations were
low.
Turning to monetary policy abroad, it was pointed
out that the European Central Bank was keeping
the interest rates close to zero, including the
deposit rate below zero, and was continuing its
asset purchase programme. It was also observed
that the Federal Reserve was indicating further
monetary policy tightening. Despite this, it was
emphasised that sentiment in the international
financial markets had been improving, which had
translated into an appreciation of many emerging
market currencies in the period preceding the
Council meeting.
While discussing developments in Poland’s real
economy, the Council members pointed to flash
GDP estimate which had indicated a considerable
rise in the economic growth rate in 2017 Q1. It was
assessed that economic growth was still driven
primarily by increasing consumer demand,
supported by rising employment and wages, good
consumer sentiment and disbursement of child and
social benefits. In the opinion of the Council
members, improving conditions in industry and
construction, confirmed by monthly data, may
indicate that the 2017 Q1 economic growth had also
benefited from a gradual recovery of investment
demand. Some Council members noted that the
pick-up in the annual GDP growth rate could result
in part from a statistical base effect. In this context,
they pointed to a downward revision to GDP
growth data for 2016.
In the Council’s opinion, in the coming quarters
GDP growth should be supported by further
investment recovery amid rising inflow of EU
funds, along with stable consumer growth. At the
same time, exports should continue to rise rapidly,
propped up by economic recovery abroad. As a
result, GDP growth in 2017 should be markedly
higher than in 2016. The Council members stressed
that a more comprehensive assessment of Poland’s
economic outlook for the coming quarters would
be possible after becoming acquainted with NBP’s
July projection of GDP.
When analysing inflation developments in Poland,
it was stressed that annual growth in consumer
prices had stabilised at a moderate level following
a significant rise at the beginning of 2017. As
certain Council members underlined, inflation had
stabilised somewhat earlier than expected. It was
judged that this had resulted from fading effects of
the previous increases in global commodity prices.
At the same time, it was underlined that core
inflation, though gradually increasing, remained
low.
Certain Council members pointed to a rise in prices
for services, which had been contributing to the
increase in core inflation. Moreover, these Council
members indicated that in 2017 Q1 labour costs
were playing an increasingly important role in
price developments. They also drew attention to a
significant rise in the annual producer price growth
rate over recent months.
However, other Council members emphasised that,
despite higher wage growth in 2017 Q1, growth in
unit labour costs was still moderate, amid rising
labour productivity. It was also stressed that the
increase in the annual producer price growth rate
in February and March 2017 resulted from a low
reference base.
The majority of the Council members assessed that
in the coming quarters inflation would remain
moderate. They judged that this would be
supported by only a gradual rise in domestic
inflationary pressure related to improving
economic conditions in Poland, together with a fall
in the annual growth rate of energy and food prices
resulting from fading effects of the earlier increase
in commodity prices. However, certain Council
Inflation Report – July 2017
40
members assessed that inflation in the coming
quarters could turn out to be higher than currently
forecast. In their opinion, the risk that the wage
pressure might intensify had grown over recent
months. According to these Council members,
upside risks might stem from lower immigration to
Poland following the EU visa liberalisation with
Ukraine and a possible decrease in the labour force
participation rate after the introduction of lower
retirement age. Moreover, certain Council members
indicated that adverse weather conditions in the
period preceding the Council meeting could
translate into an increase in the food price growth
rate in Poland.
While discussing NBP monetary policy, the
Council decided that the interest rates should
remain unchanged. The Council assessed that,
despite improving economic conditions and good
labour market conditions, inflationary pressure
was limited and there were no imbalances building
up in the economy. At the same time, the available
forecasts indicate that inflation will remain
moderate in the coming quarters. Therefore, in the
Council's assessment, the risk of inflation running
persistently above the target in the medium term is
limited.
The majority of the Council members assessed that
stabilisation of the NBP interest rates was likely in
the following quarters, since – given the available
information – it had been helping to keep the
Polish economy on a sustainable growth path and
maintain macroeconomic balance.
In the opinion of certain Council members, should
data and forecasts incoming in the following
quarters suggest stronger inflationary pressure
than expected at the time of the meeting, it might
be justified to consider an increase in the NBP
interest rates.
The Council members concluded that a more
comprehensive assessment of the monetary policy
outlook would be possible after becoming
acquainted with the incoming NBP’s inflation and
GDP projections.
The Council decided to keep the NBP interest rates
unchanged: the reference rate at 1.50%, the
lombard rate at 2.50%, the deposit rate at 0.50%, the
rediscount rate at 1.75%.
Minutes of the Monetary Policy Council decision-
making meeting held on 7 June 2017
Members of the Monetary Policy Council discussed
macroeconomic developments abroad analysing
their impact on economic conditions in Poland.
Further signs of strengthening in global activity
were indicated, particularly in industry and
international trade. It was noted that the euro area
recovery continued, as confirmed by an
improvement in many economic activity indicators.
However, certain Council members pointed out
that despite better economic conditions in the euro
area, growth in this economy remained relatively
weak. The divergence of both current and
prospective GDP growth rates among the euro area
countries was also underlined. While discussing
economic developments in other countries,
attention was drawn to the slowdown in the 2017
Q1 GDP growth rate in the United States, with an
emphasis on its temporary nature. At the same
time, it was stressed that current data had slightly
increased uncertainty about the pace of the pick up
in the US economic activity in the coming quarters.
It was also pointed out that in China, after a rise in
GDP growth rate in 2017 Q1, current data did not
indicate a sustained acceleration in economic
activity, amid reinforced concerns about rising
imbalances in the Chinese economy.
With reference to price developments abroad, it
was emphasised that despite ongoing global
recovery, inflation had stabilised at a moderate
level or even slightly declined in some countries. It
was judged that this had primarily resulted from
3. Monetary policy in March – July 2017
41
the fading effects of the earlier rise in commodity
prices, alongside still low domestic inflationary
pressure in many countries. At the same time,
attention was drawn to the fall in energy
commodity prices since the previous Council
meeting. In particular, it was indicated that despite
the extension of the OPEC countries agreement on
restrictions in oil production, oil prices had been
lower than in recent months. This was the result of
the increased extraction of shale gas in the United
States and the still high stocks of this commodity.
In the opinion of certain Council members,
geopolitical factors related to increased tensions in
the Middle East might have some impact on the
energy commodity prices in the coming quarters.
During the discussion on monetary policy abroad,
it was pointed out that the European Central Bank
– amid still weak domestic inflationary pressure
despite economic recovery – was keeping interest
rates close to zero, including the deposit rate below
zero, and was continuing its asset purchase
programme. It was also observed that the Federal
Reserve was continuing monetary policy
tightening, signalling further interest rate increases
and the possibility of decreasing its reinvestment of
the principle payments from securities in the
coming quarters.
Turning to situation in the international financial
markets, it was emphasised that the sentiment in
these markets had clearly improved since the
beginning of the year, which was translated into an
inflow of portfolio capital to many emerging
economies and an appreciation of their currencies.
Attention was also drawn to the relatively high
equity prices in the largest markets and their
historically low volatility, which could reflect low
risk aversion of investors.
While discussing developments in Poland's real
economy, the Council members stressed that GDP
data indicated a marked acceleration in economic
growth in 2017 Q1. It was emphasised that growth
continued to be driven primarily by increasing
consumer demand, supported by rising
employment and wages, very good consumer
sentiment and disbursement of child and social
benefits. At the same time, it was pointed out that
investment growth rate in 2017 Q1 had been close
to zero. As a consequence, as certain Council
members stressed, the ratio of investment to GDP
remained at a historically low level. Certain
Council members judged that if investment growth
stayed low, it would reduce the growth of potential
output.
When referring to the monthly data on domestic
economic activity, it was pointed out that in April a
fall in industrial output as well as a slowdown in
both construction and assembly output and retail
sales were recorded, which, however, partly
resulted from the lower number of working days
than a year ago. At the same time, attention was
drawn to the weakening of some leading economic
indicators. The Council members judged that the
recent data – though somewhat softer than
expected – signalled stable economic growth in
2017 Q2. The Council members emphasised that
economic growth in the coming quarters would be
supported by the increased inflow of EU funds,
translating into higher public investment. Certain
Council members pointed out that a marked
increase in public investment, along with a high
degree of capacity utilisation, very good financial
results of firms and growing domestic and foreign
demand, should also boost the recovery in private
sector investment activity. The Council members
underlined that a more comprehensive assessment
of Poland’s economic outlook for the coming
quarters would be possible after becoming
acquainted with NBP’s July projection of GDP.
When analysing inflation developments in Poland,
it was underlined that annual growth of consumer
prices remained moderate. At the same time, it was
emphasised that core inflation, albeit gradually
increasing, remained low. In addition, certain
Inflation Report – July 2017
42
Council members drew attention to the higher
growth in prices of services, which signals, in their
opinion, the rising impact of the improvement in
domestic economic conditions on consumer prices.
The Council members assessed that in the coming
quarters consumer price inflation would remain
moderate. They judged that this would be
supported by the fading effects of the earlier
increase in global commodity prices, with only a
gradual rise in domestic inflationary pressure
related to improving economic conditions in
Poland. At the same time, it was stressed that wage
growth in enterprises, despite the observed wage
pressure amid historically low unemployment,
recently had not picked up markedly. It was
indicated that, as a result, growth of the unit labour
costs remained moderate owing also to continued
labour productivity growth. However, according to
certain Council members, in the coming quarters
wage growth could increase due to the possibly
lower migration to Poland after the lifting of visas
for Ukrainian citizens by the EU, and also a
possible decrease in the labour force participation
in Poland following the introduction of lower
retirement age. Moreover, certain Council members
did not rule out that a recovery could translate into
stronger growth of core inflation than currently
forecasted.
While discussing NBP monetary policy, the
Council decided that interest rates should remain
unchanged. The Council assessed that, despite
favourable economic conditions and good labour
market conditions, inflationary pressure remained
limited and there were no imbalances building up
in the economy. At the same time, available
forecasts indicate that inflation will remain
moderate in the coming quarters. Therefore, in the
Council's assessment, the risk of inflation running
persistently above the target in the medium term
was limited.
The majority of the Council members assessed that
stabilisation of the NBP interest rates was likely in
the following quarters, since – given the available
information – it had been helping to keep the
Polish economy on a sustainable growth path and
maintain macroeconomic balance. In addition,
certain Council members argued that the
stabilisation of interest rates would support the
expected recovery in investment.
In the opinion of certain Council members, should
data and forecasts incoming in the following
quarters suggest stronger inflationary pressure
than expected at the time of the meeting, it might
be justified to consider an increase in the NBP
interest rates.
The Council members concluded that a more
comprehensive assessment of the monetary policy
outlook would be possible after becoming
acquainted with the incoming NBP’s inflation and
GDP projections.
The Council decided to keep the NBP interest rates
unchanged: the reference rate at 1.50%, the
lombard rate at 2.50%, the deposit rate at 0.50%, the
rediscount rate at 1.75%.
Information from the meeting of the Monetary
Policy Council held on 4-5 July 2017
The Council decided to keep the NBP interest rates
unchanged: reference rate at 1.50%; lombard rate at
2.50%; deposit rate at 0.50%; rediscount rate at
1.75%.
Signs of improvement in the global economy are
strengthening. In the euro area, data indicate an
ongoing recovery driven by rising consumption
and investment. In the United States, after a
temporary decline, GDP growth probably picked
up in 2017 Q2. In turn, in China current data point
to a deceleration of economic growth in 2017 Q2.
Despite continuing global recovery, inflation
abroad remains moderate, on the back of the fading
3. Monetary policy in March – July 2017
43
effects of an earlier increase in commodity prices
and stable oil prices, alongside low domestic
inflationary pressure in many countries.
The European Central Bank keeps interest rates
close to zero, including the deposit rate below zero.
The ECB continues its asset purchase programme.
The US Federal Reserve gradually tightens its
monetary policy by raising interest rates.
In Poland, monthly data on economic activity
indicate stable GDP growth in 2017 Q2. Growth is
still driven primarily by increasing consumer
demand, supported by rising employment and
wages, disbursement of benefits and very good
consumer sentiment. At the same time, data on
industrial production and construction output, as
well as leading economic indicators, suggest a
continuation of favourable trends in the corporate
sector. Together with the expected increase in the
absorption of EU funds, this should support
recovery in investment in the coming quarters.
The annual growth in prices of consumer goods
and services remains at a moderate level, while
core inflation, though gradually increasing, is still
low. Growth in unit labour costs also remains
moderate.
In the Council's opinion, in the following quarters
inflation will remain moderate amid fading effects
of the past increase in global commodity prices,
with only a gradual rise in domestic inflationary
pressure stemming from improving domestic
economic conditions. In consequence, the risk of
inflation running persistently above the target in
the medium term is limited.
Such an assessment is supported by the results of
the July projection of inflation and GDP, prepared
by the Economic Analysis Department under the
assumption of unchanged NBP interest rates. In
line with the July projection based on the
NECMOD model, there is a 50-percent probability
that the annual price growth will be in the range of
1.6 – 2.3% in 2017 (against 1.6 – 2.5% in the March
2017 projection), 1.1 – 2.9% in 2018 (compared to
0.9 – 2.9%) and 1.3 – 3.6% in 2019 (compared to 1.2
– 3.5%). The annual GDP growth – according to
this projection – will be with a 50-percent
probability in the range of 3.4 – 4.7% in 2017
(against 3.4 – 4.0% in the March 2017 projection),
2.5 – 4.5% in 2018 (compared to 2.4 – 4.5%) and 2.3
– 4.3% in 2019 (compared to 2.3 – 4.4%).
The Council confirms its assessment that, given the
available data and forecasts, the current level of
interest rates is conducive to keeping the Polish
economy on the sustainable growth path and
maintaining macroeconomic balance.
The Council adopted Inflation Report – July 2017.

Inflation Report – July 2017
44
4. Projection of inflation and GDP
45
Projection of inflation and GDP 4
This inflation and GDP projection was prepared by the Economic Analysis Department of
Narodowy Bank Polski and presents a forecasted of economic developments under the
assumption of the unchanged NBP interest rates. In terms of the contents, work involved in the
creation of this projection was supervised by Piotr Szpunar, Director of the Economic Analysis
Department. The process was coordinated by the Macroeconomic Forecasts Division of the
Economic Analysis Department. Using the macroeconomic model NECMOD,52 the projection was
prepared as the outcome of an iterative process, in the course of which the paths of some variables
were adjusted if they diverged from NBP experts’ economic intuition based on their knowledge of
economic processes. The Management Board of NBP approved the projection to be submitted to
the Monetary Policy Council. The projection constitutes one of the inputs to the Monetary Policy
Council's decision-making process concerning the NBP interest rates.
The July projection based on the NECMOD model covers the period from 2017 Q2 to 2019 Q4. The
starting point for the projection is 2017 Q1.
The cut-off date for the data used in this Projection is 14 June 2017.
52 Current version of the documentation of the model is available at the NBP website
http://www.nbp.pl/homen.aspx?f=/en/publikacje/raport_inflacja/necmod.html
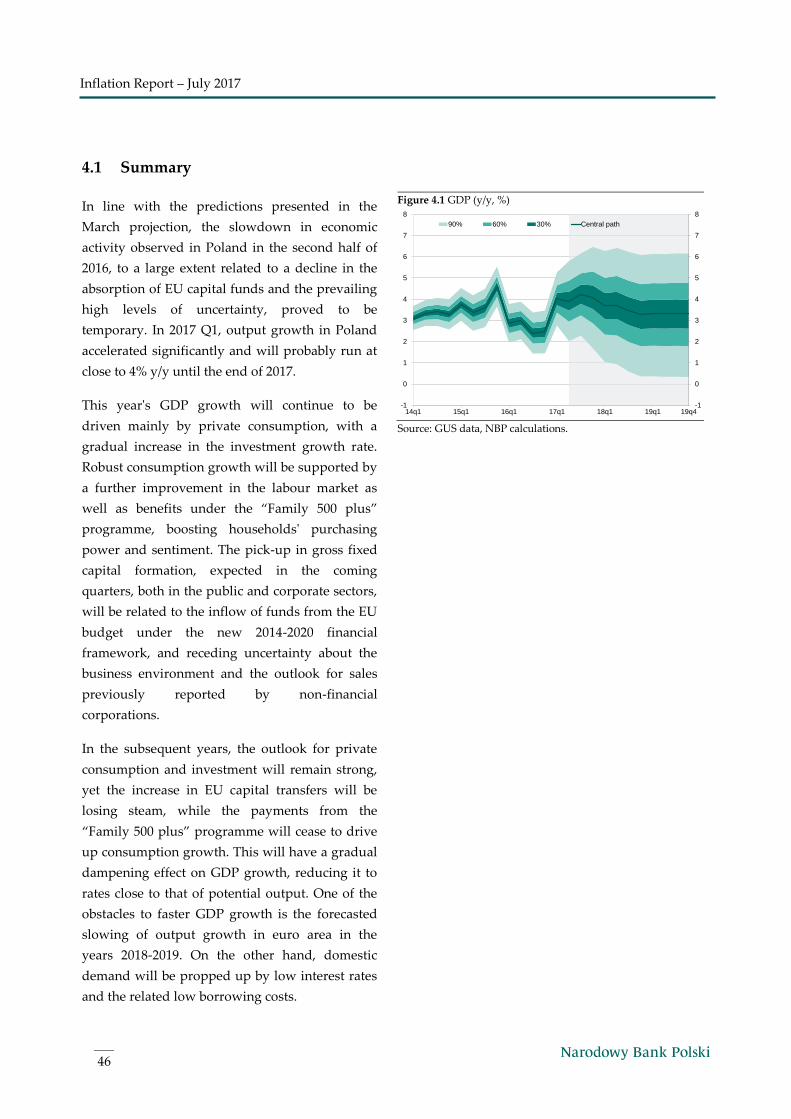
Inflation Report – July 2017
46
4.1 Summary
In line with the predictions presented in the
March projection, the slowdown in economic
activity observed in Poland in the second half of
2016, to a large extent related to a decline in the
absorption of EU capital funds and the prevailing
high levels of uncertainty, proved to be
temporary. In 2017 Q1, output growth in Poland
accelerated significantly and will probably run at
close to 4% y/y until the end of 2017.
This year's GDP growth will continue to be
driven mainly by private consumption, with a
gradual increase in the investment growth rate.
Robust consumption growth will be supported by
a further improvement in the labour market as
well as benefits under the “Family 500 plus”
programme, boosting households' purchasing
power and sentiment. The pick-up in gross fixed
capital formation, expected in the coming
quarters, both in the public and corporate sectors,
will be related to the inflow of funds from the EU
budget under the new 2014-2020 financial
framework, and receding uncertainty about the
business environment and the outlook for sales
previously reported by non-financial
corporations.
In the subsequent years, the outlook for private
consumption and investment will remain strong,
yet the increase in EU capital transfers will be
losing steam, while the payments from the
“Family 500 plus” programme will cease to drive
up consumption growth. This will have a gradual
dampening effect on GDP growth, reducing it to
rates close to that of potential output. One of the
obstacles to faster GDP growth is the forecasted
slowing of output growth in euro area in the
years 2018-2019. On the other hand, domestic
demand will be propped up by low interest rates
and the related low borrowing costs.
Figure 4.1 GDP (y/y, %)
Source: GUS data, NBP calculations.
-1
0
1
2
3
4
5
6
7
8
-1
0
1
2
3
4
5
6
7
8
14q1 15q1 16q1 17q1 18q1 19q1 19q4
90% 60% 30% Central path
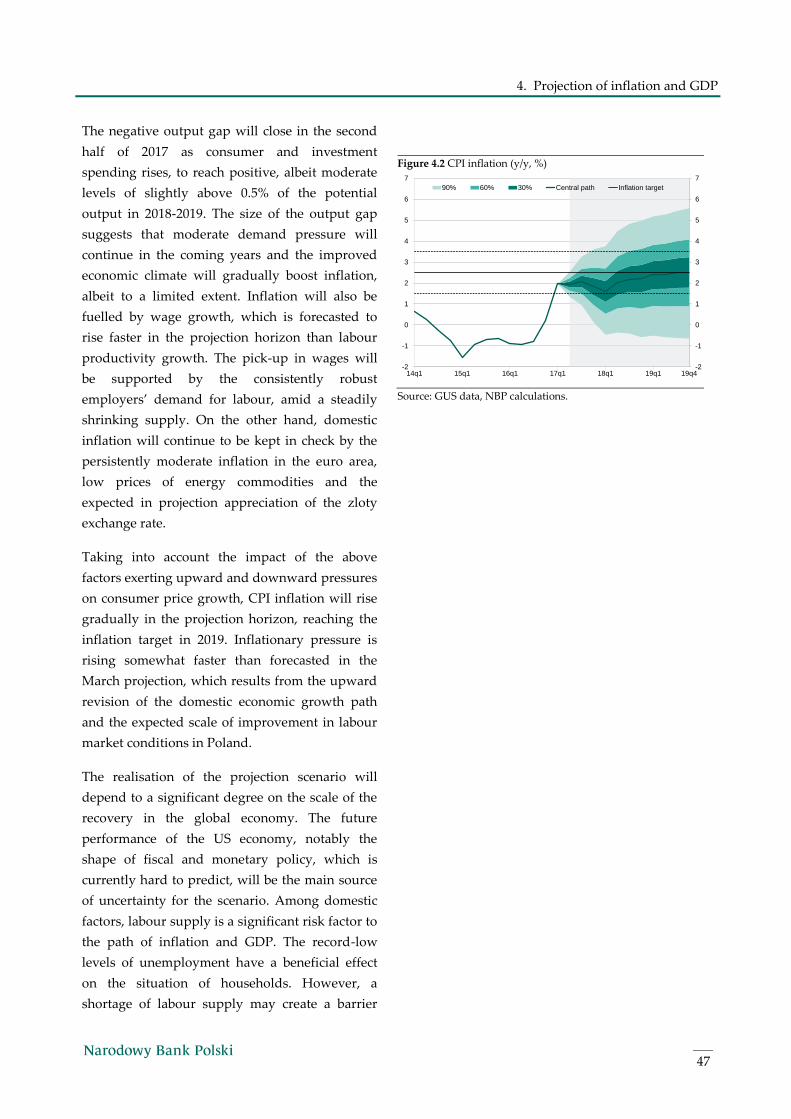
4. Projection of inflation and GDP
47
The negative output gap will close in the second
half of 2017 as consumer and investment
spending rises, to reach positive, albeit moderate
levels of slightly above 0.5% of the potential
output in 2018-2019. The size of the output gap
suggests that moderate demand pressure will
continue in the coming years and the improved
economic climate will gradually boost inflation,
albeit to a limited extent. Inflation will also be
fuelled by wage growth, which is forecasted to
rise faster in the projection horizon than labour
productivity growth. The pick-up in wages will
be supported by the consistently robust
employers’ demand for labour, amid a steadily
shrinking supply. On the other hand, domestic
inflation will continue to be kept in check by the
persistently moderate inflation in the euro area,
low prices of energy commodities and the
expected in projection appreciation of the zloty
exchange rate.
Taking into account the impact of the above
factors exerting upward and downward pressures
on consumer price growth, CPI inflation will rise
gradually in the projection horizon, reaching the
inflation target in 2019. Inflationary pressure is
rising somewhat faster than forecasted in the
March projection, which results from the upward
revision of the domestic economic growth path
and the expected scale of improvement in labour
market conditions in Poland.
The realisation of the projection scenario will
depend to a significant degree on the scale of the
recovery in the global economy. The future
performance of the US economy, notably the
shape of fiscal and monetary policy, which is
currently hard to predict, will be the main source
of uncertainty for the scenario. Among domestic
factors, labour supply is a significant risk factor to
the path of inflation and GDP. The record-low
levels of unemployment have a beneficial effect
on the situation of households. However, a
shortage of labour supply may create a barrier
Figure 4.2 CPI inflation (y/y, %)
Source: GUS data, NBP calculations.
-2
-1
0
1
2
3
4
5
6
7
-2
-1
0
1
2
3
4
5
6
7
14q1 15q1 16q1 17q1 18q1 19q1 19q4
90% 60% 30% Central path Inflation target
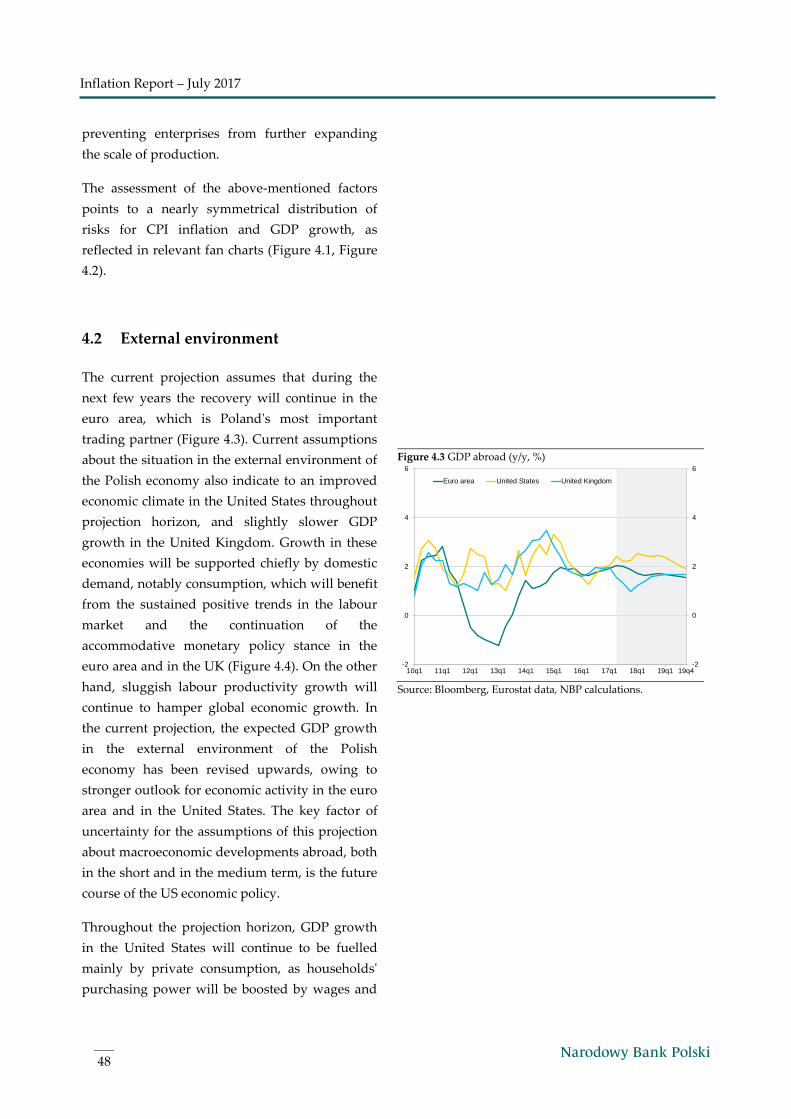
Inflation Report – July 2017
48
preventing enterprises from further expanding
the scale of production.
The assessment of the above-mentioned factors
points to a nearly symmetrical distribution of
risks for CPI inflation and GDP growth, as
reflected in relevant fan charts (Figure 4.1, Figure
4.2).
4.2 External environment
The current projection assumes that during the
next few years the recovery will continue in the
euro area, which is Poland's most important
trading partner (Figure 4.3). Current assumptions
about the situation in the external environment of
the Polish economy also indicate to an improved
economic climate in the United States throughout
projection horizon, and slightly slower GDP
growth in the United Kingdom. Growth in these
economies will be supported chiefly by domestic
demand, notably consumption, which will benefit
from the sustained positive trends in the labour
market and the continuation of the
accommodative monetary policy stance in the
euro area and in the UK (Figure 4.4). On the other
hand, sluggish labour productivity growth will
continue to hamper global economic growth. In
the current projection, the expected GDP growth
in the external environment of the Polish
economy has been revised upwards, owing to
stronger outlook for economic activity in the euro
area and in the United States. The key factor of
uncertainty for the assumptions of this projection
about macroeconomic developments abroad, both
in the short and in the medium term, is the future
course of the US economic policy.
Throughout the projection horizon, GDP growth
in the United States will continue to be fuelled
mainly by private consumption, as households'
purchasing power will be boosted by wages and
Figure 4.3 GDP abroad (y/y, %)
Source: Bloomberg, Eurostat data, NBP calculations.
-2
0
2
4
6
-2
0
2
4
6
10q1 11q1 12q1 13q1 14q1 15q1 16q1 17q1 18q1 19q1 19q4
Euro area United States United Kingdom
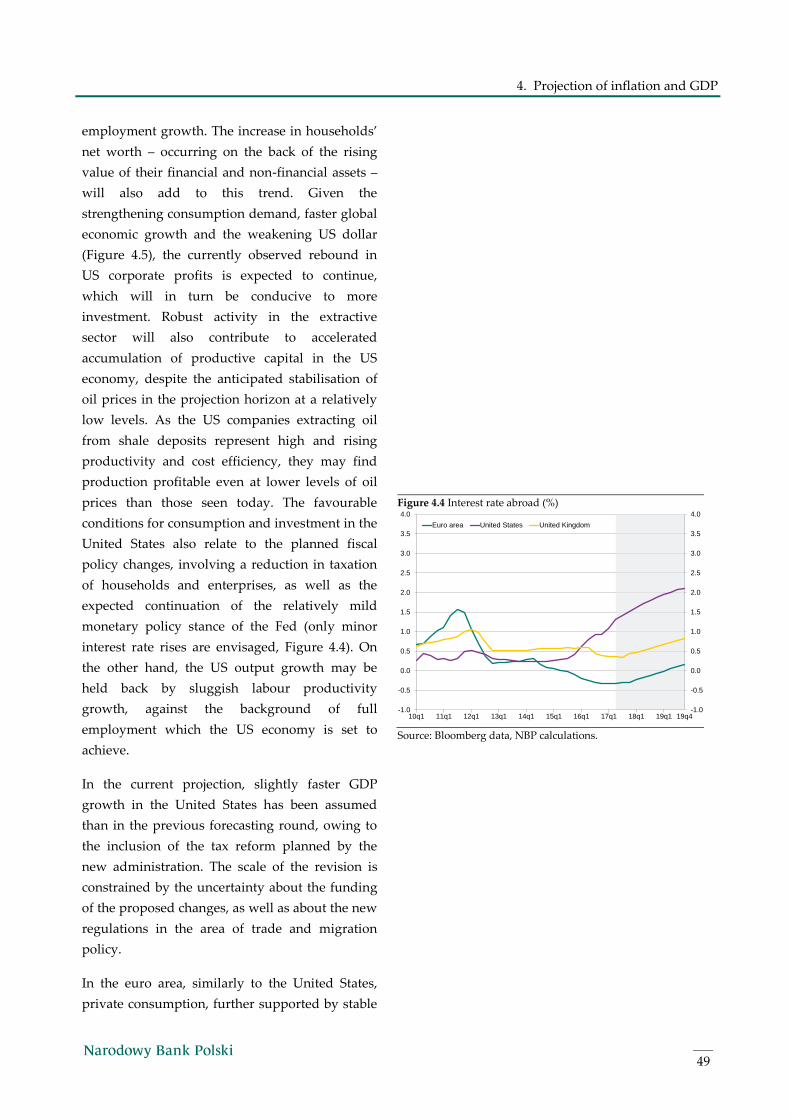
4. Projection of inflation and GDP
49
employment growth. The increase in households’
net worth – occurring on the back of the rising
value of their financial and non-financial assets –
will also add to this trend. Given the
strengthening consumption demand, faster global
economic growth and the weakening US dollar
(Figure 4.5), the currently observed rebound in
US corporate profits is expected to continue,
which will in turn be conducive to more
investment. Robust activity in the extractive
sector will also contribute to accelerated
accumulation of productive capital in the US
economy, despite the anticipated stabilisation of
oil prices in the projection horizon at a relatively
low levels. As the US companies extracting oil
from shale deposits represent high and rising
productivity and cost efficiency, they may find
production profitable even at lower levels of oil
prices than those seen today. The favourable
conditions for consumption and investment in the
United States also relate to the planned fiscal
policy changes, involving a reduction in taxation
of households and enterprises, as well as the
expected continuation of the relatively mild
monetary policy stance of the Fed (only minor
interest rate rises are envisaged, Figure 4.4). On
the other hand, the US output growth may be
held back by sluggish labour productivity
growth, against the background of full
employment which the US economy is set to
achieve.
In the current projection, slightly faster GDP
growth in the United States has been assumed
than in the previous forecasting round, owing to
the inclusion of the tax reform planned by the
new administration. The scale of the revision is
constrained by the uncertainty about the funding
of the proposed changes, as well as about the new
regulations in the area of trade and migration
policy.
In the euro area, similarly to the United States,
private consumption, further supported by stable
Figure 4.4 Interest rate abroad (%)
Source: Bloomberg data, NBP calculations.
-1.0
-0.5
0.0
0.5
1.0
1.5
2.0
2.5
3.0
3.5
4.0
-1.0
-0.5
0.0
0.5
1.0
1.5
2.0
2.5
3.0
3.5
4.0
10q1 11q1 12q1 13q1 14q1 15q1 16q1 17q1 18q1 19q1 19q4
Euro area United States United Kingdom
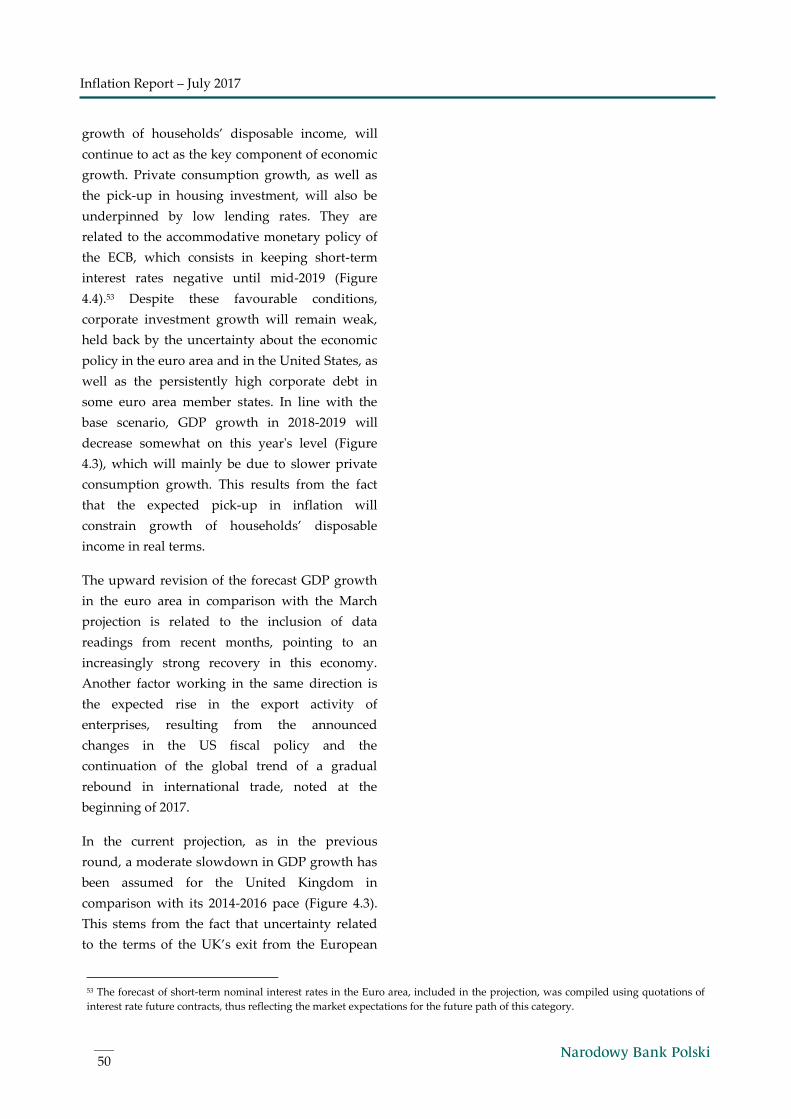
Inflation Report – July 2017
50
growth of households’ disposable income, will
continue to act as the key component of economic
growth. Private consumption growth, as well as
the pick-up in housing investment, will also be
underpinned by low lending rates. They are
related to the accommodative monetary policy of
the ECB, which consists in keeping short-term
interest rates negative until mid-2019 (Figure
4.4).53 Despite these favourable conditions,
corporate investment growth will remain weak,
held back by the uncertainty about the economic
policy in the euro area and in the United States, as
well as the persistently high corporate debt in
some euro area member states. In line with the
base scenario, GDP growth in 2018-2019 will
decrease somewhat on this year's level (Figure
4.3), which will mainly be due to slower private
consumption growth. This results from the fact
that the expected pick-up in inflation will
constrain growth of households’ disposable
income in real terms.
The upward revision of the forecast GDP growth
in the euro area in comparison with the March
projection is related to the inclusion of data
readings from recent months, pointing to an
increasingly strong recovery in this economy.
Another factor working in the same direction is
the expected rise in the export activity of
enterprises, resulting from the announced
changes in the US fiscal policy and the
continuation of the global trend of a gradual
rebound in international trade, noted at the
beginning of 2017.
In the current projection, as in the previous
round, a moderate slowdown in GDP growth has
been assumed for the United Kingdom in
comparison with its 2014-2016 pace (Figure 4.3).
This stems from the fact that uncertainty related
to the terms of the UK’s exit from the European
53 The forecast of short-term nominal interest rates in the Euro area, included in the projection, was compiled using quotations of
interest rate future contracts, thus reflecting the market expectations for the future path of this category.
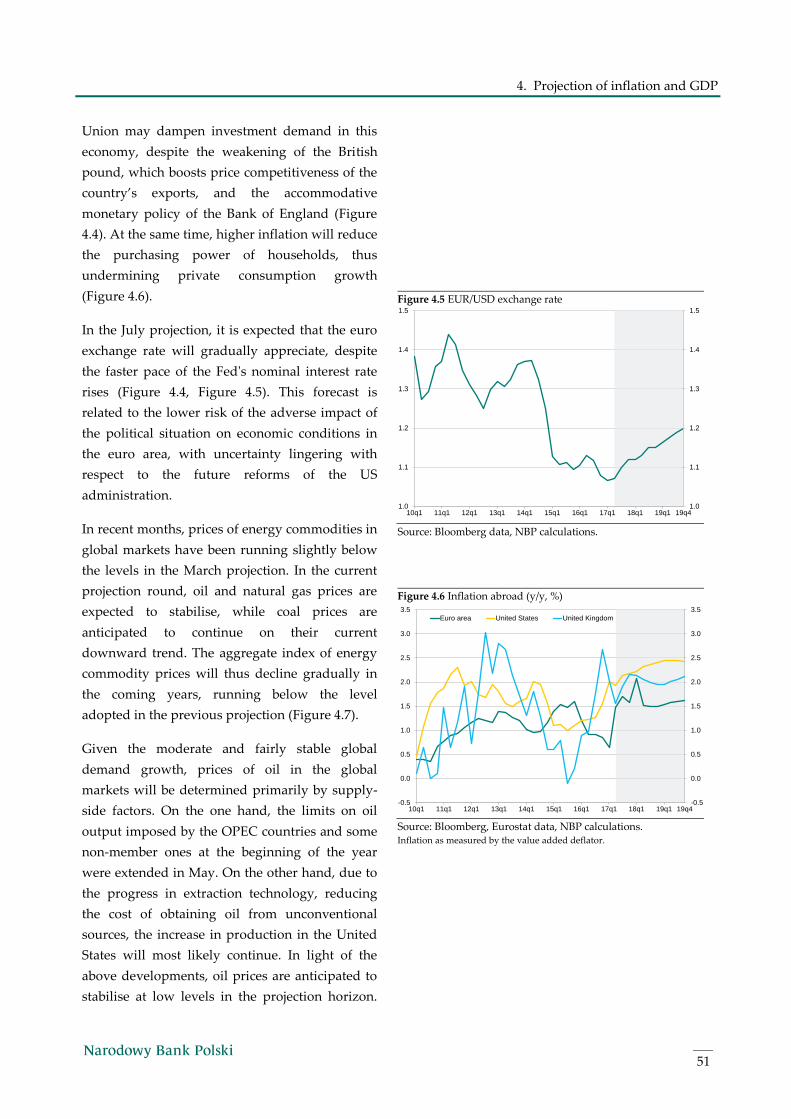
4. Projection of inflation and GDP
51
Union may dampen investment demand in this
economy, despite the weakening of the British
pound, which boosts price competitiveness of the
country’s exports, and the accommodative
monetary policy of the Bank of England (Figure
4.4). At the same time, higher inflation will reduce
the purchasing power of households, thus
undermining private consumption growth
(Figure 4.6).
In the July projection, it is expected that the euro
exchange rate will gradually appreciate, despite
the faster pace of the Fed's nominal interest rate
rises (Figure 4.4, Figure 4.5). This forecast is
related to the lower risk of the adverse impact of
the political situation on economic conditions in
the euro area, with uncertainty lingering with
respect to the future reforms of the US
administration.
In recent months, prices of energy commodities in
global markets have been running slightly below
the levels in the March projection. In the current
projection round, oil and natural gas prices are
expected to stabilise, while coal prices are
anticipated to continue on their current
downward trend. The aggregate index of energy
commodity prices will thus decline gradually in
the coming years, running below the level
adopted in the previous projection (Figure 4.7).
Given the moderate and fairly stable global
demand growth, prices of oil in the global
markets will be determined primarily by supply-
side factors. On the one hand, the limits on oil
output imposed by the OPEC countries and some
non-member ones at the beginning of the year
were extended in May. On the other hand, due to
the progress in extraction technology, reducing
the cost of obtaining oil from unconventional
sources, the increase in production in the United
States will most likely continue. In light of the
above developments, oil prices are anticipated to
stabilise at low levels in the projection horizon.
Figure 4.5 EUR/USD exchange rate
Source: Bloomberg data, NBP calculations.
Figure 4.6 Inflation abroad (y/y, %)
Source: Bloomberg, Eurostat data, NBP calculations. Inflation as measured by the value added deflator.
1.0
1.1
1.2
1.3
1.4
1.5
1.0
1.1
1.2
1.3
1.4
1.5
10q1 11q1 12q1 13q1 14q1 15q1 16q1 17q1 18q1 19q1 19q4
-0.5
0.0
0.5
1.0
1.5
2.0
2.5
3.0
3.5
-0.5
0.0
0.5
1.0
1.5
2.0
2.5
3.0
3.5
10q1 11q1 12q1 13q1 14q1 15q1 16q1 17q1 18q1 19q1 19q4
Euro area United States United Kingdom
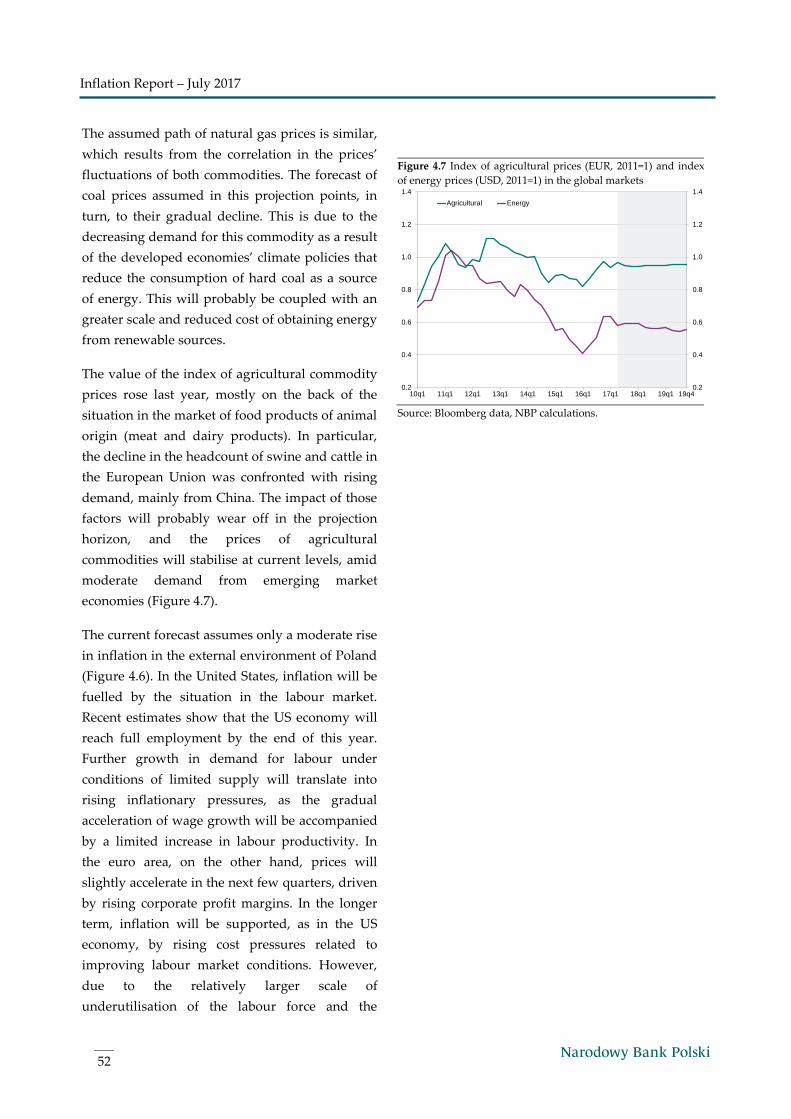
Inflation Report – July 2017
52
The assumed path of natural gas prices is similar,
which results from the correlation in the prices’
fluctuations of both commodities. The forecast of
coal prices assumed in this projection points, in
turn, to their gradual decline. This is due to the
decreasing demand for this commodity as a result
of the developed economies’ climate policies that
reduce the consumption of hard coal as a source
of energy. This will probably be coupled with an
greater scale and reduced cost of obtaining energy
from renewable sources.
The value of the index of agricultural commodity
prices rose last year, mostly on the back of the
situation in the market of food products of animal
origin (meat and dairy products). In particular,
the decline in the headcount of swine and cattle in
the European Union was confronted with rising
demand, mainly from China. The impact of those
factors will probably wear off in the projection
horizon, and the prices of agricultural
commodities will stabilise at current levels, amid
moderate demand from emerging market
economies (Figure 4.7).
The current forecast assumes only a moderate rise
in inflation in the external environment of Poland
(Figure 4.6). In the United States, inflation will be
fuelled by the situation in the labour market.
Recent estimates show that the US economy will
reach full employment by the end of this year.
Further growth in demand for labour under
conditions of limited supply will translate into
rising inflationary pressures, as the gradual
acceleration of wage growth will be accompanied
by a limited increase in labour productivity. In
the euro area, on the other hand, prices will
slightly accelerate in the next few quarters, driven
by rising corporate profit margins. In the longer
term, inflation will be supported, as in the US
economy, by rising cost pressures related to
improving labour market conditions. However,
due to the relatively larger scale of
underutilisation of the labour force and the
Figure 4.7 Index of agricultural prices (EUR, 2011=1) and index
of energy prices (USD, 2011=1) in the global markets
Source: Bloomberg data, NBP calculations.
0.2
0.4
0.6
0.8
1.0
1.2
1.4
0.2
0.4
0.6
0.8
1.0
1.2
1.4
10q1 11q1 12q1 13q1 14q1 15q1 16q1 17q1 18q1 19q1 19q4
Agricultural Energy
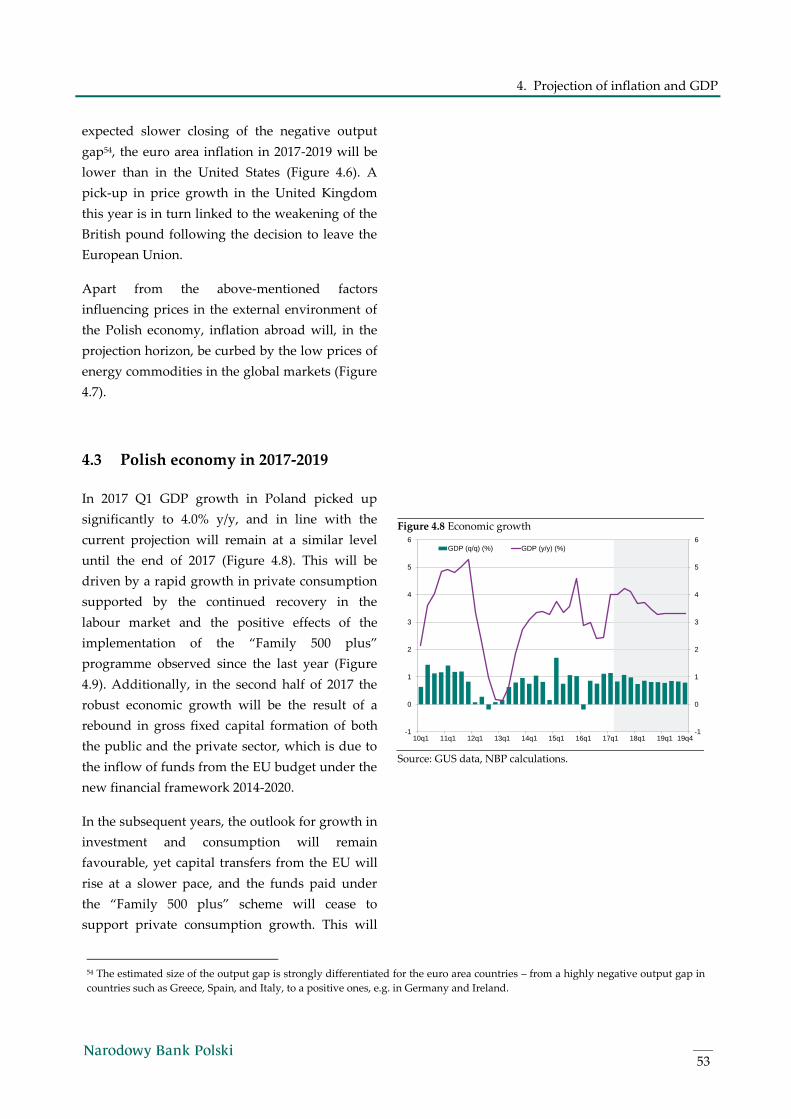
4. Projection of inflation and GDP
53
expected slower closing of the negative output
gap54, the euro area inflation in 2017-2019 will be
lower than in the United States (Figure 4.6). A
pick-up in price growth in the United Kingdom
this year is in turn linked to the weakening of the
British pound following the decision to leave the
European Union.
Apart from the above-mentioned factors
influencing prices in the external environment of
the Polish economy, inflation abroad will, in the
projection horizon, be curbed by the low prices of
energy commodities in the global markets (Figure
4.7).
4.3 Polish economy in 2017-2019
In 2017 Q1 GDP growth in Poland picked up
significantly to 4.0% y/y, and in line with the
current projection will remain at a similar level
until the end of 2017 (Figure 4.8). This will be
driven by a rapid growth in private consumption
supported by the continued recovery in the
labour market and the positive effects of the
implementation of the “Family 500 plus”
programme observed since the last year (Figure
4.9). Additionally, in the second half of 2017 the
robust economic growth will be the result of a
rebound in gross fixed capital formation of both
the public and the private sector, which is due to
the inflow of funds from the EU budget under the
new financial framework 2014-2020.
In the subsequent years, the outlook for growth in
investment and consumption will remain
favourable, yet capital transfers from the EU will
rise at a slower pace, and the funds paid under
the “Family 500 plus” scheme will cease to
support private consumption growth. This will
Figure 4.8 Economic growth
Source: GUS data, NBP calculations.
54 The estimated size of the output gap is strongly differentiated for the euro area countries – from a highly negative output gap in
countries such as Greece, Spain, and Italy, to a positive ones, e.g. in Germany and Ireland.
-1
0
1
2
3
4
5
6
-1
0
1
2
3
4
5
6
10q1 11q1 12q1 13q1 14q1 15q1 16q1 17q1 18q1 19q1 19q4
GDP (q/q) (%) GDP (y/y) (%)
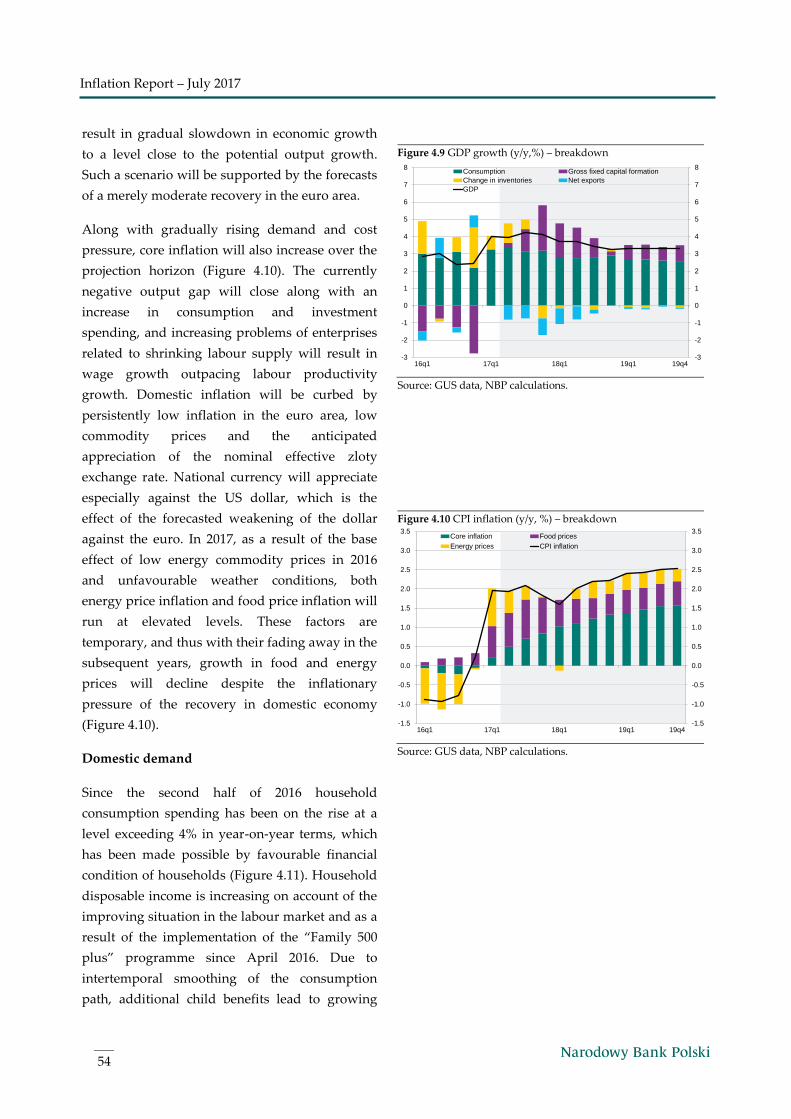
Inflation Report – July 2017
54
result in gradual slowdown in economic growth
to a level close to the potential output growth.
Such a scenario will be supported by the forecasts
of a merely moderate recovery in the euro area.
Along with gradually rising demand and cost
pressure, core inflation will also increase over the
projection horizon (Figure 4.10). The currently
negative output gap will close along with an
increase in consumption and investment
spending, and increasing problems of enterprises
related to shrinking labour supply will result in
wage growth outpacing labour productivity
growth. Domestic inflation will be curbed by
persistently low inflation in the euro area, low
commodity prices and the anticipated
appreciation of the nominal effective zloty
exchange rate. National currency will appreciate
especially against the US dollar, which is the
effect of the forecasted weakening of the dollar
against the euro. In 2017, as a result of the base
effect of low energy commodity prices in 2016
and unfavourable weather conditions, both
energy price inflation and food price inflation will
run at elevated levels. These factors are
temporary, and thus with their fading away in the
subsequent years, growth in food and energy
prices will decline despite the inflationary
pressure of the recovery in domestic economy
(Figure 4.10).
Domestic demand
Since the second half of 2016 household
consumption spending has been on the rise at a
level exceeding 4% in year-on-year terms, which
has been made possible by favourable financial
condition of households (Figure 4.11). Household
disposable income is increasing on account of the
improving situation in the labour market and as a
result of the implementation of the “Family 500
plus” programme since April 2016. Due to
intertemporal smoothing of the consumption
path, additional child benefits lead to growing
Figure 4.9 GDP growth (y/y,%) – breakdown
Source: GUS data, NBP calculations.
Figure 4.10 CPI inflation (y/y, %) – breakdown
Source: GUS data, NBP calculations.
-3
-2
-1
0
1
2
3
4
5
6
7
8
-3
-2
-1
0
1
2
3
4
5
6
7
8
16q1 17q1 18q1 19q1 19q4
Consumption Gross fixed capital formation
Change in inventories Net exports
GDP
-1.5
-1.0
-0.5
0.0
0.5
1.0
1.5
2.0
2.5
3.0
3.5
-1.5
-1.0
-0.5
0.0
0.5
1.0
1.5
2.0
2.5
3.0
3.5
16q1 17q1 18q1 19q1 19q4
Core inflation Food prices
Energy prices CPI inflation
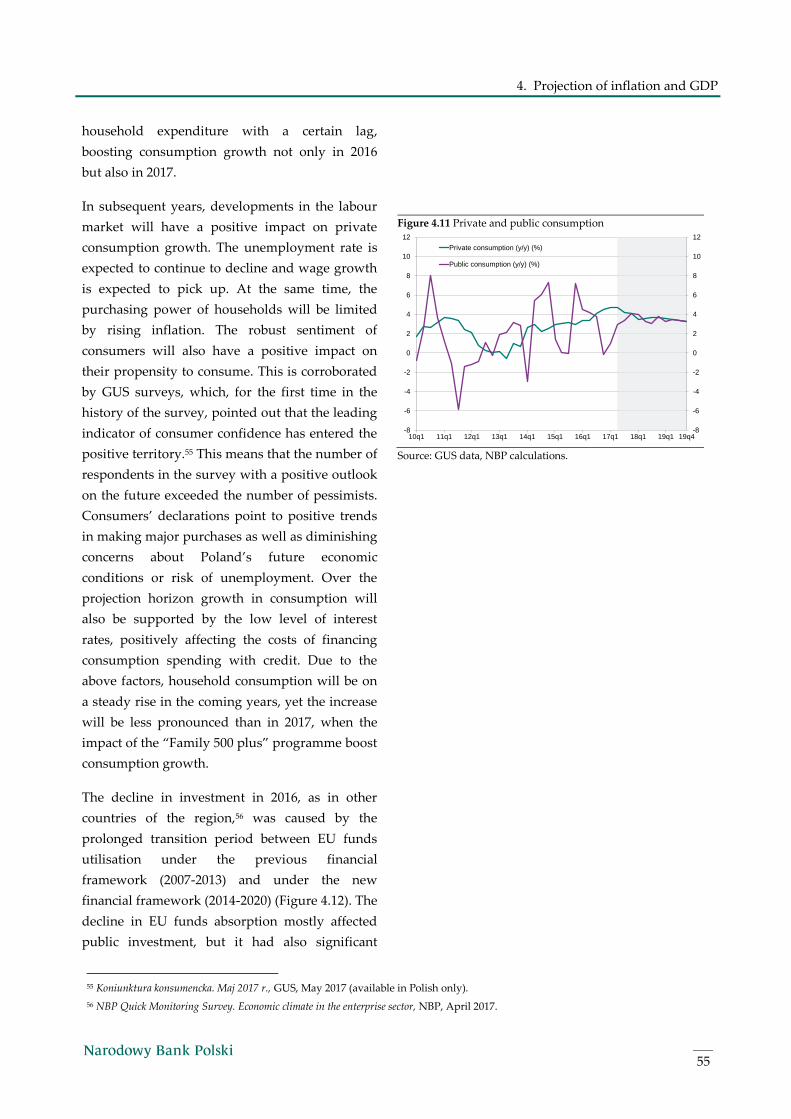
4. Projection of inflation and GDP
55
household expenditure with a certain lag,
boosting consumption growth not only in 2016
but also in 2017.
In subsequent years, developments in the labour
market will have a positive impact on private
consumption growth. The unemployment rate is
expected to continue to decline and wage growth
is expected to pick up. At the same time, the
purchasing power of households will be limited
by rising inflation. The robust sentiment of
consumers will also have a positive impact on
their propensity to consume. This is corroborated
by GUS surveys, which, for the first time in the
history of the survey, pointed out that the leading
indicator of consumer confidence has entered the
positive territory.55 This means that the number of
respondents in the survey with a positive outlook
on the future exceeded the number of pessimists.
Consumers’ declarations point to positive trends
in making major purchases as well as diminishing
concerns about Poland’s future economic
conditions or risk of unemployment. Over the
projection horizon growth in consumption will
also be supported by the low level of interest
rates, positively affecting the costs of financing
consumption spending with credit. Due to the
above factors, household consumption will be on
a steady rise in the coming years, yet the increase
will be less pronounced than in 2017, when the
impact of the “Family 500 plus” programme boost
consumption growth.
The decline in investment in 2016, as in other
countries of the region,56 was caused by the
prolonged transition period between EU funds
utilisation under the previous financial
framework (2007-2013) and under the new
financial framework (2014-2020) (Figure 4.12). The
decline in EU funds absorption mostly affected
public investment, but it had also significant
Figure 4.11 Private and public consumption
Source: GUS data, NBP calculations.
55 Koniunktura konsumencka. Maj 2017 r., GUS, May 2017 (available in Polish only).
56 NBP Quick Monitoring Survey. Economic climate in the enterprise sector, NBP, April 2017.
-8
-6
-4
-2
0
2
4
6
8
10
12
-8
-6
-4
-2
0
2
4
6
8
10
12
10q1 11q1 12q1 13q1 14q1 15q1 16q1 17q1 18q1 19q1 19q4
Private consumption (y/y) (%)
Public consumption (y/y) (%)
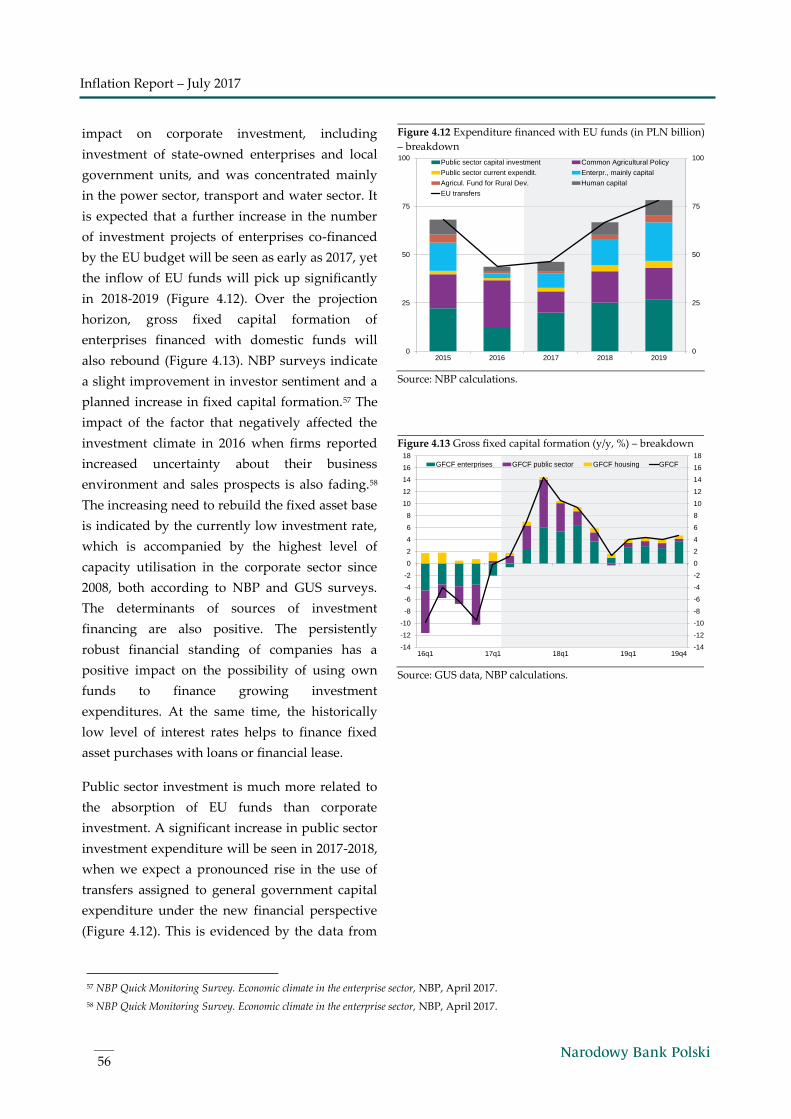
Inflation Report – July 2017
56
impact on corporate investment, including
investment of state-owned enterprises and local
government units, and was concentrated mainly
in the power sector, transport and water sector. It
is expected that a further increase in the number
of investment projects of enterprises co-financed
by the EU budget will be seen as early as 2017, yet
the inflow of EU funds will pick up significantly
in 2018-2019 (Figure 4.12). Over the projection
horizon, gross fixed capital formation of
enterprises financed with domestic funds will
also rebound (Figure 4.13). NBP surveys indicate
a slight improvement in investor sentiment and a
planned increase in fixed capital formation.57 The
impact of the factor that negatively affected the
investment climate in 2016 when firms reported
increased uncertainty about their business
environment and sales prospects is also fading.58
The increasing need to rebuild the fixed asset base
is indicated by the currently low investment rate,
which is accompanied by the highest level of
capacity utilisation in the corporate sector since
2008, both according to NBP and GUS surveys.
The determinants of sources of investment
financing are also positive. The persistently
robust financial standing of companies has a
positive impact on the possibility of using own
funds to finance growing investment
expenditures. At the same time, the historically
low level of interest rates helps to finance fixed
asset purchases with loans or financial lease.
Public sector investment is much more related to
the absorption of EU funds than corporate
investment. A significant increase in public sector
investment expenditure will be seen in 2017-2018,
when we expect a pronounced rise in the use of
transfers assigned to general government capital
expenditure under the new financial perspective
(Figure 4.12). This is evidenced by the data from
Figure 4.12 Expenditure financed with EU funds (in PLN billion)
– breakdown
Source: NBP calculations.
Figure 4.13 Gross fixed capital formation (y/y, %) – breakdown
Source: GUS data, NBP calculations.
57 NBP Quick Monitoring Survey. Economic climate in the enterprise sector, NBP, April 2017.
58 NBP Quick Monitoring Survey. Economic climate in the enterprise sector, NBP, April 2017.
0
25
50
75
100
0
25
50
75
100
2015 2016 2017 2018 2019
Public sector capital investment Common Agricultural Policy
Public sector current expendit. Enterpr., mainly capital
Agricul. Fund for Rural Dev. Human capital
EU transfers
-14
-12
-10
-8
-6
-4
-2
0
2
4
6
8
10
12
14
16
18
-14
-12
-10
-8
-6
-4
-2
0
2
4
6
8
10
12
14
16
18
16q1 17q1 18q1 19q1 19q4
GFCF enterprises GFCF public sector GFCF housing GFCF
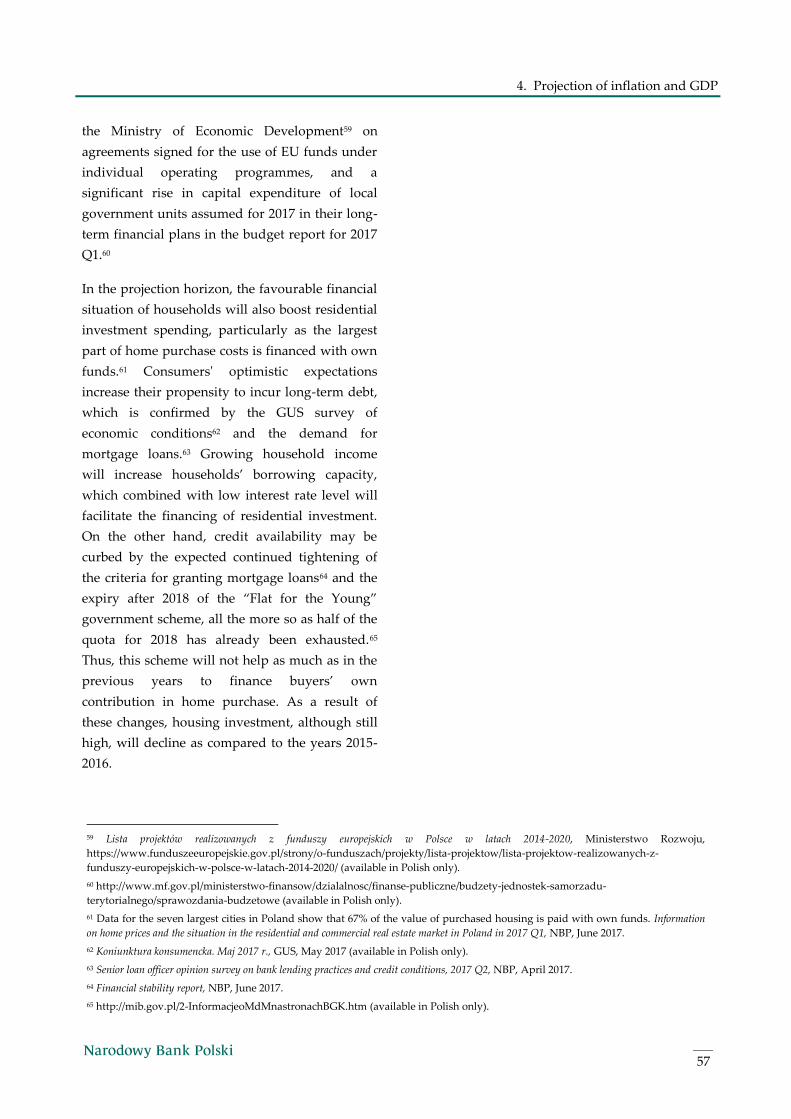
4. Projection of inflation and GDP
57
the Ministry of Economic Development59 on
agreements signed for the use of EU funds under
individual operating programmes, and a
significant rise in capital expenditure of local
government units assumed for 2017 in their long-
term financial plans in the budget report for 2017
Q1.60
In the projection horizon, the favourable financial
situation of households will also boost residential
investment spending, particularly as the largest
part of home purchase costs is financed with own
funds.61 Consumers' optimistic expectations
increase their propensity to incur long-term debt,
which is confirmed by the GUS survey of
economic conditions62 and the demand for
mortgage loans.63 Growing household income
will increase households’ borrowing capacity,
which combined with low interest rate level will
facilitate the financing of residential investment.
On the other hand, credit availability may be
curbed by the expected continued tightening of
the criteria for granting mortgage loans64 and the
expiry after 2018 of the “Flat for the Young”
government scheme, all the more so as half of the
quota for 2018 has already been exhausted.65
Thus, this scheme will not help as much as in the
previous years to finance buyers’ own
contribution in home purchase. As a result of
these changes, housing investment, although still
high, will decline as compared to the years 2015-
2016.
59 Lista projektów realizowanych z funduszy europejskich w Polsce w latach 2014-2020, Ministerstwo Rozwoju,
https://www.funduszeeuropejskie.gov.pl/strony/o-funduszach/projekty/lista-projektow/lista-projektow-realizowanych-z-
funduszy-europejskich-w-polsce-w-latach-2014-2020/ (available in Polish only).
60 http://www.mf.gov.pl/ministerstwo-finansow/dzialalnosc/finanse-publiczne/budzety-jednostek-samorzadu-
terytorialnego/sprawozdania-budzetowe (available in Polish only).
61 Data for the seven largest cities in Poland show that 67% of the value of purchased housing is paid with own funds. Information
on home prices and the situation in the residential and commercial real estate market in Poland in 2017 Q1, NBP, June 2017.
62 Koniunktura konsumencka. Maj 2017 r., GUS, May 2017 (available in Polish only).
63 Senior loan officer opinion survey on bank lending practices and credit conditions, 2017 Q2, NBP, April 2017.
64 Financial stability report, NBP, June 2017.
65 http://mib.gov.pl/2-InformacjeoMdMnastronachBGK.htm (available in Polish only).
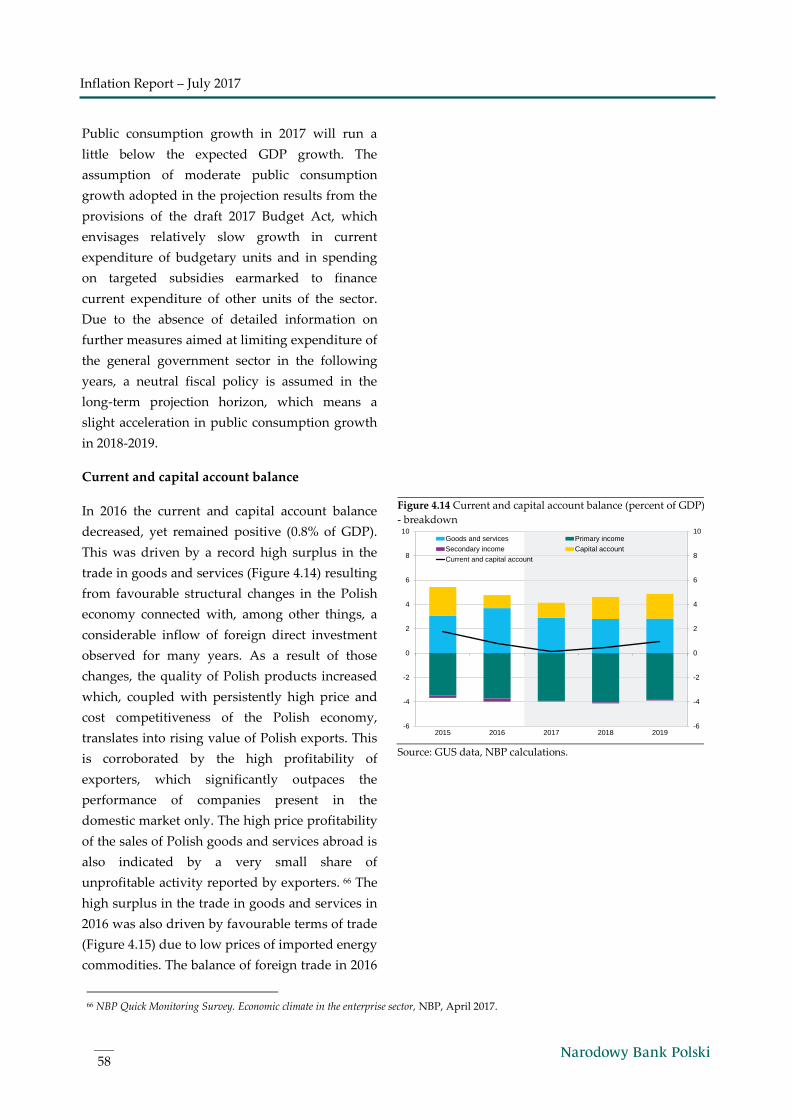
Inflation Report – July 2017
58
Public consumption growth in 2017 will run a
little below the expected GDP growth. The
assumption of moderate public consumption
growth adopted in the projection results from the
provisions of the draft 2017 Budget Act, which
envisages relatively slow growth in current
expenditure of budgetary units and in spending
on targeted subsidies earmarked to finance
current expenditure of other units of the sector.
Due to the absence of detailed information on
further measures aimed at limiting expenditure of
the general government sector in the following
years, a neutral fiscal policy is assumed in the
long-term projection horizon, which means a
slight acceleration in public consumption growth
in 2018-2019.
Current and capital account balance
In 2016 the current and capital account balance
decreased, yet remained positive (0.8% of GDP).
This was driven by a record high surplus in the
trade in goods and services (Figure 4.14) resulting
from favourable structural changes in the Polish
economy connected with, among other things, a
considerable inflow of foreign direct investment
observed for many years. As a result of those
changes, the quality of Polish products increased
which, coupled with persistently high price and
cost competitiveness of the Polish economy,
translates into rising value of Polish exports. This
is corroborated by the high profitability of
exporters, which significantly outpaces the
performance of companies present in the
domestic market only. The high price profitability
of the sales of Polish goods and services abroad is
also indicated by a very small share of
unprofitable activity reported by exporters. 66 The
high surplus in the trade in goods and services in
2016 was also driven by favourable terms of trade
(Figure 4.15) due to low prices of imported energy
commodities. The balance of foreign trade in 2016
Figure 4.14 Current and capital account balance (percent of GDP)
- breakdown
Source: GUS data, NBP calculations.
66 NBP Quick Monitoring Survey. Economic climate in the enterprise sector, NBP, April 2017.
-6
-4
-2
0
2
4
6
8
10
-6
-4
-2
0
2
4
6
8
10
2015 2016 2017 2018 2019
Goods and services Primary income
Secondary income Capital account
Current and capital account
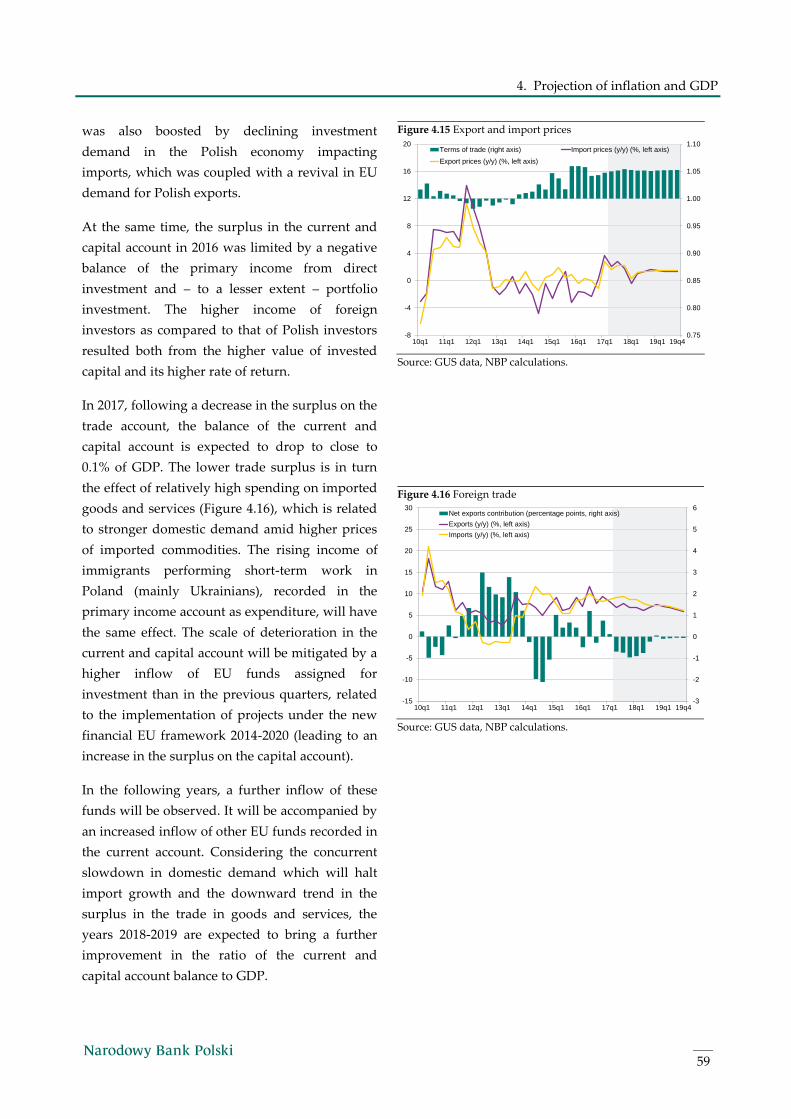
4. Projection of inflation and GDP
59
was also boosted by declining investment
demand in the Polish economy impacting
imports, which was coupled with a revival in EU
demand for Polish exports.
At the same time, the surplus in the current and
capital account in 2016 was limited by a negative
balance of the primary income from direct
investment and – to a lesser extent – portfolio
investment. The higher income of foreign
investors as compared to that of Polish investors
resulted both from the higher value of invested
capital and its higher rate of return.
In 2017, following a decrease in the surplus on the
trade account, the balance of the current and
capital account is expected to drop to close to
0.1% of GDP. The lower trade surplus is in turn
the effect of relatively high spending on imported
goods and services (Figure 4.16), which is related
to stronger domestic demand amid higher prices
of imported commodities. The rising income of
immigrants performing short-term work in
Poland (mainly Ukrainians), recorded in the
primary income account as expenditure, will have
the same effect. The scale of deterioration in the
current and capital account will be mitigated by a
higher inflow of EU funds assigned for
investment than in the previous quarters, related
to the implementation of projects under the new
financial EU framework 2014-2020 (leading to an
increase in the surplus on the capital account).
In the following years, a further inflow of these
funds will be observed. It will be accompanied by
an increased inflow of other EU funds recorded in
the current account. Considering the concurrent
slowdown in domestic demand which will halt
import growth and the downward trend in the
surplus in the trade in goods and services, the
years 2018-2019 are expected to bring a further
improvement in the ratio of the current and
capital account balance to GDP.
Figure 4.15 Export and import prices
Source: GUS data, NBP calculations.
Figure 4.16 Foreign trade
Source: GUS data, NBP calculations.
0.75
0.80
0.85
0.90
0.95
1.00
1.05
1.10
-8
-4
0
4
8
12
16
20
10q1 11q1 12q1 13q1 14q1 15q1 16q1 17q1 18q1 19q1 19q4
Terms of trade (right axis) Import prices (y/y) (%, left axis)
Export prices (y/y) (%, left axis)
-3
-2
-1
0
1
2
3
4
5
6
-15
-10
-5
0
5
10
15
20
25
30
10q1 11q1 12q1 13q1 14q1 15q1 16q1 17q1 18q1 19q1 19q4
Net exports contribution (percentage points, right axis)
Exports (y/y) (%, left axis)
Imports (y/y) (%, left axis)
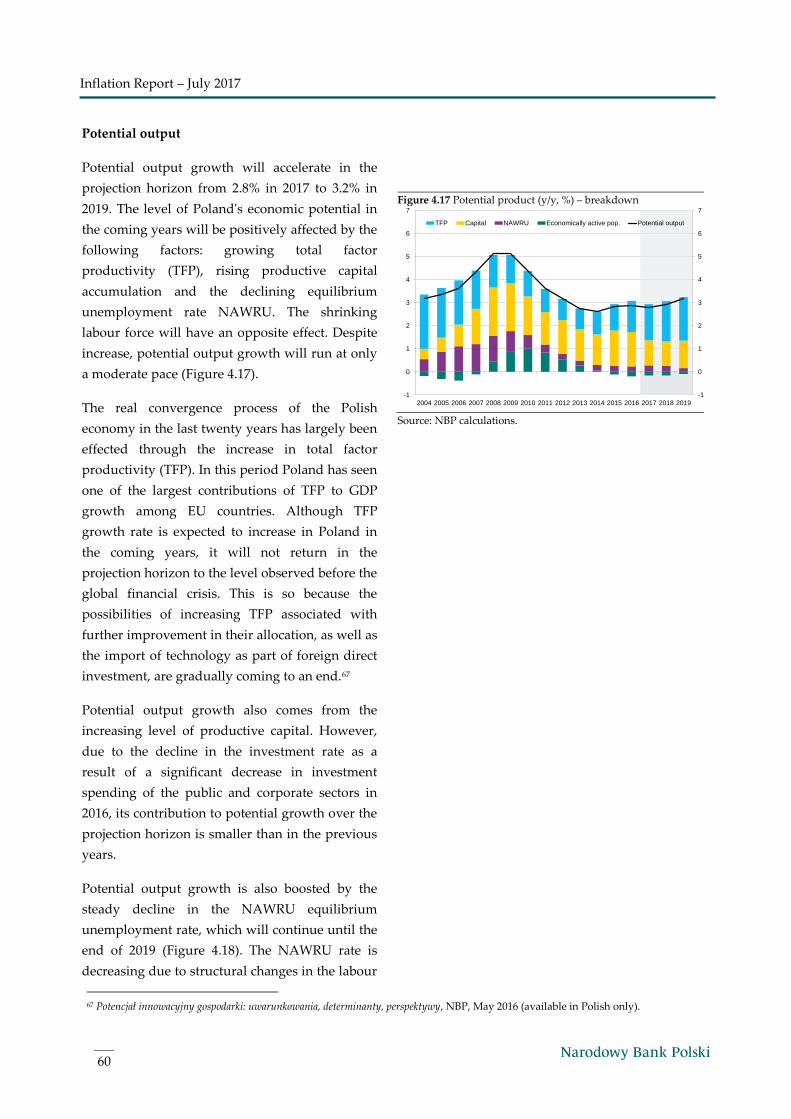
Inflation Report – July 2017
60
Potential output
Potential output growth will accelerate in the
projection horizon from 2.8% in 2017 to 3.2% in
2019. The level of Poland's economic potential in
the coming years will be positively affected by the
following factors: growing total factor
productivity (TFP), rising productive capital
accumulation and the declining equilibrium
unemployment rate NAWRU. The shrinking
labour force will have an opposite effect. Despite
increase, potential output growth will run at only
a moderate pace (Figure 4.17).
The real convergence process of the Polish
economy in the last twenty years has largely been
effected through the increase in total factor
productivity (TFP). In this period Poland has seen
one of the largest contributions of TFP to GDP
growth among EU countries. Although TFP
growth rate is expected to increase in Poland in
the coming years, it will not return in the
projection horizon to the level observed before the
global financial crisis. This is so because the
possibilities of increasing TFP associated with
further improvement in their allocation, as well as
the import of technology as part of foreign direct
investment, are gradually coming to an end.67
Potential output growth also comes from the
increasing level of productive capital. However,
due to the decline in the investment rate as a
result of a significant decrease in investment
spending of the public and corporate sectors in
2016, its contribution to potential growth over the
projection horizon is smaller than in the previous
years.
Potential output growth is also boosted by the
steady decline in the NAWRU equilibrium
unemployment rate, which will continue until the
end of 2019 (Figure 4.18). The NAWRU rate is
decreasing due to structural changes in the labour
Figure 4.17 Potential product (y/y, %) – breakdown
Source: NBP calculations.
67 Potencjał innowacyjny gospodarki: uwarunkowania, determinanty, perspektywy, NBP, May 2016 (available in Polish only).
-1
0
1
2
3
4
5
6
7
-1
0
1
2
3
4
5
6
7
2004 2005 2006 2007 2008 2009 2010 2011 2012 2013 2014 2015 2016 2017 2018 2019
TFP Capital NAWRU Economically active pop. Potential output
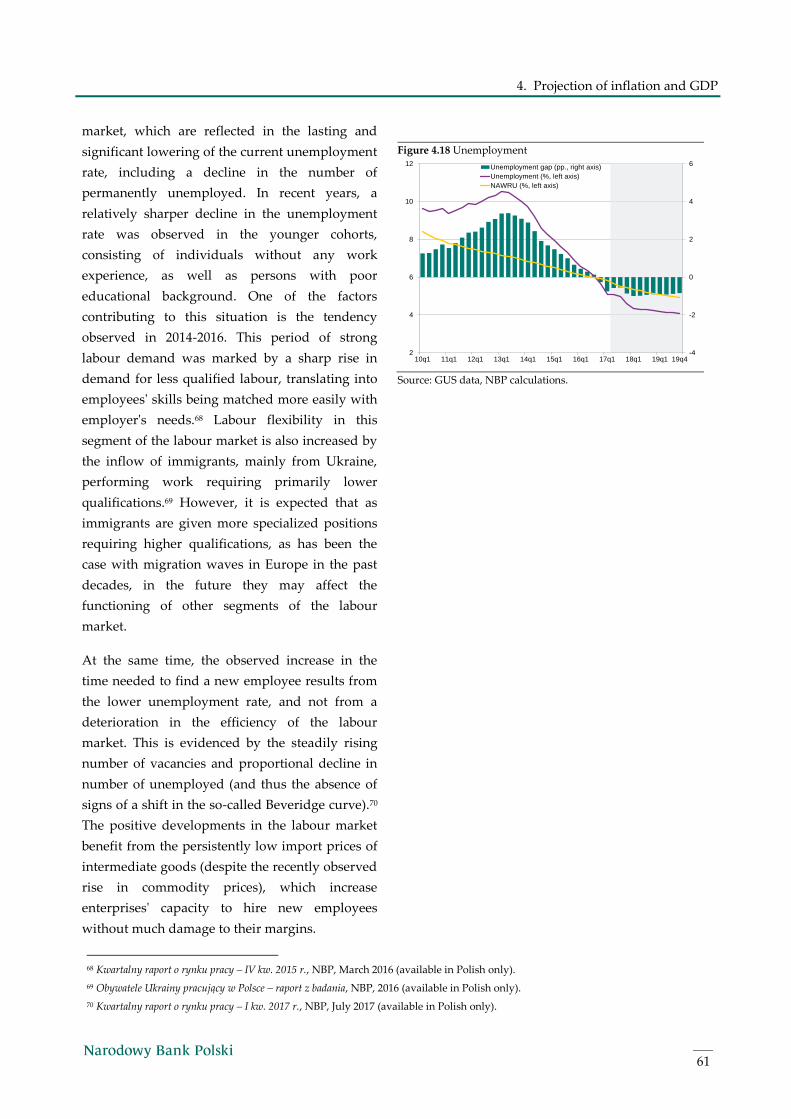
4. Projection of inflation and GDP
61
market, which are reflected in the lasting and
significant lowering of the current unemployment
rate, including a decline in the number of
permanently unemployed. In recent years, a
relatively sharper decline in the unemployment
rate was observed in the younger cohorts,
consisting of individuals without any work
experience, as well as persons with poor
educational background. One of the factors
contributing to this situation is the tendency
observed in 2014-2016. This period of strong
labour demand was marked by a sharp rise in
demand for less qualified labour, translating into
employees' skills being matched more easily with
employer's needs.68 Labour flexibility in this
segment of the labour market is also increased by
the inflow of immigrants, mainly from Ukraine,
performing work requiring primarily lower
qualifications.69 However, it is expected that as
immigrants are given more specialized positions
requiring higher qualifications, as has been the
case with migration waves in Europe in the past
decades, in the future they may affect the
functioning of other segments of the labour
market.
At the same time, the observed increase in the
time needed to find a new employee results from
the lower unemployment rate, and not from a
deterioration in the efficiency of the labour
market. This is evidenced by the steadily rising
number of vacancies and proportional decline in
number of unemployed (and thus the absence of
signs of a shift in the so-called Beveridge curve).70
The positive developments in the labour market
benefit from the persistently low import prices of
intermediate goods (despite the recently observed
rise in commodity prices), which increase
enterprises' capacity to hire new employees
without much damage to their margins.
Figure 4.18 Unemployment
Source: GUS data, NBP calculations.
68 Kwartalny raport o rynku pracy – IV kw. 2015 r., NBP, March 2016 (available in Polish only).
69 Obywatele Ukrainy pracujący w Polsce – raport z badania, NBP, 2016 (available in Polish only).
70 Kwartalny raport o rynku pracy – I kw. 2017 r., NBP, July 2017 (available in Polish only).
-4
-2
0
2
4
6
2
4
6
8
10
12
10q1 11q1 12q1 13q1 14q1 15q1 16q1 17q1 18q1 19q1 19q4
Unemployment gap (pp., right axis)
Unemployment (%, left axis)
NAWRU (%, left axis)
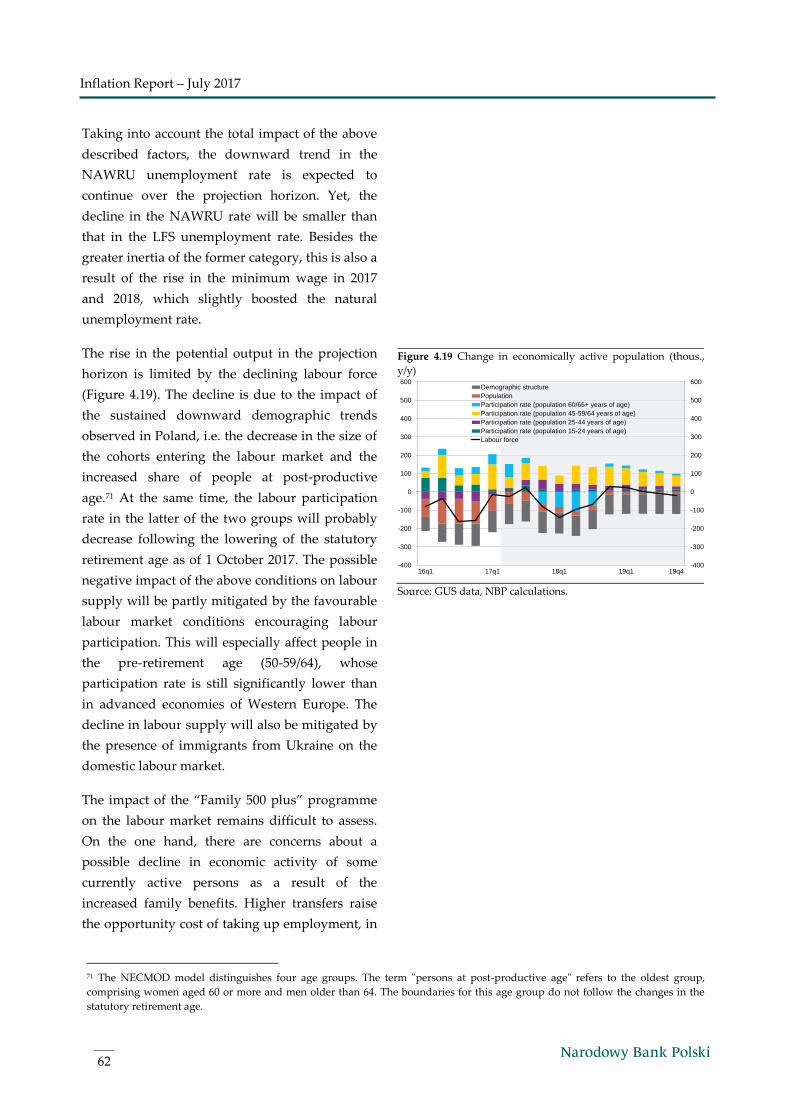
Inflation Report – July 2017
62
Taking into account the total impact of the above
described factors, the downward trend in the
NAWRU unemployment rate is expected to
continue over the projection horizon. Yet, the
decline in the NAWRU rate will be smaller than
that in the LFS unemployment rate. Besides the
greater inertia of the former category, this is also a
result of the rise in the minimum wage in 2017
and 2018, which slightly boosted the natural
unemployment rate.
The rise in the potential output in the projection
horizon is limited by the declining labour force
(Figure 4.19). The decline is due to the impact of
the sustained downward demographic trends
observed in Poland, i.e. the decrease in the size of
the cohorts entering the labour market and the
increased share of people at post-productive
age.71 At the same time, the labour participation
rate in the latter of the two groups will probably
decrease following the lowering of the statutory
retirement age as of 1 October 2017. The possible
negative impact of the above conditions on labour
supply will be partly mitigated by the favourable
labour market conditions encouraging labour
participation. This will especially affect people in
the pre-retirement age (50-59/64), whose
participation rate is still significantly lower than
in advanced economies of Western Europe. The
decline in labour supply will also be mitigated by
the presence of immigrants from Ukraine on the
domestic labour market.
The impact of the “Family 500 plus” programme
on the labour market remains difficult to assess.
On the one hand, there are concerns about a
possible decline in economic activity of some
currently active persons as a result of the
increased family benefits. Higher transfers raise
the opportunity cost of taking up employment, in
Figure 4.19 Change in economically active population (thous.,
y/y)
Source: GUS data, NBP calculations.
71 The NECMOD model distinguishes four age groups. The term "persons at post-productive age" refers to the oldest group,
comprising women aged 60 or more and men older than 64. The boundaries for this age group do not follow the changes in the
statutory retirement age.
-400
-300
-200
-100
0
100
200
300
400
500
600
-400
-300
-200
-100
0
100
200
300
400
500
600
16q1 17q1 18q1 19q1 19q4
Demographic structure
Population
Participation rate (population 60/65+ years of age)
Participation rate (population 45-59/64 years of age)
Participation rate (population 25-44 years of age)
Participation rate (population 15-24 years of age)
Labour force
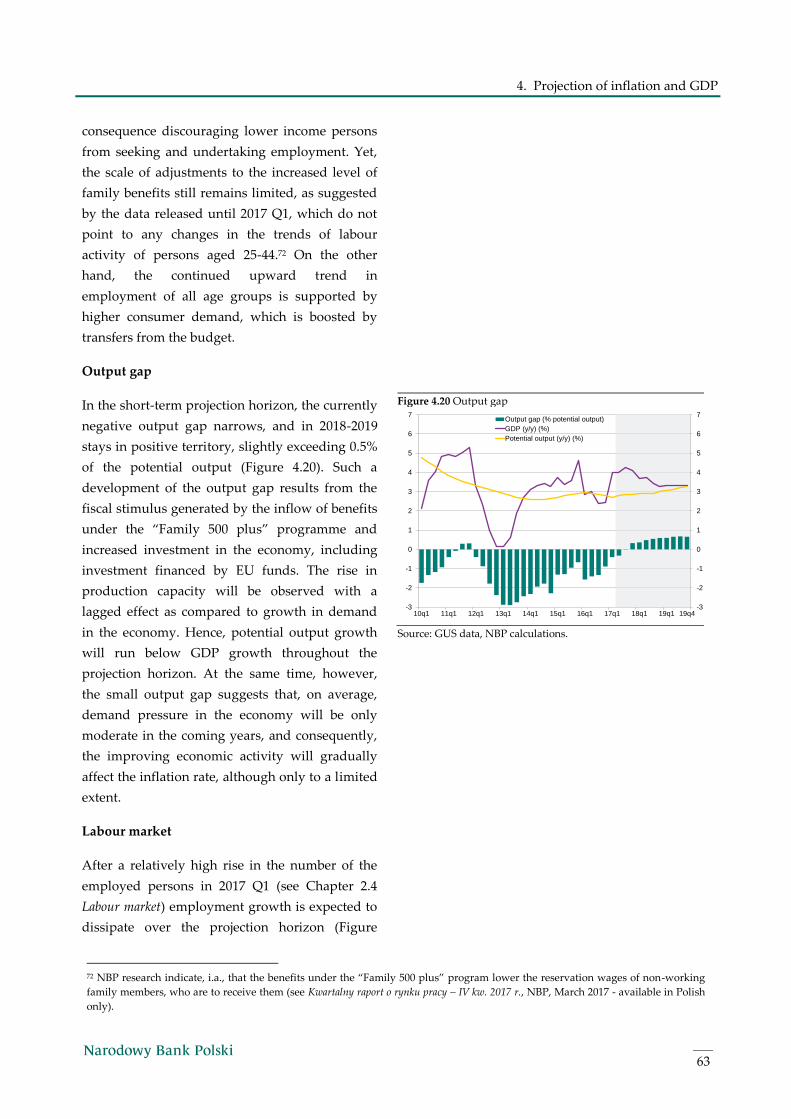
4. Projection of inflation and GDP
63
consequence discouraging lower income persons
from seeking and undertaking employment. Yet,
the scale of adjustments to the increased level of
family benefits still remains limited, as suggested
by the data released until 2017 Q1, which do not
point to any changes in the trends of labour
activity of persons aged 25-44.72 On the other
hand, the continued upward trend in
employment of all age groups is supported by
higher consumer demand, which is boosted by
transfers from the budget.
Output gap
In the short-term projection horizon, the currently
negative output gap narrows, and in 2018-2019
stays in positive territory, slightly exceeding 0.5%
of the potential output (Figure 4.20). Such a
development of the output gap results from the
fiscal stimulus generated by the inflow of benefits
under the “Family 500 plus” programme and
increased investment in the economy, including
investment financed by EU funds. The rise in
production capacity will be observed with a
lagged effect as compared to growth in demand
in the economy. Hence, potential output growth
will run below GDP growth throughout the
projection horizon. At the same time, however,
the small output gap suggests that, on average,
demand pressure in the economy will be only
moderate in the coming years, and consequently,
the improving economic activity will gradually
affect the inflation rate, although only to a limited
extent.
Labour market
After a relatively high rise in the number of the
employed persons in 2017 Q1 (see Chapter 2.4
Labour market) employment growth is expected to
dissipate over the projection horizon (Figure
Figure 4.20 Output gap
Source: GUS data, NBP calculations.
72 NBP research indicate, i.a., that the benefits under the “Family 500 plus” program lower the reservation wages of non-working
family members, who are to receive them (see Kwartalny raport o rynku pracy – IV kw. 2017 r., NBP, March 2017 - available in Polish
only).
-3
-2
-1
0
1
2
3
4
5
6
7
-3
-2
-1
0
1
2
3
4
5
6
7
10q1 11q1 12q1 13q1 14q1 15q1 16q1 17q1 18q1 19q1 19q4
Output gap (% potential output)
GDP (y/y) (%)
Potential output (y/y) (%)
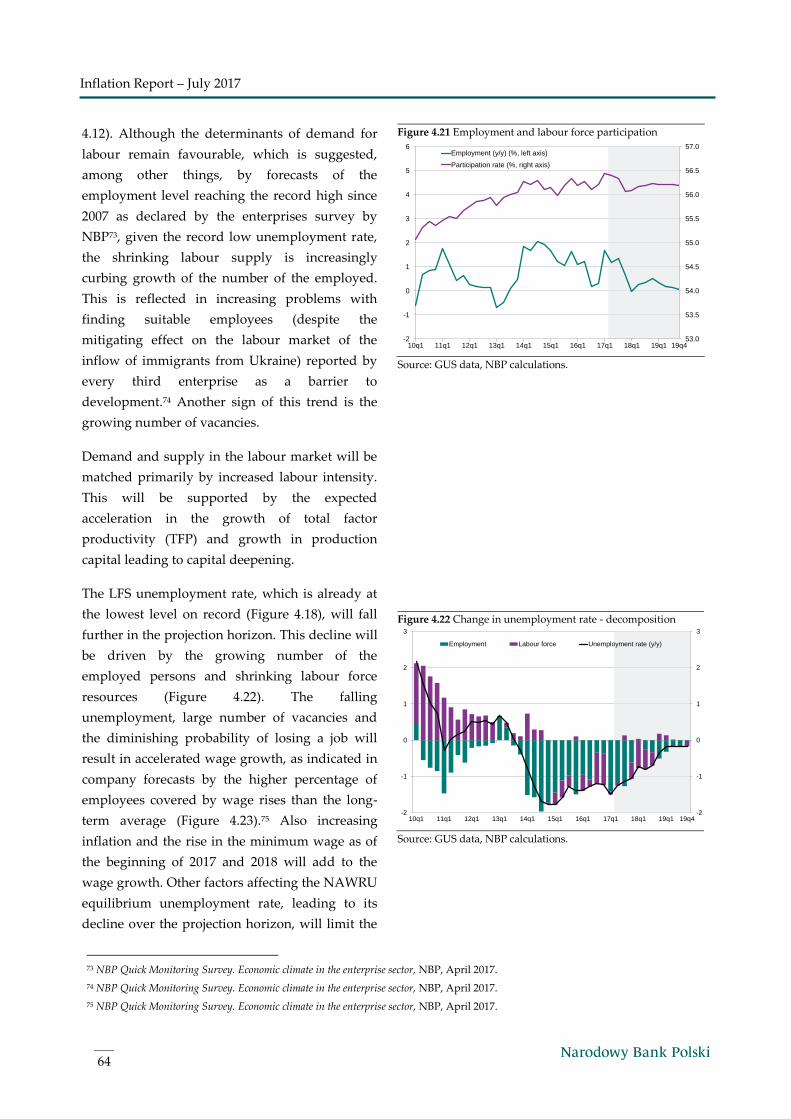
Inflation Report – July 2017
64
4.12). Although the determinants of demand for
labour remain favourable, which is suggested,
among other things, by forecasts of the
employment level reaching the record high since
2007 as declared by the enterprises survey by
NBP73, given the record low unemployment rate,
the shrinking labour supply is increasingly
curbing growth of the number of the employed.
This is reflected in increasing problems with
finding suitable employees (despite the
mitigating effect on the labour market of the
inflow of immigrants from Ukraine) reported by
every third enterprise as a barrier to
development.74 Another sign of this trend is the
growing number of vacancies.
Demand and supply in the labour market will be
matched primarily by increased labour intensity.
This will be supported by the expected
acceleration in the growth of total factor
productivity (TFP) and growth in production
capital leading to capital deepening.
The LFS unemployment rate, which is already at
the lowest level on record (Figure 4.18), will fall
further in the projection horizon. This decline will
be driven by the growing number of the
employed persons and shrinking labour force
resources (Figure 4.22). The falling
unemployment, large number of vacancies and
the diminishing probability of losing a job will
result in accelerated wage growth, as indicated in
company forecasts by the higher percentage of
employees covered by wage rises than the long-
term average (Figure 4.23).75 Also increasing
inflation and the rise in the minimum wage as of
the beginning of 2017 and 2018 will add to the
wage growth. Other factors affecting the NAWRU
equilibrium unemployment rate, leading to its
decline over the projection horizon, will limit the
Figure 4.21 Employment and labour force participation
Source: GUS data, NBP calculations.
Figure 4.22 Change in unemployment rate - decomposition
Source: GUS data, NBP calculations.
73 NBP Quick Monitoring Survey. Economic climate in the enterprise sector, NBP, April 2017.
74 NBP Quick Monitoring Survey. Economic climate in the enterprise sector, NBP, April 2017.
75 NBP Quick Monitoring Survey. Economic climate in the enterprise sector, NBP, April 2017.
53.0
53.5
54.0
54.5
55.0
55.5
56.0
56.5
57.0
-2
-1
0
1
2
3
4
5
6
10q1 11q1 12q1 13q1 14q1 15q1 16q1 17q1 18q1 19q1 19q4
Employment (y/y) (%, left axis)
Participation rate (%, right axis)
-2
-1
0
1
2
3
-2
-1
0
1
2
3
10q1 11q1 12q1 13q1 14q1 15q1 16q1 17q1 18q1 19q1 19q4
Employment Labour force Unemployment rate (y/y)
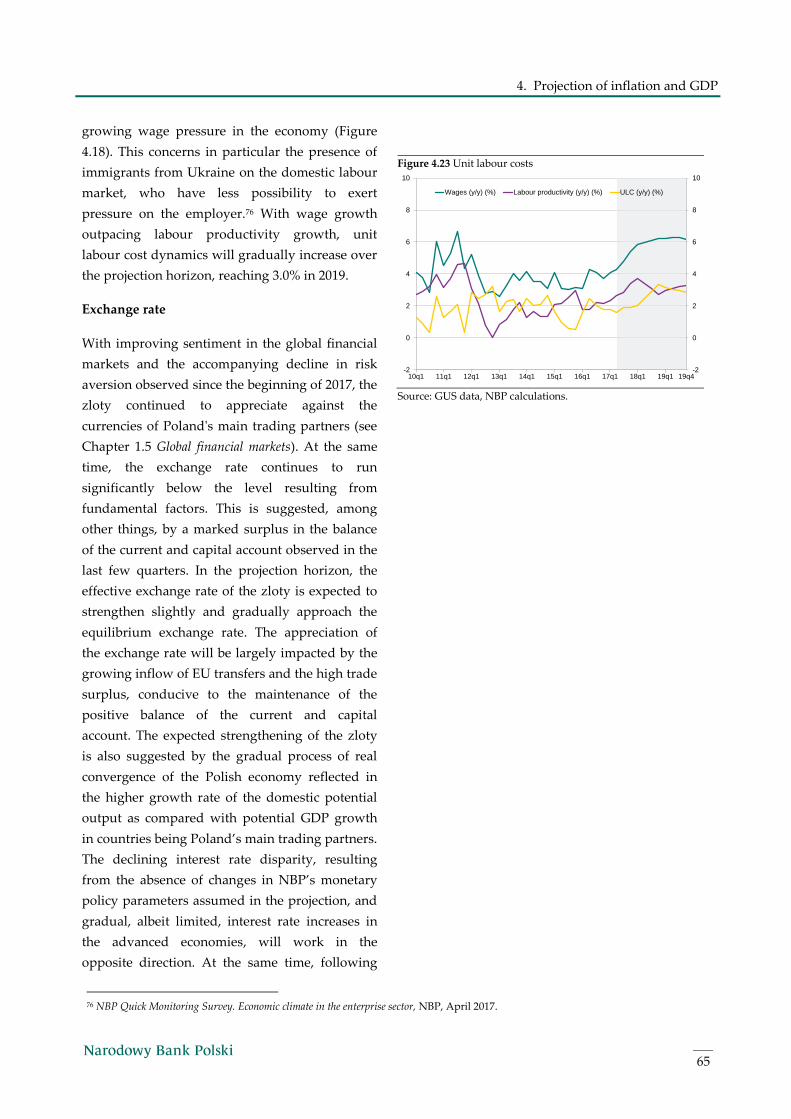
4. Projection of inflation and GDP
65
growing wage pressure in the economy (Figure
4.18). This concerns in particular the presence of
immigrants from Ukraine on the domestic labour
market, who have less possibility to exert
pressure on the employer.76 With wage growth
outpacing labour productivity growth, unit
labour cost dynamics will gradually increase over
the projection horizon, reaching 3.0% in 2019.
Exchange rate
With improving sentiment in the global financial
markets and the accompanying decline in risk
aversion observed since the beginning of 2017, the
zloty continued to appreciate against the
currencies of Poland's main trading partners (see
Chapter 1.5 Global financial markets). At the same
time, the exchange rate continues to run
significantly below the level resulting from
fundamental factors. This is suggested, among
other things, by a marked surplus in the balance
of the current and capital account observed in the
last few quarters. In the projection horizon, the
effective exchange rate of the zloty is expected to
strengthen slightly and gradually approach the
equilibrium exchange rate. The appreciation of
the exchange rate will be largely impacted by the
growing inflow of EU transfers and the high trade
surplus, conducive to the maintenance of the
positive balance of the current and capital
account. The expected strengthening of the zloty
is also suggested by the gradual process of real
convergence of the Polish economy reflected in
the higher growth rate of the domestic potential
output as compared with potential GDP growth
in countries being Poland’s main trading partners.
The declining interest rate disparity, resulting
from the absence of changes in NBP’s monetary
policy parameters assumed in the projection, and
gradual, albeit limited, interest rate increases in
the advanced economies, will work in the
opposite direction. At the same time, following
Figure 4.23 Unit labour costs
Source: GUS data, NBP calculations.
76 NBP Quick Monitoring Survey. Economic climate in the enterprise sector, NBP, April 2017.
-2
0
2
4
6
8
10
-2
0
2
4
6
8
10
10q1 11q1 12q1 13q1 14q1 15q1 16q1 17q1 18q1 19q1 19q4
Wages (y/y) (%) Labour productivity (y/y) (%) ULC (y/y) (%)
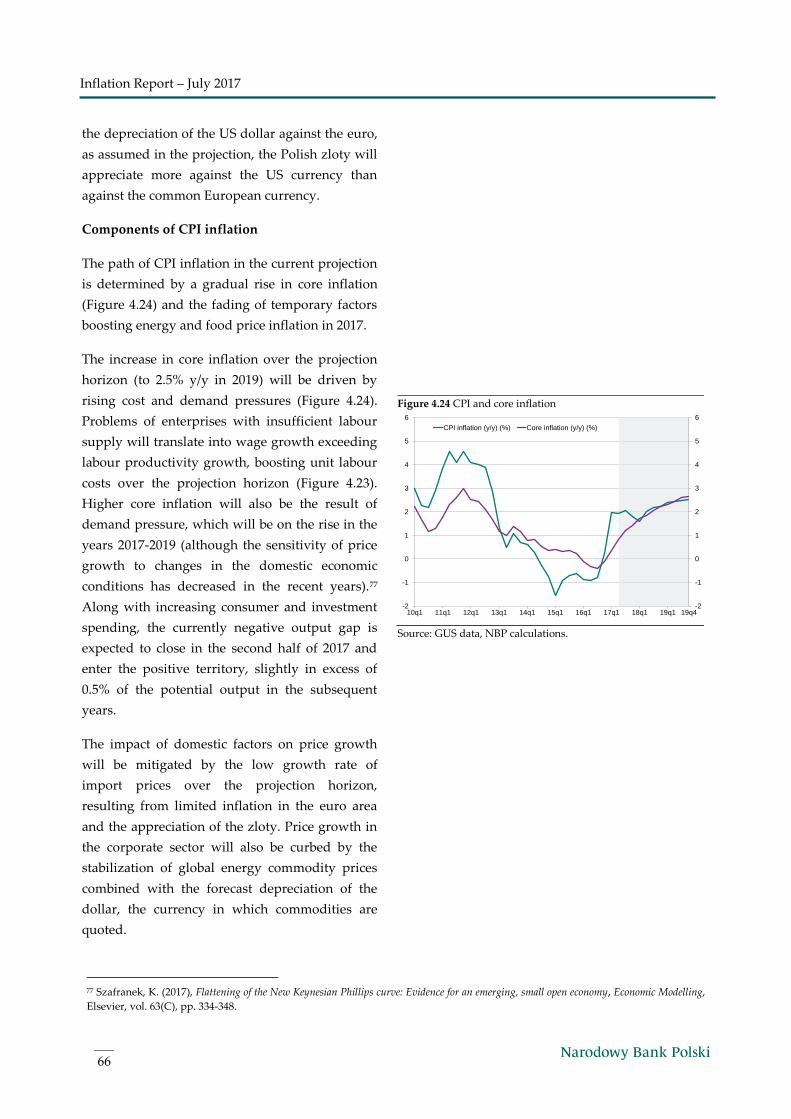
Inflation Report – July 2017
66
the depreciation of the US dollar against the euro,
as assumed in the projection, the Polish zloty will
appreciate more against the US currency than
against the common European currency.
Components of CPI inflation
The path of CPI inflation in the current projection
is determined by a gradual rise in core inflation
(Figure 4.24) and the fading of temporary factors
boosting energy and food price inflation in 2017.
The increase in core inflation over the projection
horizon (to 2.5% y/y in 2019) will be driven by
rising cost and demand pressures (Figure 4.24).
Problems of enterprises with insufficient labour
supply will translate into wage growth exceeding
labour productivity growth, boosting unit labour
costs over the projection horizon (Figure 4.23).
Higher core inflation will also be the result of
demand pressure, which will be on the rise in the
years 2017-2019 (although the sensitivity of price
growth to changes in the domestic economic
conditions has decreased in the recent years).77
Along with increasing consumer and investment
spending, the currently negative output gap is
expected to close in the second half of 2017 and
enter the positive territory, slightly in excess of
0.5% of the potential output in the subsequent
years.
The impact of domestic factors on price growth
will be mitigated by the low growth rate of
import prices over the projection horizon,
resulting from limited inflation in the euro area
and the appreciation of the zloty. Price growth in
the corporate sector will also be curbed by the
stabilization of global energy commodity prices
combined with the forecast depreciation of the
dollar, the currency in which commodities are
quoted.
Figure 4.24 CPI and core inflation
Source: GUS data, NBP calculations.
77 Szafranek, K. (2017), Flattening of the New Keynesian Phillips curve: Evidence for an emerging, small open economy, Economic Modelling,
Elsevier, vol. 63(C), pp. 334-348.
-2
-1
0
1
2
3
4
5
6
-2
-1
0
1
2
3
4
5
6
10q1 11q1 12q1 13q1 14q1 15q1 16q1 17q1 18q1 19q1 19q4
CPI inflation (y/y) (%) Core inflation (y/y) (%)
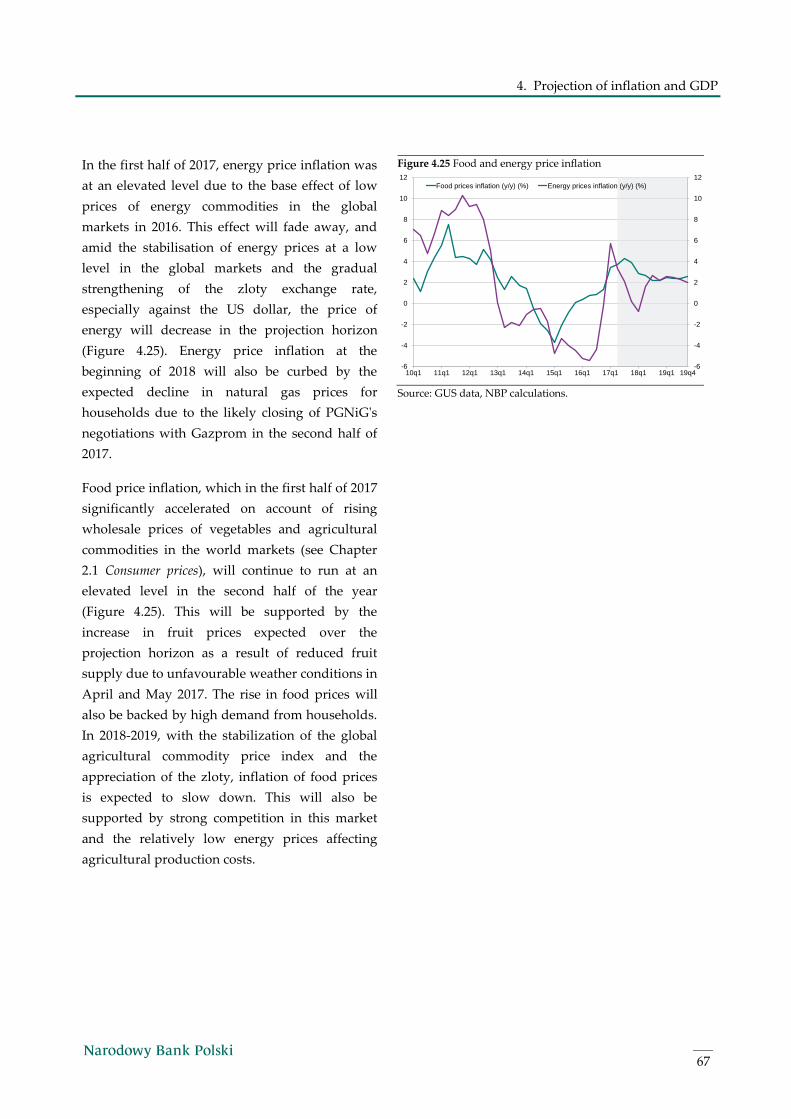
4. Projection of inflation and GDP
67
In the first half of 2017, energy price inflation was
at an elevated level due to the base effect of low
prices of energy commodities in the global
markets in 2016. This effect will fade away, and
amid the stabilisation of energy prices at a low
level in the global markets and the gradual
strengthening of the zloty exchange rate,
especially against the US dollar, the price of
energy will decrease in the projection horizon
(Figure 4.25). Energy price inflation at the
beginning of 2018 will also be curbed by the
expected decline in natural gas prices for
households due to the likely closing of PGNiG's
negotiations with Gazprom in the second half of
2017.
Food price inflation, which in the first half of 2017
significantly accelerated on account of rising
wholesale prices of vegetables and agricultural
commodities in the world markets (see Chapter
2.1 Consumer prices), will continue to run at an
elevated level in the second half of the year
(Figure 4.25). This will be supported by the
increase in fruit prices expected over the
projection horizon as a result of reduced fruit
supply due to unfavourable weather conditions in
April and May 2017. The rise in food prices will
also be backed by high demand from households.
In 2018-2019, with the stabilization of the global
agricultural commodity price index and the
appreciation of the zloty, inflation of food prices
is expected to slow down. This will also be
supported by strong competition in this market
and the relatively low energy prices affecting
agricultural production costs.
Figure 4.25 Food and energy price inflation
Source: GUS data, NBP calculations.
-6
-4
-2
0
2
4
6
8
10
12
-6
-4
-2
0
2
4
6
8
10
12
10q1 11q1 12q1 13q1 14q1 15q1 16q1 17q1 18q1 19q1 19q4
Food prices inflation (y/y) (%) Energy prices inflation (y/y) (%)
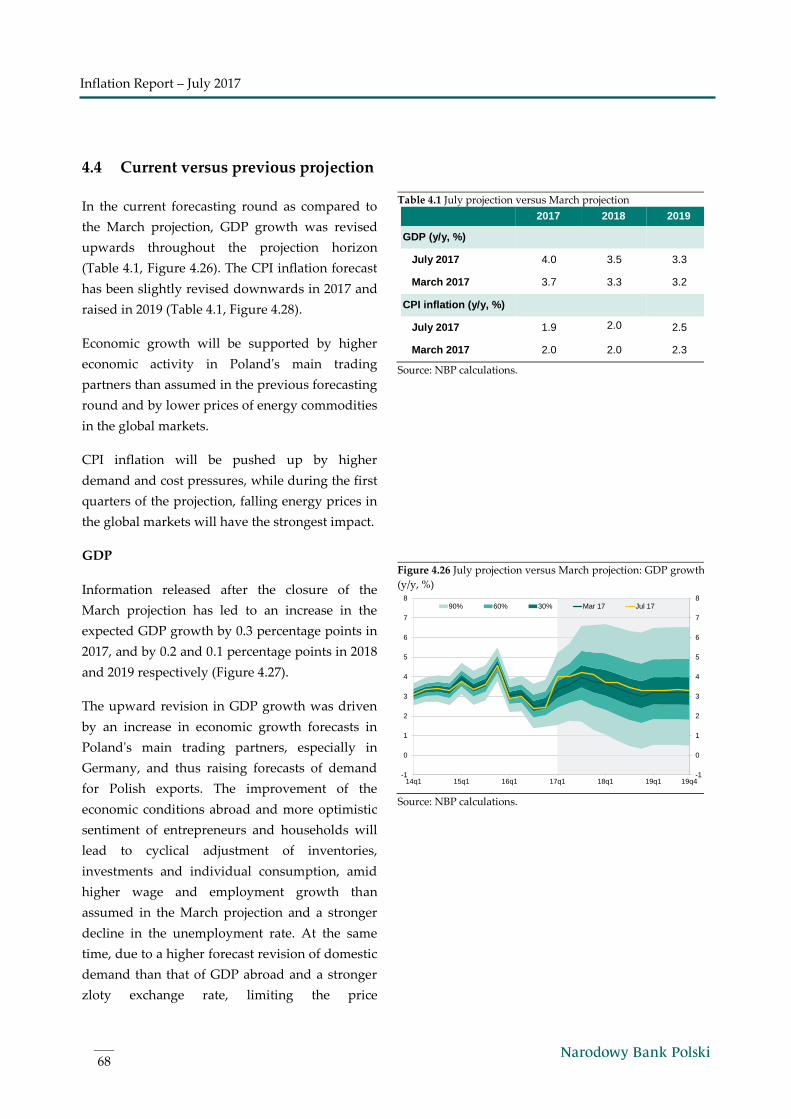
Inflation Report – July 2017
68
4.4 Current versus previous projection
In the current forecasting round as compared to
the March projection, GDP growth was revised
upwards throughout the projection horizon
(Table 4.1, Figure 4.26). The CPI inflation forecast
has been slightly revised downwards in 2017 and
raised in 2019 (Table 4.1, Figure 4.28).
Economic growth will be supported by higher
economic activity in Poland's main trading
partners than assumed in the previous forecasting
round and by lower prices of energy commodities
in the global markets.
CPI inflation will be pushed up by higher
demand and cost pressures, while during the first
quarters of the projection, falling energy prices in
the global markets will have the strongest impact.
GDP
Information released after the closure of the
March projection has led to an increase in the
expected GDP growth by 0.3 percentage points in
2017, and by 0.2 and 0.1 percentage points in 2018
and 2019 respectively (Figure 4.27).
The upward revision in GDP growth was driven
by an increase in economic growth forecasts in
Poland's main trading partners, especially in
Germany, and thus raising forecasts of demand
for Polish exports. The improvement of the
economic conditions abroad and more optimistic
sentiment of entrepreneurs and households will
lead to cyclical adjustment of inventories,
investments and individual consumption, amid
higher wage and employment growth than
assumed in the March projection and a stronger
decline in the unemployment rate. At the same
time, due to a higher forecast revision of domestic
demand than that of GDP abroad and a stronger
zloty exchange rate, limiting the price
Table 4.1 July projection versus March projection
2017 2018 2019
GDP (y/y, %)
July 2017 4.0 3.5 3.3
March 2017 3.7 3.3 3.2
CPI inflation (y/y, %)
July 2017 1.9 2.0 2.5
March 2017 2.0 2.0 2.3
Source: NBP calculations.
Figure 4.26 July projection versus March projection: GDP growth
(y/y, %)
Source: NBP calculations.
-1
0
1
2
3
4
5
6
7
8
-1
0
1
2
3
4
5
6
7
8
14q1 15q1 16q1 17q1 18q1 19q1 19q4
90% 60% 30% Mar 17 Jul 17
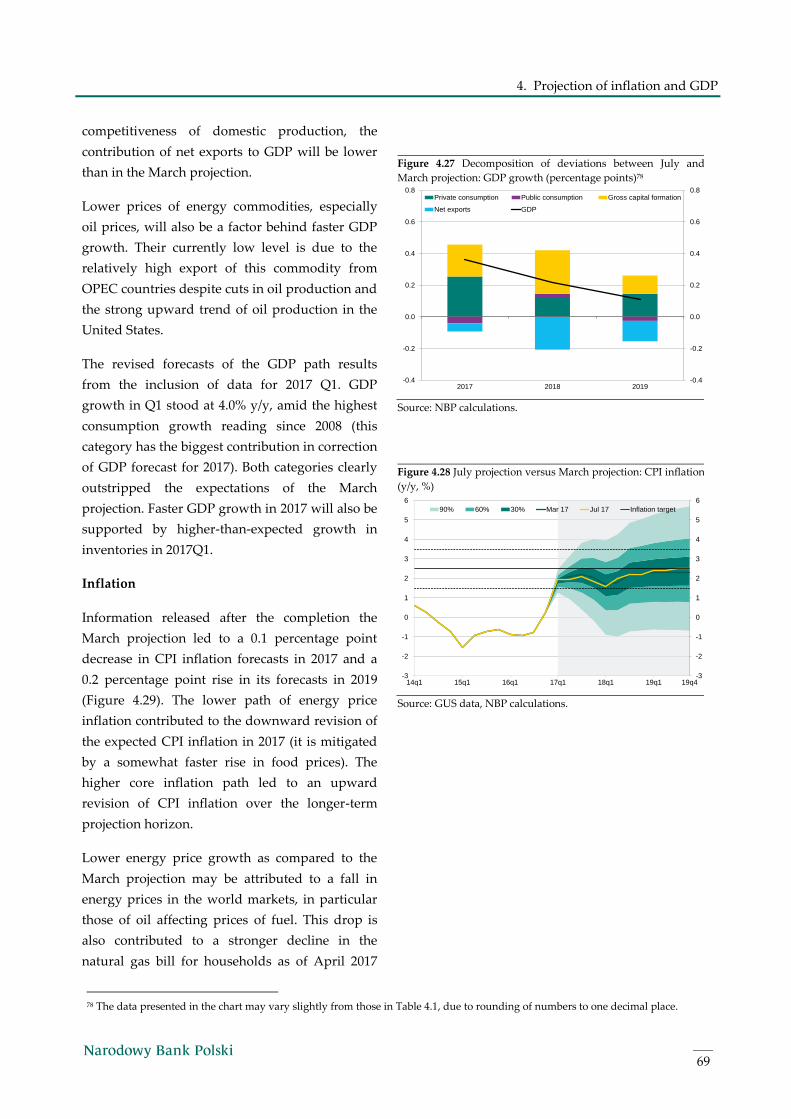
4. Projection of inflation and GDP
69
competitiveness of domestic production, the
contribution of net exports to GDP will be lower
than in the March projection.
Lower prices of energy commodities, especially
oil prices, will also be a factor behind faster GDP
growth. Their currently low level is due to the
relatively high export of this commodity from
OPEC countries despite cuts in oil production and
the strong upward trend of oil production in the
United States.
The revised forecasts of the GDP path results
from the inclusion of data for 2017 Q1. GDP
growth in Q1 stood at 4.0% y/y, amid the highest
consumption growth reading since 2008 (this
category has the biggest contribution in correction
of GDP forecast for 2017). Both categories clearly
outstripped the expectations of the March
projection. Faster GDP growth in 2017 will also be
supported by higher-than-expected growth in
inventories in 2017Q1.
Inflation
Information released after the completion the
March projection led to a 0.1 percentage point
decrease in CPI inflation forecasts in 2017 and a
0.2 percentage point rise in its forecasts in 2019
(Figure 4.29). The lower path of energy price
inflation contributed to the downward revision of
the expected CPI inflation in 2017 (it is mitigated
by a somewhat faster rise in food prices). The
higher core inflation path led to an upward
revision of CPI inflation over the longer-term
projection horizon.
Lower energy price growth as compared to the
March projection may be attributed to a fall in
energy prices in the world markets, in particular
those of oil affecting prices of fuel. This drop is
also contributed to a stronger decline in the
natural gas bill for households as of April 2017
Figure 4.27 Decomposition of deviations between July and
March projection: GDP growth (percentage points)78
Source: NBP calculations.
Figure 4.28 July projection versus March projection: CPI inflation
(y/y, %)
Source: GUS data, NBP calculations.
78 The data presented in the chart may vary slightly from those in Table 4.1, due to rounding of numbers to one decimal place.
-0.4
-0.2
0.0
0.2
0.4
0.6
0.8
-0.4
-0.2
0.0
0.2
0.4
0.6
0.8
2017 2018 2019
Private consumption Public consumption Gross capital formation
Net exports GDP
-3
-2
-1
0
1
2
3
4
5
6
-3
-2
-1
0
1
2
3
4
5
6
14q1 15q1 16q1 17q1 18q1 19q1 19q4
90% 60% 30% Mar 17 Jul 17 Inflation target
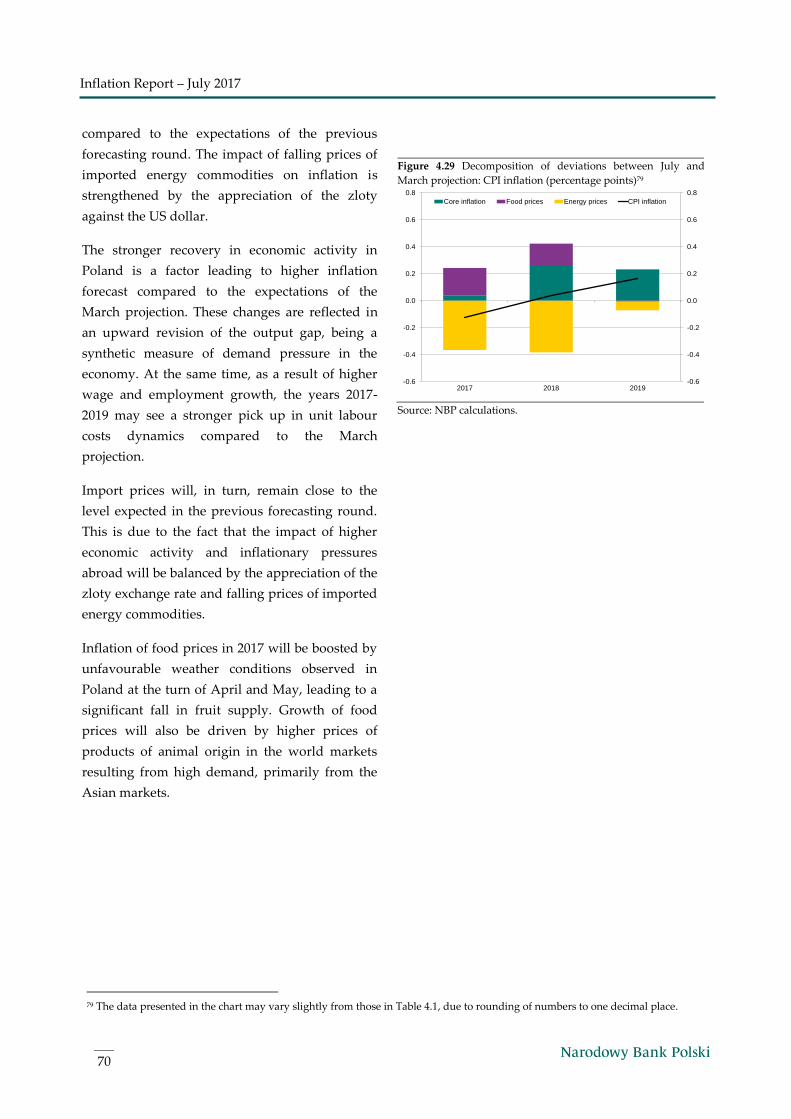
Inflation Report – July 2017
70
compared to the expectations of the previous
forecasting round. The impact of falling prices of
imported energy commodities on inflation is
strengthened by the appreciation of the zloty
against the US dollar.
The stronger recovery in economic activity in
Poland is a factor leading to higher inflation
forecast compared to the expectations of the
March projection. These changes are reflected in
an upward revision of the output gap, being a
synthetic measure of demand pressure in the
economy. At the same time, as a result of higher
wage and employment growth, the years 2017-
2019 may see a stronger pick up in unit labour
costs dynamics compared to the March
projection.
Import prices will, in turn, remain close to the
level expected in the previous forecasting round.
This is due to the fact that the impact of higher
economic activity and inflationary pressures
abroad will be balanced by the appreciation of the
zloty exchange rate and falling prices of imported
energy commodities.
Inflation of food prices in 2017 will be boosted by
unfavourable weather conditions observed in
Poland at the turn of April and May, leading to a
significant fall in fruit supply. Growth of food
prices will also be driven by higher prices of
products of animal origin in the world markets
resulting from high demand, primarily from the
Asian markets.
Figure 4.29 Decomposition of deviations between July and
March projection: CPI inflation (percentage points)79
Source: NBP calculations.
79 The data presented in the chart may vary slightly from those in Table 4.1, due to rounding of numbers to one decimal place.
-0.6
-0.4
-0.2
0.0
0.2
0.4
0.6
0.8
-0.6
-0.4
-0.2
0.0
0.2
0.4
0.6
0.8
2017 2018 2019
Core inflation Food prices Energy prices CPI inflation
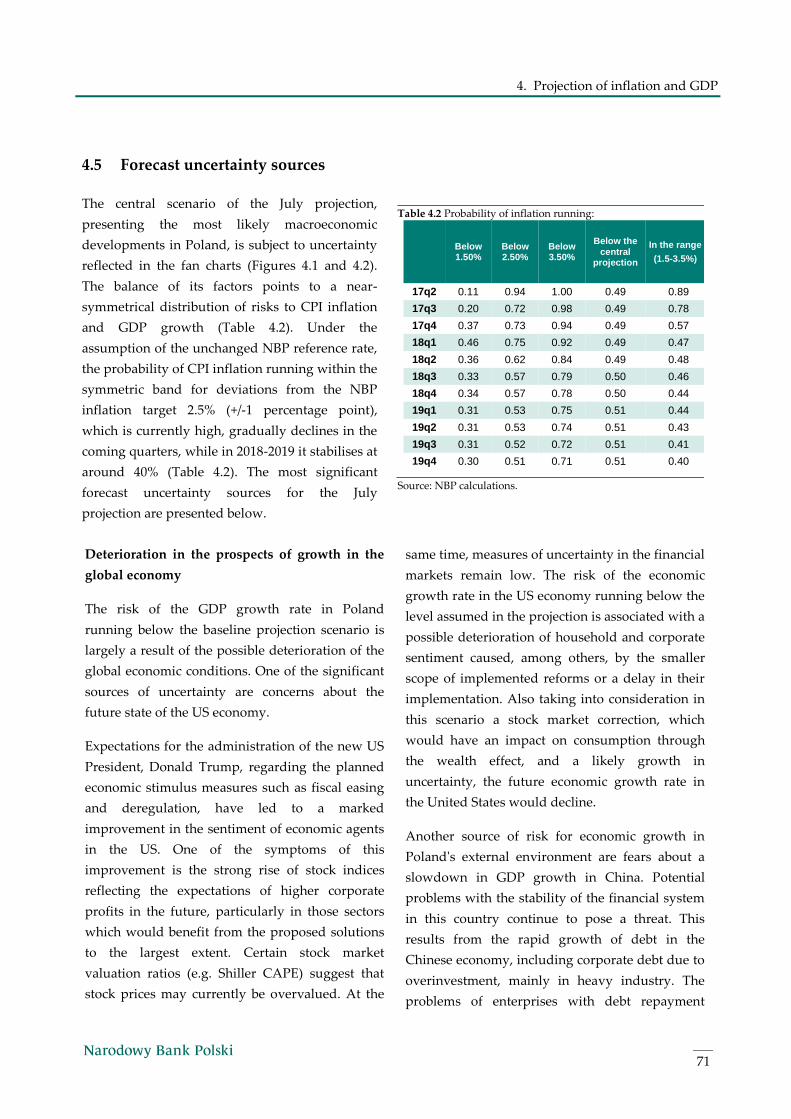
4. Projection of inflation and GDP
71
4.5 Forecast uncertainty sources
The central scenario of the July projection,
presenting the most likely macroeconomic
developments in Poland, is subject to uncertainty
reflected in the fan charts (Figures 4.1 and 4.2).
The balance of its factors points to a near-
symmetrical distribution of risks to CPI inflation
and GDP growth (Table 4.2). Under the
assumption of the unchanged NBP reference rate,
the probability of CPI inflation running within the
symmetric band for deviations from the NBP
inflation target 2.5% (+/-1 percentage point),
which is currently high, gradually declines in the
coming quarters, while in 2018-2019 it stabilises at
around 40% (Table 4.2). The most significant
forecast uncertainty sources for the July
projection are presented below.
Table 4.2 Probability of inflation running:
Below 1.50%
Below 2.50%
Below 3.50%
Below the central
projection
In the range
(1.5-3.5%)
17q2 0.11 0.94 1.00 0.49 0.89
17q3 0.20 0.72 0.98 0.49 0.78
17q4 0.37 0.73 0.94 0.49 0.57
18q1 0.46 0.75 0.92 0.49 0.47
18q2 0.36 0.62 0.84 0.49 0.48
18q3 0.33 0.57 0.79 0.50 0.46
18q4 0.34 0.57 0.78 0.50 0.44
19q1 0.31 0.53 0.75 0.51 0.44
19q2 0.31 0.53 0.74 0.51 0.43
19q3 0.31 0.52 0.72 0.51 0.41
19q4 0.30 0.51 0.71 0.51 0.40
Source: NBP calculations.
Deterioration in the prospects of growth in the
global economy
The risk of the GDP growth rate in Poland
running below the baseline projection scenario is
largely a result of the possible deterioration of the
global economic conditions. One of the significant
sources of uncertainty are concerns about the
future state of the US economy.
Expectations for the administration of the new US
President, Donald Trump, regarding the planned
economic stimulus measures such as fiscal easing
and deregulation, have led to a marked
improvement in the sentiment of economic agents
in the US. One of the symptoms of this
improvement is the strong rise of stock indices
reflecting the expectations of higher corporate
profits in the future, particularly in those sectors
which would benefit from the proposed solutions
to the largest extent. Certain stock market
valuation ratios (e.g. Shiller CAPE) suggest that
stock prices may currently be overvalued. At the
same time, measures of uncertainty in the financial
markets remain low. The risk of the economic
growth rate in the US economy running below the
level assumed in the projection is associated with a
possible deterioration of household and corporate
sentiment caused, among others, by the smaller
scope of implemented reforms or a delay in their
implementation. Also taking into consideration in
this scenario a stock market correction, which
would have an impact on consumption through
the wealth effect, and a likely growth in
uncertainty, the future economic growth rate in
the United States would decline.
Another source of risk for economic growth in
Poland's external environment are fears about a
slowdown in GDP growth in China. Potential
problems with the stability of the financial system
in this country continue to pose a threat. This
results from the rapid growth of debt in the
Chinese economy, including corporate debt due to
overinvestment, mainly in heavy industry. The
problems of enterprises with debt repayment
Inflation Report – July 2017
72
could translate into problems in the banking sector
and among shadow banking institutions. Another
threat for Chinese economic growth is a sharper
than expected fall in housing investment as a
result of real estate purchases becoming less
attractive due to restrictions imposed by local
authorities. However, there is only a slight risk of
a marked slowdown in China before the next
National Congress of the Communist Party of
China (November 2017) is held, as the Chinese
authorities are likely to implement stabilising
measures.
A sharper slowdown in China, which is one of the
most important trading partners of the United
States, would lead to an even more marked
slowdown in the US economy. Falls in global oil
prices in response to the reduced demand in China
would additionally cause a decline in investment
and activity in the US extraction industry. Should
the economic conditions in the United States and
China deteriorate, significant shocks in the global
markets and a slowdown in the global economy,
both through the trade channel and also as a result
of a deterioration in consumer and corporate
sentiment, can be expected.
Additionally, uncertainty about the outlook for
growth in Poland's external environment is
associated with the condition of the financial
system in the euro area. The long period of very
low interest rates contributes to the decline in
profitability of European banks and other financial
institutions. At the same time, in certain countries,
e.g. in Italy, the share of non-performing loans in
the balance sheets of banks is at an elevated level.
These factors could lead to an increase in the risk
premium and curb lending, and, as a result, could
cause a decline in corporate investment. The risk
of lower growth in the global economy than
assumed in the central scenario, particularly in the
long-term projection horizon, is also associated
with the slowdown in labour productivity growth
observed in many economies. Should this process
continue and should productivity growth remain
permanently subdued, it would be an additional
factor hindering the return of the global (and
Polish) economy to the growth path it followed
before the global financial crisis.
A significant economic slowdown in Poland's
environment and restrictions on world trade could
have a negative impact on Poland's GDP growth.
On the one hand, falling demand for the
production of exporters would lead to a
deterioration in sentiment in this sector and a
decline in investment expenditures and
employment. On the other hand, a fall in foreign
direct investment inflows could result in a
slowdown in total factor productivity growth in
Poland. Deteriorating sentiment would also affect
the household sector, translating into reduced
consumer spending. A lower business activity in
Poland and abroad would curb demand pressure,
which, along with falling prices of agricultural and
energy commodities in the global markets, would
cause CPI inflation to run below the central
projection path.
Improvement in global economic conditions
With the election of Donald Trump as President of
the United States, there is a higher probability that
the fiscal stance will become more expansionary.
The tax reforms proposed in April 2017, the effects
of which were to a large extent taken into account
in the July projection, assume the lowering of
personal income tax and corporate income tax.
The possible implementation of the announced
infrastructure investment plan could further
contribute to a pick-up in economic growth in the
US. The final form of these proposals, which
would have a chance of being passed by the US
Congress, is, however, fraught with uncertainty.
Nevertheless, an increase in government
expenditure could lead to an improvement in
economic activity in the USA as compared to the
path assumed in the central scenario of the
4. Projection of inflation and GDP
73
projection. Due to the position of the United States
in the global economy, the fiscal stimulus
measures launched by the new administration
could lead to an increase in economic activity and
an improvement in sentiment in other parts of the
world as well.
The combined effect of fiscal easing on US GDP
growth would depend not only on the type and
the scale of implemented changes, but also on the
hard-to-predict response of the Federal Reserve. In
particular, should the Fed respond to the increase
in inflationary pressures with more pronounced
interest rate increases, they could dampen the
scale of the recovery in investment and consumer
demand as well as contribute to an appreciation of
the US dollar and restrain exports. On the other
hand, fiscal expansion could have a stronger
impact on consumer confidence if accompanied by
a marked increase in consumers' net worth as a
result of a rise in the prices of assets. Given the
above, the current rising trend in the savings rate
related to household deleveraging would
probably be reversed, driving up GDP growth in
the US economy.
Accelerated GDP growth in the euro area could
also result from the rise in corporate gross fixed
capital formation, in particular with respect to
investment in plant and machinery. Corporate
investment growth might also benefit from the
increase in capacity utilisation and the fact that
euro area enterprises have been withholding
decisions on modernization of their machinery for
some time now despite the improvement in the
situation. Factors working in favour of investment
growth also include the likely weakening of the
euro against the US dollar, which would enhance
price competitiveness of exports from the
countries of the currency union, and the continued
quantitative easing in the euro area, facilitating
access to corporate and consumer loans.
An improvement in the business climate in
Poland's external environment would drive up
demand for Polish exports, boosting growth of
corporate investment and thus contributing to a
further revival in the labour market. The sound
financial standing of households, combined with
low policy interest rates, could contribute to a
significant rise in consumption at the expense of a
lower savings rate than assumed in the
projection's baseline scenario. Higher demand
pressure would in turn translate into an upward
revision of the forecasted inflation rate.
Accelerated import price growth as a result of
growing price levels in the global economy would
add to the revision, although the likely zloty
appreciation might curb this impact.
Labour supply in Poland
The situation in the labour market in the recent
period was determined by a sharp increase in
demand for labour resulting from favourable
business conditions and manifested in the
growing number of employed persons. On the
other hand, as a result of the unfavourable
changes in the demographic structure of the
population, the number of economically active
people has decreased over the past two years. The
impact of both of these factors concurrently
contributed to a significant fall in the
unemployment rate and an extension of the time
needed to find a new employee. Therefore, the
labour supply trend over the projection horizon
will be a significant risk factor both for the path of
inflation and GDP growth.
The uncertainty about the size of the workforce is
a result of the difficulties in assessing the rate of
retirement of people who will be entitled to retire
under the current law lowering the statutory
retirement age. In the case of good economic
conditions and high number of vacancies,
retirement may be postponed. In the case of a
slowdown in economic growth, such people may,
Inflation Report – July 2017
74
however, leave the labour market sooner than
assumed in the baseline scenario. A similar
process of a relative fall or rise in the labour force
participation rate may also affect other age groups.
A factor potentially increasing the size of the
labour force in Poland could be the return
migration of Poles from the United Kingdom as a
result of the lack of possibility of extending their
stay in the face of the United Kingdom
withdrawing from the European Union and also
the postponement of planned departures.
The impact on the Polish labour market of the
introduction in June 2017 of visa-free short stays in
the EU for Ukrainian citizens remains difficult to
predict. It cannot be ruled out that Ukrainian
citizens will migrate from Poland to countries with
high labour demand which until now had a more
restrictive visa and migration policy towards
Ukrainians. The number of employees from
Ukraine in Poland could also decline as a result of
a sharpening of the crisis in eastern Ukraine
leading to restrictions on foreign travel imposed
by the Ukrainian authorities. The presence of
Ukrainians on the Polish labour market mitigates
labour shortages in certain sectors and is probably
one of the factors curbing wage growth. A
reduction in the number of migrants could lead to
a faster wage growth and a rise in inflation.
Labour supply barriers could lead to a slowdown
in economic growth over the projection horizon,
limiting the possibility of increasing current
output and corporate investment by weakening
potential output growth.
Oil prices in the global markets
Another source of uncertainty for the central
scenario are fluctuations in the prices of oil and
other energy commodities in the global markets,
which are highly dependent on hard-to-predict
supply conditions. In spite of the ongoing
agreement of the OPEC countries on the oil
production cuts, oil prices have grown slower than
expected in recent months. This could have been
caused by increased exports of OPEC oil stocks.
There is a possibility that in the future oil prices
will begin to grow more rapidly, particularly if the
restrictions on oil production imposed by the
OPEC countries are more clearly reflected in the
volume of exports. At the same time, any sign that
certain signatories of the agreement exceed the
agreed quotas might result in a renewed decline in
oil prices. In addition, it is also unclear what
decisions will be taken by non-OPEC oil producers
and countries that were excluded from the
obligation to reduce production. In particular, the
scale of the future growth in the number of
drilling sites and oil output in the United States
are unknown.
Demand factors related to the prospects of growth
in the global economy, in particular in the
emerging Asian economies, also add to the
uncertainty associated with the path of oil prices
assumed in the baseline scenario.
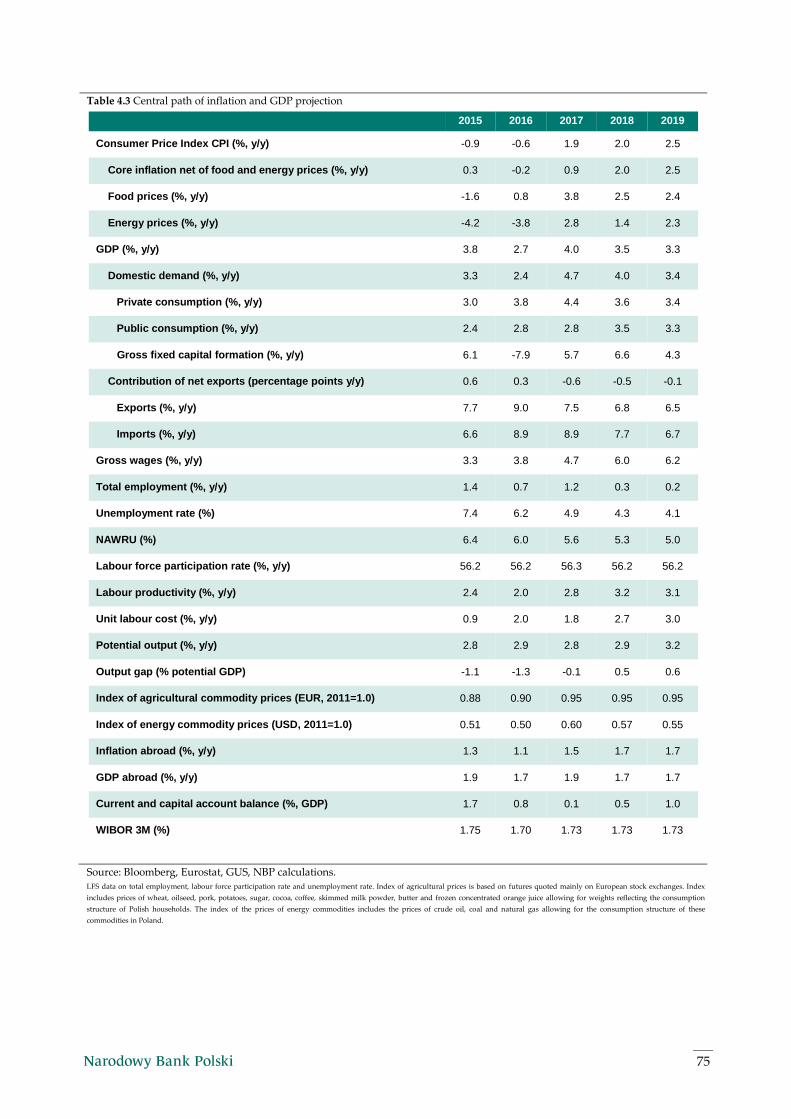
75
Table 4.3 Central path of inflation and GDP projection
2015 2016 2017 2018 2019
Consumer Price Index CPI (%, y/y) -0.9 -0.6 1.9 2.0 2.5
Core inflation net of food and energy prices (%, y/y) 0.3 -0.2 0.9 2.0 2.5
Food prices (%, y/y) -1.6 0.8 3.8 2.5 2.4
Energy prices (%, y/y) -4.2 -3.8 2.8 1.4 2.3
GDP (%, y/y) 3.8 2.7 4.0 3.5 3.3
Domestic demand (%, y/y) 3.3 2.4 4.7 4.0 3.4
Private consumption (%, y/y) 3.0 3.8 4.4 3.6 3.4
Public consumption (%, y/y) 2.4 2.8 2.8 3.5 3.3
Gross fixed capital formation (%, y/y) 6.1 -7.9 5.7 6.6 4.3
Contribution of net exports (percentage points y/y) 0.6 0.3 -0.6 -0.5 -0.1
Exports (%, y/y) 7.7 9.0 7.5 6.8 6.5
Imports (%, y/y) 6.6 8.9 8.9 7.7 6.7
Gross wages (%, y/y) 3.3 3.8 4.7 6.0 6.2
Total employment (%, y/y) 1.4 0.7 1.2 0.3 0.2
Unemployment rate (%) 7.4 6.2 4.9 4.3 4.1
NAWRU (%) 6.4 6.0 5.6 5.3 5.0
Labour force participation rate (%, y/y) 56.2 56.2 56.3 56.2 56.2
Labour productivity (%, y/y) 2.4 2.0 2.8 3.2 3.1
Unit labour cost (%, y/y) 0.9 2.0 1.8 2.7 3.0
Potential output (%, y/y) 2.8 2.9 2.8 2.9 3.2
Output gap (% potential GDP) -1.1 -1.3 -0.1 0.5 0.6
Index of agricultural commodity prices (EUR, 2011=1.0) 0.88 0.90 0.95 0.95 0.95
Index of energy commodity prices (USD, 2011=1.0) 0.51 0.50 0.60 0.57 0.55
Inflation abroad (%, y/y) 1.3 1.1 1.5 1.7 1.7
GDP abroad (%, y/y) 1.9 1.7 1.9 1.7 1.7
Current and capital account balance (%, GDP) 1.7 0.8 0.1 0.5 1.0
WIBOR 3M (%) 1.75 1.70 1.73 1.73 1.73
Source: Bloomberg, Eurostat, GUS, NBP calculations. LFS data on total employment, labour force participation rate and unemployment rate. Index of agricultural prices is based on futures quoted mainly on European stock exchanges. Index
includes prices of wheat, oilseed, pork, potatoes, sugar, cocoa, coffee, skimmed milk powder, butter and frozen concentrated orange juice allowing for weights reflecting the consumption
structure of Polish households. The index of the prices of energy commodities includes the prices of crude oil, coal and natural gas allowing for the consumption structure of these
commodities in Poland.

Inflation Report – July 2017
76
5. The voting of the Monetary Policy Council members in March – May 2017
77
The voting of the Monetary Policy Council 5
members in March – May 2017
Date: 4 April 2017
Subject matter of motion or resolution:
Resolution No. 1/2017 of 4 April 2017 on approving the Annual Financial Report of Narodowy
Bank Polski prepared as of 31 December 2016.
Voting of the MPC members:
For: A. Glapiński
G. M. Ancyparowicz
Ł. J. Hardt
E. M. Łon
E. J. Osiatyński
R. Sura
J. Żyżyński
Against: E. Gatnar
J. J. Kropiwnicki
K. Zubelewicz
Date: 17 May 2017
Subject matter of motion or resolution:
Resolution No. 2/2017 of 17 May 2017 on approving the report on monetary policy in 2016.
Voting of the MPC members:
For: A. Glapiński
G. M. Ancyparowicz
E. Gatnar
Ł. J. Hardt
E. M. Łon
E. J. Osiatyński
R. Sura
K. Zubelewicz
J. Żyżyński
Against:
J. J. Kropiwnicki was absent.
Inflation Report – July 2017
78
Date: 17 May 2017
Subject matter of motion or resolution:
Resolution No. 3/2017 of 17 May 2017 on the evaluation of the activities of the NBP Management
Board as regards the implementation of monetary policy guidelines for 2016.
Voting of the MPC members:
For: A. Glapiński
G. M. Ancyparowicz
E. Gatnar
Ł. J. Hardt
E. M. Łon
E. J. Osiatyński
R. Sura
K. Zubelewicz
J. Żyżyński
Against:
J. J. Kropiwnicki was absent.

www.nbp.pl


