24
Inflation Report May 2015 Prospects for inflation
| Date post: | 19-Dec-2015 |
| Category: |
Documents |
| Upload: | toby-jackson |
| View: | 229 times |
| Download: | 1 times |

Inflation Report May 2015
Prospects for inflation
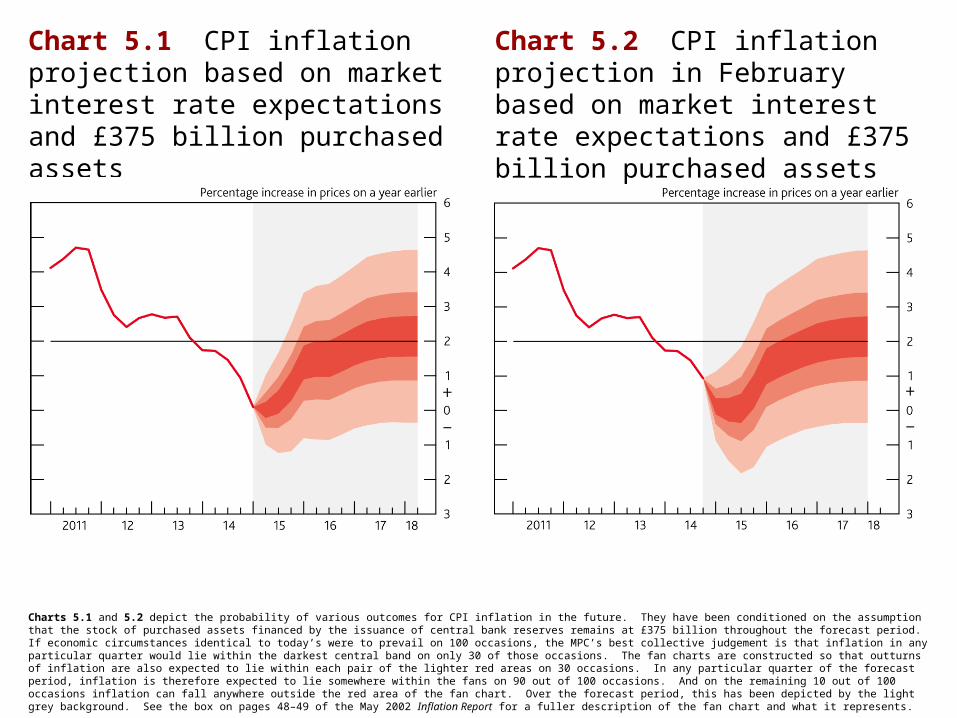
Chart 5.1 CPI inflation projection based on market interest rate expectations and £375 billion purchased assets
Chart 5.2 CPI inflation projection in February based on market interest rate expectations and £375 billion purchased assets
Charts 5.1 and 5.2 depict the probability of various outcomes for CPI inflation in the future. They have been conditioned on the assumption that the stock of purchased assets financed by the issuance of central bank reserves remains at £375 billion throughout the forecast period. If economic circumstances identical to today’s were to prevail on 100 occasions, the MPC’s best collective judgement is that inflation in any particular quarter would lie within the darkest central band on only 30 of those occasions. The fan charts are constructed so that outturns of inflation are also expected to lie within each pair of the lighter red areas on 30 occasions. In any particular quarter of the forecast period, inflation is therefore expected to lie somewhere within the fans on 90 out of 100 occasions. And on the remaining 10 out of 100 occasions inflation can fall anywhere outside the red area of the fan chart. Over the forecast period, this has been depicted by the light grey background. See the box on pages 48–49 of the May 2002 Inflation Report for a fuller description of the fan chart and what it represents.
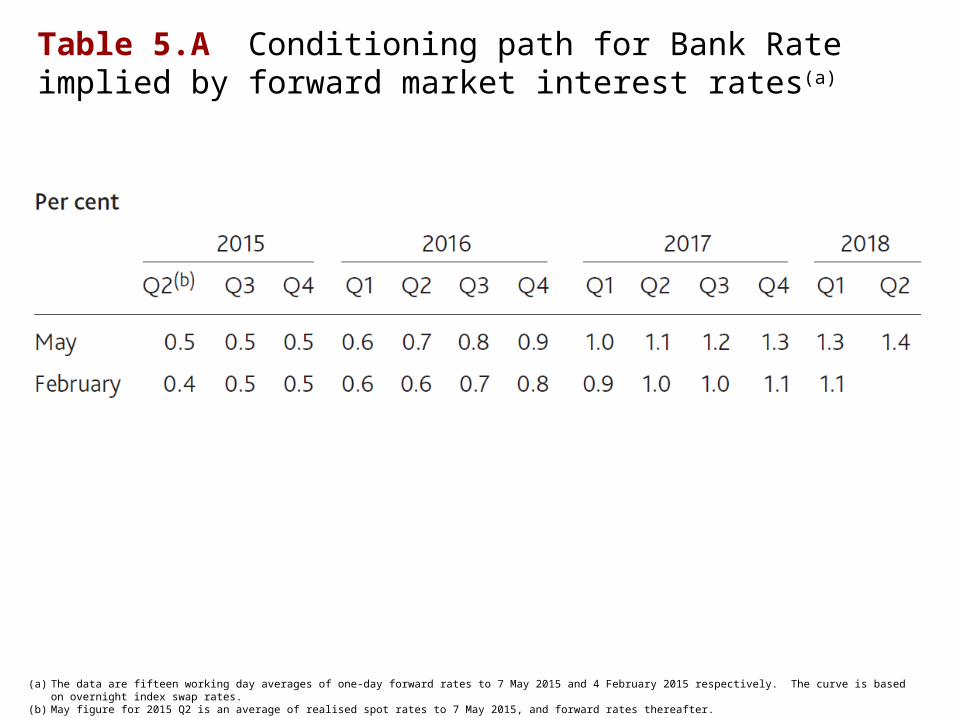
Table 5.A Conditioning path for Bank Rate implied by forward market interest rates(a)
(a) The data are fifteen working day averages of one-day forward rates to 7 May 2015 and 4 February 2015 respectively. The curve is based on overnight index swap rates.(b) May figure for 2015 Q2 is an average of realised spot rates to 7 May 2015, and forward rates thereafter.
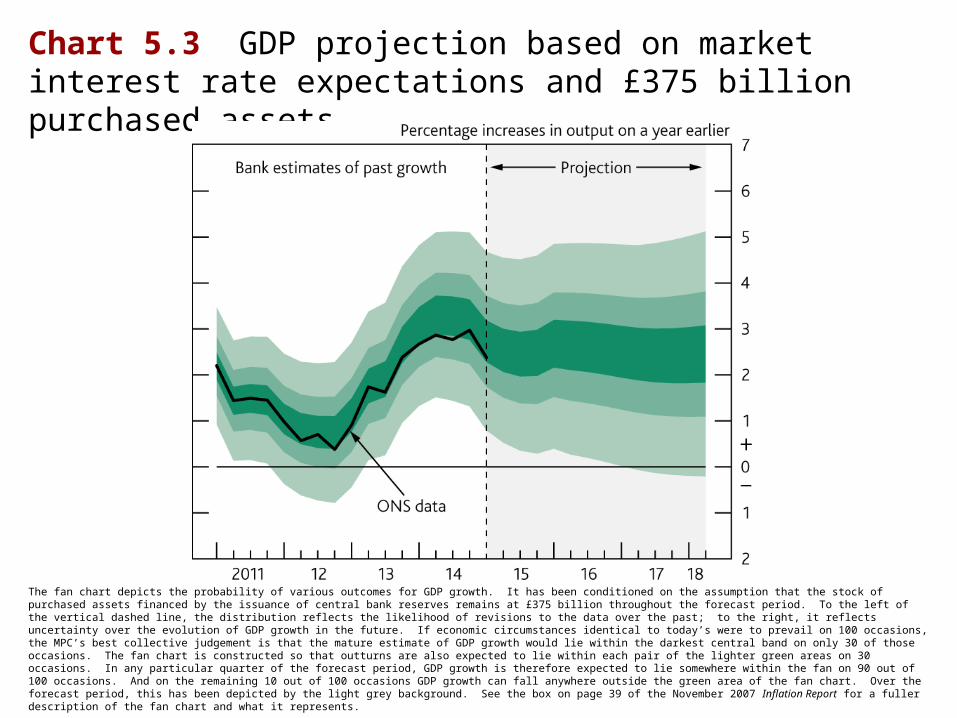
Chart 5.3 GDP projection based on market interest rate expectations and £375 billion purchased assets
The fan chart depicts the probability of various outcomes for GDP growth. It has been conditioned on the assumption that the stock of purchased assets financed by the issuance of central bank reserves remains at £375 billion throughout the forecast period. To the left of the vertical dashed line, the distribution reflects the likelihood of revisions to the data over the past; to the right, it reflects uncertainty over the evolution of GDP growth in the future. If economic circumstances identical to today’s were to prevail on 100 occasions, the MPC’s best collective judgement is that the mature estimate of GDP growth would lie within the darkest central band on only 30 of those occasions. The fan chart is constructed so that outturns are also expected to lie within each pair of the lighter green areas on 30 occasions. In any particular quarter of the forecast period, GDP growth is therefore expected to lie somewhere within the fan on 90 out of 100 occasions. And on the remaining 10 out of 100 occasions GDP growth can fall anywhere outside the green area of the fan chart. Over the forecast period, this has been depicted by the light grey background. See the box on page 39 of the November 2007 Inflation Report for a fuller description of the fan chart and what it represents.
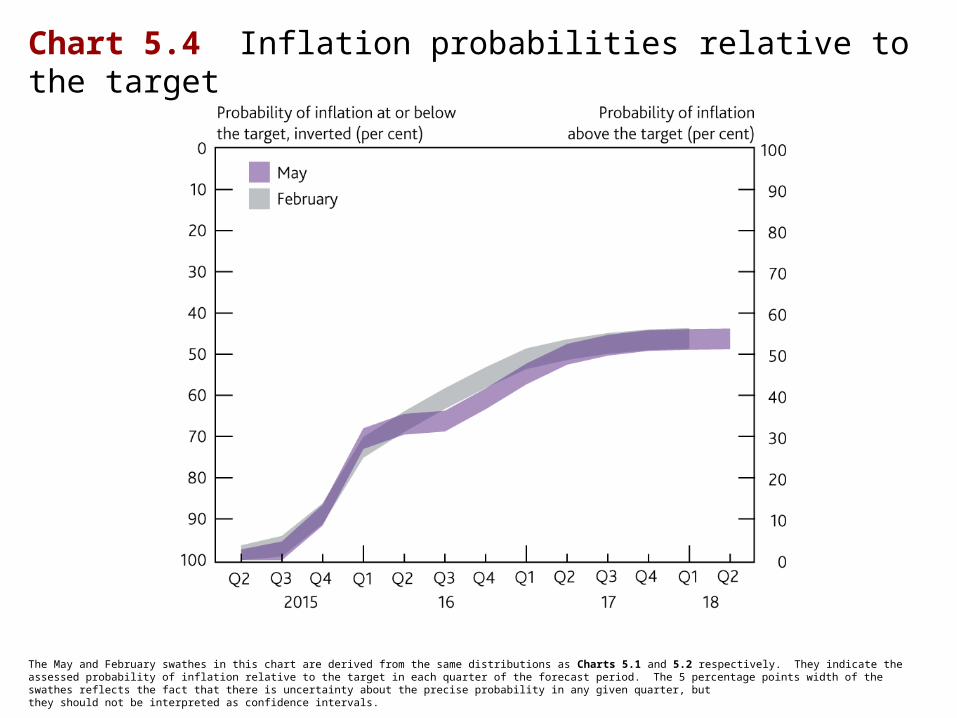
Chart 5.4 Inflation probabilities relative to the target
The May and February swathes in this chart are derived from the same distributions as Charts 5.1 and 5.2 respectively. They indicate the assessed probability of inflation relative to the target in each quarter of the forecast period. The 5 percentage points width of the swathes reflects the fact that there is uncertainty about the precise probability in any given quarter, butthey should not be interpreted as confidence intervals.
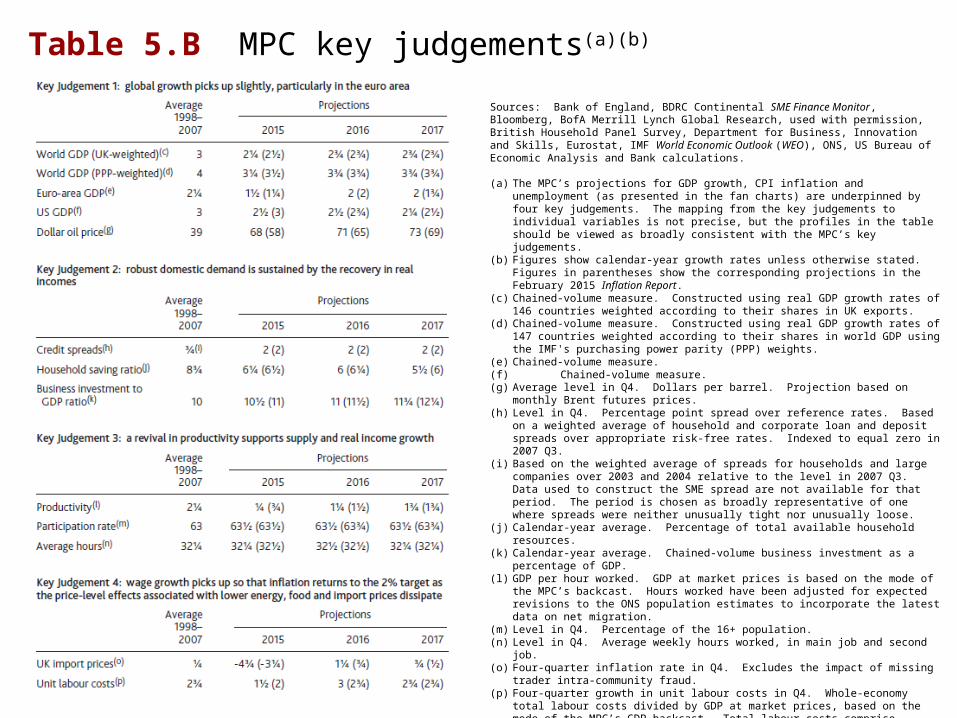
Table 5.B MPC key judgements(a)(b)
Sources: Bank of England, BDRC Continental SME Finance Monitor, Bloomberg, BofA Merrill Lynch Global Research, used with permission, British Household Panel Survey, Department for Business, Innovation and Skills, Eurostat, IMF World Economic Outlook (WEO), ONS, US Bureau of Economic Analysis and Bank calculations.
(a) The MPC’s projections for GDP growth, CPI inflation and unemployment (as presented in the fan charts) are underpinned by four key judgements. The mapping from the key judgements to individual variables is not precise, but the profiles in the table should be viewed as broadly consistent with the MPC’s key judgements.
(b) Figures show calendar-year growth rates unless otherwise stated. Figures in parentheses show the corresponding projections in the February 2015 Inflation Report.
(c) Chained-volume measure. Constructed using real GDP growth rates of 146 countries weighted according to their shares in UK exports.
(d) Chained-volume measure. Constructed using real GDP growth rates of 147 countries weighted according to their shares in world GDP using the IMF's purchasing power parity (PPP) weights.
(e) Chained-volume measure.(f) Chained-volume measure.(g) Average level in Q4. Dollars per barrel. Projection based on monthly Brent futures prices.(h) Level in Q4. Percentage point spread over reference rates. Based on a weighted average
of household and corporate loan and deposit spreads over appropriate risk-free rates. Indexed to equal zero in 2007 Q3.
(i) Based on the weighted average of spreads for households and large companies over 2003 and 2004 relative to the level in 2007 Q3. Data used to construct the SME spread are not available for that period. The period is chosen as broadly representative of one where spreads were neither unusually tight nor unusually loose.
(j) Calendar-year average. Percentage of total available household resources.(k) Calendar-year average. Chained-volume business investment as a percentage of GDP.(l) GDP per hour worked. GDP at market prices is based on the mode of the MPC’s
backcast. Hours worked have been adjusted for expected revisions to the ONS population estimates to incorporate the latest data on net migration.
(m) Level in Q4. Percentage of the 16+ population.(n) Level in Q4. Average weekly hours worked, in main job and second job.(o) Four-quarter inflation rate in Q4. Excludes the impact of missing trader intra-community
fraud.(p) Four-quarter growth in unit labour costs in Q4. Whole-economy total labour costs divided
by GDP at market prices, based on the mode of the MPC’s GDP backcast. Total labour costs comprise compensation of employees and the labour share multiplied by mixed income.
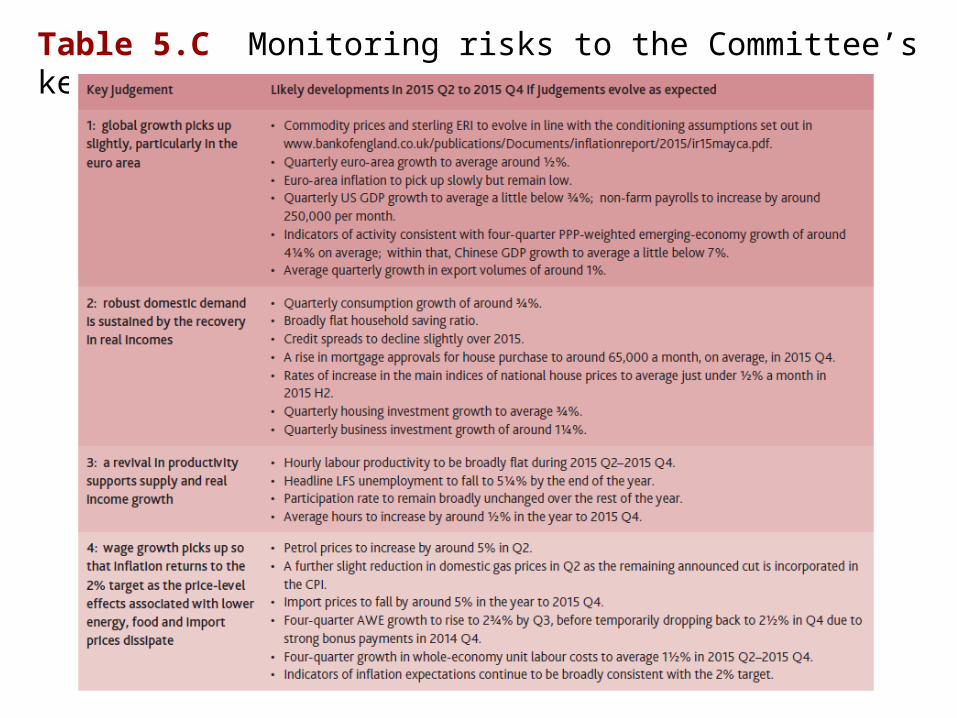
Table 5.C Monitoring risks to the Committee’s key judgements
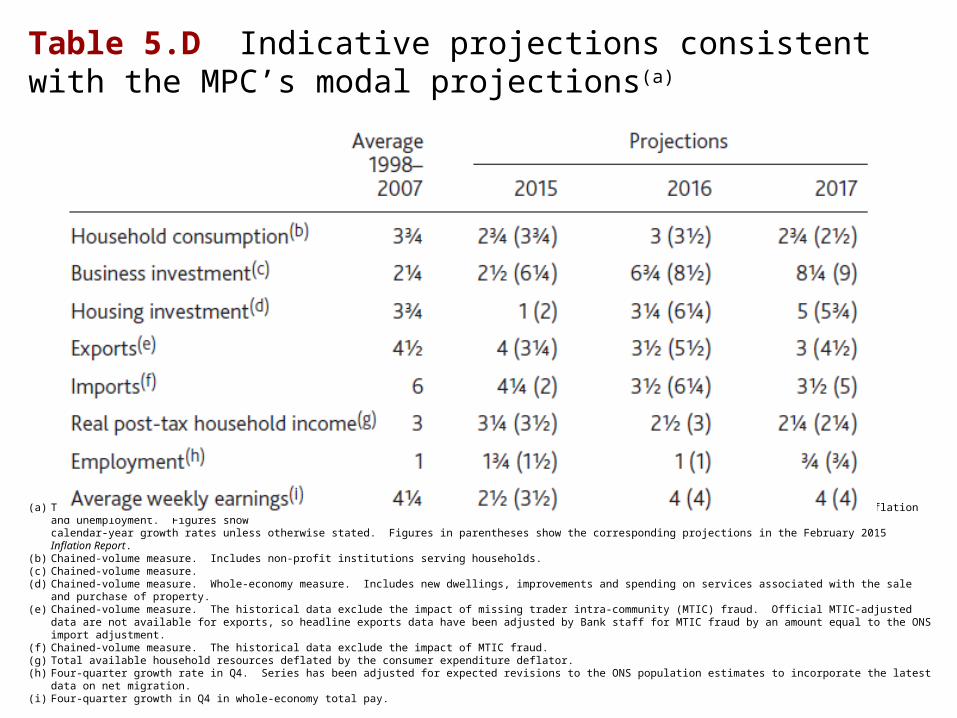
Table 5.D Indicative projections consistent with the MPC’s modal projections(a)
(a) These projections are produced by Bank staff for the MPC to be consistent with the MPC’s modal projections for GDP growth, CPI inflation and unemployment. Figures show calendar-year growth rates unless otherwise stated. Figures in parentheses show the corresponding projections in the February 2015 Inflation Report.
(b) Chained-volume measure. Includes non-profit institutions serving households.(c) Chained-volume measure.(d) Chained-volume measure. Whole-economy measure. Includes new dwellings, improvements and spending on services associated with the sale and purchase of property.(e) Chained-volume measure. The historical data exclude the impact of missing trader intra-community (MTIC) fraud. Official MTIC-adjusted data are not available for exports, so headline
exports data have been adjusted by Bank staff for MTIC fraud by an amount equal to the ONS import adjustment.(f) Chained-volume measure. The historical data exclude the impact of MTIC fraud.(g) Total available household resources deflated by the consumer expenditure deflator.(h) Four-quarter growth rate in Q4. Series has been adjusted for expected revisions to the ONS population estimates to incorporate the latest data on net migration.(i) Four-quarter growth in Q4 in whole-economy total pay.
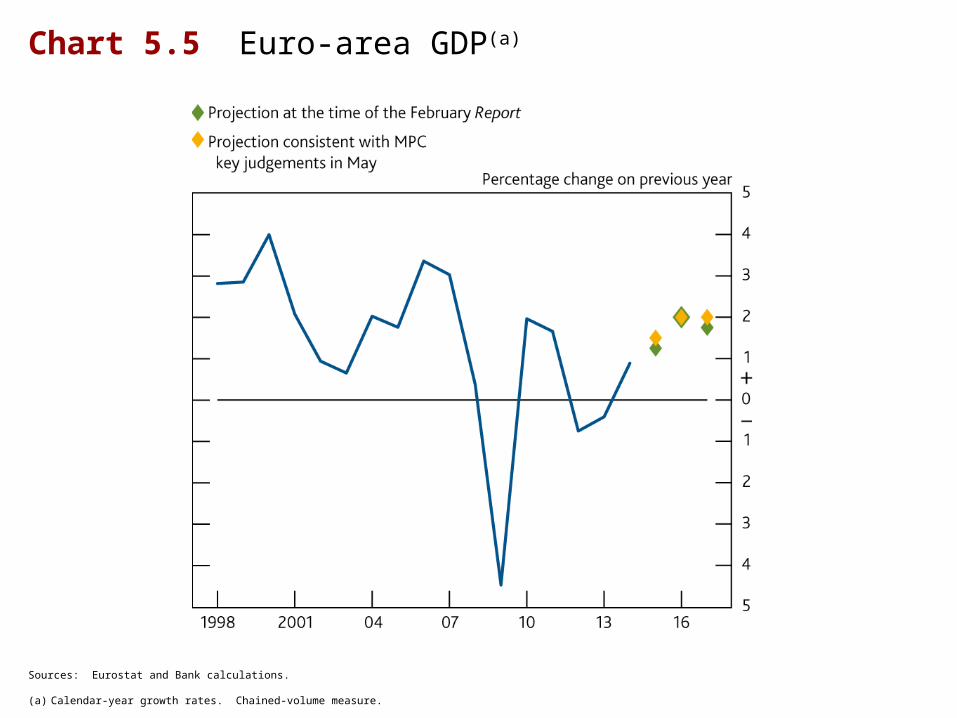
Chart 5.5 Euro-area GDP(a)
Sources: Eurostat and Bank calculations.
(a) Calendar-year growth rates. Chained-volume measure.
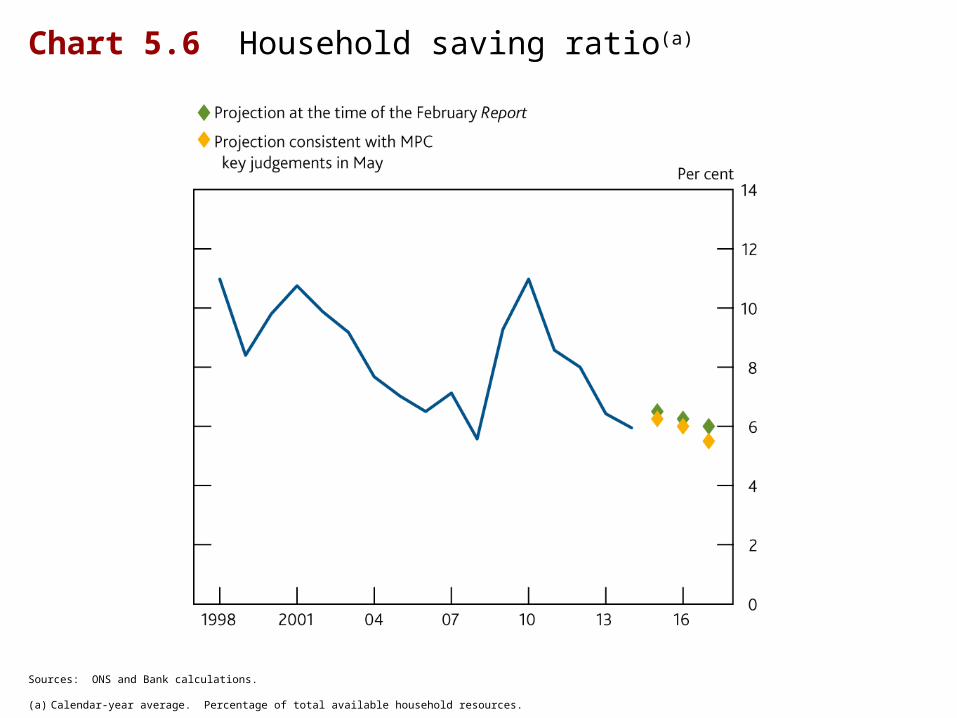
Chart 5.6 Household saving ratio(a)
Sources: ONS and Bank calculations.
(a) Calendar-year average. Percentage of total available household resources.
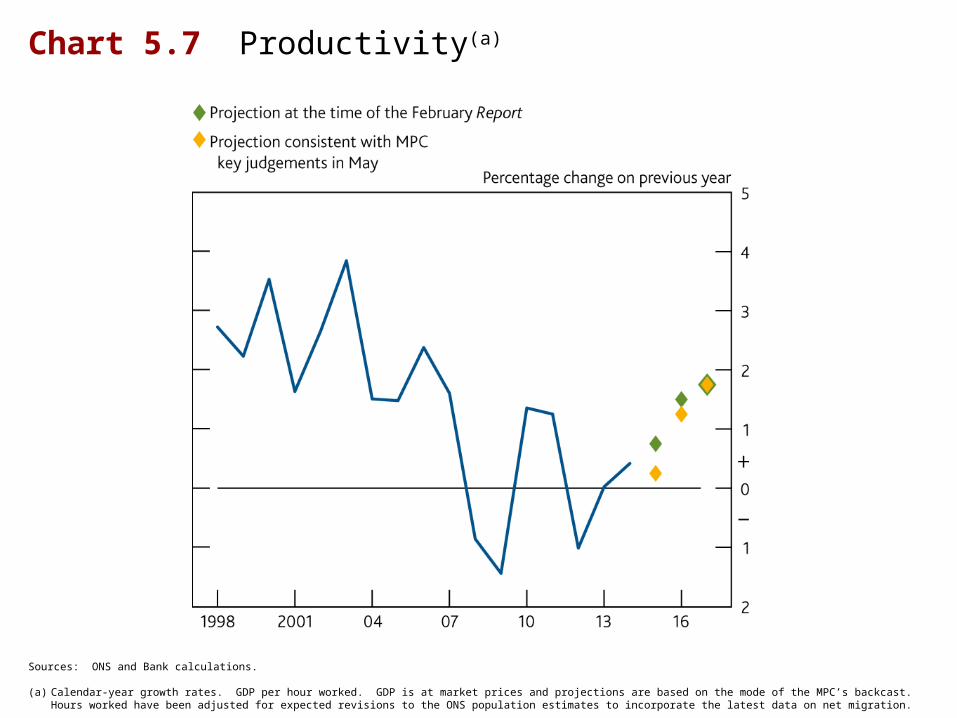
Chart 5.7 Productivity(a)
Sources: ONS and Bank calculations.
(a) Calendar-year growth rates. GDP per hour worked. GDP is at market prices and projections are based on the mode of the MPC’s backcast. Hours worked have been adjusted for expected revisions to the ONS population estimates to incorporate the latest data on net migration.
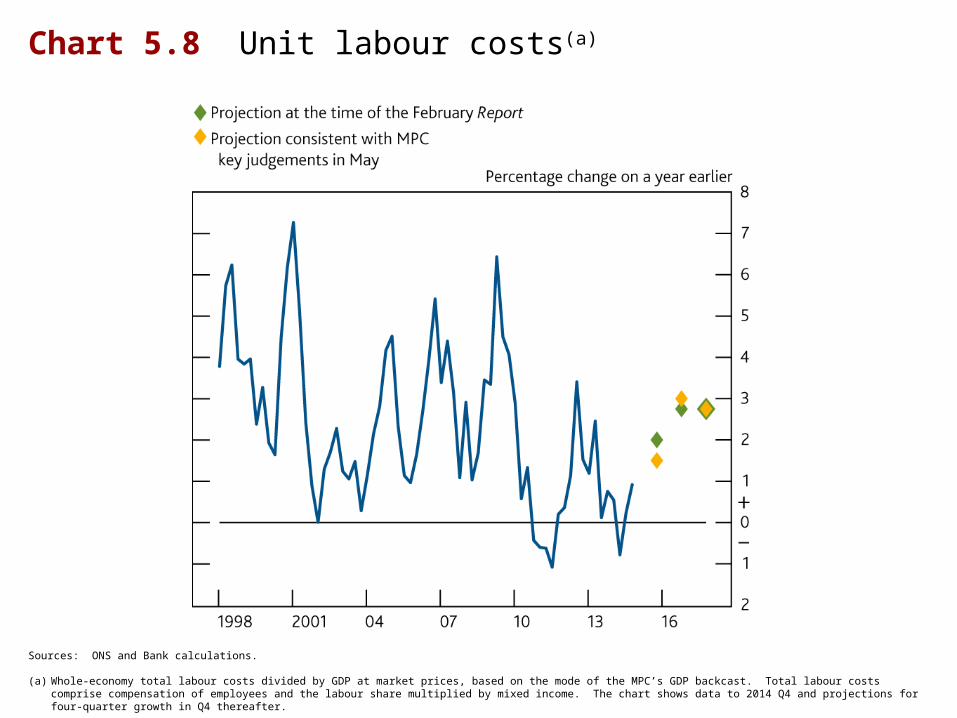
Chart 5.8 Unit labour costs(a)
Sources: ONS and Bank calculations.
(a) Whole-economy total labour costs divided by GDP at market prices, based on the mode of the MPC’s GDP backcast. Total labour costs comprise compensation of employees and the labour share multiplied by mixed income. The chart shows data to 2014 Q4 and projections for four-quarter growth in Q4 thereafter.
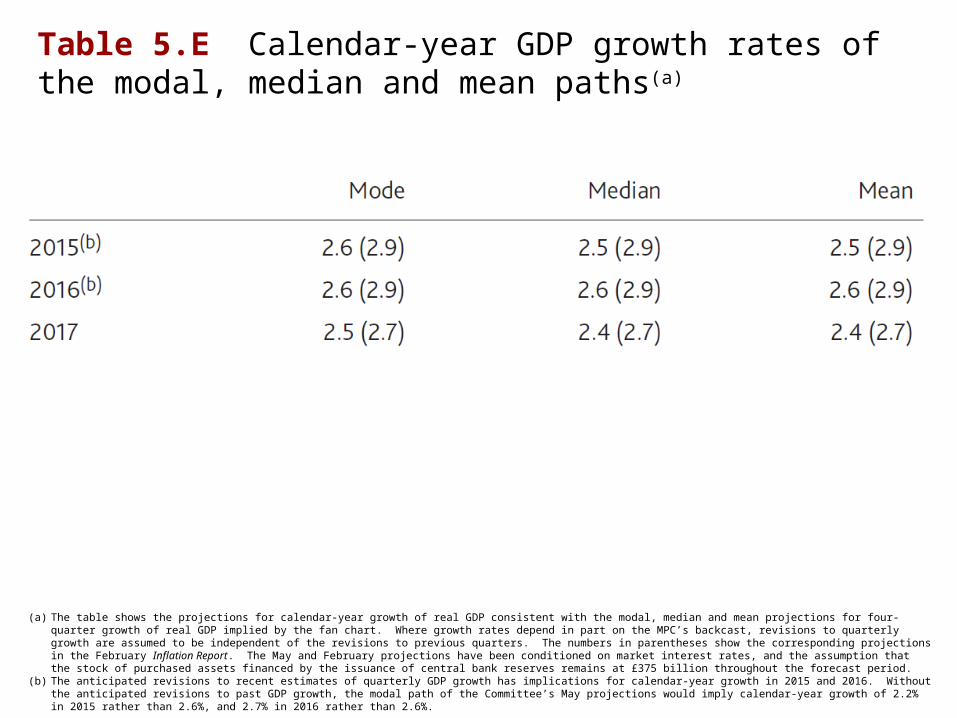
Table 5.E Calendar-year GDP growth rates of the modal, median and mean paths(a)
(a) The table shows the projections for calendar-year growth of real GDP consistent with the modal, median and mean projections for four-quarter growth of real GDP implied by the fan chart. Where growth rates depend in part on the MPC’s backcast, revisions to quarterly growth are assumed to be independent of the revisions to previous quarters. The numbers in parentheses show the corresponding projections in the February Inflation Report. The May and February projections have been conditioned on market interest rates, and the assumption that the stock of purchased assets financed by the issuance of central bank reserves remains at £375 billion throughout the forecast period.
(b) The anticipated revisions to recent estimates of quarterly GDP growth has implications for calendar-year growth in 2015 and 2016. Without the anticipated revisions to past GDP growth, the modal path of the Committee’s May projections would imply calendar-year growth of 2.2% in 2015 rather than 2.6%, and 2.7% in 2016 rather than 2.6%.
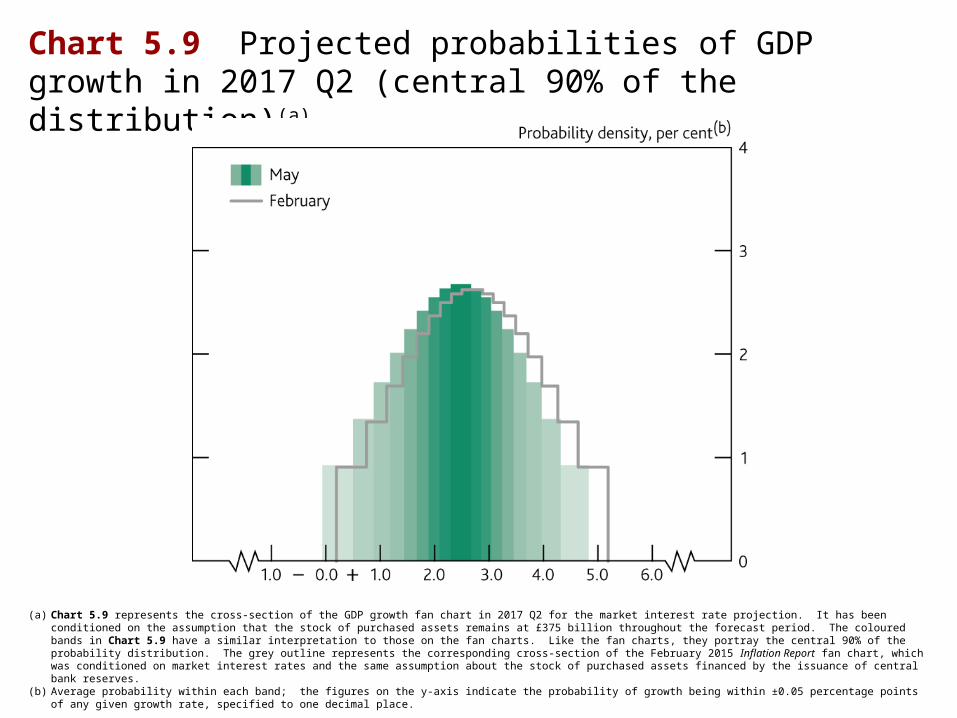
Chart 5.9 Projected probabilities of GDP growth in 2017 Q2 (central 90% of the distribution)(a)
(a) Chart 5.9 represents the cross-section of the GDP growth fan chart in 2017 Q2 for the market interest rate projection. It has been conditioned on the assumption that the stock of purchased assets remains at £375 billion throughout the forecast period. The coloured bands in Chart 5.9 have a similar interpretation to those on the fan charts. Like the fan charts, they portray the central 90% of the probability distribution. The grey outline represents the corresponding cross-section of the February 2015 Inflation Report fan chart, which was conditioned on market interest rates and the same assumption about the stock of purchased assets financed by the issuance of central bank reserves.
(b) Average probability within each band; the figures on the y-axis indicate the probability of growth being within ±0.05 percentage points of any given growth rate, specified to one decimal place.

Chart 5.10 Unemployment projection based on market interest rate expectations and £375 billion purchased assets
The fan chart depicts the probability of various outcomes for LFS unemployment. It has been conditioned on the assumption that the stock of purchased assets financed by the issuance ofcentral bank reserves remains at £375 billion throughout the forecast period. The coloured bands have the same interpretation as in Chart 5.1, and portray 90% of the probability distribution. The calibration of this fan chart takes account of the likely path dependency of the economy, where, for example, it is judged that shocks to unemployment in one quarter will continue to have some effect on unemployment in successive quarters. The fan begins in 2015 Q1, a quarter earlier than the fan for CPI inflation. That is because Q1 is a staff projection for the unemployment rate, based in part on data for January and February. The unemployment rate was 5.6% in the three months to February, and is projected to fall to 5.5% in Q1 as a whole. In the later part of the forecast period, a significant proportion of this distribution lies below Bank staff’s current estimate of the long-term equilibrium unemployment rate. There is therefore uncertainty about the precise calibration of this fan chart.
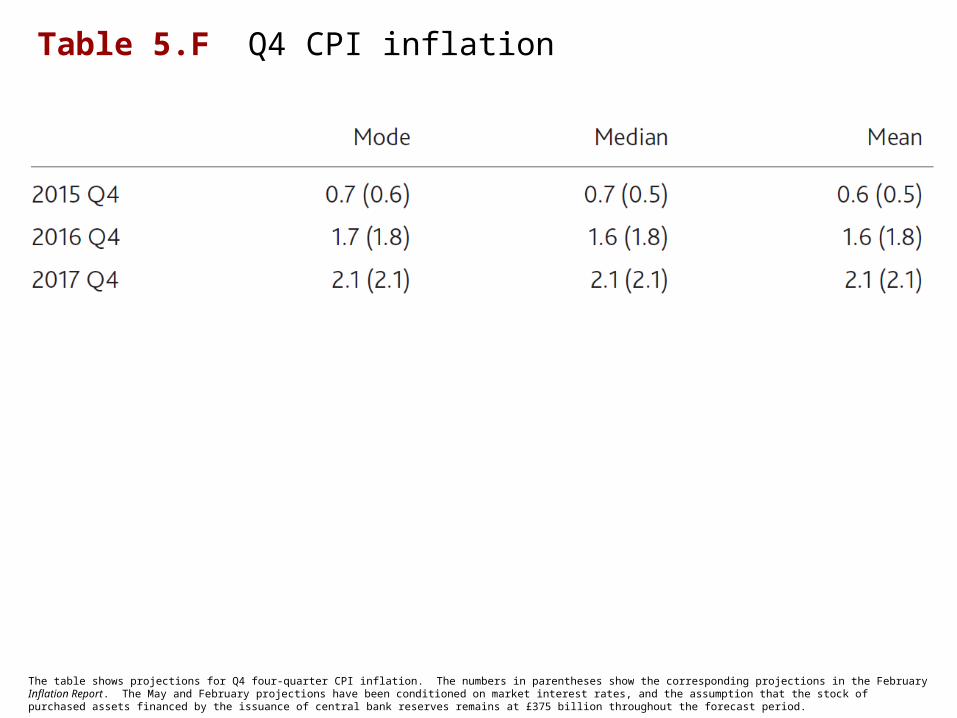
Table 5.F Q4 CPI inflation
The table shows projections for Q4 four-quarter CPI inflation. The numbers in parentheses show the corresponding projections in the February Inflation Report. The May and February projections have been conditioned on market interest rates, and the assumption that the stock of purchased assets financed by the issuance of central bank reserves remains at £375 billion throughout the forecast period.
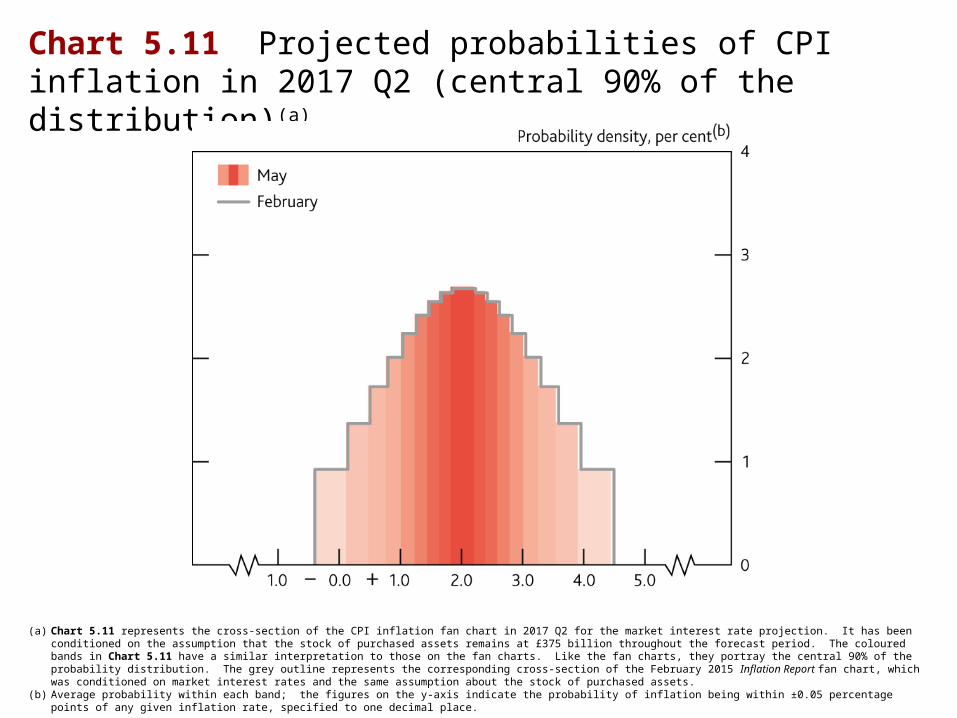
Chart 5.11 Projected probabilities of CPI inflation in 2017 Q2 (central 90% of the distribution)(a)
(a) Chart 5.11 represents the cross-section of the CPI inflation fan chart in 2017 Q2 for the market interest rate projection. It has been conditioned on the assumption that the stock of purchased assets remains at £375 billion throughout the forecast period. The coloured bands in Chart 5.11 have a similar interpretation to those on the fan charts. Like the fan charts, they portray the central 90% of the probability distribution. The grey outline represents the corresponding cross-section of the February 2015 Inflation Report fan chart, which was conditioned on market interest rates and the same assumption about the stock of purchased assets.
(b) Average probability within each band; the figures on the y-axis indicate the probability of inflation being within ±0.05 percentage points of any given inflation rate, specified to one decimal place.
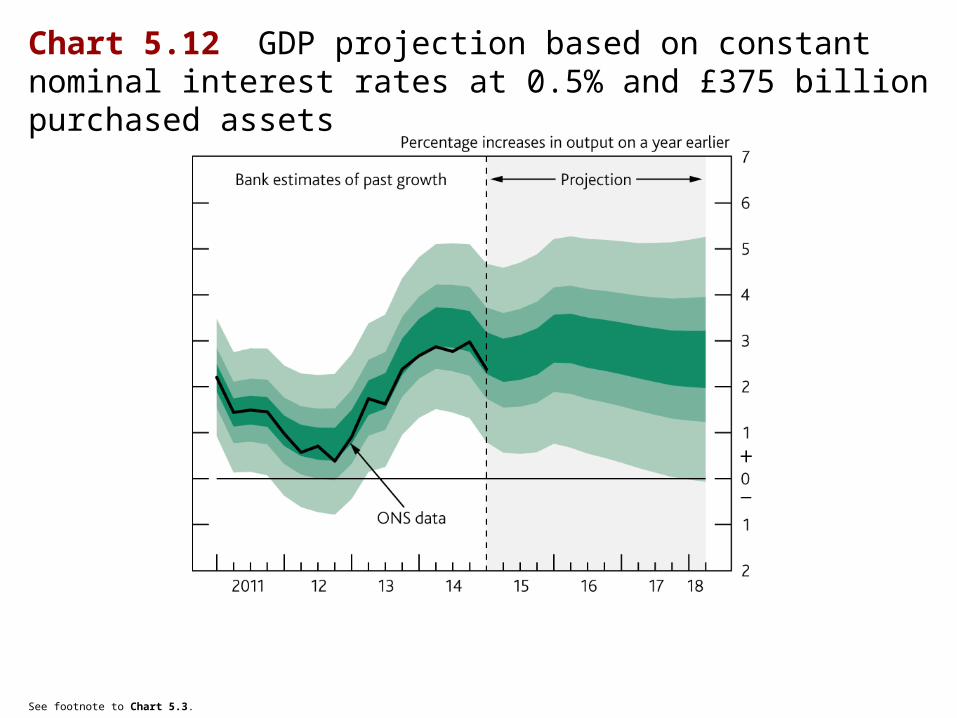
Chart 5.12 GDP projection based on constant nominal interest rates at 0.5% and £375 billion purchased assets
See footnote to Chart 5.3.
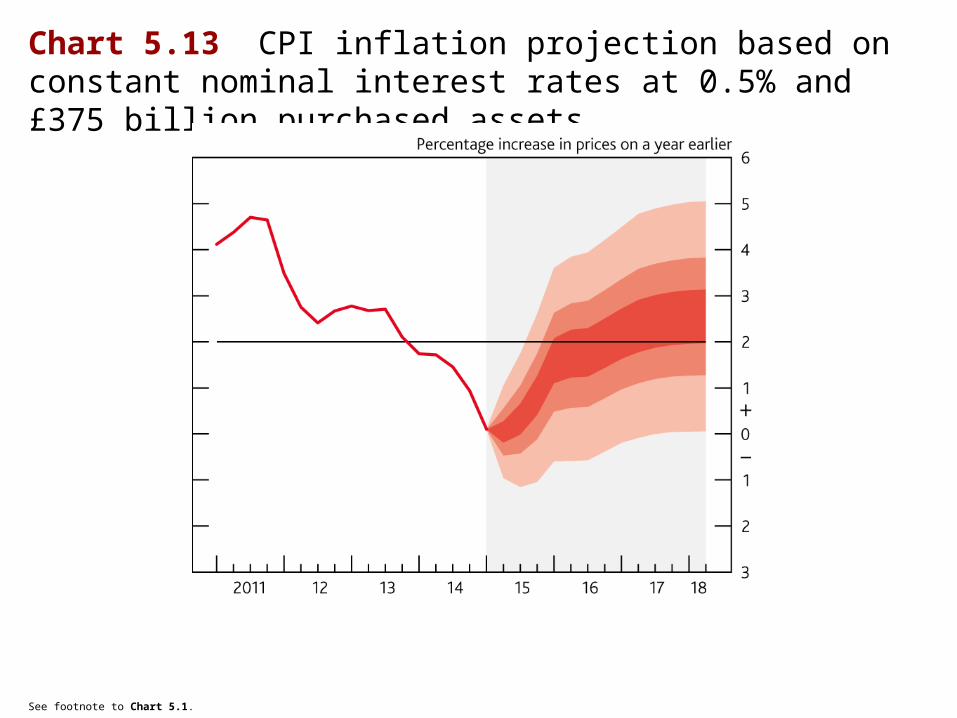
Chart 5.13 CPI inflation projection based on constant nominal interest rates at 0.5% and £375 billion purchased assets
See footnote to Chart 5.1.
Other forecasters’ expectations
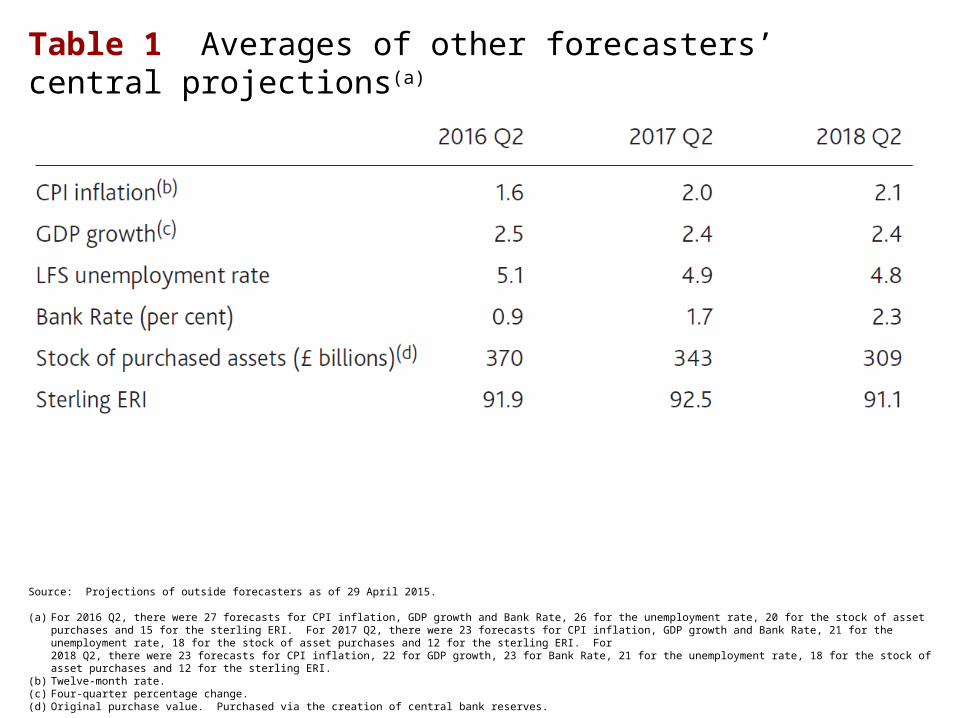
Table 1 Averages of other forecasters’ central projections(a)
Source: Projections of outside forecasters as of 29 April 2015.
(a) For 2016 Q2, there were 27 forecasts for CPI inflation, GDP growth and Bank Rate, 26 for the unemployment rate, 20 for the stock of asset purchases and 15 for the sterling ERI. For 2017 Q2, there were 23 forecasts for CPI inflation, GDP growth and Bank Rate, 21 for the unemployment rate, 18 for the stock of asset purchases and 12 for the sterling ERI. For 2018 Q2, there were 23 forecasts for CPI inflation, 22 for GDP growth, 23 for Bank Rate, 21 for the unemployment rate, 18 for the stock of asset purchases and 12 for the sterling ERI.
(b) Twelve-month rate.(c) Four-quarter percentage change.(d) Original purchase value. Purchased via the creation of central bank reserves.
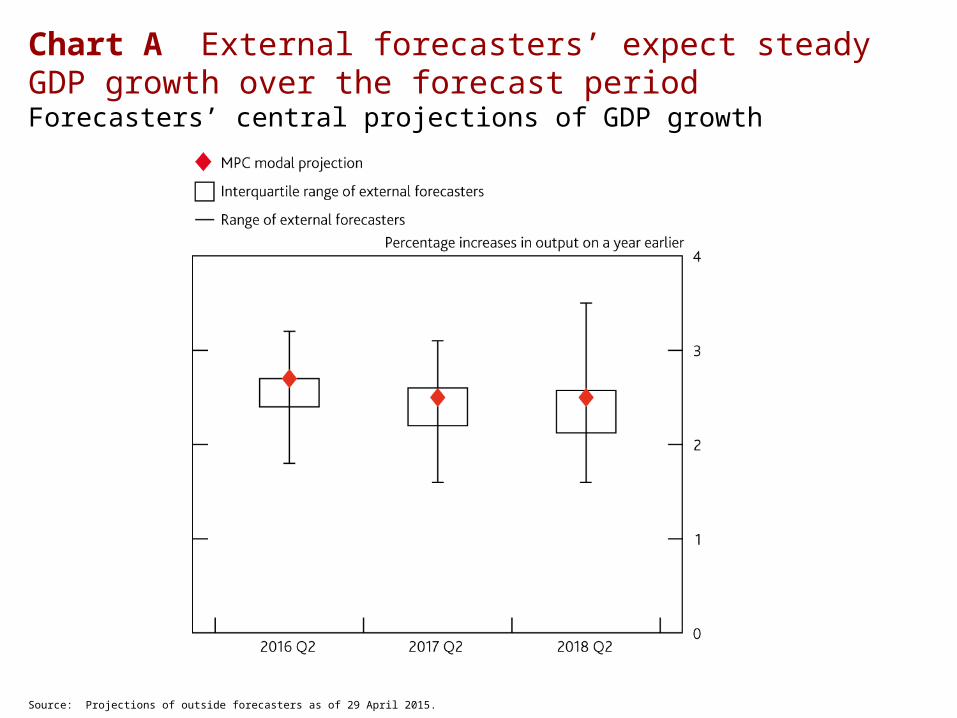
Chart A External forecasters’ expect steady GDP growth over the forecast periodForecasters’ central projections of GDP growth
Source: Projections of outside forecasters as of 29 April 2015.
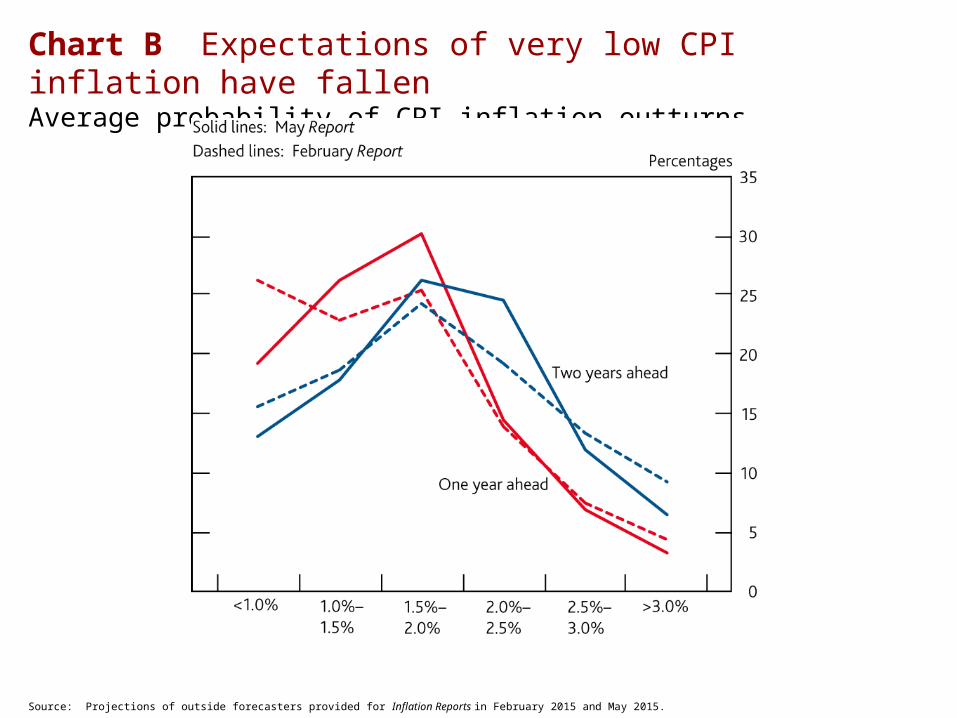
Chart B Expectations of very low CPI inflation have fallenAverage probability of CPI inflation outturns
Source: Projections of outside forecasters provided for Inflation Reports in February 2015 and May 2015.
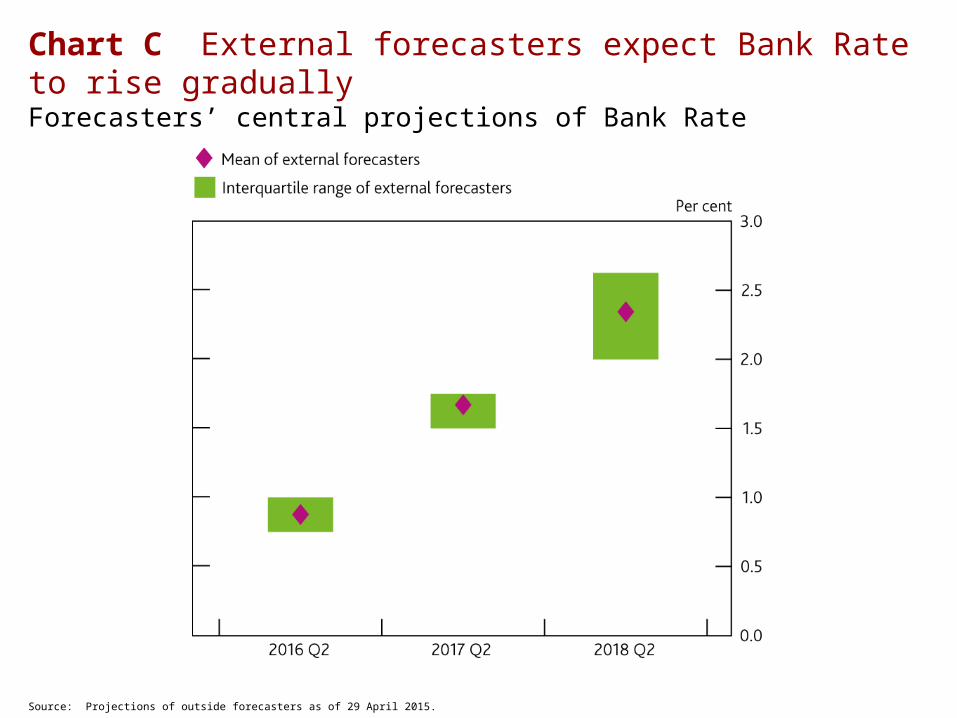
Chart C External forecasters expect Bank Rate to rise graduallyForecasters’ central projections of Bank Rate
Source: Projections of outside forecasters as of 29 April 2015.


