18
Inflation Report November 2013 Costs and prices
| Date post: | 22-Dec-2015 |
| Category: |
Documents |
| Upload: | suzan-cunningham |
| View: | 214 times |
| Download: | 0 times |

Inflation Report November 2013
Costs and prices
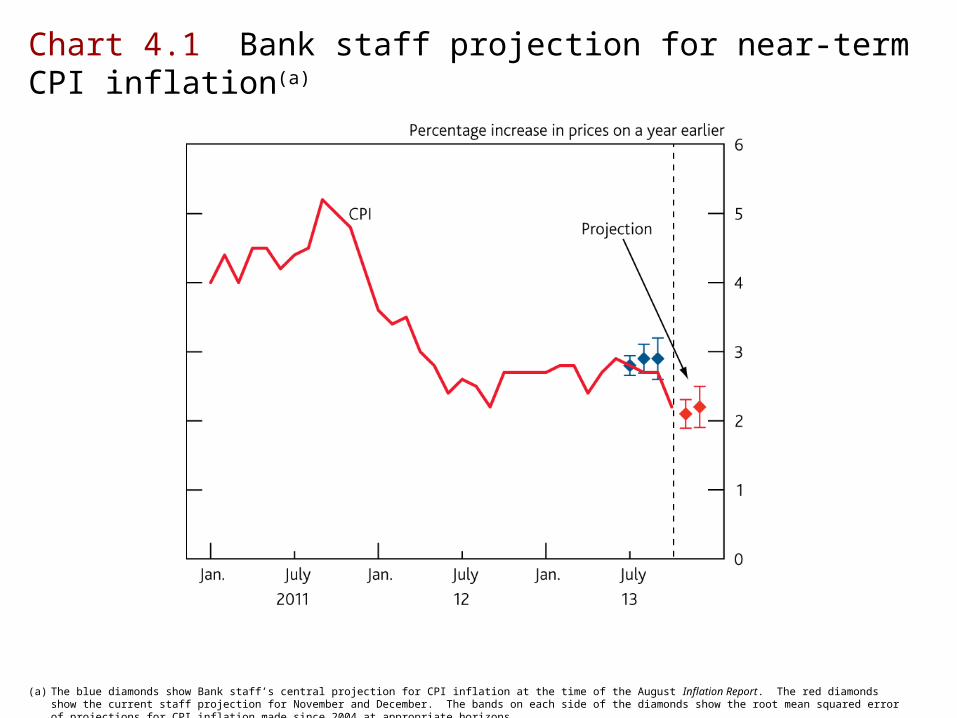
Chart 4.1 Bank staff projection for near-term CPI inflation(a)
(a) The blue diamonds show Bank staff’s central projection for CPI inflation at the time of the August Inflation Report. The red diamonds show the current staff projection for November and December. The bands on each side of the diamonds show the root mean squared error of projections for CPI inflation made since 2004 at appropriate horizons.

Chart 4.2 Contributions to CPI inflation(a)
(a) Quarterly contributions to annual CPI inflation. Data are non seasonally adjusted.(b) Calculated as a residual. Includes a rounding residual.

Chart 4.3 Sterling oil and wholesale gas prices
Sources: Bank of England, Bloomberg, Thomson Reuters Datastream and Bank calculations.
(a) Brent forward prices for delivery in 10–21 days’ time converted into sterling.(b) One-day forward price of UK natural gas.(c) The futures prices shown are averages during the fifteen working days to 31 July (dotted lines) and 6 November 2013 (dashed lines). The sterling oil futures curve is calculated by
assuming that the sterling-dollar exchange rate remains at its average level during those respective fifteen-day periods.

Chart 4.4 Sterling effective exchange rate, UK import prices and foreign export prices excluding energy
Sources: Bank of England, CEIC, Eurostat, ONS, Thomson Reuters Datastream and Bank calculations.
(a) Domestic currency export prices of goods and services of 52 countries weighted according to their shares in UK imports. The sample does not include any major oil exporters. The observation for 2013 Q2 is an estimate. In 2013 Q2, export prices for Croatia, Pakistan, the Philippines and Turkey are assumed to grow at the same rate as export prices in the rest of the world.
(b) Goods and services excluding fuels deflator, excluding the impact of MTIC fraud.

Chart 4.5 UK non-energy import prices and contribution of import-intensive components to CPI inflation
Sources: ONS and Bank calculations.
(a) Goods and services deflator excluding fuels and the impact of MTIC fraud. (b) Quarterly contribution of the 17 most import-intensive components relative to their 2003–06 average, excluding tobacco (because of the impact of duties), and operation of personal
transport equipment (which includes petrol prices). The contribution from clothing and footwear has been adjusted by a total of 0.3 percentage points to reflect a change in methodology in 2010. The import intensities of CPI components have been estimated using ONS Supply and Use tables.
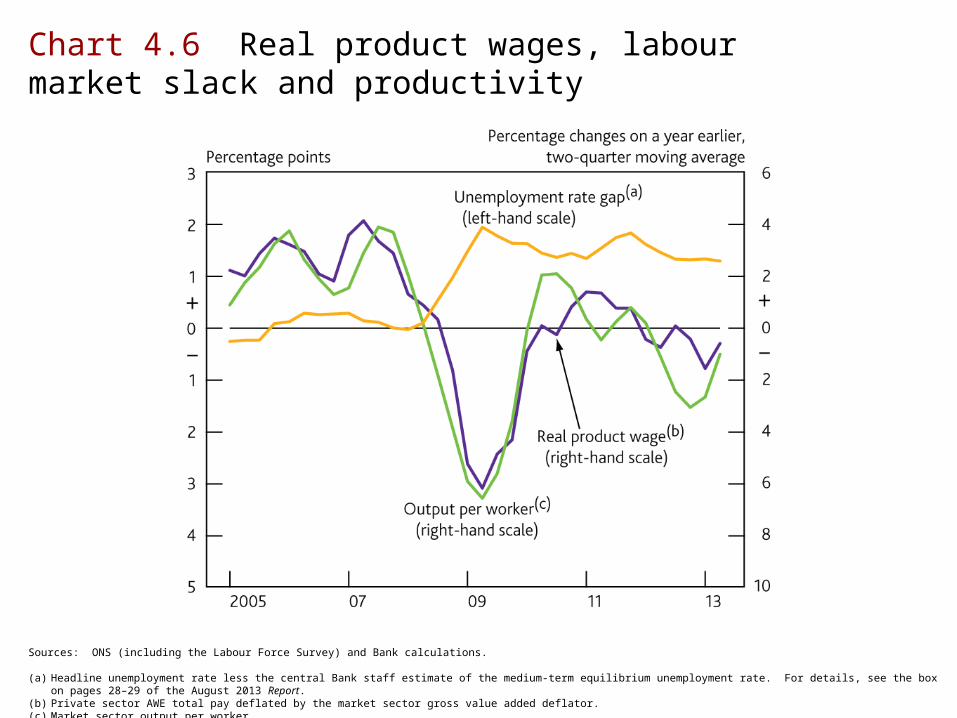
Chart 4.6 Real product wages, labour market slack and productivity
Sources: ONS (including the Labour Force Survey) and Bank calculations.
(a) Headline unemployment rate less the central Bank staff estimate of the medium-term equilibrium unemployment rate. For details, see the box on pages 28–29 of the August 2013 Report.(b) Private sector AWE total pay deflated by the market sector gross value added deflator.(c) Market sector output per worker.

Chart 4.7 Companies’ expected changes in prices and wages(a)
Sources: CBI (all rights reserved) and ONS.
(a) CBI data for the manufacturing, business/consumer services and distribution sectors, weighted together using nominal shares in value added. Companies are asked for their expected percentage changes over the next twelve months for: their firm’s wage/salary cost per person employed (including overtime and bonuses); their own average output price for goods sold into UK markets; and the general level of prices in the markets in which they compete.

Chart 4.8 Contributions to private sector unit labour costs(a)
Sources: ONS and Bank calculations.
(a) Contributions do not sum to total due to the method of calculation.(b) Calculated using private sector AWE data adjusted using the ratio of private sector employee compensation to wages and salaries.(c) Quarterly growth in market sector output per worker, inverted.(d) Estimated labour costs per worker as defined in footnote (b) divided by market sector output per worker.

Chart 4.9 Private sector corporate profit share
Sources: ONS and Bank calculations.
(a) A recession is defined as at least two consecutive quarters of falling output (at constant market prices) estimated using the latest data. The recession is assumed to end once output began to rise.
(b) Private sector corporates’ gross trading profits (excluding the alignment adjustment), divided by nominal gross value added at basic prices, excluding general government gross operating surplus and central government and local authority compensation of employees. Central government and local authority compensation have been seasonally adjusted by Bank staff.

Chart 4.10 Bank Agents’ company visit scores: changes in profitability of exporters and domestic-facing companies(a)
(a) The Bank’s Agents assign company visit scores on a regular basis. Scores of -5 and 5 represent ‘down a lot’ and ‘up a lot’, respectively, with zero representing ‘no change’. Changes in profitability are measured over the latest three-month period, relative to the same three months a year earlier. Chart includes responses up to 30 October 2013.

Tables
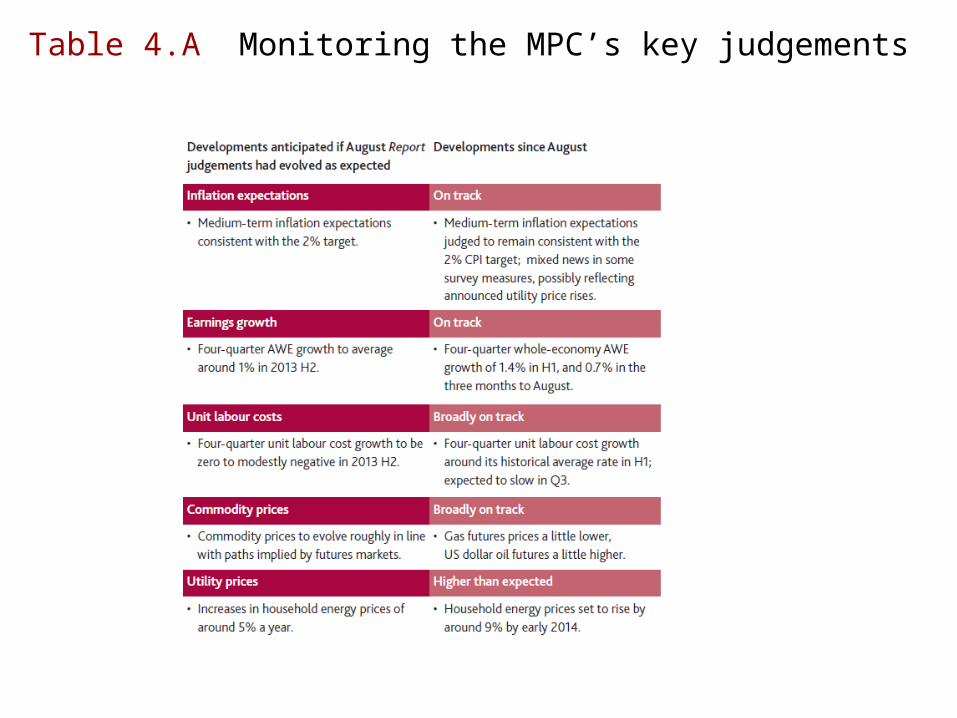
Table 4.A Monitoring the MPC’s key judgements

Table 4.B Private sector earnings(a)
Sources: Bank of England, Incomes Data Services, the Labour Research Department, ONS and XpertHR.
(a) Based on quarterly data unless otherwise stated.(b) Data in the two months to August.(c) Total pay excluding bonuses and arrears of pay.(d) Percentage points. The bonus contribution does not always equal the difference between total average weekly earnings (AWE) growth and AWE regular pay growth due to rounding.(e) Average over the past twelve months, based on monthly data.

Monitoring inflationexpectations

Chart A Household inflation expectations and utility price rises(a)
Sources: Company press releases, YouGov/Citigroup and Bank calculations.
(a) Data are non seasonally adjusted.(b) Date of announcements of an increase in utility prices by a utility company that were followed by further announcements by other companies. Only episodes resulting in a rise in
utility bills of more than 5% are included.

Chart B Change in responsiveness of instantaneous forward inflation rates to CPI news relative to pre-crisis(a)
Sources: Bloomberg, ONS and Bank calculations.
(a) The diamonds show the estimated slope coefficients for the change in responsiveness of instantaneous forward inflation rates (derived from inflation swaps) to news in the CPI release over the past twelve months relative to the pre-crisis period (September 2004–07). The bars cover two standard errors either side of the estimated slope coefficients.

Table 1 Indicators of inflation expectations(a)
Sources: Bank of England, Barclays Capital, Bloomberg, CBI (all rights reserved), Citigroup, GfK NOP, ONS, YouGov and Bank calculations.
Note: Footnote (f) was incorrectly labelled as ‘Instantaneous RPI inflation one year ahead implied from swaps’ in the printed version of the Report, and footnote (h) was incorrectly labelled as ‘Instantaneous RPI inflation three years ahead implied from swaps’.
(a) Data are non seasonally adjusted.(b) Dates in parentheses indicate start date of the data series.(c) Financial markets data are averages from 1 October–6 November. YouGov/Citigroup data are for October.(d) The household surveys ask about expected changes in prices but do not reference a specific price index, and the measures are based on the median estimated price change.(e) CBI data for the manufacturing, business/consumer services and distribution sectors, weighted together using nominal shares in value added. Companies are asked about the
expected percentage price change over the coming twelve months in the markets in which they compete.(f) RPI inflation over the next year implied from swaps.(g) Bank’s survey of external forecasters, inflation rate three years ahead.(h) RPI inflation over the next three years implied from swaps. (i) Five-year, five-year forward RPI inflation implied from swaps.


