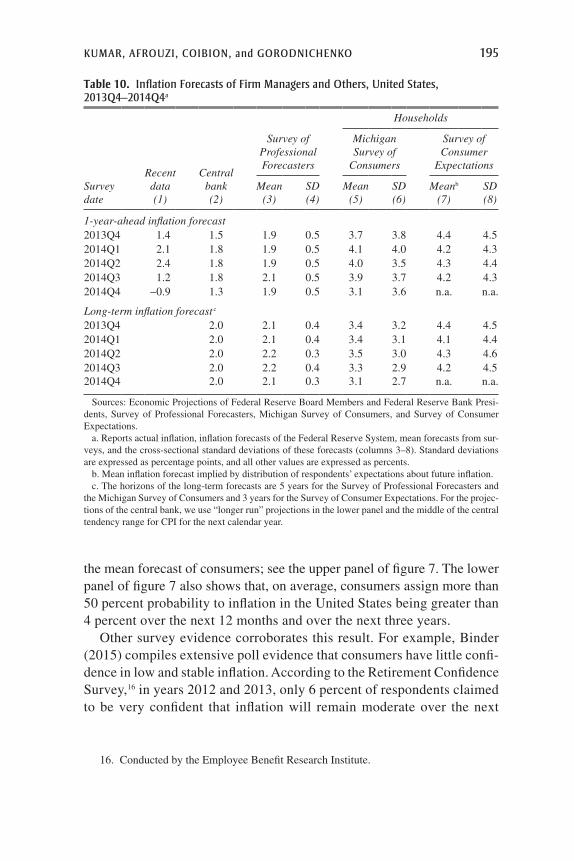
151 SATEN KUMAR OLIVIER COIBION Auckland University of Technology University of Texas, Austin HASSAN AFROUZI YURIY GORODNICHENKO University of Texas, Austin University of California, Berkeley Inflation Targeting Does Not Anchor Inflation Expectations: Evidence from Firms in New Zealand ABSTRACT Using a new survey of firm managers, we investigate whether inflation expectations in New Zealand are anchored or not. In spite of 25 years of inflation targeting by the Reserve Bank of New Zealand, firm managers display little anchoring of such expectations. We document this finding along a number of dimensions. Managers are unaware of the identities of central bankers or of central banks’ objectives, and they are generally poorly informed about recent inflation dynamics. Their forecasts of future inflation reflect high levels of uncertainty and are extremely dispersed, and they are volatile along both short-run and long-run horizons. Similar results can be found for the United States using currently available surveys. The effects of monetary policy on the economy today depend importantly not only on current policy actions, but also on the public’s expectations of how policy will evolve. . . . Indeed, expectations matter so much that a central bank may be able to help make policy more effective by working to shape those expectations. —Ben Bernanke (2013) C entral bankers increasingly emphasize the importance of the public’s expectations. One reason is that unanchored inflation expectations are commonly viewed (Solow 1979) as having played an important role in the Great Inflation of the 1970s and the subsequent large costs of bring- ing down inflation over the course of the 1980s. Maintaining low and stable “well-anchored” inflation expectations has become a mantra of modern central banking. But with the onset of the zero bound on interest rates, expectations have also taken a new role as a potential instrument of
Transcript
151
SATEN KUMAR OLIVIER COIBIONAuckland University of Technology University of Texas, Austin
HASSAN AFROUZI YURIY GORODNICHENKOUniversity of Texas, Austin University of California, Berkeley
Inflation Targeting Does Not Anchor Inflation Expectations:
Evidence from Firms in New Zealand
ABSTRACT Using a new survey of firm managers, we investigate whether inflation expectations in New Zealand are anchored or not. In spite of 25 years of inflation targeting by the Reserve Bank of New Zealand, firm managers display little anchoring of such expectations. We document this finding along a number of dimensions. Managers are unaware of the identities of central bankers or of central banks’ objectives, and they are generally poorly informed about recent inflation dynamics. Their forecasts of future inflation reflect high levels of uncertainty and are extremely dispersed, and they are volatile along both short-run and long-run horizons. Similar results can be found for the United States using currently available surveys.
The effects of monetary policy on the economy today depend importantly not only on current policy actions, but also on the public’s expectations of how policy will evolve. . . . Indeed, expectations matter so much that a central bank may be able to help make policy more effective by working to shape those expectations.
—Ben Bernanke (2013)
Central bankers increasingly emphasize the importance of the public’s expectations. One reason is that unanchored inflation expectations
are commonly viewed (Solow 1979) as having played an important role in the Great Inflation of the 1970s and the subsequent large costs of bring-ing down inflation over the course of the 1980s. Maintaining low and stable “well-anchored” inflation expectations has become a mantra of modern central banking. But with the onset of the zero bound on interest rates, expectations have also taken a new role as a potential instrument of
152 Brookings Papers on Economic Activity, Fall 2015
monetary policy. By trying to raise inflation expectations when they are very low, central bankers can immediately lower real interest rates and thereby stimulate economic activity even when nominal rates are constrained, a strategy actively pursued by the Bank of Japan, for example.
In this paper, we investigate both the question of whether inflation expec-tations are indeed well “anchored” and whether monetary policies designed to influence inflation expectations are likely to be successful. To do so, we rely primarily on a recent survey of managers of firms in New Zealand, the country that pioneered inflation targeting in 1989. In this survey, we asked managers a wide range of questions about their inflation expectations and their individual and firm’s characteristics as well as their knowledge and understanding of monetary policy. Following Carola Binder (2015), we argue that many of our results extend to the United States using existing survey data. The New Zealand survey fills an important gap in our under-standing of expectations. Previously, the only quantitative macroeconomic surveys available were those covering professional forecasters, very large firms, or households. The first two categories of respondents are, obviously, extremely well informed, but the latter tend to be poorly informed. Our survey focuses on decisionmakers within a wide range of firms and there-fore provides a much-needed middle ground for assessing the economic knowledge and understanding of individuals who make pricing, hiring, and investment decisions in the economy.
Our results are not favorable to policymakers. Despite 25 years of infla-tion targeting in New Zealand, managers of firms there have been fore-casting much higher levels of inflation than has actually occurred, at both short-run horizons and very long-run horizons. Their average perception of recent inflation is also systematically much higher than actual inflation. There is tremendous disagreement in forecasts among managers, at all horizons, as well as disagreement about recent inflation dynamics. Man-agers also express far more uncertainty in their inflation forecasts than do professional forecasters.
Other characteristics of firms’ forecasts are also at odds with even weaker definitions of “anchored” expectations. Because managers were surveyed on multiple occasions, one can consider the revisions in their forecasts. One would expect individuals whose forecasts are anchored to display only small revisions in the forecasts they make over time. Instead, we find that managers commonly report large revisions in their forecasts. Similarly, we find that managers who expect high inflation in the short run also tend to expect higher inflation in the long run, whereas the anchor-ing of expectations around a well-known target should imply little (or at
KUMAR, AFROUZI, COIBION, and GORODNICHENKO 153
least much less) co-movement between short-run inflation expectations and longer-run inflation expectations. We show formally that each of these results corresponds to different definitions of anchored expectations, but our data from managers’ inflation expectations systematically reject all definitions of anchoring that we consider.
How could 25 years of inflation targeting have so little effect on man-agers’ inflation expectations? We find little evidence that managers ques-tion the credibility of the Reserve Bank of New Zealand (RBNZ): the vast majority of respondents believe that the central bank can control inflation at both long-run and short-run horizons. However, many respondents display surprisingly little knowledge about the institution itself. When asked who the governor of the RBNZ is, only 30 percent chose the correct answer (out of four possible answers). Very few respondents knew that the RBNZ has inflation targeting in its mandate, and even fewer could name the specific inflation target of the RBNZ. All of this suggests that knowledge about the RBNZ and its objectives remains very limited in New Zealand, even among firm managers.
Those managers who know more about the objectives of the RBNZ have much better information about recent inflation dynamics, make forecasts that are much closer to those of professional forecasters, and have less uncertainty in their inflation forecasts than others. They follow the news more closely than do other managers and report that the news is more important to their business decisions. Significantly, these managers also report that they would be willing to pay much more for inflation forecasts (both in nominal terms and as a share of their firm’s sales) than would man-agers who display less knowledge about monetary policy. This suggests that managers differ in their perceptions of the value of acquiring informa-tion about inflation and that these differences are reflected ex post in their knowledge of both the central bank’s actions and actual inflation dynamics.
What might explain these differences? Not surprisingly, managers who are more educated have systematically better knowledge of monetary policy. More interestingly, we find that some firm characteristics help pre-dict a manager’s knowledge of monetary policy in ways that are intui-tive once interpreted in a rational inattention perspective (Sims 2003). For example, when firms face more competitors, managers have more incen-tive to collect information about economic conditions and tend to make smaller errors about monetary policy. When firms sell a larger share of their products outside of New Zealand, managers have less incentive to track conditions in New Zealand and make larger errors about monetary policy in New Zealand. Olivier Coibion, Yuriy Gorodnichenko, and Saten
154 Brookings Papers on Economic Activity, Fall 2015
Kumar (2015) similarly find that rational inattention motives can account for a nontrivial share of the size of errors that firm managers make about recent inflation dynamics.
While these observable firm characteristics clearly play an important role in accounting for differences in managers’ knowledge about monetary pol-icy and inflation, much of the heterogeneity in beliefs remains unexplained. To get at these deeper underlying differences, we conducted a smaller wave of the survey to extract narrative responses from managers about how they form and use their inflation expectations. These responses showed that differences in managers’ inflation forecasts and perceptions do not reflect confusion about what inflation means. When asked to define inflation in open-ended questions, almost 90 percent do so correctly. Nor are manag-ers prey to conspiracy theories about statistical agencies misrepresenting inflation numbers: The vast majority report that they believe that statistical agencies correctly measure inflation. They also agree to a surprising extent about inflation rates at the level of individual categories of goods. In fact, they agree more with each other about recent price changes for most categories of goods than they do about recent aggregate price changes. We document that the wide disagreement about the latter is instead driven primarily by disagreement among managers about the relative importance of different categories in constructing price indexes (such as weights on house prices versus food prices versus gasoline prices).
We also asked managers about how they form their inflation expec-tations and what sources of information they use. In open-ended ques-tions, most managers responded (in almost equal proportion) either that they relied on the media or that they relied on their personal shopping experience to inform them about prices. Those for whom the media was the primary source made smaller errors, on average, when asked about recent inflation dynamics. We also asked managers to quantitatively rank a wider set of information sources about inflation. This revealed that while only 20 percent of managers relied on professional forecasts, they had by far the best information about inflation.
Perhaps most strikingly, almost 90 percent of managers rated their personal shopping experience as very or extremely important to them in informing them about inflation, and 76 percent rated gasoline prices the same way. Hence, the vast majority of managers, even those who also follow newspapers and professional forecasts, report that their personal exposure to the individual prices they face (and gasoline prices in par-ticular) plays a large role in accounting for their inflation expectations. The majority of managers also report that the primary use of their infla-tion expectations is for their personal shopping decisions rather than in
KUMAR, AFROUZI, COIBION, and GORODNICHENKO 155
business decisions. The fact that most managers cite their personal shop-ping experience as both the primary source and the primary use of their inflation knowledge provides one rationale for why managers’ expectations resemble those of households and why they disagree so much about the relevant weights to apply to different categories of goods in aggregating across them.
This is not to say that inflation expectations are irrelevant to managers’ business decisions. When asked if higher inflation expectations on their part would specifically affect any of their business decisions (such as pricing and wages), most managers report that they would change some element of their business. Coibion, Gorodnichenko, and Kumar (2015) found in an experiment that when managers were presented with informa-tion about the central bank’s inflation target, they tended to significantly revise their inflation forecasts toward the target, especially if they were initially very uncertain about their forecast. Jointly, these results suggest that if central banks could more successfully communicate their objec-tives to the firm managers, it would have repercussions on managers’ economic decisions. The challenge for monetary policymakers, however, is that most managers currently appear to devote very little effort to track-ing macroeconomic information, much less information from the central bank. Very few ever read monetary policy reports, receive Twitter feeds from the RBNZ, or receive other forms of direct communication used by the RBNZ. This absence of even basic knowledge about the central bank of New Zealand on the part of business leaders suggests that monetary policies designed to operate through changes in the public’s expectations, as induced primarily through communications policies, are unlikely to be very successful under current conditions.
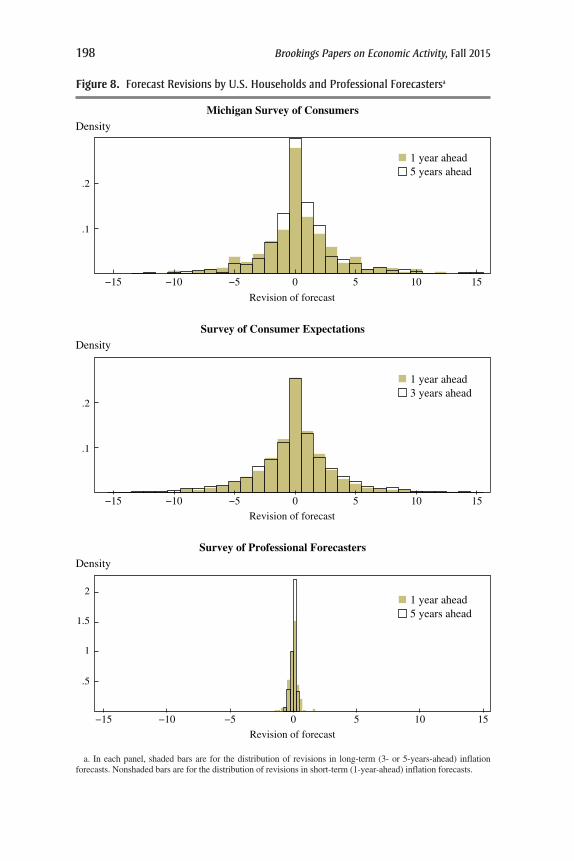
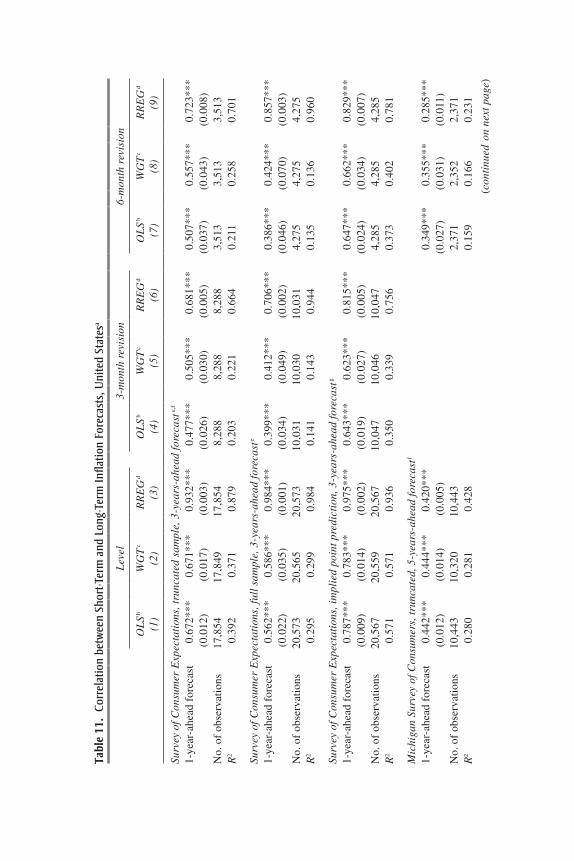
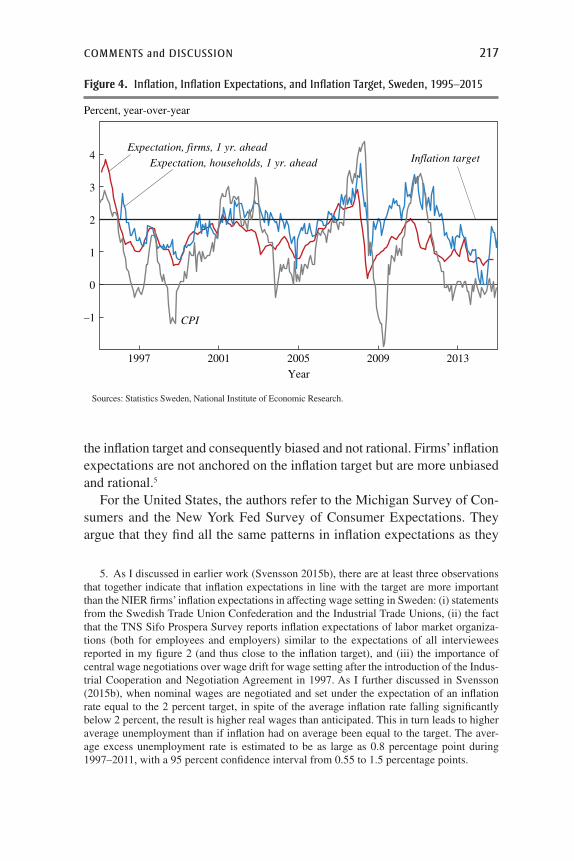
New Zealand, because of its exceptionally long history of inflation target-ing and stable inflation, is a particularly apt place to stage a survey to gauge the extent to which anchoring of expectations can be achieved. Our find-ing that the inflation expectations of business leaders are no more anchored than those of households in New Zealand is therefore particularly striking, as is the finding that few business leaders are even slightly knowledgeable about monetary policy. But as documented in Binder (2015) and further extended here, many of our results carry over to the United States, at least for the broader population. Using the University of Michigan’s Survey of Consumers and the Federal Reserve Bank of New York’s Survey of Con-sumer Expectations, we find all the same patterns in inflation expectations as we previously documented for managers of firms (as well as households) in New Zealand. Expectations in the United States, therefore, appear to be just as unanchored as they appear to be in New Zealand.
156 Brookings Papers on Economic Activity, Fall 2015
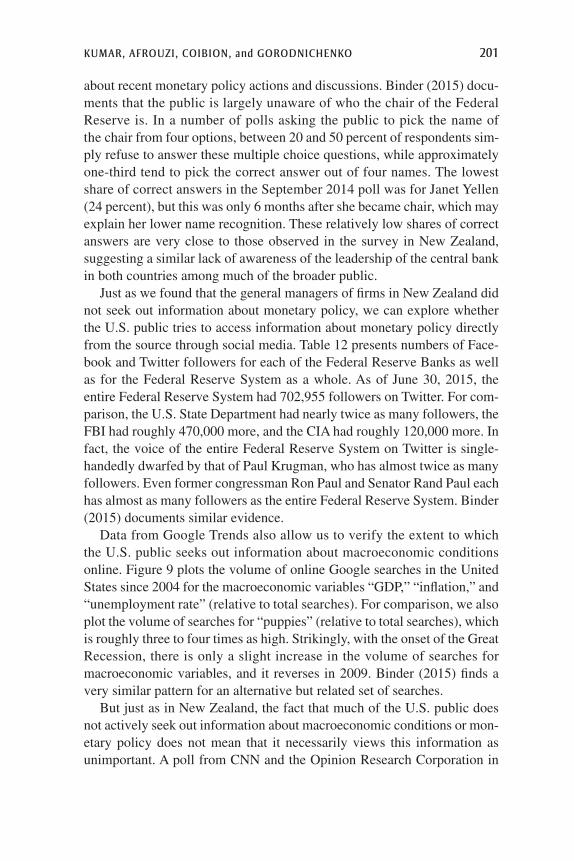
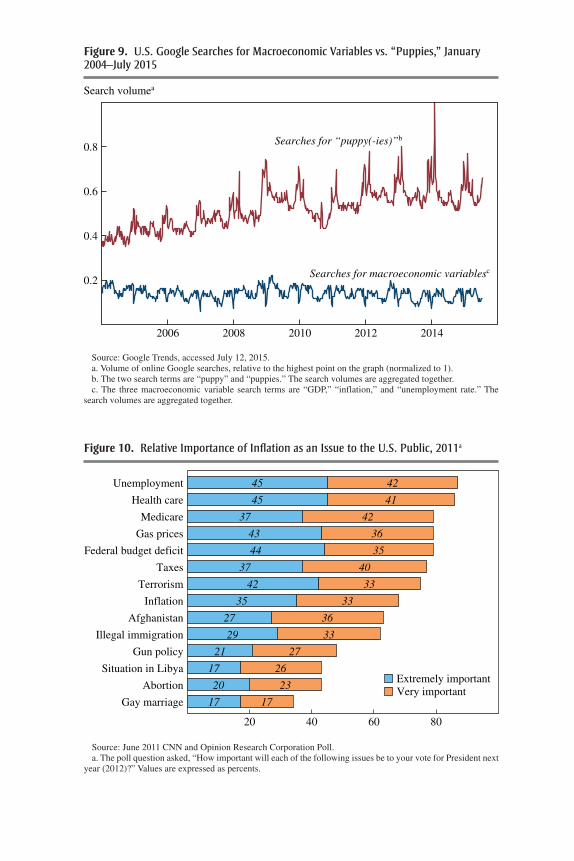
In addition, polling data similarly confirm that the public in the United States shows no more knowledge of monetary policy than the public in New Zealand. Americans have great difficulty in identifying the chair of the Federal Reserve Board of Governors and are generally unable to iden-tify recent inflation dynamics with any degree of precision. When asked about inflation over 10 years, few are willing to confidently predict low levels of inflation, a finding that speaks either to the low credibility of the Federal Reserve or, more likely, to the fact that most people do not know what reasonable ranges of inflation rates are. Nor do they seem to show much interest in learning about monetary policy. Twitter and Facebook fol-lowers of the entire Federal Reserve System are outnumbered by followers of the FBI and the CIA, and they barely outnumber the followers of for-mer congressman Ron Paul or Senator Rand Paul. Paul Krugman single-handedly has almost twice as many Twitter followers as the entire Federal Reserve System. Google searches confirm this paucity of interest: Online searches for macroeconomic variables like GDP, unemployment rate, and inflation are consistently topped altogether by online searches for puppies.
This paper builds on a growing literature on central bank policies and communication and their effects on expectations, yielding mixed evidence on the degree to which inflation targeting anchors expectations (for exam-ple, see the recent survey by Alan Blinder and others [2008]). However, this literature has focused almost exclusively on the expectations of finan-cial markets or professional forecasters, primarily due to data limitations. One particularly remarkable exception is Binder (2015), who uses exist-ing survey and polling data to assess what the U.S. public knows about monetary policy and on whose work we build explicitly. One implication of our results, along with Binder’s, is that future theoretical work should focus on models in which different types of agents, such as financial market participants, consumers, and managers, form their expectations differently from one another. Only with this type of model will we be able to fully understand how large the potential benefits might be from anchoring the expectations of consumers and managers.
Also particularly relevant to our work is the seminal firm-level survey of Blinder and others (1998). We closely follow the approach they pioneered, in the sense that we aim to build a nationally representative quantitative survey of firm managers. But while their survey focused primarily on the price-setting decisions and cost structure within U.S. firms, we focus on the expectations of firm managers in New Zealand, as well as on their acquisi-tion of information and their knowledge about monetary policy. This paper also builds on the work of Coibion, Gorodnichenko, and Kumar (2015),
KUMAR, AFROUZI, COIBION, and GORODNICHENKO 157
which first utilized the New Zealand survey of firms. We differ from the latter primarily in that we focus on previously unexplored survey questions bearing on managers’ knowledge of monetary policy. We also make use of a new wave of the survey that extracts, among other new questions, nar-rative answers from managers about the formation of their expectations.
Finally, our work relates closely to the literature on the nature of the formation of expectations among different economic agents. This literature explores the need for moving beyond the assumption of full- information rational expectations. Robert Lucas (1972), Greg Mankiw and Ricardo Reis (2002), Michael Woodford (2003), Christopher Sims (2003), Gorodnichenko (2008), Bartosz Mackowiack and Mirko Wiederholt (2009), and Fernando Alvarez, Francesco Lippi, and Luigi Paciello (2011) all pro-vide models that explore the implications of different ways of incorporating deviations from full-information rational expectations. Empirically, such deviations have already found repeated support. Mankiw, Reis, and Justin Wolfers (2004), for example, emphasize the time variation in disagreement across agents, while Coibion and Gorodnichenko (2012, 2015a) emphasize the predictability in different agents’ forecast errors. Philippe Andrade and Hervé Le Bihan (2013) provide evidence that European forecasters update their forecasts infrequently and in a manner consistent with imperfect-information models. Christopher Carroll (2003) argues that information diffuses only gradually from professional forecasters to households. The direct evidence in this paper on how little firm managers know about the weights applied to different categories of goods in measuring aggregate price levels or about the inflation target of the RBNZ confirms that, at least for these agents, full information is also likely a poor approximation.
This paper is organized as follows. In section I we describe the survey. In section II we present evidence on the degree to which managers’ expec-tations in New Zealand are anchored. In section III we study how much firm managers in New Zealand know about monetary policy. In section IV we focus on the sources of the differences in managers’ inflation percep-tions and forecasts, and in section V we extend those results to the United States. Section VI concludes.
I. Description of the Survey
We implemented a quantitative survey of firm managers’ expectations about macroeconomic conditions in New Zealand, a comprehensive description of which may be found in Coibion, Gorodnichenko, and Kumar (2015). In this paper we discuss only the key features of the survey.
158 Brookings Papers on Economic Activity, Fall 2015
We executed the survey in five waves between September 2013 and August 2015. The first and largest wave was conducted between Septem-ber 2013 and January 2014. After contacting around 15,000 firms, we attained a response rate of around 20 percent, and then recruited a sample of 3,153 firms to participate. Subsequent waves were accomplished by recontacting firms from the first wave. The second wave, implemented between February and April 2014, received 714 responses. The third and fourth waves, conducted in August–September 2014 and December 2014–January 2015, received 1,607 and 1,257 responses, respectively. In August 2015, we implemented a much smaller fifth wave (50 firms), aiming to collect responses to open-ended questions.
The main survey (first wave) focused on collecting a wide range of information on the characteristics of the firms, their price-setting deci-sions, and their expectations about recent and future inflation. Follow-up waves included some repeat questions from the main survey as well as new questions. The second wave, for example, not only asked firms about their beliefs of inflation but also about other macroeconomic indicators such as real GDP growth, unemployment, and interest rates. The third wave focused on collecting individual characteristics of the respondents, and the fourth wave explored how managers acquire and process new informa-tion. The smaller, fifth wave explored views on central bank credibility and knowledge about inflation and asked respondents to give narrative answers. With the exception of a handful of cases, the survey collected responses across waves from the same person within a given firm.
Firms were randomly chosen from four broad industries: manufactur-ing, retail and wholesale trade, construction and transportation, and pro-fessional and business services.1 Phone interviews were done with the
1. The firm names and their basic details were purchased from the Kompass New Zea-land and Knowledge Management Services databases. Prior to acquiring these, we used Statistics New Zealand data for 2012 to compute the proportion of firms that fall into each employment size group (6 to 19 workers, 20 to 49 workers, and more than 50 workers) for each sector so that we could match our population with the population of firms in the econ-omy. For example, in the manufacturing industry in 2012, around 67 percent of firms had 6 to 19 workers, 21 percent had 20 to 49 workers, and 12 percent had more than 50 workers. Our survey population in the manufacturing industry contained similar proportions. For other industries, their respective employment size proportions were computed and our population was constructed accordingly.
KUMAR, AFROUZI, COIBION, and GORODNICHENKO 159
general managers2 approximately 10 days after the questionnaires had been emailed to them. Since manufacturing and professional and business ser-vices account for relatively large shares of GDP (according to 2012 Statis-tics New Zealand data), we aimed to have two-thirds of our sample from these two industries. The remaining third is a combination of firms from other industries. We excluded from the sample industries related to the gov-ernment, community service, agriculture, fishing, mining, energy, gas, and water, since objectives and constraints of firms in these industries may dif-fer from those of other firms due to differences in governance, regulation, and so on. The combined employment of firms in our sample represents about 5 percent of total employment in New Zealand. While our sample is not drawn to be perfectly representative of the New Zealand economy, we can use sampling weights to adjust for the size distribution of firms and the industrial composition.3 For the smaller, fifth wave, we first grouped firms into four bins based on their inflation forecasts (0 to 3 percent, 4 to 6 percent, 7 to 10 percent, and more than 10 percent) in the previous waves. We then randomly selected firms from each group. Each group includes a similar number of firms and they are broadly representative of industry and size composition of firms in the overall sample.
The survey is unique both in its breadth of coverage and in the quan-titative nature of the questions asked. While many surveys of firms exist, most tend to ask only qualitative questions. The few that ask quantitative questions tend to survey only a small and very unrepresentative group. For example, the RBNZ conducts a quarterly survey (namely, its Survey of Expectations) of a sample of economists and business and industry leaders. That survey started in the late 1980s, and its objective was to
2. Our objective was to contact top-level leaders at each firm. Of all respondents in our surveys, 97 percent are classified as managers, a category that includes managers, managing directors, directors, chief executive officers, and principal legal executives. The other respon-dents (3 percent) are marketing officers, industrial relations executives, product development officers, and so on.
3. See Coibion, Gorodnichenko and Kumar (2015) for more details, such as response rates, for each wave of the survey. Using sample weights makes little difference for our results. See table 1 and online appendix table A1. The distribution of firms by size across industries in the sample and in the population is given in online appendix tables A2 and A3. Online appendixes for papers in this volume may be found at the Brookings Papers web page, www.brookings.edu/bpea, under “Past Editions.”
160 Brookings Papers on Economic Activity, Fall 2015
establish a database that might be useful for policy and research. Lars Svensson (2015) notes that inflation expectations reported in the RBNZ survey have been only slightly above actual levels of inflation for much of the inflation targeting period. However, the survey suffers from several issues. First, its sample size is very small and targets respondents mainly from the financial and business services industry.4 Second, it is not purely at the firm level, since it also includes professional economists, market analysts, and public commentators, albeit those individuals make up a low proportion of the total. Third, the firms involved are typically very large ones, which is not at all representative of the New Zealand econ-omy. For example, while firms with more than 100 employees represent less than 1 percent of all firms in New Zealand, they account for nearly all participants in the Survey of Expectations. Lastly, the sample is not random but, instead, is largely convenience-based.
II. Are Managers’ Inflation Expectations Anchored in New Zealand?
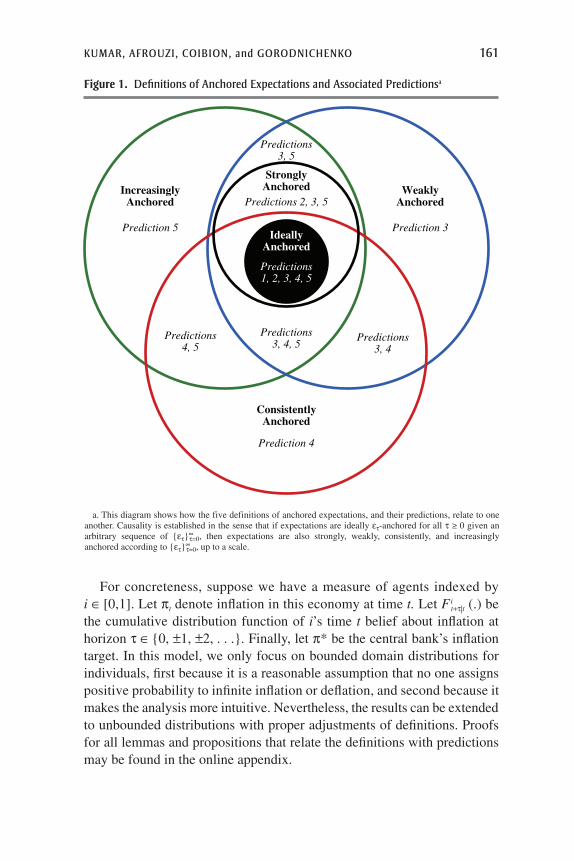
Because there is no widely agreed-upon definition of “anchored” expec-tations, we consider five characteristics of inflation expectations that one expects to observe depending on the specific definition or extent of anchor-ing of expectations. As we show below, these predictions allow us to test five distinct definitions of anchored expectations, some of which are stron-ger than others. The first characteristic is average beliefs being close to the inflation target of the central bank. The second is beliefs not being too dis-persed across agents. The third characteristic is that agents should be fairly confident in their forecasts and display little uncertainty, especially over the long run. Fourth, revisions in forecasts should tend to be small, especially at longer horizons. Fifth and finally, there should be little co-movement between long-run inflation expectations (which should be pinned down by the inflation target) and short-run inflation expectations (which should move with transitory shocks). In this section we assess each of these five predictions in turn and relate them to specific definitions of anchored infla-tion expectations. Figure 1 illustrates how the definitions are related to each of the five predicted characteristics in Venn diagram form.
4. The breakdown of the sample in the last quarter (2015Q2) is as follows: 91 respon-dents from financial and business services; 11 respondents from agriculture; 4 respondents from labor; and 8 respondents from other industries.
KUMAR, AFROUZI, COIBION, and GORODNICHENKO 161
For concreteness, suppose we have a measure of agents indexed by i ∈ [0,1]. Let pt denote inflation in this economy at time t. Let Fi
t+t|t (.) be the cumulative distribution function of i’s time t belief about inflation at horizon t ∈ {0, ±1, ±2, . . .}. Finally, let p* be the central bank’s inflation target. In this model, we only focus on bounded domain distributions for individuals, first because it is a reasonable assumption that no one assigns positive probability to infinite inflation or deflation, and second because it makes the analysis more intuitive. Nevertheless, the results can be extended to unbounded distributions with proper adjustments of definitions. Proofs for all lemmas and propositions that relate the definitions with predictions may be found in the online appendix.
a. This diagram shows how the five definitions of anchored expectations, and their predictions, relate to one another. Causality is established in the sense that if expectations are ideally ετ-anchored for all τ ≥ 0 given an arbitrary sequence of {ετ}
∞τ=0, then expectations are also strongly, weakly, consistently, and increasingly
anchored according to {ετ}∞τ=0, up to a scale.
IncreasinglyAnchored
StronglyAnchored
Predictions3, 5
Predictions 2, 3, 5
Predictions3, 4
Predictions3, 4, 5
Predictions1, 2, 3, 4, 5
Predictions4, 5
Prediction 5
Prediction 4
Prediction 3
WeaklyAnchored
IdeallyAnchored
ConsistentlyAnchored
Figure 1. Definitions of Anchored Expectations and Associated Predictionsa
162 Brookings Papers on Economic Activity, Fall 2015
II.A. Ideally Anchored Expectations
Definition 1. We say inflation expectations at time t for any horizon t ≥ 0 are ideally ε-anchored if the support of every agent’s belief of infla-tion at that time and horizon lies within ε of the central bank’s target, meaning that
F F it ti
t ti [ ]( ) ( )p + ε - p - ε = ∀ ∈+t +t 1, 0,1 .* *
Prediction 1: Average beliefs should be close to the inflation target. If inflation expectations at time t for any horizon t ≥ 0 are ideally ε-anchored, then the average belief about inflation should lie within ε of the central bank’s target, so that
biast t t t≡ p - p < ε+t +t ,*
where dit t t ti∫p = p+t +t0
1
is the average belief across agents and E xdF xt ti
ti
t t ti∫{ } ( )p ≡ p =+t +t +t�
E xdF xt ti
ti
t t ti∫{ } ( )p ≡ p =+t +t +t�
is agent i’s time t expectations of inflation at horizon t.
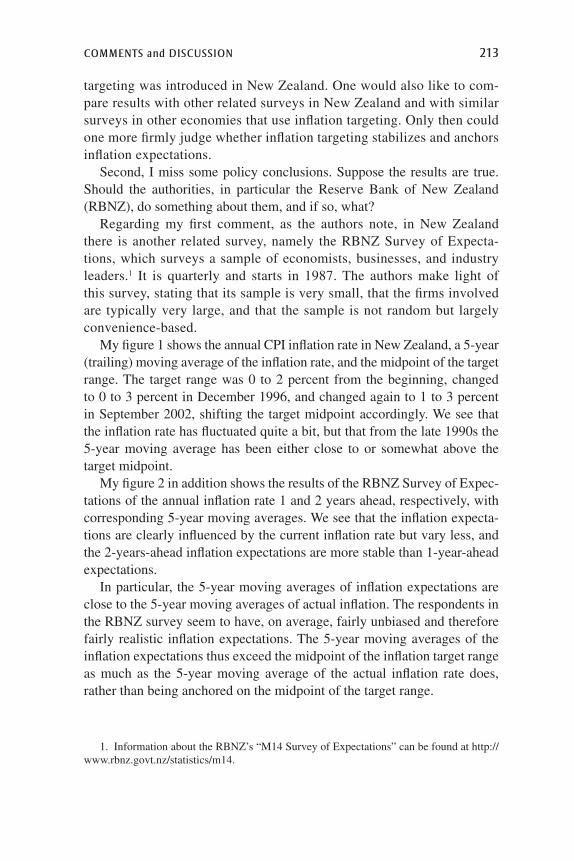
Probably the most common interpretation of anchored expectations is that the average inflation forecast across agents, especially at longer hori-zons, remains stable and close to the central bank’s inflation target (Ball and Mazumder 2014). Table 1 reports the average forecasts at the 12-month and the 5-to-10-year horizons for New Zealand firms in each survey for which these forecasts are available, as well as average managers’ beliefs about inflation over the preceding 12 months. For comparison, we also report forecasts from the RBNZ, professional forecasts from Consensus Economics, and household forecasts from the Survey of Households pro-duced by the RBNZ.
For each forecast horizon, firm managers’ forecasts significantly exceed the inflation target as well as the forecasts of all other agents. They even exceed the forecasts of households, at least at 12-month horizons although not at long horizons.5 Nor does the average manager forecast
5. The RBNZ first asks households if they understand what inflation means. Only those households who do (approximately half) are then asked to provide inflation forecasts. In the firm survey, all firm managers are asked to provide inflation forecasts. However, as docu-mented in section IV, most managers can correctly explain the meaning of inflation.
Tabl
e 1.
Infl
atio
n Fo
reca
sts
of F
irm
Man
ager
s an
d O
ther
s fo
r N
ew Z
eala
nd, 2
013Q
4–20
14Q
4a
Surv
ey
date
Rec
ent
data
c
(1)
Fore
cast
sb
Now
cast
s/B
ackc
asts
d
Cen
tral
ba
nk(2
)
Pro
fess
iona
l fo
reca
ster
sH
ouse
hold
sF
irm
sH
ouse
hold
sF
irm
s
Mea
n(3
)SD (4
)M
ean
(5)
SD (6)
Mea
n(7
)SD (8
)M
ean
(9)
SD (10)
Mea
n(1
1)SD (1
2)
1-ye
ar in
flati
on20
13Q
41.
51.
32.
00.
23.
42.
05.
33.
12.
91.
84.
83.
520
14Q
11.
51.
92.
00.
33.
61.
85.
92.
82.
91.
65.
33.
320
14Q
31.
61.
61.
90.
23.
52.
24.
32.
52.
91.
9n.
a.n.
a.20
14Q
41.
01.
11.
70.
33.
11.
94.
72.
82.
81.
84.
32.
5
5-to
-10-
year
infla
tion
2014
Q3
2.1
2.1
2.1
n.a.
4.1
2.8
3.4
2.4
——
——
Sour
ce: C
onse
nsus
Eco
nom
ics,
and
the
RB
NZ
’s S
urve
y of
Hou
seho
lds
and
Mon
etar
y Po
licy
Rep
orts
.a.
Con
sist
ent
with
how
the
RB
NZ
cal
cula
tes
mom
ents
of
hous
ehol
d ex
pect
atio
ns, w
e ex
clud
e re
spon
ses
of fi
rms’
man
ager
s th
at a
re g
reat
er t
han
15 p
erce
nt o
r le
ss t
han
-2 p
erce
nt. R
esul
ts f
or n
ontr
unca
ted
data
are
rep
orte
d in
the
onlin
e ap
pend
ix ta
ble
A1.
Mom
ents
for
firm
s ar
e ca
lcul
ated
with
out w
eigh
ts. R
esul
ts w
ith s
ampl
e w
eigh
ts a
re
also
rep
orte
d in
the
onlin
e ap
pend
ix ta
ble
A1.
Sta
ndar
d de
viat
ions
are
exp
ress
ed a
s pe
rcen
tage
poi
nts,
and
all
othe
r va
lues
are
exp
ress
ed a
s pe
rcen
ts.
b. R
epor
ts in
flatio
n fo
reca
sts
of th
e R
BN
Z (
colu
mn
2), m
ean
fore
cast
s fr
om s
urve
ys, a
nd th
e cr
oss-
sect
iona
l sta
ndar
d de
viat
ions
of
thes
e fo
reca
sts
(col
umns
3–8
).c.
Rep
orts
mos
t rec
ently
ava
ilabl
e in
flatio
n da
ta a
t the
tim
e of
the
surv
eys.
d. R
epor
ts n
owca
sts/
back
cast
s of
infla
tion
over
the
last
12
mon
ths.
164 Brookings Papers on Economic Activity, Fall 2015
appear particularly stable over time. Over the course of 2014, the average 1-year-ahead forecast of inflation fell by anywhere between 0.6 percent-age point and 2.2 percentage points, depending on how one truncates the sample.6 In contrast, professional forecasters, on average, reduced their forecasts by 0.3 percentage point over the same period, and households reduced them by 0.4 percentage point. While one must bear in mind the short time frame, this survey evidence suggests that the average forecast across firms is neither close to the inflation target nor stable over time.
It is possible that managers’ average inflation beliefs were temporarily driven higher in New Zealand at the time of the survey by transitory changes in economic conditions that disproportionately affected their expectations relative to those of central bankers and those of households. For example, a boom in commodity prices could have raised inflation expectations tem-porarily. A weaker definition of anchored expectations could allow for time variation in average beliefs, but restrict the cross-sectional distribution of those beliefs.
II.B. Strongly Anchored Expectations
Definition 2. We say inflation expectations at time t for any horizon t ≥ 0 are strongly ε-anchored if the support of every agent’s inflation expectations at that time and horizon lies within ε of the average belief, so that,
Prediction 2: Beliefs should not be too dispersed across agents. If inflation expectations at time t for horizon t are strongly ε-anchored, then the dispersion of agents’ beliefs about inflation should be less than ε, mean-ing that
sd dit t t ti
t t∫ ( )≡ p - p < ε+t +t +t .2
0
11
2
Lemma 1. If inflation expectations are ideally ε/2-anchored, then they are strongly ε-anchored.
6. The RBNZ’s survey of households drops all forecasts above 15 percent and below -2 percent. Our “truncated” sample applies the same restrictions, whereas our full sample includes all forecasts.
KUMAR, AFROUZI, COIBION, and GORODNICHENKO 165
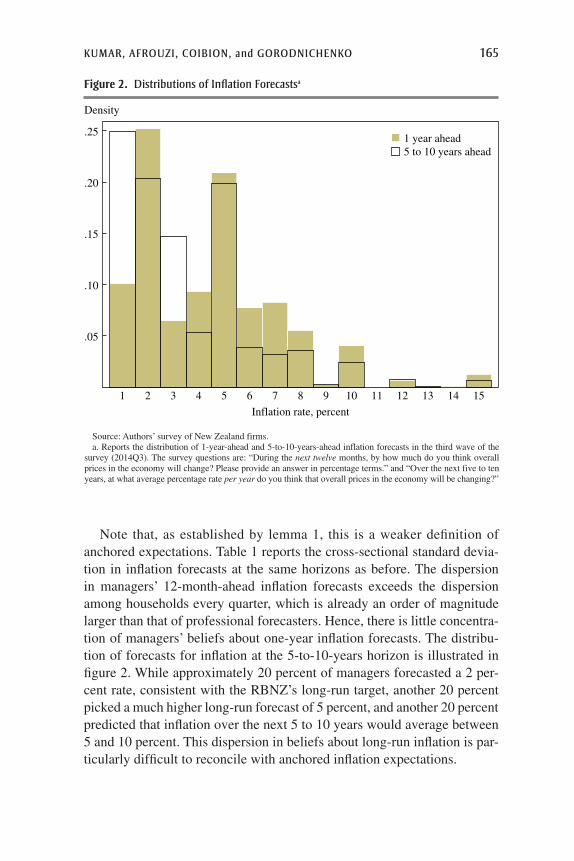
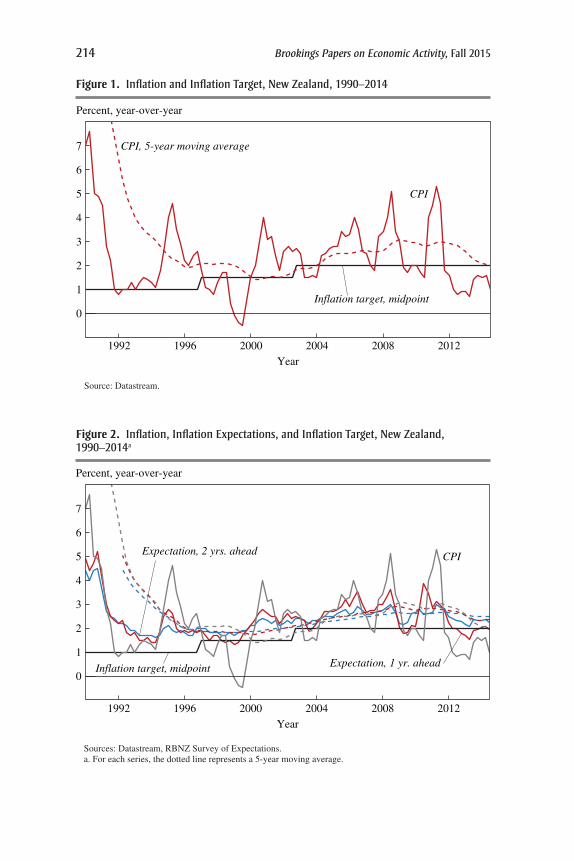
Note that, as established by lemma 1, this is a weaker definition of anchored expectations. Table 1 reports the cross-sectional standard devia-tion in inflation forecasts at the same horizons as before. The dispersion in managers’ 12-month-ahead inflation forecasts exceeds the dispersion among households every quarter, which is already an order of magnitude larger than that of professional forecasters. Hence, there is little concentra-tion of managers’ beliefs about one-year inflation forecasts. The distribu-tion of forecasts for inflation at the 5-to-10-years horizon is illustrated in figure 2. While approximately 20 percent of managers forecasted a 2 per-cent rate, consistent with the RBNZ’s long-run target, another 20 percent picked a much higher long-run forecast of 5 percent, and another 20 percent predicted that inflation over the next 5 to 10 years would average between 5 and 10 percent. This dispersion in beliefs about long-run inflation is par-ticularly difficult to reconcile with anchored inflation expectations.
Source: Authors’ survey of New Zealand firms.a. Reports the distribution of 1-year-ahead and 5-to-10-years-ahead inflation forecasts in the third wave of the
survey (2014Q3). The survey questions are: “During the next twelve months, by how much do you think overall prices in the economy will change? Please provide an answer in percentage terms.” and “Over the next five to ten years, at what average percentage rate per year do you think that overall prices in the economy will be changing?”
Density
1 2 3 4 5 6 7 8 9 10 11 12 13 14 15
Inflation rate, percent
1 year ahead5 to 10 years ahead
.25
.20
.15
.10
.05
Figure 2. Distributions of Inflation Forecastsa
166 Brookings Papers on Economic Activity, Fall 2015
We now consider three additional predicted characteristics and associ-ated definitions of anchored expectations, each of which is conceptually distinct and weaker than strongly ε-anchored expectations.
II.C. Weakly Anchored Expectations
Definition 3. We say inflation expectations at time t for any horizon t ≥ 0 are weakly ε-anchored if the support of every agent’s inflation expectations at that time and horizon lies within ε of that agent’s belief, meaning that,
Moreover, we say agent i is ε-confident of her forecast/backcast if her own perception of the degree to which her inflation expectation has varied is less than ε2, that is:
Eti
t t ti{ }( )p - p < ε+t +t .
22
Prediction 3: Agents should show confidence in their forecasts. If infla-tion expectations are weakly ε-anchored for a given time and horizon, then all agents are ε-confident of their forecasts.
Lemma 2. If inflation expectations are ideally or strongly ε/2-anchored, then they are also weakly ε-anchored.
Under weakly anchored expectations, we now make no restrictions about agents having similar beliefs about long-run inflation or the cen-tral bank’s target. Instead, the notion of targeting is now that each agent should be confident that inflation will be stabilized around whatever value each agent believes is the target. That is, one should perceive little risk of either high or low inflation in the future, so that the range of possible out-comes for inflation considered realistic by agents should be quite limited. Lemma 2 shows that this notion of anchoring is weaker than the previous two definitions.
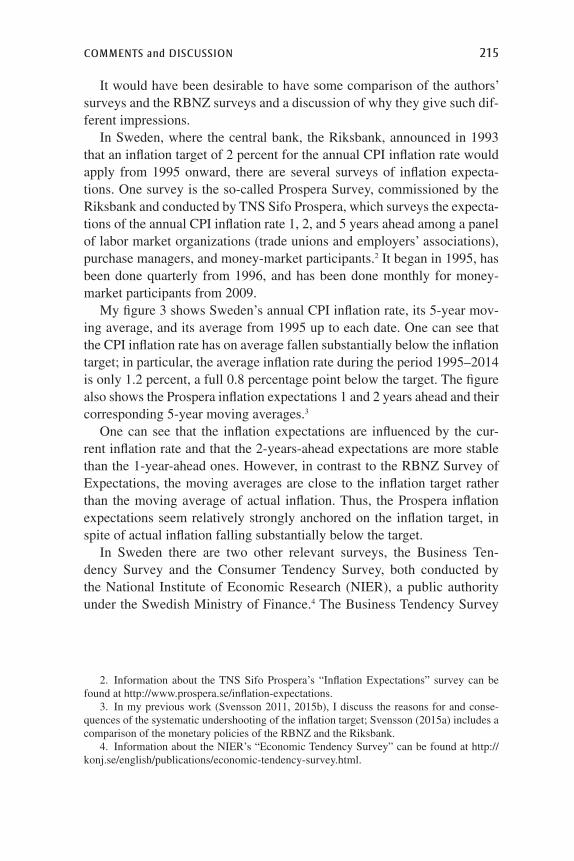
In the fourth wave of the survey, we asked managers to assign probabili-ties to a wide range of possible inflation outcomes, allowing us to charac-terize the degree of uncertainty in their forecasts. From these distributional answers, we computed the standard deviation of each manager’s forecast, and we report the distribution of these standard deviations in the upper panel of figure 3. The average standard deviation is 2 percentage points, so the firm managers on average report a lot of uncertainty around their
KUMAR, AFROUZI, COIBION, and GORODNICHENKO 167
Source: Authors’ survey of New Zealand firms. a. The survey question asks managers to assign probabilities to nine bins. For each respondent, we construct a
measure of uncertainty as the standard deviation of the reported distribution.
Density
Average probability
Average probability assigned to inflation bins across firms
Distribution of uncertainty across managers
.2
.4
.6
0 1 2 3 4 5 6 7 8
Forecast uncertainty, percentage points
.05
.10
.15
.20
<0 0−2 2−4 4−6 6−8 8−10 10−15 15−25 >25
Inflation bin, percent
Figure 3. Uncertainty in Managers’ Inflation Forecastsa
168 Brookings Papers on Economic Activity, Fall 2015
forecasts. As the upper panel also makes clear, there is considerable hetero-geneity in the degree of uncertainty associated with individuals’ forecasts. The lower panel reports the average probability assigned by managers to each bin of the distribution. While most of the mass is assigned to bins ranging from 0 to 6 percent inflation, much higher inflation rates receive a significant weight on average as well.
An alternative definition of anchored expectations, which is again weaker than strongly ε-anchored, is to allow agents to have different beliefs about inflation targets. In this case one can observe both a mean forecast that devi-ates from the true target as well as a high dispersion in forecasts (since agents disagree about targets). This is formalized in definition 4, which follows.
II.D. Consistently Anchored Expectations
Definition 4. We say inflation expectations of agent i for any horizon t ≥ 0 are consistently ε-anchored at t, if the total change in the cumulative distribution function of his belief from t - 1 to t is less than ε in magnitude:
F x F x dxt ti
t ti∫ ( ) ( )- < ε+t +t- -�
.1 1
Prediction 4: Agents should display small forecast revisions. The size of an agent’s forecast revision of inflation at time t for any horizon t ≥ 0 is less than ε if her inflation expectation for horizon t is consistently ε-anchored at t.
Lemma 3. Define forecast revision for agent i at time t for horizon t as FR i
t+t|t = p it+t|t - p i
t+t-1|t-1. If inflation expectations for horizon t are ideally ε/2-anchored at t - 1 and t, then they are also consistently ε-anchored. More-over, if expectations for horizon t are strongly ε/2-anchored at t - 1 and t, then they are also consistently (ε + d′)-anchored where FR dit t
i∫′d ≡ +t0
1
is the absolute size of average forecast revision across agents.
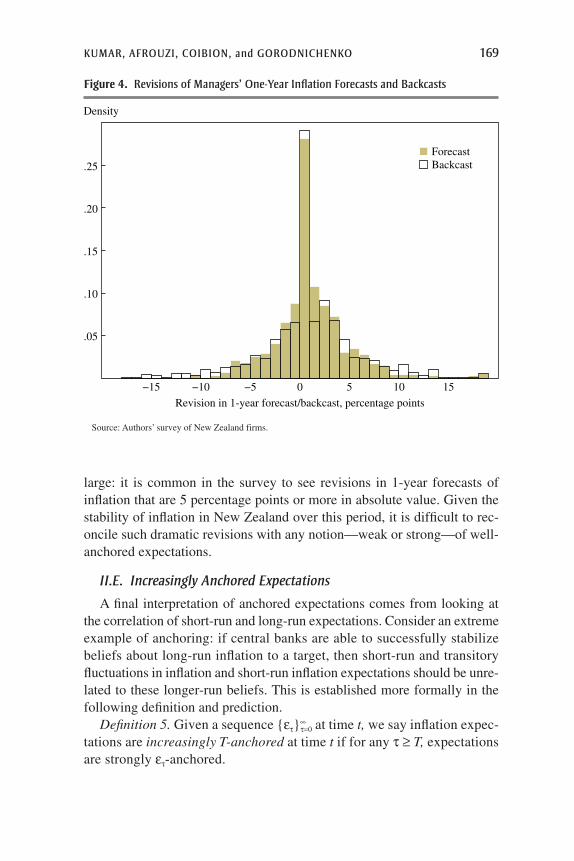
Under this definition of anchoring, individuals’ revisions in their infla-tion forecasts should tend to be small, as established in prediction 4, since agents expect the central bank to be able to keep inflation stable over long enough horizons. Because our survey includes a panel dimension, we can examine this prediction using revisions in managers’ inflation forecasts. In figure 4, we plot the distribution of revisions of managers’ 1-year inflation forecasts along with (for comparison) the distribution of revisions in their views about inflation over the previous 12 months. While one might expect the latter to display significantly more dispersion, the figure illustrates that the dispersion in revisions of forecasts at the 1-year horizon is almost as
KUMAR, AFROUZI, COIBION, and GORODNICHENKO 169
large: it is common in the survey to see revisions in 1-year forecasts of inflation that are 5 percentage points or more in absolute value. Given the stability of inflation in New Zealand over this period, it is difficult to rec-oncile such dramatic revisions with any notion—weak or strong—of well-anchored expectations.
II.E. Increasingly Anchored Expectations
A final interpretation of anchored expectations comes from looking at the correlation of short-run and long-run expectations. Consider an extreme example of anchoring: if central banks are able to successfully stabilize beliefs about long-run inflation to a target, then short-run and transitory fluctuations in inflation and short-run inflation expectations should be unre-lated to these longer-run beliefs. This is established more formally in the following definition and prediction.
Definition 5. Given a sequence {εt}∞t=0 at time t, we say inflation expec-
tations are increasingly T-anchored at time t if for any t ≥ T, expectations are strongly εt-anchored.
Source: Authors’ survey of New Zealand firms.
−15 −10 −5 0 5 10 15
Revision in 1-year forecast/backcast, percentage points
ForecastBackcast.25
.20
.15
.10
.05
Density
Figure 4. Revisions of Managers’ One-Year Inflation Forecasts and Backcasts
170 Brookings Papers on Economic Activity, Fall 2015
Notice that increasingly T-anchored expectations are weaker than strongly anchored expectations when they are required to be strongly εt-anchored for t ≥ 0, since this condition does not impose any restric-tions on expectations over short-run horizons.
Prediction 5: Long-run expectations should be unpredictable using short-run expectations. Consider the following regression for time t data:
errort ti
t ti
iπ = α + β π ++τ τ τ + .1
Now, given the sequence {εt}∞t=0 such that limt→∞εt = 0, suppose expecta-
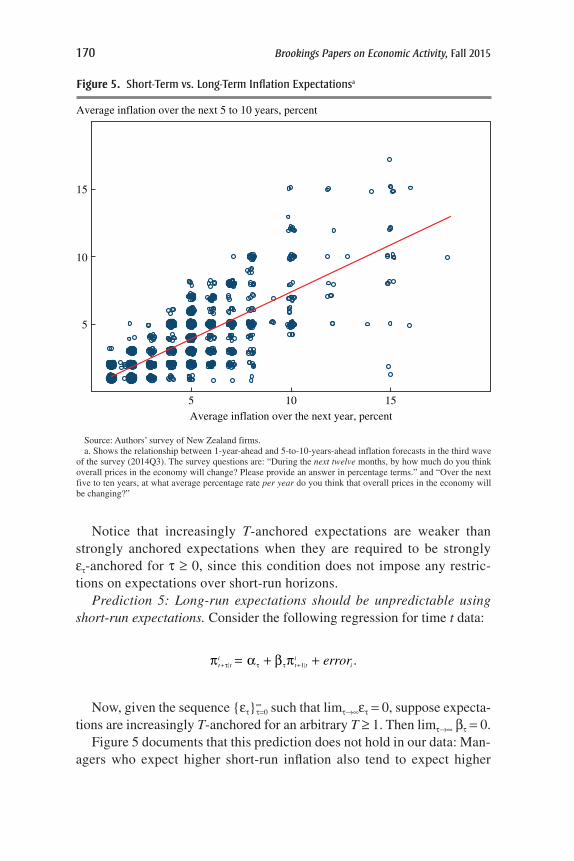
tions are increasingly T-anchored for an arbitrary T ≥ 1. Then limt→∞ bt = 0.Figure 5 documents that this prediction does not hold in our data: Man-
agers who expect higher short-run inflation also tend to expect higher
Source: Authors’ survey of New Zealand firms. a. Shows the relationship between 1-year-ahead and 5-to-10-years-ahead inflation forecasts in the third wave
of the survey (2014Q3). The survey questions are: “During the next twelve months, by how much do you think overall prices in the economy will change? Please provide an answer in percentage terms.” and “Over the next five to ten years, at what average percentage rate per year do you think that overall prices in the economy will be changing?”
5 10 15Average inflation over the next year, percent
Average inflation over the next 5 to 10 years, percent
15
10
5
Figure 5. Short-Term vs. Long-Term Inflation Expectationsa
KUMAR, AFROUZI, COIBION, and GORODNICHENKO 171
long-run inflation. While one might still expect to find a positive slope between the two sets of expectations simply because the time horizon of the long-run expectations is not long enough (t is too small), the size of the slope coefficient that we find is too large to be explained by this fea-ture of the data. For example, if agents set their 5-to-10-years-ahead fore-casts equal to a weighted average of their 1-year-ahead expectation and their expectation about long-run inflation, the implied slope of the rela-tionship should be small (between 0.1 and 0.2 for the 5-to-10-years-ahead forecasts), whereas figure 5 illustrates a slope of 0.70. Consequently, the strength of the relationship between managers’ long-run and short-run inflation expectations is much greater than one would expect to see under well-anchored expectations.
In short, the survey of firm managers in New Zealand suggests that no matter which definition of anchoring we adopt, and even using much weaker versions than commonly considered, the inflation expectations of firm managers do not conform in the least bit to the properties one would expect from agents with well-anchored expectations.
III. Credibility vs. Knowledge of the Central Bank’s Objectives
That inflation expectations in New Zealand appear to be unanchored despite 25 years of inflation targeting and relatively stable inflation is puzzling. One reason so many managers’ long-run inflation forecasts are so high might be that they do not view the RBNZ as a credible institution, that is, they do not believe in the RBNZ’s ability or willingness to achieve its long-run infla-tion objective. Another possibility is that many managers are unaware of the objectives of the central bank and of recent inflation dynamics. In this section, we try to differentiate between these two potential explanations.
III.A. Managers’ Knowledge
In the fourth and fifth waves of the survey, we asked managers several questions designed to assess their knowledge of the objectives of the cen-tral bank and of monetary policy more generally. First, we posed the fol-lowing question to them in the fourth wave of the survey:
What is the main objective of the Reserve Bank?a. Keep the exchange rate stable [23 percent]b. Promote full employment [25 percent]c. Keep interest rates low and stable [11 percent]d. Keep inflation low and stable [31 percent]e. Help the government finance its spending [10 percent]
172 Brookings Papers on Economic Activity, Fall 2015
The percent figures in square brackets show the shares of responses.7 Only 31 percent of respondents correctly chose answer (d). Given that there were five choices available, this suggests that very few people know even in a broad sense the main objective of the RBNZ. We then asked the following question:
What annual percentage rate of change in overall prices do you think the Reserve Bank of New Zealand is trying to achieve?Answer: . . . . . . . . . . . . . . . . . percent
We present a detailed distribution of the responses to that question in table 2. Of the respondents, only 12 percent correctly responded 2 percent, although an additional 25 percent said either 1 percent or 3 percent, the bottom and top of the target range of the RBNZ. At the same time, 15 per-cent of respondents said the RBNZ’s target inflation rate was 5 percent and 36 percent of them said it was higher than 5 percent, including 5 percent of respondents who said it was 10 percent or more.
Finally, we asked managers the following:8
What is the name of the Governor of the Reserve Bank of New Zealand?a. Graeme Wheeler [30 percent]b. Alan Bollard [39 percent]c. Bill English [17 percent]d. Charles Cowley [9 percent]e. I don’t know [4 percent]
In that list, only two people (Wheeler and Bollard) are or were affiliated with the RBNZ, and they obtained 69 percent of the responses. The correct answer (a) was again chosen by only 30 percent of respondents. The most popular response was the name of the governor (Bollard) who had actually stepped down from the office more than two years before the survey.
Jointly, these questions point toward a pervasive lack of knowl-edge about monetary policy on the part of firm managers. In fact, only 10 percent of respondents answered all three questions exactly correctly. But those who answered all questions correctly displayed significantly
7. Because of the large sample size, both here and in the remainder of the paper we can reject the null hypothesis that the share of managers picking a given option is equal to 1 N , where N is the number of options in a multiple choice question.
8. Graeme Wheeler was the governor of the RBNZ at the time of the survey (2015Q1). He had been the governor since September 2012. Alan Bollard had been the governor of the RBNZ until September 2012. Bill English was the minister of finance at the time of the survey. Charles Cowley is a randomly chosen person in New Zealand.
Tabl
e 2.
Per
ceiv
ed R
BN
Z In
flatio
n Ta
rget
and
Man
ager
s’ In
flatio
n Fo
reca
sts
Perc
eive
d in
flati
on
targ
et o
f th
e R
BN
Z
Perc
ent o
f m
anag
ers
repo
rtin
g a
targ
et(1
)
Infla
tion
fore
cast
Ave
rage
in
flati
on
back
cast
d
(9)
Mea
naSt
anda
rd d
evia
tion
b
Ave
rage
un
cert
aint
yc
1 ye
ar,
wav
e 4
(2)
1 ye
ar,
wav
e 3
(3)
5–10
yea
rs,
wav
e 3
(4)
1 ye
ar,
wav
e 4
(5)
1 ye
ar,
wav
e 3
(6)
5–10
yea
rs,
wav
e 3
(7)
1 ye
ar,
wav
e 4
(8)
114
.96
3.1
2.7
2.2
2.2
2.0
1.8
1.64
2.6
212
.41
2.8
2.5
2.1
1.5
1.4
1.3
1.68
2.3
310
.26
4.1
3.6
3.0
2.4
2.1
1.9
1.91
3.1
411
.46
5.7
5.2
4.1
3.2
2.9
2.7
2.24
5.6
514
.96
5.9
5.3
4.1
3.2
2.7
2.4
2.10
6.1
68.
915.
45.
03.
92.
92.
72.
82.
056.
17
7.80
5.8
5.4
3.7
3.6
2.8
2.2
2.16
6.3
88.
756.
76.
24.
83.
63.
03.
22.
386.
69
5.49
5.7
5.2
4.0
3.1
2.5
2.6
2.02
7.3
10+
5.01
6.4
6.0
5.0
2.9
2.8
3.0
2.05
8.2
Sour
ce: A
utho
rs’ s
urve
y of
New
Zea
land
firm
s.a.
Rep
orts
mea
n in
flatio
n fo
reca
sts
at d
iffe
rent
hor
izon
s fo
r va
riou
s w
aves
of
the
surv
ey.
b. R
epor
ts c
ross
-sec
tiona
l sta
ndar
d de
viat
ion
of in
flatio
n fo
reca
sts
at d
iffe
rent
hor
izon
s fo
r va
riou
s w
aves
of
the
surv
ey.
c. R
epor
ts a
vera
ge (
acro
ss fi
rms)
sta
ndar
d de
viat
ion
of in
flatio
n fo
reca
st im
plie
d by
the
prob
abili
ty d
istr
ibut
ion
repo
rted
by
firm
s’ m
anag
ers.
d. R
epor
ts th
e av
erag
e pe
rcei
ved
infla
tion
rate
ove
r th
e pr
evio
us 1
2 m
onth
s.
174 Brookings Papers on Economic Activity, Fall 2015
better-behaved forecasts (in the sense of being closer to those of profes-sionals): Their mean long-run inflation forecast was exactly 2 percent with a cross-sectional standard deviation of just 1.2 percentage points, whereas all other respondents had a mean forecast of 3.7 percent with a standard deviation of 2.6 percentage points. Likewise, the mean short-term forecast of these all-correct-answer respondents was 2.6 percent (standard devia-tion of 1.4 per centage points), while all other respondents had a mean of 5.2 percent (standard deviation of 3.2 percentage points). These respon-dents also had much better knowledge of recent inflation dynamics, with average backcasts of just 1.5 percent (standard deviation of 0.6 percentage point) compared with 4.6 percent (standard deviation of 2.4 percentage points) for other respondents.
III.B. Managers’ Views of the Central Bank’s Credibility
Additional evidence does not suggest that the RBNZ suffers from a sig-nificant credibility problem. For example, among respondents who knew that the target inflation rate was centered at 2 percent, 89 percent forecasted that inflation over the next 5 to 10 years would range from 1 to 3 percent, as illustrated in table 2. Among those who knew that the main objective of the central bank was to keep inflation low and stable, the average long-run forecast of inflation was again 2 percent. This suggests that from the point of view of those agents who know the central bank’s objective, that objec-tive is credible, and it is embedded in their forecasts.
The credibility of the RBNZ extends even to many of those who were incorrect about its actual inflation target: managers who thought that the RBNZ’s target was 3 percent reported an average long-run inflation fore-cast of 3 percent, and those who thought the target was 4 percent reported an average long-run inflation forecast of 4 percent.9 So while those two clusters of respondents were incorrect about the value the RBNZ was trying to achieve, their forecasts were consistent with the notion that the RBNZ would be able to achieve what they perceived to be its objective.
In the fifth wave of the survey, we posed two additional questions meant to directly address the credibility of the central bank. One question was this:
Do you think the central bank can control inflation over the next 5 to 10 years?
9. For higher RBNZ inflation targets believed by respondents, the relationship between the target and managers’ forecasts becomes flatter, with forecasts no longer rising one-for-one with targets but still increasing.
KUMAR, AFROUZI, COIBION, and GORODNICHENKO 175
The point was to assess whether managers believed the central bank could achieve its inflation target over a medium to long time horizon. Out of the 50 respondents in the fifth wave, 49 responded yes. This indicates broad support on the part of managers for the view that monetary policy-makers can achieve their medium- to long-run policy objectives. We also asked respondents the following question:
Do you think the central bank can control inflation in the next 12 months or so?
Strikingly, 47 of the 50 respondents answered yes. Thus, the vast major-ity of firm managers assign tremendous credibility to the central bank, since they believe it can control inflation even at short horizons.
We interpret these results as suggesting that the credibility of the RBNZ is well established in New Zealand. The issue appears not to be one of credibility but, instead, that many managers are relatively uninformed about the practical objectives and targets of the central bank. This lack of quantitative information is reflected in the forecasts they report. Indeed, as documented in table 2, managers who were uninformed about the RBNZ’s target inflation rate also tended to be much less informed about recent inflation dynamics, and their forecasts were also associated with much more uncertainty. Given the ease with which information about monetary policy can be accessed, it may seem surprising that so many managers of firms are not more informed about it.
III.C. Accounting for the Lack of Knowledge
What could account for these differences in knowledge about monetary policy? One possibility could be that better-educated managers simply know much more about monetary policy than others, but as column 7 of table 3 reveals, there are few differences in the average education levels across groups. Another possibility is that different types of managers place different values on information about monetary policy or about inflation more generally. To assess this, we asked managers about their willingness to pay for monthly forecasts of inflation as well as for forecasts of other macroeconomic variables. The results, presented in columns 2 and 3 of table 3, indicate that on average, firm managers who correctly reported low values of the RBNZ’s inflation target also reported being willing to pay much more for inflation forecasts, both in dollar terms and as a share of firm sales, than managers who reported higher target values. By con-trast, no such striking pattern exists for other macroeconomic variables (columns 4 and 5). This finding confirms that managers do indeed seem to
Tabl
e 3.
Val
ue o
f New
s fo
r Fi
rm M
anag
ers
in N
ew Z
eala
nd
Perc
eive
d in
flati
on
targ
et o
f the
RB
NZ
Perc
ent o
f m
anag
ers
repo
rtin
g a
targ
et
(1)
Wil
ling
ness
to p
ay fo
r ha
ving
acc
ess
to p
rofe
ssio
nal
fore
cast
, by
vari
able
a
Abs
olut
e sl
ope
of
the
profi
t fu
ncti
onb
(6)
Ave
rage
ye
ars
of
scho
olin
g (7
)
Fre
quen
cy
of fo
llow
ing
med
ia n
ews
abou
t the
ec
onom
yc
(8)
Fre
quen
cy
of r
eadi
ng
publ
ic
sour
ces
abou
t the
ec
onom
yd
(9)
Infla
tion
GD
P
(dol
lars
pe
r ye
ar)
(4)
Une
mpl
oym
ent
(dol
lars
pe
r ye
ar)
(5)
Dol
lars
pe
r ye
ar
(2)
Perc
ent
of s
ales
(3
)
114
.96
195
0.01
812
511
81.
0815
.74
3.7
6.7
212
.41
202
0.01
713
012
11.
1315
.61
4.2
7.3
310
.26
172
0.01
512
612
61.
1315
.22
6.9
10.1
411
.46
126
0.01
014
912
91.
0115
.63
9.8
12.9
514
.96
110
0.00
715
112
71.
0115
.24
10.9
14.6
68.
9110
60.
008
143
136
0.98
15.1
611
.714
.87
7.80
104
0.00
714
913
71.
0015
.36
11.4
14.3
88.
7510
70.
008
150
134
0.89
15.3
511
.514
.59
5.49
101
0.00
716
513
20.
9315
.12
11.8
14.6
10+
5.01
98
0.00
614
112
71.
0115
.35
11.5
15.0
Sour
ce: A
utho
rs’ s
urve
y of
New
Zea
land
firm
s.a.
Col
umns
2, 4
, and
5 r
epor
t the
ave
rage
dol
lar
amou
nt m
anag
ers
are
will
ing
to p
ay p
er y
ear
for
mon
thly
pro
fess
iona
l for
ecas
ts o
f ec
onom
ic v
aria
bles
. Col
umn
3 re
port
s th
e av
erag
e pe
rcen
t of
annu
al s
ales
man
ager
s ar
e w
illin
g to
pay
for
mon
thly
pro
fess
iona
l for
ecas
ts o
f in
flatio
n.b.
Rep
orts
the
aver
age
abso
lute
slo
pe o
f th
e pr
ofit f
unct
ion
with
res
pect
to th
e pr
ice
of a
firm
’s m
ain
prod
uct.
c. R
epor
ts th
e fr
eque
ncy
(mon
ths)
at w
hich
man
ager
s up
date
thei
r in
form
atio
n ab
out t
he s
tate
of
the
econ
omy
usin
g m
edia
new
s.d.
Rep
orts
the
freq
uenc
y (m
onth
s) a
t whi
ch m
anag
ers
chec
k pu
blic
sou
rces
abo
ut th
e st
ate
of th
e ec
onom
y.
KUMAR, AFROUZI, COIBION, and GORODNICHENKO 177
assign very different values to information about inflation, and that these valuations are reflected in their knowledge of both monetary policy and inflation dynamics.
Also consistent with an information channel is the frequency with which managers follow news about the economy. We asked managers about the frequency (daily, weekly, monthly, quarterly, semiannually, annually, less than annually) with which they followed news about the economy from media sources as well as, in a separate question, from official public sources (such as monetary policy reports). Our results, converted into answers in months, are presented in columns 8 and 9 of table 3 for each group of managers that gave a common answer as to the RBNZ’s inflation target. Managers who were aware of the low inflation target followed media reports closely (once every 3 to 5 months on average) but this attention to news declines sharply with higher inflation targets, before stabilizing for managers who reported targets of 5 percent or more, for whom the average frequency in following media reports was approximately once per year. An identical pattern occurs with news from public sources, albeit at lower frequencies.
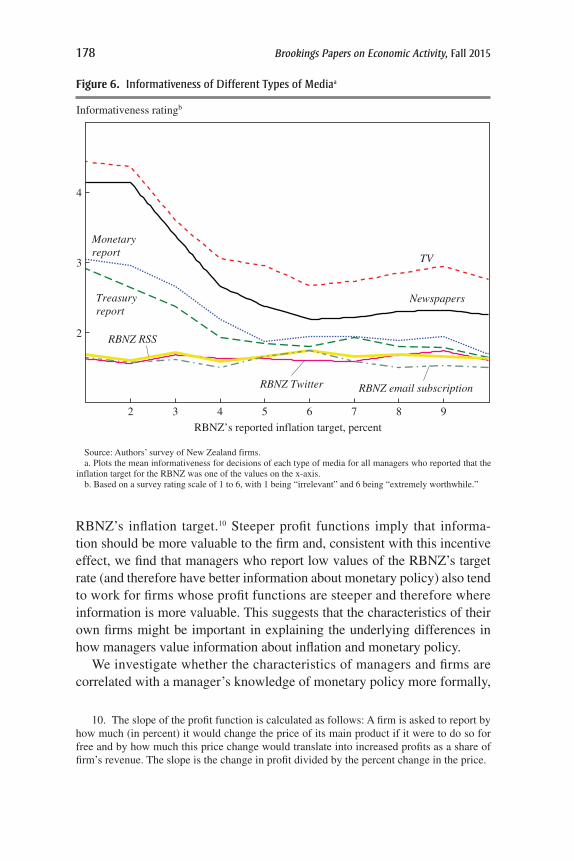
We also asked firm managers to describe how informative for their busi ness decisions (on a scale of 1 for “irrelevant” to 6 for “extremely worthwhile”) they found different types of news reports to be: television, news papers, monetary policy reports, and different kinds of direct com-munications from the RBNZ. Results are plotted in figure 6, averaged across managers depending on their answers about the RBNZ’s target rate of infla-tion. Managers who said the target was either 1 or 2 percent reported that television and newspapers were quite useful to their business decisions, consistent with their frequent use of these media as documented in table 3, and also reported that monetary and Treasury reports were somewhat use-ful. However, the perceived usefulness of all these media for business deci-sions declines sharply for managers who reported higher inflation targets. Meanwhile, none of the managers, regardless of their belief about the infla-tion target, reported finding much utility for their business decisions from direct communications by the central bank via email, RSS, or Twitter.
Why might different managers perceive the value of information about inflation to be different? One possibility is that the characteristics of the firms in which they work influence their perception of the value of informa-tion. For example, as column 6 of table 4 documents, there are pronounced differences in the average absolute slope of the firm’s profit function with respect to firm’s price, as defined in Coibion, Gorodnichenko, and Kumar (2015), depending on how managers responded to questions about the
178 Brookings Papers on Economic Activity, Fall 2015
RBNZ’s inflation target.10 Steeper profit functions imply that informa-tion should be more valuable to the firm and, consistent with this incentive effect, we find that managers who report low values of the RBNZ’s target rate (and therefore have better information about monetary policy) also tend to work for firms whose profit functions are steeper and therefore where information is more valuable. This suggests that the characteristics of their own firms might be important in explaining the under lying differences in how managers value information about inflation and monetary policy.
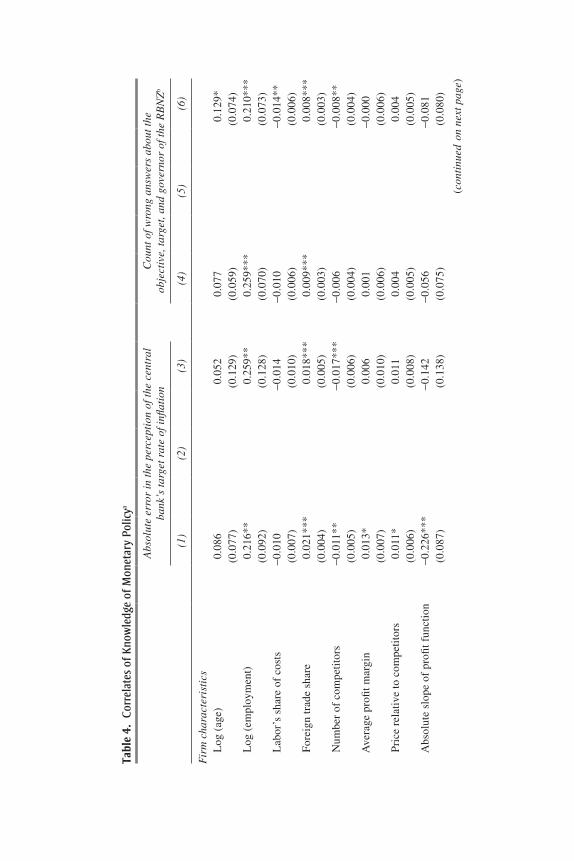
We investigate whether the characteristics of managers and firms are correlated with a manager’s knowledge of monetary policy more formally,
Source: Authors’ survey of New Zealand firms. a. Plots the mean informativeness for decisions of each type of media for all managers who reported that the
inflation target for the RBNZ was one of the values on the x-axis.b. Based on a survey rating scale of 1 to 6, with 1 being “irrelevant” and 6 being “extremely worthwhile.”
2
3
4
2 3 4 5 6 7 8 9
RBNZ’s reported inflation target, percent
Newspapers
TV
Monetary report
Treasuryreport
RBNZ Twitter
RBNZ RSS
RBNZ email subscription
Informativeness ratingb
Figure 6. Informativeness of Different Types of Mediaa
10. The slope of the profit function is calculated as follows: A firm is asked to report by how much (in percent) it would change the price of its main product if it were to do so for free and by how much this price change would translate into increased profits as a share of firm’s revenue. The slope is the change in profit divided by the percent change in the price.
Tabl
e 4.
Cor
rela
tes
of K
now
ledg
e of
Mon
etar
y Po
licya
Abs
olut
e er
ror
in th
e pe
rcep
tion
of t
he c
entr
al
bank
’s ta
rget
rat
e of
infla
tion
Cou
nt o
f wro
ng a
nsw
ers
abou
t the
ob
ject
ive,
targ
et, a
nd g
over
nor
of th
e R
BN
Zb
(1)
(2)
(3)
(4)
(5)
(6)
Fir
m c
hara
cter
isti
cs
Log
(ag
e)0.
086
0.05
20.
077
0.12
9*(0
.077
)(0
.129
)(0
.059
)(0
.074
)
Log
(em
ploy
men
t)0.
216*
*0.
259*
*0.
259*
**0.
210*
**(0
.092
)(0
.128
)(0
.070
)(0
.073
)
Lab
or’s
sha
re o
f co
sts
-0.0
10-0
.014
-0.0
10-0
.014
**(0
.007
)(0
.010
)(0
.006
)(0
.006
)
For
eign
trad
e sh
are
0.02
1***
0.01
8***
0.00
9***
0.00
8***
(0.0
04)
(0.0
05)
(0.0
03)
(0.0
03)
N
umbe
r of
com
peti
tors
-0.0
11**
-0.0
17**
*-0
.006
-0.0
08**
(0.0
05)
(0.0
06)
(0.0
04)
(0.0
04)
A
vera
ge p
rofi
t mar
gin
0.01
3*0.
006
0.00
1-0
.000
(0.0
07)
(0.0
10)
(0.0
06)
(0.0
06)
P
rice
rel
ativ
e to
com
peti
tors
0.01
1*0.
011
0.00
40.
004
(0.0
06)
(0.0
08)
(0.0
05)
(0.0
05)
A
bsol
ute
slop
e of
pro
fit f
unct
ion
-0.2
26**
*-0
.142
-0.0
56-0
.081
(0.0
87)
(0.1
38)
(0.0
75)
(0.0
80)
(con
tinu
ed o
n ne
xt p
age)
Man
ager
cha
ract
eris
tics
A
ge-0
.014
*-0
.014
-0.0
08-0
.007
(0.0
07)
(0.0
09)
(0.0
05)
(0.0
05)
Y
ears
of
scho
olin
g-0
.069
***
-0.0
51*
-0.0
42**
-0.0
41**
(0.0
23)
(0.0
30)
(0.0
18)
(0.0
19)
Te
nure
0.03
8***
0.00
10.
026*
**-0
.006
(0.0
08)
(0.0
14)
(0.0
06)
(0.0
08)
In
com
e0.
003*
0.00
10.
001
0.00
1(0
.001
)(0
.002
)(0
.001
)(0
.001
)
Indu
stry
fixe
d ef
fect
sY
esY
esY
esY
esY
esY
esN
o. o
f ob
serv
atio
ns1,
253
1,13
81,
141
1,25
61,
141
1,14
1R
20.
243
0.19
40.
179
0.15
40.
122
0.16
1
Sour
ce: A
utho
rs’ s
urve
y of
New
Zea
land
firm
s.a.
Rep
orts
res
ults
of
regr
essi
ng e
rror
s ab
out o
bjec
tives
, tar
get,
and
gove
rnor
of
the
RB
NZ
on
a se
t of
firm
and
man
ager
cha
ract
eris
tics
indi
cate
d in
the
left
col
umn.
Rob
ust
stan
dard
err
ors
in p
aren
thes
es. S
tatis
tical
sig
nific
ance
at t
he *
**1
perc
ent,
**5
perc
ent,
and
*10
perc
ent l
evel
s.b.
Sur
vey
aske
d re
spon
dent
s ab
out t
he R
BN
Z's
obj
ecti
ve, i
nflat
ion
targ
et, a
nd c
urre
nt g
over
nor
(see
sub
sect
ion
III.
A).
If
all a
nsw
ers
are
corr
ect,
the
coun
t is
equa
l to
0;
if a
ll an
swer
s ar
e w
rong
, the
cou
nt is
equ
al to
3.
Tabl
e 4.
Cor
rela
tes
of K
now
ledg
e of
Mon
etar
y Po
licya
(Con
tinu
ed)
Abs
olut
e er
ror
in th
e pe
rcep
tion
of t
he c
entr
al
bank
’s ta
rget
rat
e of
infla
tion
Cou
nt o
f wro
ng a
nsw
ers
abou
t the
ob
ject
ive,
targ
et, a
nd g
over
nor
of th
e R
BN
Zb
(1)
(2)
(3)
(4)
(5)
(6)
KUMAR, AFROUZI, COIBION, and GORODNICHENKO 181
as follows. We consider two types of errors made by managers: errors spe-cific to the target (the absolute deviation of their perception of the RBNZ target rate from 2 percent) and overall errors in answering questions (the sum of the number of answers they got wrong on the three survey questions on monetary policy). We then regress each of these manager-specific errors on a set of firm-specific characteristics, including the firm’s age, employ-ment at the firm, labor’s share of total costs, foreign sales as a share of total revenues, the number of competitors reported by the manager, the firm’s average profit margin, the price of the firm’s main product relative to that of its competitors, and the absolute slope of the firm’s profit function. All but the last variable come directly from survey questions asked of managers, and the slope is constructed from other questions asked of the managers. We also control for individual characteristics of the manager, such as their age, years of schooling, income, and tenure at the firm. Finally, we include industry fixed effects.
A few results (table 4) stand out as particularly robust. First, the number of competitors faced by a firm is systematically associated with smaller errors about the RBNZ’s inflation target and about monetary policy more generally. One might interpret this as higher competition inducing man-agers to pay more attention to economic conditions, including monetary policy, to avoid being driven out of business. We also find that firms that receive more of their sales from abroad make bigger errors about mon-etary policy in New Zealand, which likely reflects their reduced incentive to track New Zealand’s economy relative to that of their trading partners. Having more years of schooling on the part of managers is systematically associated with smaller errors about monetary policy. Interestingly, man-agers of larger firms make larger errors both about the RBNZ’s inflation target as well as about monetary policy more broadly. Hence, these results confirm that characteristics of the firm play some role in accounting for the knowledge of monetary policy and inflation that managers display. How-ever, because much of the variation remains unexplained, we turn to a more narrative approach to assess in greater depth how managers form and use their inflation expectations.
IV. What Managers Know about Inflation, How They Learn It, and Whether It Matters
Since the properties of firm managers’ inflation expectations and percep-tions appear to be so at odds with anchored expectations, we consider in this section three general sets of questions. First, what do managers actually
182 Brookings Papers on Economic Activity, Fall 2015
know about inflation? Perhaps many are confused about the concept or do not understand how it is measured. Second, where do managers get the infor mation that goes into their beliefs about inflation and inflation expec-tations? Does it come from professional forecasters and statistical agen-cies, or from the media, or is it based on their daily experience with prices, either through their professional experience with competitors and clients or through their own shopping experience? Third, do their inflation expec-tations matter for any of the decisions that they make as managers? We address each of these in turn.
IV.A. What Do Managers Know?
Given the properties of firm managers’ perceptions and expectations of inflation described in the previous sections, one might wonder to what extent they are knowledgeable about what inflation means or how it is measured as well as what sources of information they rely on to formu-late their inflation expectations. The smaller, fifth wave of the survey was designed to address these points, using a combination of quantitative and narrative questions. Because narrative questions are much harder to implement on a vast scale, we restricted the sample to 50 firms drawn from different bins of the inflation expectation distribution (roughly 12 firms each from bins of firms that had previously forecasted inflation of 0–3 percent, 4–6 percent, 7–10 percent, and greater than 10 percent). As before, we asked managers of these firms to state their inflation expecta-tions over the next 12 months and their perceptions of inflation over the previous 12 months.
We first assessed their basic knowledge of the term “inflation” by asking them “What is your understanding of the term inflation?” This is the same open-ended question that is posed to households in the RBNZ survey. We graded managers’ narrative answers on a scale ranging from 0 to 2 points. Our reference answer was this: “Inflation is the increase (or change) [1 point] in the general (average) price level of goods and services [1 point] in the economy.” Hence, managers received one point for recognizing that infla-tion captures a change in price levels and a second point for recognizing that it measures economy-wide prices.
Using this grading scheme, no managers received a grade of 0. Only eight managers received a score of 1, leaving 84 percent of managers in this sample as able to correctly define inflation. Of the eight who made a mistake, three stated that inflation measured food or “basic” commod-ity prices. The remaining five made statements inconsistent with inflation
KUMAR, AFROUZI, COIBION, and GORODNICHENKO 183
capturing the change in prices.11 There was little difference in the per-ceived inflation rates or expectations of managers across the two groups, suggesting that these differences in understanding of the concept of inflation play little role in accounting for the heterogeneity in managers’ forecasts. In contrast, households in the RBNZ survey fail to correctly identify inflation at much higher rates. For example, in the May 2015 survey, only 52 percent of respondents could identify inflation. So firm managers display a much better understanding of the meaning of the term inflation than households.
Another reason why firm managers might hold inflation expectations and perceptions so at odds with recent inflation measurements is that they do not believe the official inflation statistics. To address this possibility, we asked firm managers in the fifth wave of the survey the following question:
Do you think official inflation data are credible in the sense that it reflects the true rate at which overall prices in the economy change? [Yes/No]
Eighty-six percent of managers responded that official inflation data are credible, and 14 percent expressed skepticism. The average inflation fore-cast among managers who did not believe the official inflation data is only 1 percentage point higher than that among managers who did believe the official data. As a result, skepticism about the quality of official inflation statistics can explain neither the high mean of managers’ inflation forecasts nor the dispersion in those forecasts.
If firm managers understand the concept of inflation and believe that government officials correctly measure it, how can they then perceive lev-els of inflation so different from what is measured by statistical agencies? Given that aggregate inflation is a weighted average for different categories of goods, two nonexclusive explanations are possible. One is that managers assign different weights to categories of goods from those assigned by sta-tistical agencies (such as overweight gasoline price movements). Another is that managers are mistaken about the sizes of price changes for certain categories of goods (for example, they might think food prices went up more than they did). To assess these two explanations, we asked managers in the fifth wave to report how much weight they believe statistical agen-cies assign to different categories of goods and services when constructing
11. For example, one manager stated that inflation is the average price in the economy. The others said something akin to “when prices change, inflation changes.”
184 Brookings Papers on Economic Activity, Fall 2015
overall price measures for New Zealand.12 The specific set of categories includes housing prices, stock prices, food prices, health care costs, gaso-line prices, the cost of rent, and car prices. We then asked managers to report their beliefs about price changes over the last 12 months for each of the same categories.
The results are presented in table 5, along with the actual weights applied to these categories in the construction of the Consumer Price Index (CPI) and the actual inflation rates for each category of goods. Managers’ average beliefs about the weights on housing prices (22 percent, rounding to the nearest whole number), stock prices (8 percent), and gasoline prices (19 percent) far exceed the true values (4, 0, and 5 percent respectively). In contrast, managers significantly underestimated the weight assigned to food prices (believing it to be 9 percent whereas its true weight in the CPI is 19 percent). There are also some notable differences between manag-ers’ beliefs about inflation at the category levels and actual inflation rates. Managers significantly underestimated inflation in stock prices (believing it to be 4 percent whereas the actual change was 13 percent) but overesti-mated inflation in car prices (by 7 percentage points) and food prices (by 4 percentage points).
To quantify the relative importance of these two channels, it is useful to introduce some notation. We denote the actual weight for subcategory s with wa
s and perceived weight for firm i with wps,i. Likewise, we define the
actual inflation rate for subcategory s with p as and perceived inflation for
firm i with p ps,i.
The contribution of price changes in these specific categories to actual aggregate inflation is
� wasa
sa
s∑p = p .
Equivalently, we construct firm i’s perceived contribution of these cat-egories to aggregate inflation as
� wip
s ip
s ip
s∑p = p ., ,
12. The specific phrasing of the question was, “How much weight do you think statisti-cal agencies place on each of the following categories of prices when constructing overall price measures for New Zealand? (these do not need to sum to 100 percent). Please provide percentage answers.”
KUMAR, AFROUZI, COIBION, and GORODNICHENKO 185
The error that firm i makes about this contribution can be decomposed as:
∑∑
∑ ∑ ∑{ } { } { }( ) ( ) ( )( )
p - p = p - p
= p - p + - p + - p - p .
, ,
, , , ,
� � w w
w w w w w
ip a
s ip
s ip
sa
sa
ss
sa
s ip
sa
s s ip
sa
sa
s s ip
sa
s ip
sa
s
The first term captures the contribution of the manager’s errors about category-specific inflation rates. The second term captures the contribution of the manager’s errors about the weights applied to each category. The
Table 5. Managers’ Perceptions of Construction of Inflation Index vs. Actual Constructiona
Perceived Actual
Weight Inflation rate Weight Inflation rate
Housing prices 21.7 7.5 4.4 5.3(14.3) (1.6)
Stock prices 8.4 3.7 0.0 13.3(5.7) (2.8)
Food prices 8.9 4.0 18.8 0.2(8.1) (2.0)
Health care costs 8.4 0.7 4.0 1.8(6.4) (1.7)
Gasoline prices 18.9 -6.3 4.7 -7.4(12.7) (6.0)
Cost of rent 9.4 3.5 9.4 2.3(6.4) (1.8)
Car price 10.3 3.3 3.3 -3.8(9.7) (1.6)
Implied inflation contributionb 1.79 0.08(2.12)
Errorc 1.71 (2.12) Of which:
Ss was(pp
s,i - pas) 1.18 (0.48)
Ss(wps,i - wa
s)pas
0.78 (1.48)
Ss(wps,i - wa
s)(pps,i - pa
s) -0.24 (1.85)
Source: Statistics New Zealand and authors’ survey of New Zealand firms.a. The top panel of the table shows perceived and actual weights and inflation rates for the subcategories
of the CPI in the left column. In all panels, standard deviations are in parentheses.b. Shows the total perceived (~pp) and actual (~pa) percentage-point contribution of the subcategories in
the left column to aggregate CPI inflation.c. Shows the difference between total perceived and actual contribution to aggregate CPI inflation and
its decomposition.
186 Brookings Papers on Economic Activity, Fall 2015
final term captures the covariance between errors in weights and errors in ainflation rates across categories.
Results of this decomposition are reported in table 5. First, we report the average values of the error across all firms as well as the average values of each of the terms in the decomposition. The average manager error is 1.7 percentage points, implying that on average, managers overestimated the positive effect of these categories on aggregate inflation. Errors about category-level inflation rates contributed about 1.2 out of the 1.7 percent-age points. Therefore, much of the average error can be explained by the fact that, on average, managers significantly overestimated the increase in food prices. The contribution of errors about weights is smaller, 0.8 per-centage point out of the 1.7 percentage points, and comes primarily from the fact that managers overestimated the weights on housing and stock prices. The negative covariance term is driven largely by stock prices and food prices, in which respondents over(under)estimated the weights but under(over)estimated the inflation rate. These results suggest that managers’ errors about recent inflation rates for specific categories of goods, particu-larly food prices, can account for much of their average misperceptions of aggregate inflation.
However, another feature worth noting in table 5 is that the cross-sectional standard deviations of inflation perceptions for most categories of goods are relatively low. In fact, for all but stock prices and gasoline prices (two very volatile price series), there is actually less disagreement among managers about inflation at the category level than there is about aggregate inflation. This suggests that disagreement about category-level inflation rates among managers is unlikely to account for the amount of dis-agreement that we observe in managers’ beliefs about aggregate inflation rates. Consistent with this, we report in table 5 the cross-sectional standard deviations of each term in the decomposition of the errors above. Dis-agreement among managers about the weights assigned to different cat-egories accounts for three times more of the dispersion in inflation errors than disagreement about category-specific inflation rates.
This last result suggests that the primary source of the large disagree-ment that we observe in managers’ perceptions of recent inflation rates is differences in opinion about the relative importance of different categories of goods in the measurement of inflation.13
13. This result is not sensitive to the particular decomposition we used. For exam-
ple, another decomposition is w w w w wip a
s sa
s ip
sa
s s ip
sa
s ip
ip
s ip
s ip
saS S S{ } { } { }( ) ( )( ) ( )p - p = p - p + - p - p + p -� � � �, , , ,
w w w w wip a
s sa
s ip
sa
s s ip
sa
s ip
ip
s ip
s ip
saS S S{ } { } { }( ) ( )( ) ( )p - p = p - p + - p - p + p -� � � �, , , , , where the first term is the same as before, the second measures the
KUMAR, AFROUZI, COIBION, and GORODNICHENKO 187
IV.B. How Do Managers Form Inflation Expectations?
For managers to hold such different expectations about inflation, they must rely on different sources of information to form their expectations. We investigate the sources of managers’ inflation expectations in two ways. First, in the fifth wave of the survey, we asked managers the following open-ended question:
How do you typically form your inflation expectations?
Managers provided four general types of responses, as summarized in table 6.
First, 47 percent of respondents stated that they relied primarily on media sources for their information about inflation. These respondents tended to have much better information about recent inflation dynamics than others, with average absolute backcast errors being smaller by one percentage point on average; inflation forecast errors were lower as well. The second
extent to which agents place too much (too little) weight on categories of goods for which inflation is higher (lower) than average, and the third term captures potential errors from assigning too much or too little cumulative weights to all of the listed categories of goods (since the weights do not need to sum to one). This decomposition also implies that average errors primarily reflect errors in category-level inflation rates (since the first term in this decomposition is identical to ours). It similarly implies that the cross-sectional dispersion in inflation forecast errors is largely due to differences in beliefs about weights, since the cross-sectional standard deviation of the second term is almost three times that of the first term, about the same ratio as in our original decomposition. We are grateful to David Romer for suggesting this alternative way of decomposing forecast errors.
Table 6. Narrative Responses to How Managers Form Their Inflation Expectationsa
“How do you typically form your inflation expectations?”
Percent of managers
(1)
Absolute backcast error
Inflation forecast
Mean (2)
SD (3)
Mean (4)
SD (5)
Media 47 2.61 1.78 3.65 2.45Meetings and discussions 10 3.10 1.52 4.00 1.22Shopping experience 43 4.27 1.47 4.95 1.12Prices of competitors and suppliers 10 4.50 2.17 5.20 2.39
Total — 3.31 1.81 4.24 1.95
Source: Authors’ survey of New Zealand firms.a. Narrative responses may be classified into several categories. Of all the survey responses, only one
response did not fit into any of the four groups indicated in the left column. For columns 1 and 4, the values are expressed as percents; all other values are expressed as percentage points..
188 Brookings Papers on Economic Activity, Fall 2015
Table 7. Quantitative Responses to How Managers Form Their Inflation Expectationsa
Share of managers
(1)
Importance of information sourceAverage absolute backcast
error(11)
Average inflation forecast
(12)
Family and
friends(2)
Employees and
colleagues(3)
Customers and
suppliers(4)
Gas prices
(5)
Personal shopping
experience(6)
Government agencies
(7)
Business associations,
fairs(8)
Media(9)
Professional forecasts
(10)
All firms 1.00 2.12 1.88 1.68 4.14 4.42 1.74 1.82 3.54 2.42 3.27 4.18If response is “very important” or “extremely important” Family and friends 0.06 4.67 4.00 1.67 4.00 3.67 1.67 2.00 2.33 2.67 3.37 4.67 Employees and colleagues 0.08 3.25 4.50 2.00 4.25 4.00 2.00 1.75 2.75 2.75 2.95 3.75 Customers and suppliers 0.04 1.00 1.50 4.50 4.00 4.50 2.50 3.00 4.00 2.50 2.70 4.50 Gas prices 0.76 2.24 1.82 1.74 4.53 4.63 1.79 1.76 3.50 2.42 3.03 3.95 Personal shopping experience 0.88 2.07 1.77 1.68 4.25 4.64 1.77 1.86 3.64 2.48 3.14 4.11 Media 0.54 2.00 1.81 1.59 4.07 4.44 1.70 1.81 4.81 2.96 2.42 3.59 Professional forecasts 0.20 2.00 2.10 1.30 3.90 4.30 1.30 1.50 4.80 4.40 1.65 2.20Correlation matrix Family and friends 1.00 Employees and colleagues 0.34 1.00 Customers and suppliers -0.13 0.15 1.00 Gas prices 0.11 -0.14 -0.07 1.00 Personal shopping experience -0.14 -0.27 -0.01 0.65 1.00 Government agencies -0.10 0.09 0.31 0.15 0.09 1.00 Business associations, fairs -0.11 0.12 0.31 -0.21 -0.07 0.38 1.00 Media -0.15 -0.06 -0.05 0.02 0.21 -0.05 -0.02 1.00 Professional forecasts 0.03 0.10 0.01 -0.14 -0.11 -0.29 -0.07 0.48 1.00
Source: Authors’ survey of New Zealand firms.a. Respondents were asked to assess importance of various sources of information for their formation of
inflation expectations. The scale runs from 1 (“not important”) to 5 (“extremely important”). Columns 2–10 report average responses, collected in the fifth wave of the survey. Columns 11 and 12 report the average absolute backcast error (percentage point) and average inflation forecast (percent) of the respondents..
most common answer, accounting for 43 percent of respondents, was that they relied on their personal shopping experience to inform them about price changes. Many respondents emphasized housing prices as a particu-larly important source of information. In comparison with managers who relied on media, those who relied on their personal shopping experience tended to have larger errors about recent inflation dynamics and higher inflation forecasts. The remaining two answer categories account for much smaller shares of respondents, approximately 10 percent each. One answer is that managers discuss inflation with coworkers or family members (“meetings and discussions”). Respondents who chose this answer tended to have relatively good information about inflation. The other answer states that they rely on their competitors’ or suppliers’ prices to make inferences about aggregate inflation. This group had the largest average errors about
KUMAR, AFROUZI, COIBION, and GORODNICHENKO 189
Table 7. Quantitative Responses to How Managers Form Their Inflation Expectationsa
Share of managers
(1)
Importance of information sourceAverage absolute backcast
error(11)
Average inflation forecast
(12)
Family and
friends(2)
Employees and
colleagues(3)
Customers and
suppliers(4)
Gas prices
(5)
Personal shopping
experience(6)
Government agencies
(7)
Business associations,
fairs(8)
Media(9)
Professional forecasts
(10)
All firms 1.00 2.12 1.88 1.68 4.14 4.42 1.74 1.82 3.54 2.42 3.27 4.18If response is “very important” or “extremely important” Family and friends 0.06 4.67 4.00 1.67 4.00 3.67 1.67 2.00 2.33 2.67 3.37 4.67 Employees and colleagues 0.08 3.25 4.50 2.00 4.25 4.00 2.00 1.75 2.75 2.75 2.95 3.75 Customers and suppliers 0.04 1.00 1.50 4.50 4.00 4.50 2.50 3.00 4.00 2.50 2.70 4.50 Gas prices 0.76 2.24 1.82 1.74 4.53 4.63 1.79 1.76 3.50 2.42 3.03 3.95 Personal shopping experience 0.88 2.07 1.77 1.68 4.25 4.64 1.77 1.86 3.64 2.48 3.14 4.11 Media 0.54 2.00 1.81 1.59 4.07 4.44 1.70 1.81 4.81 2.96 2.42 3.59 Professional forecasts 0.20 2.00 2.10 1.30 3.90 4.30 1.30 1.50 4.80 4.40 1.65 2.20Correlation matrix Family and friends 1.00 Employees and colleagues 0.34 1.00 Customers and suppliers -0.13 0.15 1.00 Gas prices 0.11 -0.14 -0.07 1.00 Personal shopping experience -0.14 -0.27 -0.01 0.65 1.00 Government agencies -0.10 0.09 0.31 0.15 0.09 1.00 Business associations, fairs -0.11 0.12 0.31 -0.21 -0.07 0.38 1.00 Media -0.15 -0.06 -0.05 0.02 0.21 -0.05 -0.02 1.00 Professional forecasts 0.03 0.10 0.01 -0.14 -0.11 -0.29 -0.07 0.48 1.00
Source: Authors’ survey of New Zealand firms.a. Respondents were asked to assess importance of various sources of information for their formation of
inflation expectations. The scale runs from 1 (“not important”) to 5 (“extremely important”). Columns 2–10 report average responses, collected in the fifth wave of the survey. Columns 11 and 12 report the average absolute backcast error (percentage point) and average inflation forecast (percent) of the respondents..
recent inflation. While there are differences in beliefs within each group, these results do suggest that the average effect of the main source of infor-mation for inflation can be very large: the average difference in inflation backcast errors can be as large as 1.6 percentage points.
To investigate this insight in more detail, we also asked respondents to rank the importance of nine different sources of information to them in forming their inflation expectations on a scale of 1 (lowest) to 5 (highest). The specific sources were (i) family and friends, (ii) employees and col-leagues, (iii) customers and suppliers, (iv) gas prices, (v) personal shopping experience, (vi) government agencies, (vii) business associations, cham-bers of commerce, and trade fairs, (viii) media (television, newspapers, and so on), and (ix) professional forecasts. The average ranks given by manag-ers are listed in the first row of table 7.
190 Brookings Papers on Economic Activity, Fall 2015
Consistent with the narrative responses, two of the most highly ranked categories were personal shopping experience and media. In addition, these results highlight the particular importance of gasoline prices as a reference point to managers for making inferences about broader inflation movements: 76 percent of managers rank gasoline prices as very impor-tant or extremely important (rank of 4 or 5) to them in forming their infla-tion expectations. This is consistent with the argument of Coibion and Gorodnichenko (2015b) that households place a disproportionate amount of weight on oil or gasoline prices in forming their inflation expectations.
Table 7 also presents the average ranks assigned to categories by manag-ers who rated specific categories as very or extremely important to them, the average backcast errors and inflation forecasts for these groups of firms, and the correlation matrix of ranks given by respondents to different sources of information. These jointly yield several results. First, manag-ers who rated professional forecasters as very or extremely important to them had much more accurate perceptions and forecasts of inflation, on average, than other managers. They also tended to rely on media and on employees or colleagues more than others did. However, only 20 percent of managers rate professional forecasts as being this important. Second, as we found with the narrative questions, managers who rated media as very or extremely important also had more accurate information about infla-tion than others, on average. Approximately 54 percent of managers rated media as very or extremely important to them.
Third, and perhaps most strikingly, 88 percent of managers rated their personal shopping experience as very or extremely important. Even among those respondents who utilized professional forecasts and media reports extensively, the average ratings on personal shopping experience continue to be very high. This suggests that personal shopping experience is a more important source of information to most managers than might have been implied by the narrative approach, in which managers seem to generally report only their first source of information. Because shopping experiences are likely to be so heterogeneous across agents, both in the prices managers pay and the share of expenditures they allocate to different categories of goods, the systematic importance of an individual’s shopping experience suggests a very natural source for the wide variation that we observe in beliefs about inflation across managers.
IV.C. Do Managers’ Inflation Expectations Affect Their Decisions?
Does it make any difference to managers’ decisions whether they expect inflation to be 1 percent or 5 percent? One way to answer this would
KUMAR, AFROUZI, COIBION, and GORODNICHENKO 191
be to compare the decisions of different managers who hold different infla-tion expectations, but that approach would require us to be able to control for a wide array of factors relevant to each manager’s decision. Instead, we used hypothetical questions to investigate how managers would respond to changes in their expectations. In the fifth wave of the survey, we asked managers an open-ended question about how inflation expectations affect their decisions. They were asked:
How do you typically use your inflation expectations?
Managers gave four general types of answers, as summarized in table 8. Twelve percent of managers responded that inflation expectations mat-tered for their pricing decisions, 14 percent mentioned their wage-setting decisions, and 18 percent specified their investment decisions. Strikingly, two-thirds of managers reported that the primary use of their inflation expectations was for their own personal use, in terms of consumption and savings. Hence, similarly to how most managers relied on their personal experience as consumers to inform them about aggregate inflation devel-opments, we now find that managers report that the primary use of their inflation expectations is for their personal decisionmaking rather than for the economic decisions of the firm. This provides a novel justification for why managers’ inflation expectations resemble those of households in so many ways: their primary use is for their personal consumption and saving decisions.
Of course, the fact that managers respond to an open-ended question by saying that they use their inflation expectations mainly for their own
Table 8. Narrative Responses to How Managers Use Their Inflation Expectationsa
“How do you typically use your inflation expectations?”
Source: Authors’ survey of New Zealand firms.a. Narrative responses may be classified into several categories. For all columns, the values are
expressed as percentage points.
192 Brookings Papers on Economic Activity, Fall 2015
consumption and saving decisions, as did the majority of the respondents, does not imply that these managers do not use their inflation expectations at all for their business decisions, only that the latter are secondary to their use for personal decisions. In the third wave of the survey, we asked manag-ers more restrictive hypothetical questions, focusing separately on prices, wages, employment, and investment decisions:
If you thought overall prices in the economy over the next 12 months were going to rise by more than what you are currently forecasting, would you be more likely to [increase/decrease/no change] your [prices/employment/investment/wages]?
Only 25 percent of managers reported that higher inflation expectations would have no effect on any of their economic decisions, whereas 75 per-cent responded along at least one margin. Hence, most managers do report that changes in their inflation expectations would induce them to alter some of the economic choices made by their firm.
The responses for each individual variable are presented in table 9. Approximately 35 percent of firm managers report that they would charge higher prices, whereas between 25 percent and 30 percent of firms report that they would raise wages, employment, or investment. Almost no man-agers would decrease any of these variables. Table 9 also considers pairs of answers across variables. Few managers would adjust along more than one margin in these pairings: Just 13 percent of managers would raise prices and wages, 8 percent of managers would raise employment and wages, and 9 percent of managers would raise investment and employment. Instead, the majority of firms would pursue adjustment along a single margin, although the specific margin they choose is difficult to predict. The key result from this survey question is that most firm managers appear to treat their inflation expectations as one of the inputs into their decision process. This implies that if policymakers can change managers’ inflation expecta-tions, then one should expect some economic repercussions through pric-ing, wage, employment, and investment decisions to occur.
V. Results for the United States
While New Zealand presents a particularly interesting case study for inflation expectations given its long experience with inflation target-ing, one would like to know whether the characteristics documented in the previous section extend to other countries. In this section, we revisit whether the inflation expectations of the U.S. public also appear
KUMAR, AFROUZI, COIBION, and GORODNICHENKO 193
unanchored, and whether the U.S. public displays the same knowledge of monetary policy as firm managers in New Zealand. Because no broad quantitative survey of firm managers exists for the United States, we focus on the University of Michigan’s Survey of Consumers, the Fed-eral Reserve Bank of New York’s Survey of Consumer Expectations, and the Federal Reserve Bank of Philadelphia’s Survey of Professional
Table 9. How Managers Would Respond to Higher Inflation Expectations
Source: Authors’ survey of New Zealand firms.a. Reports shares of managers responding “increase,” “decrease,” or “no change” to the survey ques-
tion “If you thought overall prices in the economy over the next 12 months were going to rise by more than what you are currently forecasting, would you be more likely to [increase/decrease/no change] your [prices/employment/investment/wages]?”
b. Reports breakdown of how managers responded to the named pair of actions in the questions.
194 Brookings Papers on Economic Activity, Fall 2015
Forecasters; following Binder (2015), we use additional polling data as well when available.14
V.A. Are the U.S. Public’s Inflation Expectations Anchored?
First, we revisit the five predicted characteristics of anchored expecta-tions presented in section II that failed to be present in New Zealand. First, we examine whether average beliefs are close to the inflation target of the central bank. Table 10 shows that both short-term and long-term inflation expectations of households hover between 3.1 and 4.4 percent, well above the Federal Reserve’s 2 percent inflation target. In contrast, professional forecasters predict inflation to be close to the official target at all horizons. The actual rate of inflation over the 2013Q4–2014Q4 period was less than 2.4 percent. Strikingly, the magnitudes are similar to those predicted by New Zealand’s counterparts.15
Second, we explore whether economic agents in the United States dis-agree about the future course of inflation. We find that while the cross- sectional dispersion of projections made by professional forecasters is small (approximately 0.4 percentage point), the dispersion is an order of magnitude larger for households (approximately 4 percentage points at short horizons and somewhat smaller for longer horizons). Hence, along this metric as well, the U.S. public’s inflation expectations look no more anchored than those of the New Zealand public.
Third, we investigate how much confidence agents have in their fore-casts. The Survey of Consumer Expectations asks respondents to assign probabilities to 10 inflation bins. Using this information, we can calculate the implied standard deviation, a measure of forecast uncertainty. We find that although there is considerable heterogeneity across U.S. consumers, they are generally very uncertain in their predictions: The mean standard deviation is approximately 3 percentage points, which is comparable to
14. The polling data reported here were obtained from searches of the iPOLL Databank and other resources provided by the Roper Center for Public Opinion Research, University of Connecticut.
15. Neither the Michigan Survey of Consumers nor the Survey of Consumer Expecta-tions asks people to report current or past inflation. A poll by the Pew Research Center for the People and the Press asked the public about whether recent inflation data were closer to 1, 5, 10, or 20 percent. The most common answer, with 49 percent of responses, was “don’t know/refused to answer” and the mean response was 7.4 percent, well above the actual infla-tion rate of approximately 1 percent. (See Binder [2015] for more details.) Thus, similar to consumers in New Zealand, consumers in the United States appear to have a perception of inflation well above actual figures.
KUMAR, AFROUZI, COIBION, and GORODNICHENKO 195
the mean forecast of consumers; see the upper panel of figure 7. The lower panel of figure 7 also shows that, on average, consumers assign more than 50 percent probability to inflation in the United States being greater than 4 percent over the next 12 months and over the next three years.
Other survey evidence corroborates this result. For example, Binder (2015) compiles extensive poll evidence that consumers have little confi-dence in low and stable inflation. According to the Retirement Confidence Survey,16 in years 2012 and 2013, only 6 percent of respondents claimed to be very confident that inflation will remain moderate over the next
Table 10. Inflation Forecasts of Firm Managers and Others, United States, 2013Q4–2014Q4a
Sources: Economic Projections of Federal Reserve Board Members and Federal Reserve Bank Presi-dents, Survey of Professional Forecasters, Michigan Survey of Consumers, and Survey of Consumer Expectations.
a. Reports actual inflation, inflation forecasts of the Federal Reserve System, mean forecasts from sur-veys, and the cross-sectional standard deviations of these forecasts (columns 3–8). Standard deviations are expressed as percentage points, and all other values are expressed as percents.
b. Mean inflation forecast implied by distribution of respondents’ expectations about future inflation.c. The horizons of the long-term forecasts are 5 years for the Survey of Professional Forecasters and
the Michigan Survey of Consumers and 3 years for the Survey of Consumer Expectations. For the projec-tions of the central bank, we use “longer run” projections in the lower panel and the middle of the central tendency range for CPI for the next calendar year.
16. Conducted by the Employee Benefit Research Institute.
196 Brookings Papers on Economic Activity, Fall 2015
Figure 7. Uncertainty in Consumers’ Inflation Forecasts in the U.S.a
Source: Authors’ survey of New Zealand firms. a. The survey question asks managers to assign probabilities to nine bins. For each respondent, we construct a
measure of uncertainty as the standard deviation of the reported distribution.
Density
Average probability
Average probability assigned to inflation bins across consumers
Distribution of uncertainty across consumers
.10
.05
.15
.20
.05
.10
.15
.20
.25
0 1 2 3 4 5 6 7 8 9 10 11 12 13 14 15
Forecast uncertainty, percentage point
1 year ahead3 years ahead
<−12 −12–−8 −8–−4 −4–−2 −2–0 0–2 2–4 4–8 8–12 >12
Inflation bin, percents
1 year ahead3 years ahead
KUMAR, AFROUZI, COIBION, and GORODNICHENKO 197
10 years and will average no more than 4 percent in the next 10 years. At the same time, approximately 60 percent of respondents stated that they are either not at all confident or not too confident in these outcomes. In addition, Binder (2014) shows that confidence in forecasts as measured by the rounding of point predictions has shown little change since the mid-1980s. These patterns are similar to those observed in New Zealand.
Fourth, we consider the size of revisions in inflation forecasts. Figure 8 presents both 1-year-ahead and 3- or 5-years-ahead inflation forecasts. As was the case with consumers and firm managers in New Zealand, the aver-age absolute size of revisions is very large for U.S. consumers. Households frequently revise their inflation forecasts by as much as five percentage points or more. Binder (2015) shows that the share of Michigan Survey of Consumers respondents who revise their inflation forecasts has been between 70 and 80 percent since the early 1980s. In contrast, revisions in inflation forecasts for professional forecasters are much smaller and resem-ble what one would expect to see under anchored expectations, in sharp contrast to those of U.S. households.
Finally, we regress long-run inflation forecasts on short-term inflation forecasts. We do so both in levels (as with the New Zealand data) and using revisions in both short-run and long-run forecasts at the individual level, since this type of panel data is available for the United States in the Michigan Survey of Consumers, the Survey of Consumer Expectations, and the Survey of Professional Forecasters. As in New Zealand, in the United States long-term forecasts are highly sensitive to movements in short-term forecasts (table 11). This sensitivity remains large even after controlling for consumer fixed effects. Furthermore, controlling for outliers tends to yield even higher estimates of the sensitivity: A 1-percentage-point increase in the short-term inflation forecast can be associated with as much as a 1-percentage-point increase in the long-term inflation forecast. These sensitivities are broadly in line with the sensitivity estimated for manag-ers in New Zealand. On the other hand, the sensitivity is much weaker for professional forecasters.
V.B. What Does the U.S. Public Know about Monetary Policy?
Given the apparent lack of anchoring in the inflation expectations of the U.S. public, we would like to know to what extent this reflects short-ages in knowledge about monetary policy and recent inflation dynamics as opposed to a lack of credibility on the part of the Federal Reserve. As with New Zealand, we consider how well the public knows who chairs the Federal Reserve Board as a simple measure of how informed the public is
198 Brookings Papers on Economic Activity, Fall 2015
a. In each panel, shaded bars are for the distribution of revisions in long-term (3- or 5-years-ahead) inflation forecasts. Nonshaded bars are for the distribution of revisions in short-term (1-year-ahead) inflation forecasts.
Density
Michigan Survey of Consumers
Density
Survey of Consumer Expectations
Density
Survey of Professional Forecasters
.1
.2
−15 −10 −5 0 5 10 15
Revision of forecast
.1
.2
−15 −10 −5 0 5 10 15
Revision of forecast
.5
1
1.5
2
−15 −10 −5 0 5 10 15
Revision of forecast
1 year ahead5 years ahead
1 year ahead5 years ahead
1 year ahead3 years ahead
Figure 8. Forecast Revisions by U.S. Households and Professional Forecastersa
Tabl
e 11
. Co
rrel
atio
n be
twee
n Sh
ort-T
erm
and
Lon
g-Te
rm In
flatio
n Fo
reca
sts,
Uni
ted
Stat
esa
Lev
el3-
mon
th r
evis
ion
6-m
onth
rev
isio
n
OL
Sb
(1)
WG
Tc
(2)
RR
EG
d (3
)O
LS
b (4
)W
GT
c (5
)R
RE
Gd
(6)
OL
Sb
(7)
WG
Tc
(8)
RR
EG
d (9
)
Surv
ey o
f Con
sum
er E
xpec
tati
ons,
trun
cate
d sa
mpl
e, 3
-yea
rs-a
head
fore
cast
e,f
1-ye
ar-a
head
for
ecas
t0.
672*
**0.
671*
**0.
932*
**0.
477*
**0.
505*
**0.
681*
**0.
507*
**0.
557*
**0.
723*
**(0
.012
)(0
.017
)(0
.003
)(0
.026
)(0
.030
)(0
.005
)(0
.037
)(0
.043
)(0
.008
)N
o. o
f ob
serv
atio
ns17
,854
17,8
4917
,854
8,28
88,
288
8,28
83,
513
3,51
33,
513
R2
0.39
20.
371
0.87
90.
203
0.22
10.
664
0.21
10.
258
0.70
1
Surv
ey o
f Con
sum
er E
xpec
tati
ons,
full
sam
ple,
3-y
ears
-ahe
ad fo
reca
ste
1-ye
ar-a
head
for
ecas
t0.
562*
**0.
586*
**0.
984*
**0.
399*
**0.
412*
**0.
706*
**0.
386*
**0.
424*
**0.
857*
**(0
.022
)(0
.035
)(0
.001
)(0
.034
)(0
.049
)(0
.002
)(0
.046
)(0
.070
)(0
.003
)N
o. o
f ob
serv
atio
ns20
,573
20,5
6520
,573
10,0
3110
,030
10,0
314,
275
4,27
54,
275
R2
0.29
50.
299
0.98
40.
141
0.14
30.
944
0.13
50.
136
0.96
0
Surv
ey o
f Con
sum
er E
xpec
tati
ons,
impl
ied
poin
t pre
dict
ion,
3-y
ears
-ahe
ad fo
reca
stg
1-ye
ar-a
head
for
ecas
t0.
787*
**0.
783*
**0.
975*
**0.
643*
**0.
623*
**0.
815*
**0.
647*
**0.
662*
**0.
829*
**(0
.009
)(0
.014
)(0
.002
)(0
.019
)(0
.027
)(0
.005
)(0
.024
)(0
.034
)(0
.007
)N
o. o
f ob
serv
atio
ns20
,567
20,5
5920
,567
10,0
4710
,046
10,0
474,
285
4,28
54,
285
R2
0.57
10.
571
0.93
60.
350
0.33
90.
756
0.37
30.
402
0.78
1
Mic
higa
n Su
rvey
of C
onsu
mer
s, tr
unca
ted,
5-y
ears
-ahe
ad fo
reca
stf
1-ye
ar-a
head
for
ecas
t0.
442*
**0.
444*
**0.
420*
**0.
349*
**0.
355*
**0.
285*
**(0
.012
)(0
.014
)(0
.005
)(0
.027
)(0
.031
)(0
.011
)N
o. o
f ob
serv
atio
ns10
,443
10,3
2010
,443
2,37
12,
352
2,37
1R
20.
280
0.28
10.
428
0.15
90.
166
0.23
1
(con
tinu
ed o
n ne
xt p
age)
Tabl
e 11
. Co
rrel
atio
n be
twee
n Sh
ort-T
erm
and
Lon
g-Te
rm In
flatio
n Fo
reca
sts,
Uni
ted
Stat
esa
(Con
tinu
ed)
Lev
el3-
mon
th r
evis
ion
6-m
onth
rev
isio
n
OL
Sb
(1)
WG
Tc
(2)
RR
EG
d (3
)O
LS
b (4
)W
GT
c (5
)R
RE
Gd
(6)
OL
Sb
(7)
WG
Tc
(8)
RR
EG
d (9
)
Mic
higa
n Su
rvey
of C
onsu
mer
s, fu
ll s
ampl
e, 5
-yea
rs-a
head
fore
cast
1-ye
ar-a
head
for
ecas
t0.
442*
**0.
445*
**0.
411*
**0.
336*
**0.
350*
**0.
283*
**(0
.012
)(0
.013
)(0
.004
)(0
.026
)(0
.029
)(0
.009
)N
o. o
f ob
serv
atio
ns10
,588
10,4
6410
,588
2,44
02,
420
2,44
0R
20.
301
0.30
60.
470
0.17
10.
185
0.28
1
Surv
ey o
f Pro
fess
iona
l For
ecas
ters
, 5-y
ears
-ahe
ad fo
reca
st1-
year
-ahe
ad f
orec
ast
0.56
5***
0.59
8***
0.16
9***
0.14
6***
0.19
1***
0.16
3***
(0.0
35)
(0.0
28)
(0.0
34)
(0.0
29)
(0.0
35)
(0.0
32)
No.
of
obse
rvat
ions
286
286
244
244
238
238
R2
0.57
20.
619
0.10
50.
095
0.12
50.
097
Surv
ey o
f Pro
fess
iona
l For
ecas
ters
, 10-
year
s-ah
ead
fore
cast
1-ye
ar-a
head
for
ecas
t0.
474*
*0.
468*
*0.
057*
*0.
050*
*0.
056*
0.06
5**
(0.0
37)
(0.0
33)
(0.0
28)
(0.0
21)
(0.0
29)
(0.0
26)
No.
of
obse
rvat
ions
285
285
244
244
237
237
R2
0.39
80.
408
0.01
40.
024
0.01
20.
025
a. R
epor
ts r
esul
ts o
f re
gres
sing
lon
g-te
rm i
nflat
ion
fore
cast
s (o
r fo
reca
st r
evis
ions
) on
sho
rt-t
erm
infl
atio
n fo
reca
sts
(or
fore
cast
rev
isio
ns).
Sam
ple
peri
od c
over
s 20
13Q
–201
4Q4.
Sta
ndar
d er
rors
in
pare
nthe
ses
for
colu
mns
3,
6, a
nd 9
; ro
bust
sta
ndar
d er
rors
in
pare
nthe
ses
for
the
rem
aini
ng c
olum
ns.
Stat
istic
al s
igni
fican
ce a
t th
e **
*1 p
erce
nt, *
*5 p
erce
nt, a
nd *
10 p
erce
nt le
vels
.b.
Doe
s no
t use
sam
plin
g w
eigh
ts in
est
imat
ion.
c. U
ses
sam
plin
g w
eigh
ts in
est
imat
ion.
d. U
ses
Hub
er r
obus
t reg
ress
ion
to d
ownw
eigh
t the
impo
rtan
ce o
f ou
tlier
s an
d in
fluen
tial o
bser
vatio
ns.
e. U
ses
poin
t pre
dict
ions
rep
orte
d in
the
Surv
ey o
f C
onsu
mer
Exp
ecta
tions
.f.
Sam
ple
incl
udes
onl
y re
spon
dent
s re
port
ing
infla
tion
fore
cast
s le
ss th
an 1
5 pe
rcen
t in
abso
lute
val
ue.
g. U
ses
mea
n pr
edic
ted
infla
tion
impl
ied
by th
e re
port
ed p
roba
bilit
y di
stri
butio
n in
the
Surv
ey o
f C
onsu
mer
Exp
ecta
tions
.
KUMAR, AFROUZI, COIBION, and GORODNICHENKO 201
about recent monetary policy actions and discussions. Binder (2015) docu-ments that the public is largely unaware of who the chair of the Federal Reserve is. In a number of polls asking the public to pick the name of the chair from four options, between 20 and 50 percent of respondents sim-ply refuse to answer these multiple choice questions, while approximately one-third tend to pick the correct answer out of four names. The lowest share of correct answers in the September 2014 poll was for Janet Yellen (24 percent), but this was only 6 months after she became chair, which may explain her lower name recognition. These relatively low shares of correct answers are very close to those observed in the survey in New Zealand, suggesting a similar lack of awareness of the leadership of the central bank in both countries among much of the broader public.
Just as we found that the general managers of firms in New Zealand did not seek out information about monetary policy, we can explore whether the U.S. public tries to access information about monetary policy directly from the source through social media. Table 12 presents numbers of Face-book and Twitter followers for each of the Federal Reserve Banks as well as for the Federal Reserve System as a whole. As of June 30, 2015, the entire Federal Reserve System had 702,955 followers on Twitter. For com-parison, the U.S. State Department had nearly twice as many followers, the FBI had roughly 470,000 more, and the CIA had roughly 120,000 more. In fact, the voice of the entire Federal Reserve System on Twitter is single-handedly dwarfed by that of Paul Krugman, who has almost twice as many followers. Even former congressman Ron Paul and Senator Rand Paul each has almost as many followers as the entire Federal Reserve System. Binder (2015) documents similar evidence.
Data from Google Trends also allow us to verify the extent to which the U.S. public seeks out information about macroeconomic conditions online. Figure 9 plots the volume of online Google searches in the United States since 2004 for the macroeconomic variables “GDP,” “inflation,” and “unemployment rate” (relative to total searches). For comparison, we also plot the volume of searches for “puppies” (relative to total searches), which is roughly three to four times as high. Strikingly, with the onset of the Great Recession, there is only a slight increase in the volume of searches for macroeconomic variables, and it reverses in 2009. Binder (2015) finds a very similar pattern for an alternative but related set of searches.
But just as in New Zealand, the fact that much of the U.S. public does not actively seek out information about macroeconomic conditions or mon-etary policy does not mean that it necessarily views this information as unimportant. A poll from CNN and the Opinion Research Corporation in
202 Brookings Papers on Economic Activity, Fall 2015
2011 asked respondents to evaluate how important different issues would be to their vote in the 2012 presidential elections, and found that 68 percent of respondents rated inflation as extremely important or very important to them. This combined share of importance put inflation just below terrorism and taxes in importance to the public and above the war in Afghanistan, illegal immigration, guns, the situation in Libya at the time, abortion, and gay marriage (see figure 10), despite the fact that the president’s influence on inflation is much more limited than on any of these other issues. In a similar spirit, Binder (2015) shows that there has been an increasing trend in the share of people claiming that they are hurt by inflation.
A likely reason for the apparent lack of active interest in monetary policy may be the view that it is a difficult topic to understand. The his-tory of monetary policy communications is, of course, not one of openness
Table 12. Social Media Following of the Federal Reserve and Others, June 2015a
Institution or person with following Facebook “likes” Twitter followers
Federal Reserve — 268,258Federal Reserve Bank of Atlanta 1,854 33,932Federal Reserve Bank of Boston — 31,947Federal Reserve Bank of Chicago — 45,640Federal Reserve Bank of Cleveland 1,506 26,920Federal Reserve Bank of Dallas — 31,030Federal Reserve Bank of Kansas City — 14,385Federal Reserve Bank of Minneapolis 811 29,261Federal Reserve Bank of New York 7,787 86,991Federal Reserve Bank of Philadelphia 1,254 34,767Federal Reserve Bank of Richmond 432 20,895Federal Reserve Bank of St. Louis 4,416 49,411Federal Reserve Bank of San Francisco 3,736 29,518Total 21,796 702,955
U.S. Department of Energy 69,084 249,663U.S. Department of Homeland Security 320,261 663,009U.S. Department of Justice 183,507 880,396U.S. Department of State 1,103,944 1,408,592U.S. Department of the Treasury 41,613 275,636Total 1,718,409 3,477,296
CIA 440,716 818,493FBI 1,235,614 1,170,177Paul Krugman — 1,374,547Ron Paul 1,287,106 549,344Rand Paul 2,024,694 637,037
a. Facebook and Twitter pages were accessed on June 30, 2015.
Figure 9. U.S. Google Searches for Macroeconomic Variables vs. “Puppies,” January 2004–July 2015
Source: Google Trends, accessed July 12, 2015. a. Volume of online Google searches, relative to the highest point on the graph (normalized to 1).b. The two search terms are “puppy” and “puppies.” The search volumes are aggregated together. c. The three macroeconomic variable search terms are “GDP,” “inflation,” and “unemployment rate.” The
search volumes are aggregated together.
0.2
0.4
0.6
0.8
Search volumea
2006 2008 2010 2012 2014
Searches for macroeconomic variablesc
Searches for “puppy(-ies)”b
Figure 10. Relative Importance of Inflation as an Issue to the U.S. Public, 2011a
Source: June 2011 CNN and Opinion Research Corporation Poll.a. The poll question asked, “How important will each of the following issues be to your vote for President next
year (2012)?” Values are expressed as percents.
20 40 60 80
Unemployment 45 42
Health care 45 41
Medicare 37 42
Gas prices 43 36
Federal budget deficit 44 35
Taxes 37 40
Terrorism 42 33
Inflation 35 33
Afghanistan 27 36
Illegal immigration 29 33
Gun policy 21 27
Situation in Libya 17 26
Abortion 20 23
Gay marriage
Extremely importantVery important
17 17
204 Brookings Papers on Economic Activity, Fall 2015
with the public. While central banks like the Federal Reserve have over the last two decades become increasingly communicative with the public, this increase in communication might not necessarily have helped matters much for the general public. Rubén Hernández-Murillo and Hannah Shell (2014), for example, analyze the complexity of Federal Open Market Com-mittee (FOMC) statements since the early 1990s and find that the length and reading level associated with these statements has increased signifi-cantly over time. For example, in the mid-1990s, a typical FOMC state-ment was approximately 100 words long and required a 12th-grade reading level to understand. By 2014, the length of the statement was six times as long and the reading level was effectively that of a Ph.D.
Not surprisingly, when members of the U.S. public are asked how well they understand monetary policy, they tend to express hesitation. In a July 2014 poll, the Associated Press asked respondents to indicate how easy or hard they felt it was to understand Federal Reserve policy on interest rates. While 27 percent of respondents claimed it was very easy or somewhat easy, 70 percent expressed difficulty understanding monetary policy, and a quarter of respondents said it was “very hard.” Binder (2015) presents additional evidence documenting the complexity of the Federal Reserve’s communication. In short, despite dramatic changes in the communications strategy of the Federal Reserve over the last 20 years, the U.S. general pub-lic appears to remain profoundly uncertain about what exactly the Federal Reserve does.
VI. Conclusion
After 25 years of largely successful inflation targeting in New Zealand, the inflation expectations of households and managers there do not appear particularly well anchored. Managers of firms disagree dramatically about recent and future inflation levels, even at long horizons, and many are poorly informed about the RBNZ’s inflation target. Most managers appear to rely to a large extent on their personal shopping experience to make inferences about aggregate inflation, and they are particularly sensitive to gasoline prices, as is the case with households in the United States. Indeed, along most metrics, the expectations of managers are much more similar to the expectations of households than to those of professional forecasters. Since neither group appears to be well informed about monetary policy overall, this suggests that changes over the last 20 years in central banks’ communications strategies have not had the desired effects on this seg-ment of the population, even if they may have been more effective with
KUMAR, AFROUZI, COIBION, and GORODNICHENKO 205
professionals or financial market participants. In short, while this state of affairs may be better than what New Zealand had before adopting infla-tion targeting (we do not have data on inflation expectations covering that period), in absolute terms the properties of inflation expectations and per-ceptions of inflation appear to score poorly along the basic metrics of how anchored expectations are.
The lack of awareness by the general public, including firm managers, of the actions and objectives of monetary policymakers in a low-inflation environment is particularly problematic in periods when central bank-ers are seeking to affect inflation expectations through forward guidance. Because such policies are designed to have real effects precisely by gen-erating changes in agents’ inflation expectations and therefore in their per-ceived real interest rates, the fact that the public may largely be unaware of the policies or of their implications for aggregate prices implies that their effects will most likely be limited, or at least much less than predicted by models with full-information rational-expectations agents. At least some central bankers are aware of the limited power of their promises.17
Coming to terms with these limited, heterogeneous information sets on the part of households and firms, not just regarding knowledge of contem-poraneous economic conditions but also regarding knowledge of the cen-tral bank’s objectives, will be challenging from a modeling point of view. For example, Coibion and Gorodnichenko (2011) show that the strategic interaction of firms with different practices for pricing and acquisition of information has important implications for macroeconomic dynamics and policy design. However, this and related research abstract from heteroge-neity and the interaction of expectations across firms, households, profes-sional forecasters, financial markets, and the central bank. Indeed, most macroeconomic models do not include financial markets or professional forecasters, so exactly how these arguably better-informed agents influence macroeconomic outcomes is not well understood.
Future work should shed new light on the optimal way for central banks to release information so it is useful for not just professional forecasters and financial market analysts but also the broader public. Only then may inflation targeting finally achieve its full promise.
17. Laurence Meyer (2004, p. 211) notes, “Greenspan believes that inflation expectations can best be anchored by a history of having achieved price stability rather than by a mere promise to do so.”
206 Brookings Papers on Economic Activity, Fall 2015
ACKNOWLEDGMENTS We are grateful to Rochelle Barrow, Graham Howard, and Katrina Young for sharing data from the survey of households in New Zealand. We thank Alan Blinder, Lars Svensson, and the editors for com-ments on an earlier version of the paper. Gorodnichenko thanks the National Science Foundation for financial support.
KUMAR, AFROUZI, COIBION, and GORODNICHENKO 207
References
Alvarez, Fernando E., Francesco Lippi, and Luigi Paciello. 2011. “Optimal Price Setting with Observation and Menu Costs.” Quarterly Journal of Economics 126, no. 4: 1909–60.
Andrade, Philippe, and Hervé Le Bihan. 2013. “Inattentive Professional Fore-casters.” Journal of Monetary Economics 60, no. 8: 967–82.
Ball, Laurence, and Sandeep Mazumder. 2014. “A Phillips Curve with Anchored Expectations and Short-Term Unemployment.” Working Paper no. 20715. Cambridge, Mass.: National Bureau of Economic Research.
Bernanke, Ben S. 2013. “Communication and Monetary Policy.” Speech at the National Economists Club Annual Dinner, Herbert Stein Memorial Lecture, November 19. Washington. http://www.federalreserve.gov/newsevents/speech/bernanke20131119a.htm
Binder, Carola. 2014. “Measuring Uncertainty Based on Rounding: New Method and Application to Inflation Expectations.” Working Paper. https://sites.google.com/site/carolabindereconomics/research
———. 2015. “Fed Speak on Main Street.” Working Paper. https://sites.google.com/ site/carolabindereconomics/research
Blinder, Alan S., Elie R. D. Canetti, David E. Lebow, and Jeremy B. Rudd. 1998. Asking About Prices: A New Approach to Understanding Price Stickiness. New York: Russell Sage Foundation.
Blinder, Alan S., Michael Ehrmann, Marcel Fratzscher, Jakob De Haan, and David-Jan Jansen. 2008. “Central Bank Communication and Monetary Policy: A Survey of Theory and Evidence.” Journal of Economic Literature 46, no. 4: 910–45.
Carroll, Christopher D. 2003. “Macroeconomic Expectations of Households and Professional Forecasters.” Quarterly Journal of Economics 118, no. 1: 269–98.
Coibion, Olivier, and Yuriy Gorodnichenko. 2011. “Strategic Interaction among Heterogeneous Price-Setters in an Estimated DSGE Model.” Review of Eco-nomics and Statistics 93, no. 3: 920–40.
———. 2012. “What Can Survey Forecasts Tell Us about Informational Rigidi-ties?” Journal of Political Economy 120, no. 1: 116–59.
———. 2015a. “Information Rigidity and the Expectations Formation Process: A Simple Framework and New Facts.” American Economic Review 105, no. 8: 2644–78.
———. 2015b. “Is the Phillips Curve Alive and Well After All? Inflation Expec-tations and the Missing Disinflation.” American Economic Journal: Macro-economics 7, no. 1: 197–232.
Coibion, Olivier, Yuriy Gorodnichenko, and Saten Kumar. 2015. “How Do Firms Form Their Expectations? New Survey Evidence.” Working Paper no. 21092. Cambridge, Mass.: National Bureau of Economic Research.
Gorodnichenko, Yuriy. 2008. “Endogenous Information, Menu Costs and Inflation Persistence.” Working Paper no. 14184. Cambridge, Mass.: National Bureau of Economic Research.
208 Brookings Papers on Economic Activity, Fall 2015
Hernández-Murillo, Rubén, and Hannah G. Shell. 2014. “The Rising Complexity of the FOMC Statement.” Economic Synopses, no. 23.
Lucas, Robert E., Jr. 1972. “Expectations and the Neutrality of Money.” Journal of Economic Theory 4, no. 2: 103–24.
Mackowiak, Bartosz, and Mirko Wiederholt. 2009. “Optimal Sticky Prices under Rational Inattention.” American Economic Review 99, no. 3: 769–803.
Mankiw, N. Gregory, and Ricardo Reis. 2002. “Sticky Information versus Sticky Prices: A Proposal to Replace the New Keynesian Phillips Curve.” Quarterly Journal of Economics 117, no. 4: 1295–328.
Mankiw, N. Gregory, Ricardo Reis, and Justin Wolfers. 2004. “Disagreement about Inflation Expectations.” NBER Macroeconomics Annual 18: 209–48.
Meyer, Laurence H. 2004. A Term at the Fed: An Insider’s View. New York: Harper-Collins.
Sims, Christopher A. 2003. “Implications of Rational Inattention.” Journal of Monetary Economics 50, no. 3: 665–90.
Solow, Robert M. 1979. “What We Know and Don’t Know about Inflation.” Tech-nology Review 81, no. 3: 30–47.
Svensson, Lars E. O. 2015. “Forward Guidance.” International Journal of Central Banking 11, suppl. 1: 19–64.
Woodford, Michael. 2003. “Imperfect Common Knowledge and the Effects of Monetary Policy.” In Knowledge, Information, and Expectations in Modern Macroeconomics: In Honor of Edmund Phelps, edited by Philippe Aghion, Roman Frydman, Joseph Stiglitz, and Michael Woodford. Princeton University Press.
209
Comments and Discussion
COMMENT BYALAN S. BLINDER To begin with, I like this paper a lot—not because of a burning desire to learn about (mostly small) business managers in New Zealand, but because there are many reasons to believe, both in this paper and in Carola Binder’s work, that the findings can be generalized. Saten Kumar, Hassan Afrouzi, Olivier Coibion, and Yuriy Gorodnichenko’s work here has the strong ring of truth.
I find the paper valuable for three main reasons. First, it reminds us that most people are not obsessed about the central bank; as the authors note, they would rather watch puppies on YouTube. Second, it shows that expectations of inflation vary greatly across individuals, which raises the question of what the symbol E(p) means in macro models. Third, as their title indicates, it shows that inflationary expectations are not well anchored in New Zealand, despite apparently good reasons why they should be. I will take up these three reasons in turn.
One way to state the paper’s central finding is that small business man-agers in New Zealand think like ordinary people, not like the tiny minority of the human race (including virtually all of us who participate in Brook-ings Panel events) that obsesses over the central bank. The authors show that small firm managers resemble households in New Zealand much more than they do professional forecasters. I am sure that is true in the United States and elsewhere, too.
Almost all business managers and households have more important things to do—in their own view—than think about the Reserve Bank of New Zealand (RBNZ) or the Federal Reserve. This relative ignorance about monetary policy could be a case of rational inattention because the covariance between the firm’s optimal relative price and the overall price level is small, as Christopher Sims (2003) discusses. Or it could be a
210 Brookings Papers on Economic Activity, Fall 2015
case of irrational inattention, that is, of people simply caring more about “OPP” (other people’s puppies) than about the macroeconomic environ-ment in which they are doing business. For current purposes, it does not much matter which explanation dominates—though I am inclined toward the latter.
Looking for a shred of good news about the importance of inflationary expectations, the authors report that 35 percent of their respondents say they would be “more likely to increase prices” if they “thought overall prices in the economy over the next 12 months were going to rise by more than what you are currently forecasting.” But is 35 percent good news? Does it mean overall inflation is irrelevant to 65 percent of firms?
The paper’s second big message is that inflationary expectations vary a lot, both cross-sectionally and over time. In both of these respects, business managers differ dramatically from professional forecasters, who do dote on the central bank. (See, for example, the authors’ dramatic figure 8.)
One particular aspect of this disjuncture bears emphasis: In this sample, as well as in other evidence, ordinary citizens systematically overestimate inflation. It is not at all surprising that inflationary expectations are wide of the mark, nor that they vary hugely across individuals. But why peo-ple’s expectations are systematically too high, virtually always, is a bit of a mystery—and a good question for subsequent research. There is a terribly important lesson here, for all of us in this profession and, I would guess, for all readers of the Brookings Papers: Do not generalize from yourself; you are not the representative agent.
The authors’ third lesson is that ordinary people’s expectations of infla-tion are not anchored, even though experts’ expectations are. And this is so even though the RBNZ apparently enjoys great credibility. This finding is a head-scratcher until one looks at the inflation history of New Zealand during the inflation-targeting era. After hovering near 2 percent early in the period, inflation fell to roughly 1 percent, then zoomed up to 4 percent, and thereafter bounced around in the 1.5–5 percent range before recently dropping to about 0. That behavior does not look very “anchored” to me. So why should people’s expectations be anchored?
Anchoring, of course, brings up the topic of inflation targeting as a way to conduct monetary policy. To my mind, there are three main arguments for adopting inflation targeting. First, it constrains discretion, as many, including Ben Bernanke and others (1999), argued years ago. I guess that is true, although Mervyn King, as governor of the Bank of England, wrote many letters explaining why the central bank’s discretion should not be so constrained. Second, inflation targeting allegedly enhances transparency.
COMMENTS and DISCUSSION 211
Yes, posting a numerical inflation target is a step forward. But over the years I have noticed that many central banks talk like “inflation nutters” while acting like they have a dual mandate. Is that being transparent?
The third argument for inflation targeting is the focus of this paper: It should anchor inflationary expectations. But anchored expectations are actually a mixed blessing. It is clearly a good thing when the central bank wants to adopt highly expansionary monetary policies. But, as the authors point out, it may not be such a good thing when the central bank is trying to reduce the ex ante real interest rate by raising E(p).
In any case, the central message of this paper is that inflation targeting in New Zealand has anchored some people’s expectations (mainly experts’) but not others’ (almost the entire population). Which brings us back to the meaning of the variable E(p) in macro models. Whose expectations are these? The answer, as hardly any macro models recognize, is this: They are many people’s—and they differ.
So, for example, the expectations of monetary policy experts—a group that includes professional forecasters, bond traders, and a few economists— profoundly influence nominal and real interest rates. This may be the only place in the paper where I disagree with the authors. They write in their concluding section:
The lack of awareness by the general public, including firm managers, of the actions and objectives of monetary policymakers in a low-inflation environment is particularly problematic in periods when central bankers are seeking to affect inflation expectations through forward guidance.
Well, no, it is not so problematic. It is bond traders who make bond prices, and flattening the yield curve is the usual goal of forward guidance. These folks, the abnormal minority, pay rapt attention to every word uttered by the central bank.
The inattention problem lies elsewhere. For example, the paper shows that (mostly small) business managers—who set their nominal, and hence relative, prices—pay scant attention to central bank policy. One may safely assume, I think, that workers bargaining over nominal, and hence real, wages dote even less on the central bank. Finally, consumers, whose spending, macro models assume, depends on the ex ante real interest rate, probably know more about puppies than about the central bank’s inflation target—or about monetary policy in general. As indicated earlier, this in - attention could be rational or irrational. Either way, it is inattention.
I close with a heresy. Maybe inflationary expectations are not quite as important as modern macroeconomics makes them out to be. I do not mean
212 Brookings Papers on Economic Activity, Fall 2015
to imply that expected inflation is irrelevant; that is way too heretical and almost certainly wrong. But maybe, for example, lagged inflation is as important—in a Phillips curve, say—as expected inflation.1 At least lagged inflation is, for one period, anchored.
REFERENCES FOR THE BLINDER COMMENT
Bernanke, Ben S., Thomas Laubach, Frederic S. Mishkin, and Adam S. Posen. 1999. Inflation Targeting: Lessons from the International Experience. Princeton University Press.
Roberts, John M. 2005. “How Well Does the New Keynesian Sticky-Price Model Fit the Data?” B.E. Journal of Macroeconomics: Contributions to Macroeconomics 5, no. 1: Article 10.
Sims, Christopher A. 2003. “Implications of Rational Inattention.” Journal of Mon-etary Economics 50, no. 3: 665–90.
COMMENT BYLARS E. O. SVENSSON This paper by Saten Kumar, Hassan Afrouzi, Olivier Coibion, and Yuriy Gorodnichenko discusses the results of a recent (2013–15) survey about inflation expectations and knowledge of monetary policy among managers of New Zealand firms. The main results are that the average inflation forecasts are higher than both actual inflation and the inflation target for both short and long horizons; that the average perception of recent inflation is higher than actual inflation; that there are large dis-agreements about forecasts and recent inflation; that the firms express more uncertainty than professional forecasters; that the firms have little knowl-edge about monetary policy; and that along these metrics the firms are more similar to households than to professional forecasters. The authors summarize their main conclusion in the title of the paper, “Inflation Targeting Does Not Anchor Inflation Expectations,” and in the statement “Our results are not favorable to policymakers.”
My first comment is, “Compared with what?” In order to draw these conclusions from the authors’ survey, one would like to have not an essentially one-time survey but a time series of survey results, ideally over a sample period including years both before and after inflation
1. For evidence, see Roberts (2005).
COMMENTS and DISCUSSION 213
targeting was introduced in New Zealand. One would also like to com-pare results with other related surveys in New Zealand and with similar surveys in other economies that use inflation targeting. Only then could one more firmly judge whether inflation targeting stabilizes and anchors inflation expectations.
Second, I miss some policy conclusions. Suppose the results are true. Should the authorities, in particular the Reserve Bank of New Zealand (RBNZ), do something about them, and if so, what?
Regarding my first comment, as the authors note, in New Zealand there is another related survey, namely the RBNZ Survey of Expecta-tions, which surveys a sample of economists, businesses, and industry leaders.1 It is quarterly and starts in 1987. The authors make light of this survey, stating that its sample is very small, that the firms involved are typically very large, and that the sample is not random but largely convenience-based.
My figure 1 shows the annual CPI inflation rate in New Zealand, a 5-year (trailing) moving average of the inflation rate, and the midpoint of the target range. The target range was 0 to 2 percent from the beginning, changed to 0 to 3 percent in December 1996, and changed again to 1 to 3 percent in September 2002, shifting the target midpoint accordingly. We see that the inflation rate has fluctuated quite a bit, but that from the late 1990s the 5-year moving average has been either close to or somewhat above the target midpoint.
My figure 2 in addition shows the results of the RBNZ Survey of Expec-tations of the annual inflation rate 1 and 2 years ahead, respectively, with corresponding 5-year moving averages. We see that the inflation expecta-tions are clearly influenced by the current inflation rate but vary less, and the 2-years-ahead inflation expectations are more stable than 1-year-ahead expectations.
In particular, the 5-year moving averages of inflation expectations are close to the 5-year moving averages of actual inflation. The respondents in the RBNZ survey seem to have, on average, fairly unbiased and therefore fairly realistic inflation expectations. The 5-year moving averages of the inflation expectations thus exceed the midpoint of the inflation target range as much as the 5-year moving average of the actual inflation rate does, rather than being anchored on the midpoint of the target range.
1. Information about the RBNZ’s “M14 Survey of Expectations” can be found at http://www.rbnz.govt.nz/statistics/m14.
214 Brookings Papers on Economic Activity, Fall 2015
0
1992 1996 2000 2004Year
2008 2012
1
2
3
4
5
6
7
Source: Datastream.
Percent, year-over-year
CPI
CPI, 5-year moving average
Inflation target, midpoint
Figure 1. Inflation and Inflation Target, New Zealand, 1990–2014
0
1992 1996 2000 2004Year
2008 2012
1
2
3
4
5
6
7
Sources: Datastream, RBNZ Survey of Expectations. a. For each series, the dotted line represents a 5-year moving average.
Percent, year-over-year
Expectation, 1 yr. ahead
Expectation, 2 yrs. ahead CPI
Inflation target, midpoint
Figure 2. Inflation, Inflation Expectations, and Inflation Target, New Zealand, 1990–2014a
COMMENTS and DISCUSSION 215
It would have been desirable to have some comparison of the authors’ surveys and the RBNZ surveys and a discussion of why they give such dif-ferent impressions.
In Sweden, where the central bank, the Riksbank, announced in 1993 that an inflation target of 2 percent for the annual CPI inflation rate would apply from 1995 onward, there are several surveys of inflation expecta-tions. One survey is the so-called Prospera Survey, commissioned by the Riksbank and conducted by TNS Sifo Prospera, which surveys the expecta-tions of the annual CPI inflation rate 1, 2, and 5 years ahead among a panel of labor market organizations (trade unions and employers’ associations), purchase managers, and money-market participants.2 It began in 1995, has been done quarterly from 1996, and has been done monthly for money-market participants from 2009.
My figure 3 shows Sweden’s annual CPI inflation rate, its 5-year mov-ing average, and its average from 1995 up to each date. One can see that the CPI inflation rate has on average fallen substantially below the inflation target; in particular, the average inflation rate during the period 1995–2014 is only 1.2 percent, a full 0.8 percentage point below the target. The figure also shows the Prospera inflation expectations 1 and 2 years ahead and their corresponding 5-year moving averages.3
One can see that the inflation expectations are influenced by the cur-rent inflation rate and that the 2-years-ahead expectations are more stable than the 1-year-ahead ones. However, in contrast to the RBNZ Survey of Expectations, the moving averages are close to the inflation target rather than the moving average of actual inflation. Thus, the Prospera inflation expectations seem relatively strongly anchored on the inflation target, in spite of actual inflation falling substantially below the target.
In Sweden there are two other relevant surveys, the Business Ten-dency Survey and the Consumer Tendency Survey, both conducted by the National Institute of Economic Research (NIER), a public authority under the Swedish Ministry of Finance.4 The Business Tendency Survey
2. Information about the TNS Sifo Prospera’s “Inflation Expectations” survey can be found at http://www.prospera.se/inflation-expectations.
3. In my previous work (Svensson 2011, 2015b), I discuss the reasons for and conse-quences of the systematic undershooting of the inflation target; Svensson (2015a) includes a comparison of the monetary policies of the RBNZ and the Riksbank.
4. Information about the NIER’s “Economic Tendency Survey” can be found at http://konj.se/english/publications/economic-tendency-survey.html.
216 Brookings Papers on Economic Activity, Fall 2015
is a large survey of firms in a set of relevant industries, with a sample of 6,500 firms, making up about 75 percent of employment in the total popu-lation of firms with activities in the relevant industries (including 100 per-cent of firms with 100 or more employees). The response rate is between 50 and 70 percent, depending on the industry. The survey is quarterly and started in 1987. The Consumer Tendency Survey uses a sample of about 1,500 households, is monthly, and started in 2002. Both surveys ask a num-ber of different questions, including the respondent’s expectation of the annual CPI inflation rate 1 year ahead.
My figure 4 shows the actual CPI inflation rate and the NIER surveys of firms’ and households’ expectations of inflation 1 year ahead. One can see that households’ inflation expectations are on average close to the inflation target and above actual inflation. In contrast, firms’ inflation expectations are on average below the target and close to average actual inflation. Thus, both Prospera and households’ inflation expectations are more anchored on
1997 2001 2005Year
2009 2013
Sources: Statistics Sweden, TNS Sifo Prospera. a. For each series, the dotted line represents a 5-year moving average. b. Cumulative average of the CPI from 1995 onward.
Percent, year-over-year
Expectation, 1 yr. ahead
Expectation, 2 yrs. ahead
CPI
Inflation target
CPI, averageb–1
0
1
2
3
4
5
Figure 3. Inflation, Inflation Expectations, and Inflation Target, Sweden, 1995–2014a
COMMENTS and DISCUSSION 217
the inflation target and consequently biased and not rational. Firms’ inflation expectations are not anchored on the inflation target but are more unbiased and rational.5
For the United States, the authors refer to the Michigan Survey of Con-sumers and the New York Fed Survey of Consumer Expectations. They argue that they find all the same patterns in inflation expectations as they
1997 2001 2005Year
2009 2013
Sources: Statistics Sweden, National Institute of Economic Research.
Percent, year-over-year
Expectation, firms, 1 yr. ahead
Expectation, households, 1 yr. ahead
CPI
Inflation target
–1
0
1
2
3
4
Figure 4. Inflation, Inflation Expectations, and Inflation Target, Sweden, 1995–2015
5. As I discussed in earlier work (Svensson 2015b), there are at least three observations that together indicate that inflation expectations in line with the target are more important than the NIER firms’ inflation expectations in affecting wage setting in Sweden: (i) statements from the Swedish Trade Union Confederation and the Industrial Trade Unions, (ii) the fact that the TNS Sifo Prospera Survey reports inflation expectations of labor market organiza-tions (both for employees and employers) similar to the expectations of all interviewees reported in my figure 2 (and thus close to the inflation target), and (iii) the importance of central wage negotiations over wage drift for wage setting after the introduction of the Indus-trial Cooperation and Negotiation Agreement in 1997. As I further discussed in Svensson (2015b), when nominal wages are negotiated and set under the expectation of an inflation rate equal to the 2 percent target, in spite of the average inflation rate falling significantly below 2 percent, the result is higher real wages than anticipated. This in turn leads to higher average unemployment than if inflation had on average been equal to the target. The aver-age excess unemployment rate is estimated to be as large as 0.8 percentage point during 1997–2011, with a 95 percent confidence interval from 0.55 to 1.5 percentage points.
218 Brookings Papers on Economic Activity, Fall 2015
previously documented for managers of firms (as well as households) in New Zealand and conclude that expectations in the United States, there-fore, appear just as unanchored as they do in New Zealand.
However, Michael Bryan, Brent Meyer, and Nicholas Parker (2015a) report results from the Federal Reserve Bank of Atlanta’s Business Infla-tion Expectations Survey, a large monthly survey of businesses compiled by the Federal Reserve Bank of Atlanta since October 2011. Among other things, they document that, in the aggregate, firms’ inflation expectations are very similar to the predictions of professional forecasters for national inflation statistics, despite a somewhat greater heterogeneity of expecta-tions that they attribute to the idiosyncratic cost structure firms face. Bryan, Meyer, and Parker (2015a) also show that firms’ inflation expectations bear little in common with the “prices in general” expectations reported by households. They additionally show that, during their 3-year sample, firms’ inflation expectations appear to be unbiased predictors of their year-ahead observed (perceived) inflation. In a blog post shortly after Kumar, Afrouzi, Coibion, and Gorodnichenko presented their paper at Brookings, Bryan, Meyer, and Parker (2015b) suggest that their own research indicates that the authors’ results are due to poorly phrased questions and that there is strong evidence that their respondents either did not understand the questions about “prices in general” or were misinterpreting them, as compared to questions about “inflation.”
In summary, other surveys in New Zealand, Sweden, and the United States indicate better anchoring of inflation expectations on the inflation target or on average actual inflation. The reasons for these discrepancies are not well understood, and the precise formulation of survey questions appears to matter. The authors’ strong conclusions from a one-off survey, including any policy conclusions, therefore seem premature.
REFERENCES FOR THE SVENSSON COMMENT
Bryan, Michael F., Brent H. Meyer, and Nicholas B. Parker. 2015a. “The Infla-tion Expectations of Firms: What Do They Look Like, Are They Accurate, and Do They Matter?” Working Paper no. 2014-27a. Federal Reserve Bank of Atlanta.
———. 2015b. “What Do U.S. Businesses Know That New Zealand Businesses Don’t? A Lot (Apparently).” macroblog, September 21. Federal Reserve Bank of Atlanta.
Svensson, Lars E. O. 2011. “Practical Monetary Policy: Examples from Sweden and the United States.” Brookings Papers on Economic Activity, Fall: 289–332.
COMMENTS and DISCUSSION 219
———. 2015a. “Forward Guidance.” International Journal of Central Banking 11, suppl. 1: 19–64.
———. 2015b. “The Possible Unemployment Cost of Average Inflation below a Credible Target.” American Economic Journal: Macroeconomics 7, no. 1: 258–96.
GENERAL DISCUSSION William Brainard opened the discussion by remarking that he enjoyed the paper by Saten Kumar, Hassan Afrouzi, Olivier Coibion, and Yuriy Gorodnichenko in part because it confirmed much of what he had been persuaded of by earlier work. He mentioned Truman Bewley, who sampled more than 500 firms and found that none of them indicated ever paying attention to the Federal Reserve’s targeting in determining their own pricing. Brainard had heard the same in talk-ing with businessmen. However, it did strike him as surprising that this paper included a significant number of financial services firms, which he had always thought paid great attention to what was going to happen to the bond prices and the stock market and, one would assume, therefore listened to what the Federal Reserve was announcing. Did the authors find that knowledge of the Reserve Bank of New Zealand behavior was stronger at least in that financial services subsample?
Brainard also wondered whether the authors’ survey also asked firms about their price setting and inflation expectations specifically regarding the cost of the materials that they buy. After all, most of the firms that set actual prices that later show up in the CPI are producing only a tiny part of it, and many others produce intermediate products that are not aver-aged into the CPI at all. Overall, though, it was not surprising to him that many people do not think about the connections between their personal shopping experience, their own firm’s pricing, and a third thing that they are not directly involved in, which is the bundle of goods that make up the CPI.
Ben Friedman said he liked the paper for the same reasons discussant Alan Blinder outlined. He thought it was a refreshing antidote to the usual narcissism of people in the economics profession who do not recognize that everybody else finds reading Federal Open Market Committee state-ments much less interesting than reading the sports pages or crime thrillers. He thought the key question, which discussant Lars Svensson also raised, was this: What is the policy implication? The paper did not say much about that, yet in the United States it is clearly very important, following the paper’s own argument.
220 Brookings Papers on Economic Activity, Fall 2015
Here in the United States, Friedman reminded everyone, the debate over what the inflation target ought to be remains unsettled. As one argu-ment runs, if 2 percent seemed right 10 years ago, the experience of the post-crisis period would surely indicate the optimal number should be higher. A standard rebuttal to that argument has been that one would of course set a higher number if we were redesigning the system from scratch, but because the public is so focused on the 2 percent number already promoted, raising it—even to 2.5 percent—would undermine the Federal Reserve System’s credibility. He felt the evidence from this paper refutes that line of thinking, since it shows that only a small segment of the public pays attention to the Federal Reserve at all. Clearly, a large part of the population would not be bothered one way or the other by a change in the inflation target. The paper’s finding, he said, is therefore a valuable contribution to policy thinking.
Having attended the NBER Summer Institute the previous summer, where Governor Kuroda from the Bank of Japan spoke, Martin Feldstein reported that Kuroda had been pleased with household surveys showing that their inflation expectation centered around 2 percent. To Kuroda this indicated his policies were working, notwithstanding that the distribu-tion of responses was quite flat, ranging all the way from -10 percent to +15 percent. Feldstein recalled a Michigan survey some years earlier that also found a very wide dispersion of expected inflation rates. And yet, the Federal Reserve always reports that inflation expectations are well anchored. Although he understood Friedman’s point about the public not knowing whether the Federal Reserve was targeting 3 percent instead of 2 percent, Feldstein believed that whenever it raised its inflation target there would still be a headline that people would notice, and although they might not understand what it meant, it would be perceived as an event. In light of all that, he wondered what economists should think about the fact that mean expectations are so close to the target, and that at the same time the distribution is so very wide. What are the implications of that for policy and also for the dynamics of the expectations process itself?
Annamaria Lusardi echoed Blinder’s point that the paper was very consistent with the household survey, though she also felt the word “manager” should not mislead one to think that the authors’ survey of businesses tapped a very different population from households, since it seemed to survey small firms. And she noted that there is a lot of evidence that the population as a whole is financially illiterate when it comes to inflation and the consequences of inflation, and she was somewhat dis-appointed that the paper did not look into the effects of that ignorance.
COMMENTS and DISCUSSION 221
In this regard, she disagreed with Blinder that the implication was that it does not matter if people do not understand inflation, since that has implications for how people run businesses, how they set prices and wages, and how they borrow in the market. If other waves of surveys can be run to document these behaviors it would enable us to know whether inflation expectations really do matter, or not.
She appreciated the comparisons with the United States’ experience, but noted that New Zealand was the pioneer in targeting inflation, starting in 1990. If after 25 years people there still have not adjusted to that policy, this causes one to wonder what has been happening in other countries that have chosen an inflation target. She seemed to recall that in his research, Frederic Mishkin found that New Zealand had a policy of firing the central banker if he did not meet the targets, and if that is correct then it implies tremendous weight being placed on this approach.
The U.S. surveys she has reviewed show that some learning about infla-tion has taken place over the years, but generally the learning occurs due to inflationary episodes. Perhaps monetary policy has been communicated ineffectively—as something so boring people cannot even remember it—and if so then maybe this is what needs to be improved. If that is the policy implication of this innovative and provocative paper, then it sug-gests a straightforward solution, although how to communicate effectively remains an open question.
Carmen Reinhart wondered if her colleagues in the discussion were not overinterpreting the paper’s results. She pointed out that in Buenos Aires today, the cab drivers are talking about inflation and how INDC, the government statistical agency, has been mismeasuring it, and they also talk about the exchange rate and about parallel markets. In other words, the average person there has a pretty well-informed view, precisely because inflation is a big problem. The paper happens to be comparing the United States and New Zealand at a time when inflation is not affecting households’ bottom line. By contrast, if one looks further back, before the 1990s, when inflation was in double digits both in New Zealand and in the United States, cost-of-living adjustments were a major concern. Reinhart wondered if it would be possible to examine these other periods and see whether the paper’s results would have been significantly different, even though those are periods before inflation targeting. It seemed to her quite possible that inflation targeting does anchor expectations during times when inflation is biting into people’s lives.
Robert Gordon felt the paper raised very important questions about the concepts of inflation targeting, anchored expectations, and forward
222 Brookings Papers on Economic Activity, Fall 2015
guidance. While concurring with Reinhart’s observation about the high level of popular understanding of inflation and central bank policies in high-inflation countries, he pointed out that the paper is actually focused on low-inflation countries. In his view, the role of expectations here has been greatly exaggerated. There is an alternative framework that links current inflation expectations to past inflation, best summarized by John Taylor’s 1980 model of overlapping contracts. He also pointed to Olivier Blanchard’s input/output model of inflation, presented at a 1987 Brook-ings Panel, which emphasized the role of intermediate goods’ prices. This in turn led him to recall what Truman Bewley had found when investi-gating how businesses set individual prices: Business managers did not consider either the Federal Reserve’s targets or aggregate reported prices but, simply, their own costs, which in many cases consisted more of inter-mediate goods purchases than wages.
Businesses look at their profits and at competitors’ prices, Gordon reminded everyone, and when there is a downturn in the macro econ-omy they first notice that their sales have fallen off and, consequently, put things on sale. If they see their inventories building up, they respond, so there is a basic demand effect. All of this is in effect a giant backward-looking mechanism, not one based on expectations. Businesses’ pricing decisions depend on previous price decisions by intermediate-goods sup-pliers, who in turn are dependent on even earlier intermediate-goods price decisions. In short, he argued, in low-inflation countries, inflation expecta-tions play very little role.
Christopher Carroll attempted to synthesize what had been said by various colleagues in the discussion to that point. People in New Zealand do not have clear expectations about inflation, but neither does it follow that Friedman was correct in his suggestion that increasing the inflation target would have little effect, since the action would still create headlines the next day. This suggested to Carroll that what is needed is a theoretical framework that links people’s expectations of inflation with the environ-ment they are living in, such as the number of news stories published on inflation, something the University of Michigan’s Consumer Sentiment Index found had an impact. Carroll mentioned a paper he wrote years earlier in which he had found that household expectations are not ratio-nal in the traditional sense. Households did move in the direction of the expectations of the professional forecasters, he had found, but they did so gradually, updating their expectations by roughly 25 percent of what the professionals believed and being more apt to do so when there were more news stories. In today’s discussion, he found himself agreeing with a point
COMMENTS and DISCUSSION 223
raised by both Reinhart and Gordon, namely that it matters a lot whether what people believe about inflation is forward looking or backward look-ing. That is a deeply important question for monetary policy. All of this suggested to him that the research agenda going forward should aim to figure out, once the inflation rate has gone up, when it is that people start paying more attention. Is it the news stories, which are future-oriented, that trigger their attention, or is it noticing what has happened in the past to prices? Presumably macro models will assign different implications to each of those behaviors.
Valerie Ramey reminded the others that expectations only matter if they translate into action. She speculated that faulty expectations were not necessarily distorting the pricing decisions of small firms. Echoing Gordon’s comments, she believed that while large firms pay close atten-tion to the general inflation level and adjust their expectations to it, small firms care only about what their competitors are charging and what their input costs are; the general level of inflation does not concern them. In support of Reinhart’s examples from Argentina, Ramey mentioned recent research that found that individuals update their inflation expectations more quickly in high inflation countries, such as Argentina, than in low inflation countries, such as the United States. Ramey speculated that peo-ple do not keep track of inflation when it is low. If that is so, then policies such as Abenomics may be ineffective.
Ricardo Reis commented that the title of the paper was slightly mislead-ing, because whether inflation targeting anchors expectations is ultimately a relative question—relative to what other policy regime is it anchoring them? He has seen three or four cross-national studies of inflation target-ing that have looked at the response from professionals and households, and all found that inflation targeting does anchor inflation expectations in the sense of lowering average forecast errors and narrowing the dispersion of expectations. It does not drive dispersion down to zero, and there can be a lot of dispersion remaining, as in New Zealand, but it does impart an effect relative to the time series.
The other quarrel he had with the authors’ findings is that they lacked a comparative context. How did the survey responses on inflation compare with expectations of other economic measures? Reis conjectured that one would find much larger errors in people’s knowledge of nominal GDP growth, both current and forecasted, and likewise in knowledge of the unemployment rate, despite the fact that unemployment matters quite a bit for elections. The same, he conjectured, would be true for knowledge of the Federal Reserve’s current and near-term interest rates. Looked at
224 Brookings Papers on Economic Activity, Fall 2015
in this relative context, the central bank’s announcement of a target for this macro variable—targeted inflation—may actually be showing some effect, in comparison with nominal GDP or unemployment, which are not announced as targets.
One could also look at these data, Reis suggested, and think of the many models of expectations that are out there, including epidemiological models, inattention models, and various learning models. But it was unclear to him that the data reported in this paper either rejected any of those models or was consistent with them because of a problem familiar in applied microeconomics: To find clear results, one needs a shock to identify whether the effect is consistent with the model or not. At the same time, Reis argued for the use of surveys to pin down the right models, rather than abandoning the writing of models altogether just because the link between policy regimes and expectations is unclear. Policy actions like inflation targeting do affect expectations and those expectations, as Ramey noted, affect outcomes. This feedback loop between expectations and actions, which goes in both directions, is what we need both data and models to better design.
Donald Kohn wanted to underline a final point Svensson had raised in his discussant remarks, that it is the time series that matters. More than the mean or the median of misperceived inflation, the flatness of the distribu-tion, or how frequently people are revising data, what matters to policy-makers is whether changes in inflation expectations are reinforcing boom and bust cycles, as when people spend more now to avoid higher prices later or when they hold back because they fear deflation. In Kohn’s view, the change in expectations is what is most important. In the Michigan household survey the longer-term inflation expectations were remarkably stable throughout a very turbulent period in the economy, and that was helpful to the economy as a whole. It can be contrasted with what hap-pened in the 1970s, when a large rise in inflation caused people to revise their expectations even higher, leading to a bad cycle.
Kumar responded to the discussion, first by following up on Reis’s point that business managers are not behaving randomly but trying to earn a profit and, therefore, digesting information as efficiently as possible. He mentioned an earlier paper of his own that employed a quasi-randomized experiment, in which some people were given additional information in order to measure how they would incorporate it into their expectations and decisions. The behavior they observed turned out to be perfectly rational, so one can conclude that the problem with inflation expectations stems from information constraints rather than from irrational thinking or stupidity.
COMMENTS and DISCUSSION 225
As far as the time series question, Kumar said he and the coauthors would have liked to have had access to long time series, but they were not available. Further cross-sectional analysis, though, is not only desirable but possible, and since their research team included an economist from New Zealand, another from France, another from Ukraine, and another from Iran, they are already trying to generate this survey in these countries along with the United States.
In response to the comments that people in the United States do not seem to care about inflation, he countered that this is plainly untrue. In polls there, 80 percent of people say they are hurt by inflation, and when asked to identify priorities for the president of the United States most people cite inflation as much more important even than the war in Iraq.
Kumar noted that research comparing communication about inflation in Sweden with that in the United States was very telling. In Sweden the survey asks a four-word question and allows a four-word answer. In the United States, even at a press conference the question is one paragraph long, followed by four or five paragraphs of answers with a lot of ifs and whens. Another study found that in order to understand the minutes of the Federal Reserve Board meetings, back in the early 1990s a high school diploma was sufficient, but today it requires a Ph.D. The public simply cannot understand the purpose of monetary policy with this kind of communication.
He agreed that inflation targeting may be very instrumental in narrow-ing the range of possibilities people will consider when they think about their inflation expectations, but at the same time, in a low-inflation envi-ronment it is very hard to push this effect far. Considering the wide distri-bution of beliefs their study found in New Zealand, Kumar concluded that the outcome is certainly very different from what the standard Keynesian models would predict, which would be everyone in agreement based on rational expectations. One thing is certain: The world is not there.