35
1 Inflation Targeting in an Uncertain External Backdrop Mário Mesquita October 2008 Inflation Targeting in an Uncertain External Backdrop Mário Mesquita October 2008
1
Inflation Targeting in an Uncertain External Backdrop
Mário MesquitaOctober 2008
Inflation Targeting in an Uncertain External Backdrop
Mário MesquitaOctober 2008
2
I. An Uncertain External Backdrop
3
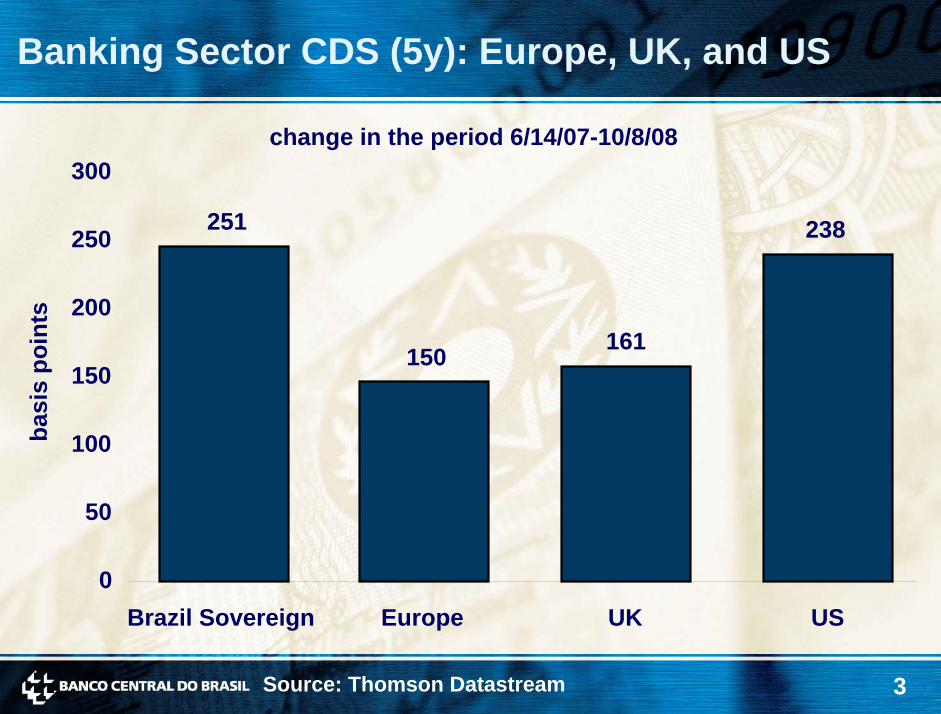
Banking Sector CDS (5y): Europe, UK, and US
change in the period 6/14/07-10/8/08300
Source: Thomson Datastream
basi
s po
ints
251 238250
200161150
150
100
50
0Brazil Sovereign UK USEurope
4
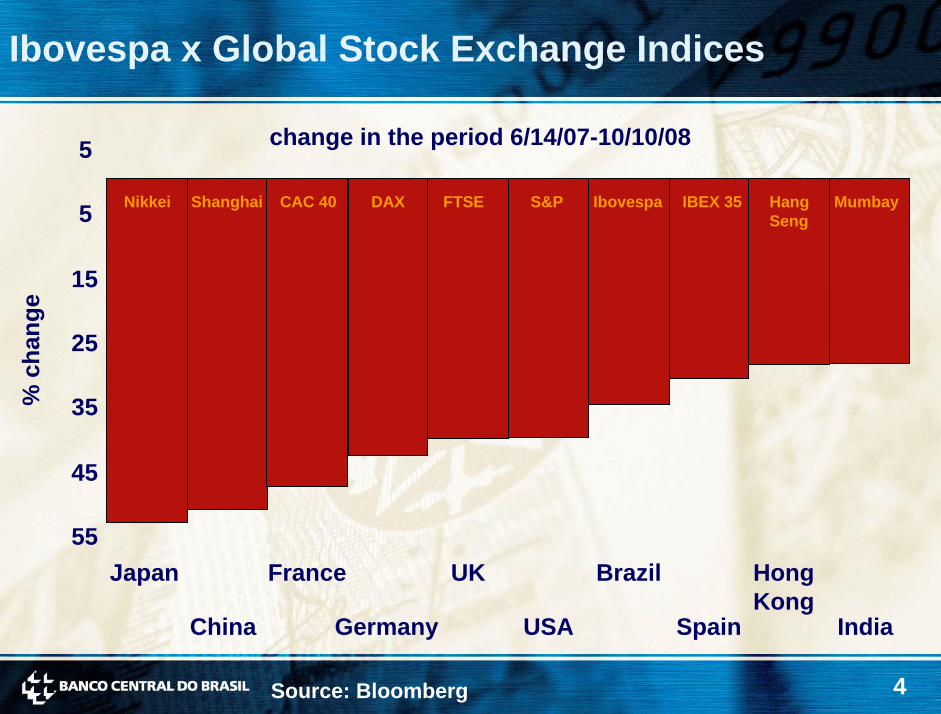
Ibovespa x Global Stock Exchange Indices
change in the period 6/14/07-10/10/085
MumbayShanghai CAC 40Nikkei FTSEDAX S&P HangSeng
Ibovespa IBEX 355
% c
hang
e
15
25
35
45
55Japan France UK Brazil Hong
KongChina Germany USA Spain India
Source: Bloomberg
5
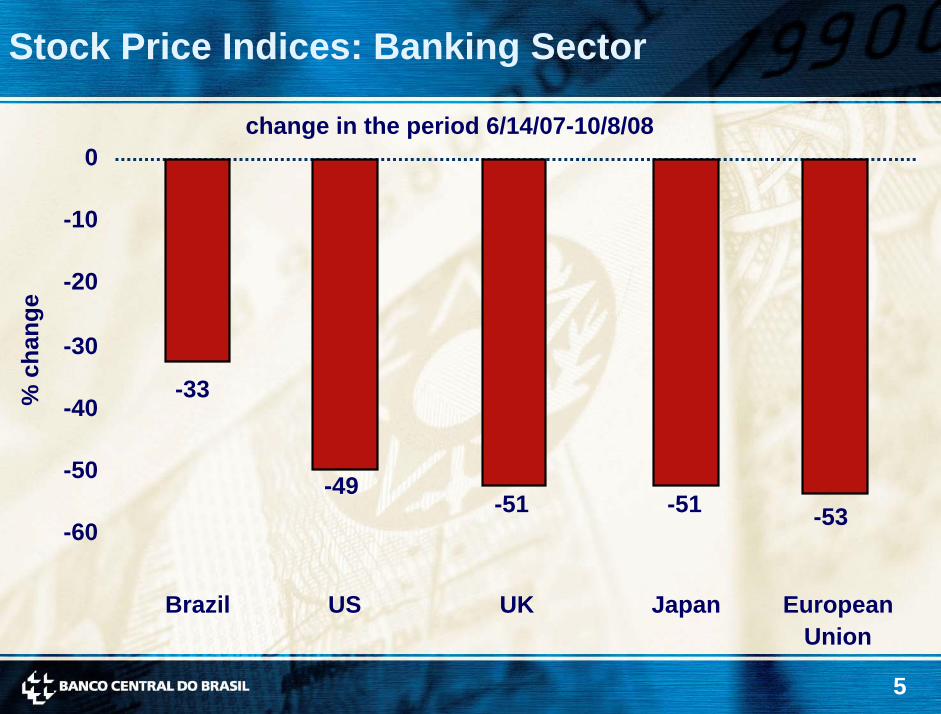
Stock Price Indices: Banking Sector
change in the period 6/14/07-10/8/080
-49-51 -51
-10
% c
hang
e
-20
-30
-33-40
-50
-53-60
Brazil US UK Japan EuropeanUnion
6
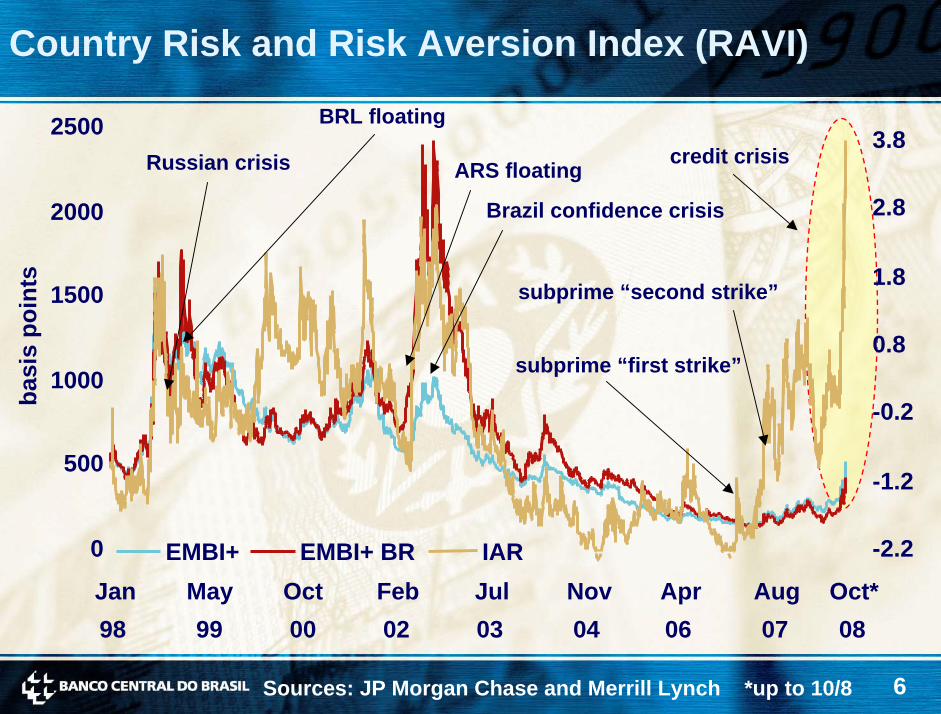
Country Risk and Risk Aversion Index (RAVI)
BRL floating
basi
s po
ints
Russian crisis ARS floating
Brazil confidence crisis
subprime “first strike”
subprime “second strike”
credit crisis
0
500
1000
1500
2000
2500
-2.2
-1.2
-0.2
0.8
1.8
2.8
3.8
EMBI+ EMBI+ BR IARJan May Oct Feb Jul Nov Apr Aug Oct*98 99 00 02 03 04 06 07 08
Sources: JP Morgan Chase and Merrill Lynch *up to 10/8
7
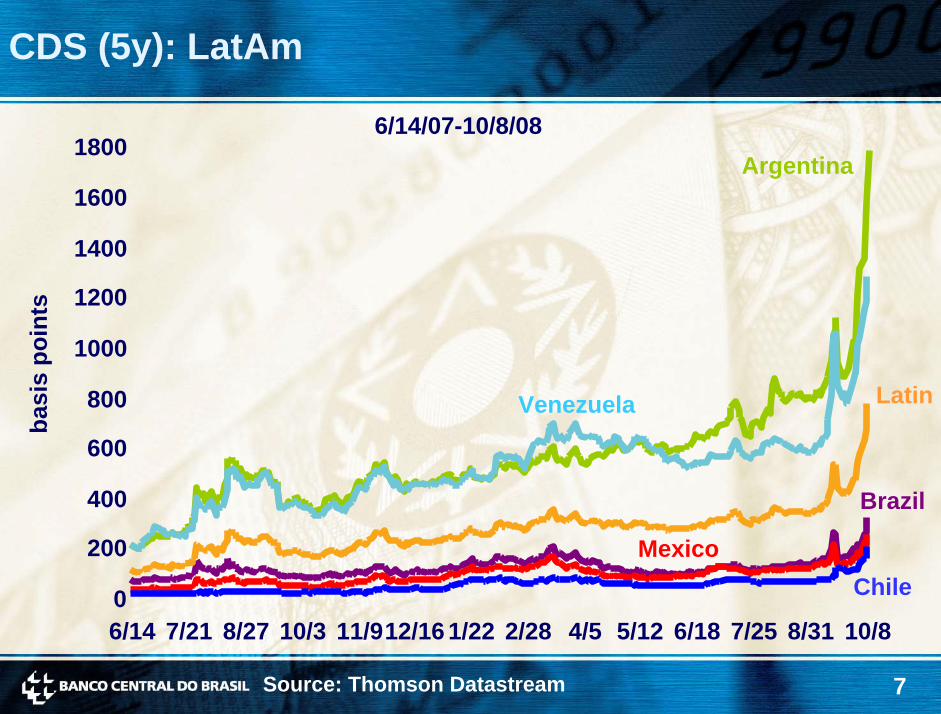
CDS (5y): LatAm
Brazil
Argentina
Venezuela
Mexico
Latin
Chile0
200
400
600
800
1000
1200
1400
1600
6/14 7/21 8/27 10/3 11/912/16 1/22 2/28 4/5 5/12 6/18 7/25 8/31 10/8
18006/14/07-10/8/08
basi
s po
ints
Source: Thomson Datastream
8
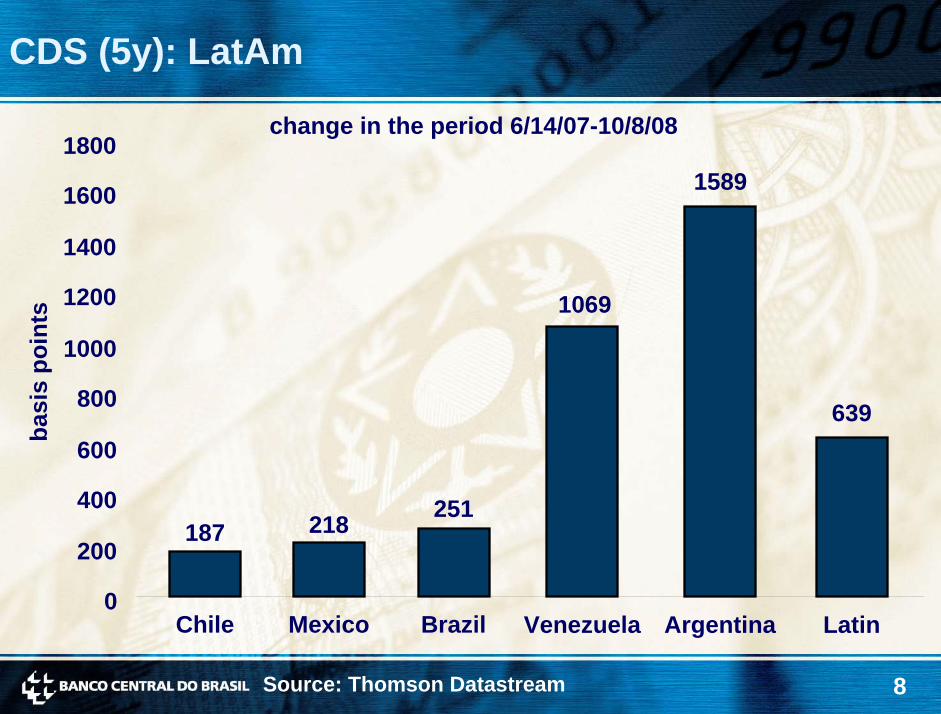
CDS (5y): LatAm
change in the period 6/14/07-10/8/081800
15891600
basi
s po
ints
1400
1200 1069
1000
800 639600
400 251218187200
0Chile BrazilMexico LatinArgentinaVenezuela
Source: Thomson Datastream
9
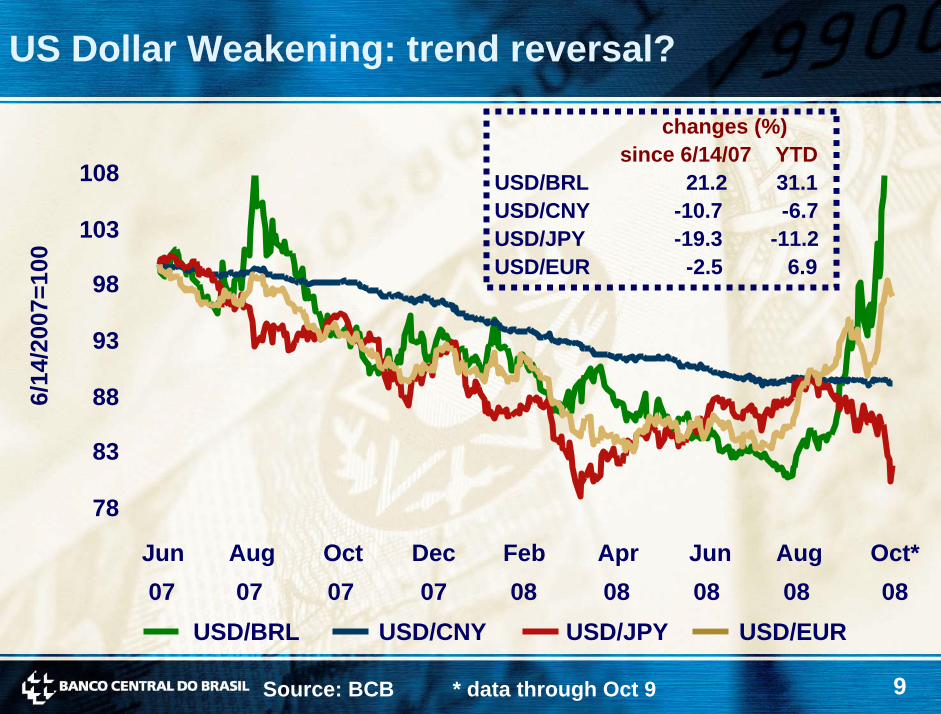
US Dollar Weakening: trend reversal?
changes (%)since 6/14/07 YTD
USD/BRL 21.2 31.1USD/CNY -10.7 -6.7USD/JPY -19.3 -11.2USD/EUR -2.5 6.9
108
6/14
/200
7=10
0
103
98
93
88
83
78
Jun Aug Oct Dec Feb Apr Jun Aug Oct*07 07 07 07 08 08 08 08 08
USD/BRL USD/CNY USD/JPY USD/EUR
Source: BCB * data through Oct 9
10
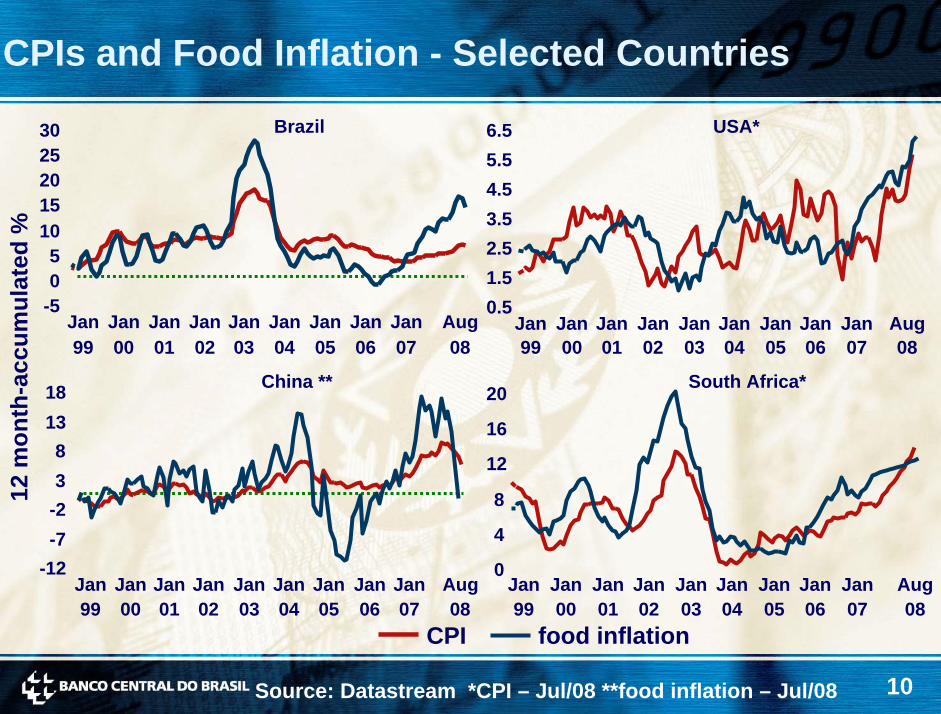
CPIs and Food Inflation - Selected Countries12
mon
th-a
ccum
ulat
ed %
CPI99 00 01 02 03 04 05 06 07
China **
-12-7-238
1318
Jan Jan Jan Jan Jan Jan Jan Jan Jan Aug08
Brazil
-505
1015202530
Jan99
Jan00
Jan01
Jan02
Jan03
Jan04
Jan05
Jan06
Jan07
Aug08
USA*
0.51.52.53.54.55.56.5
Jan99
Jan00
Jan01
Jan02
Jan03
Jan04
Jan05
Jan06
Jan07
Aug08
South Africa*
0
4
8
12
16
20
Jan99
Jan00
Jan01
Jan02
Jan03
Jan04
Jan05
Jan06
Jan07
Aug08
food inflation
Source: Datastream *CPI – Jul/08 **food inflation – Jul/08
11
II. Brazil: Increased Resilience to Shocks
12
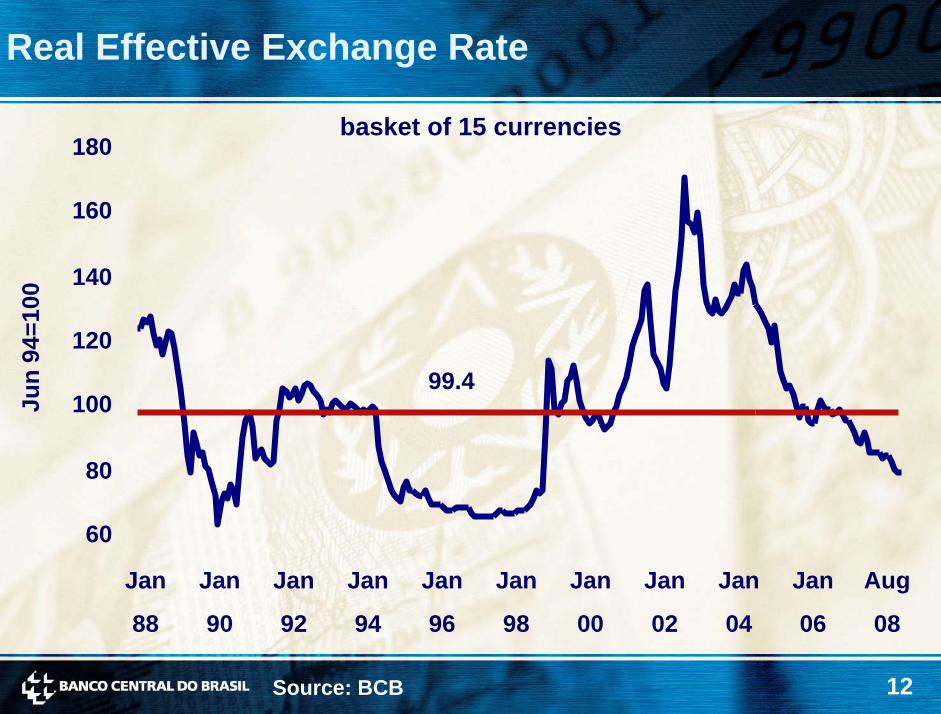
Real Effective Exchange Rate
basket of 15 currencies180
99.4
160
Jun
94=1
00
140
120
100
80
60
Jan Jan Jan Jan Jan Jan Jan Jan Jan Jan Aug
88 90 92 94 96 98 00 02 04 06 08
Source: BCB
13
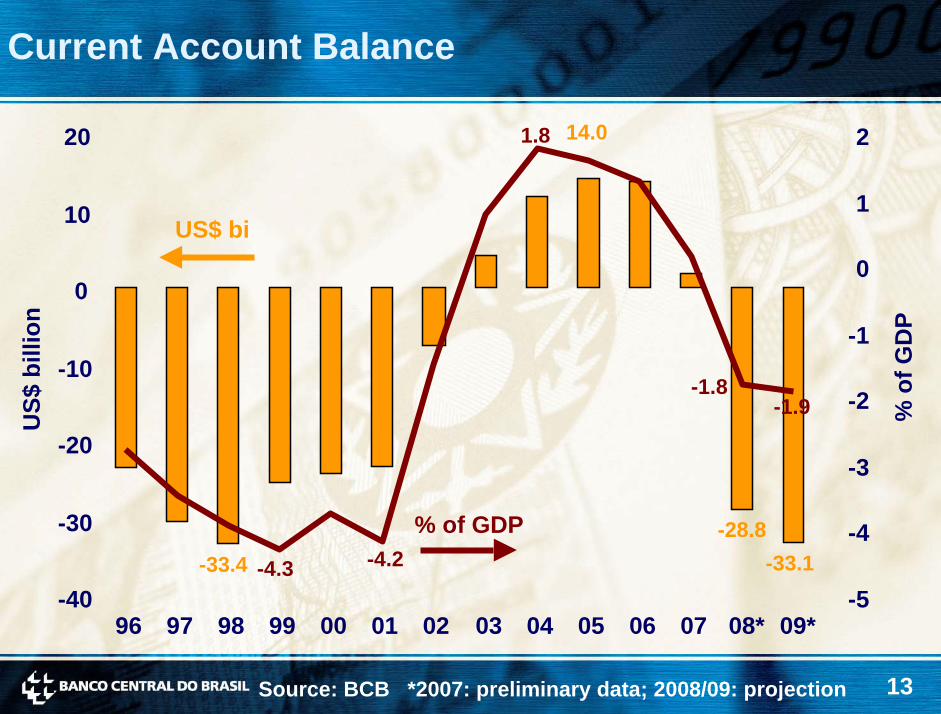
Current Account Balance
-33.4-28.8
-33.1
14.0
-1.9
-4.3 -4.2
-1.8
1.8
US$ bi
% of GDP
20 2
110
0
US$
bill
ion
0
% o
f GD
P-1-10
-2
-20-3
-30 -4
-5-4096 97 98 99 00 01 02 03 04 05 06 07 08* 09*
Source: BCB *2007: preliminary data; 2008/09: projection
14
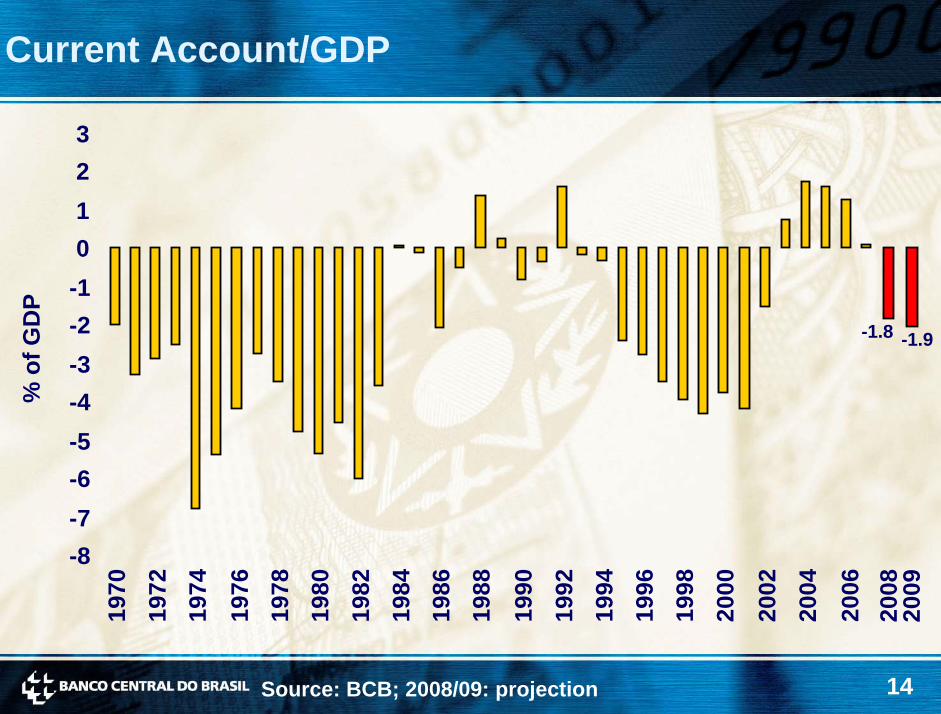
Current Account/GDP
3210
% o
f GD
P
Source: BCB; 2008/09: projection
-8-7-6-5-4-3-2-1
1970
1972
1974
1976
1978
1980
1982
1984
1986
1988
1990
1992
1994
1996
1998
2000
2002
2004
2006
2008
2009
-1.8 -1.9
15
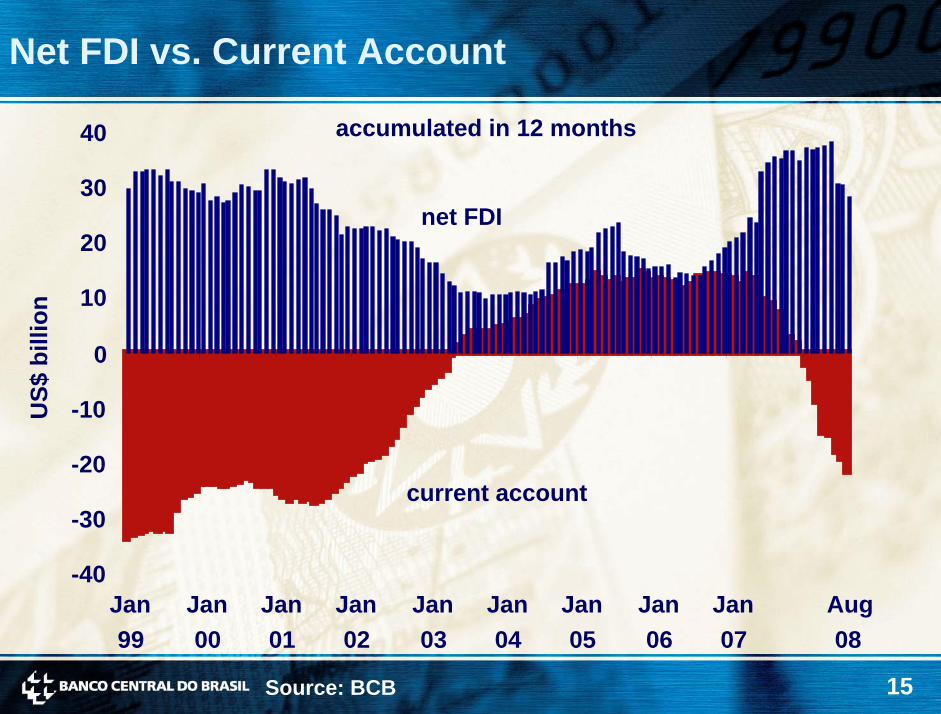
Net FDI vs. Current Account
current account
accumulated in 12 months
net FDI
40
30
20
US$
bill
ion 10
0
-10
-20
-30
-40Jan99
Jan00
Jan01
Jan02
Jan03
Jan04
Jan05
Jan06
Jan07
Aug08
Source: BCB
16
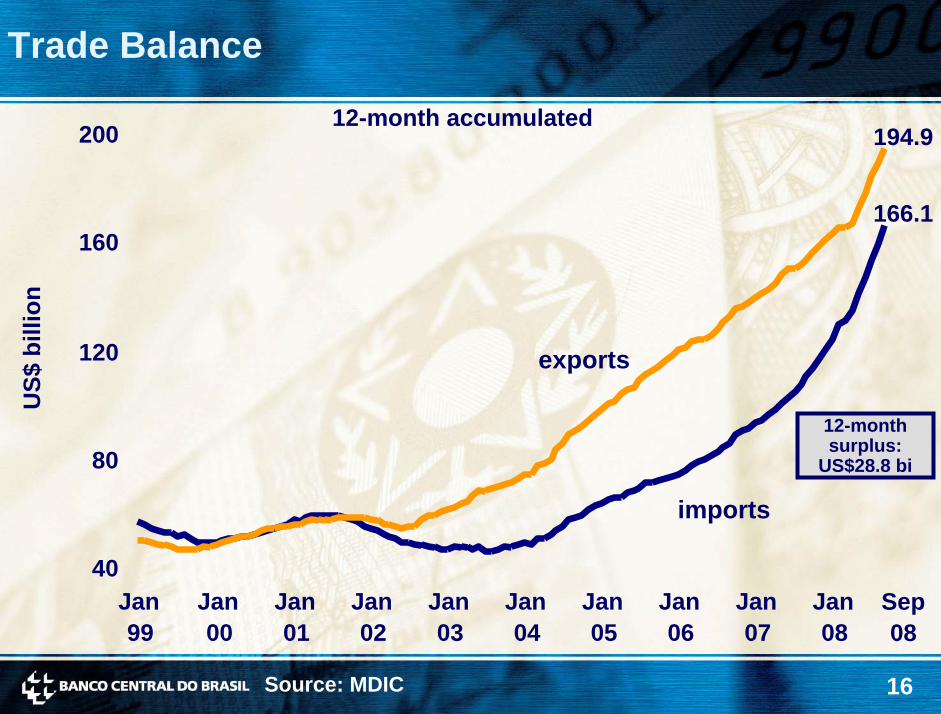
Trade Balance
12-month accumulated
exports
imports
US$
bill
ion
12-monthsurplus:
US$28.8 bi
194.9
166.1
40
80
120
160
200
Jan99
Jan00
Jan01
Jan02
Jan03
Jan04
Jan05
Jan06
Jan07
Jan08
Sep08
Source: MDIC
17
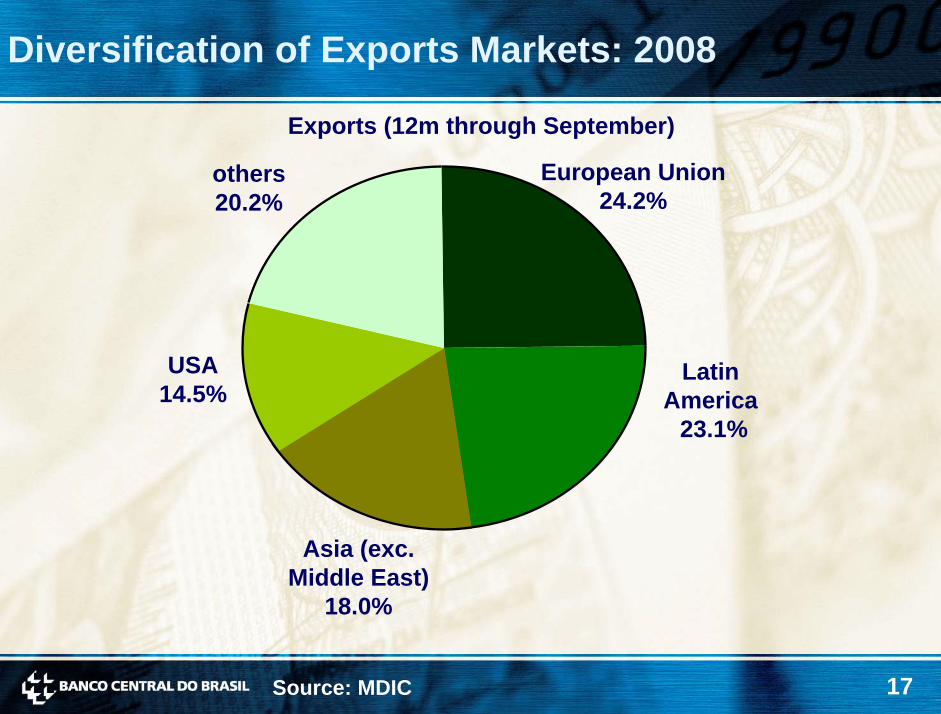
Diversification of Exports Markets: 2008
Exports (12m through September)
USA14.5%
others20.2%
European Union24.2%
LatinAmerica
23.1%
Asia (exc. Middle East)
18.0%
Source: MDIC
18
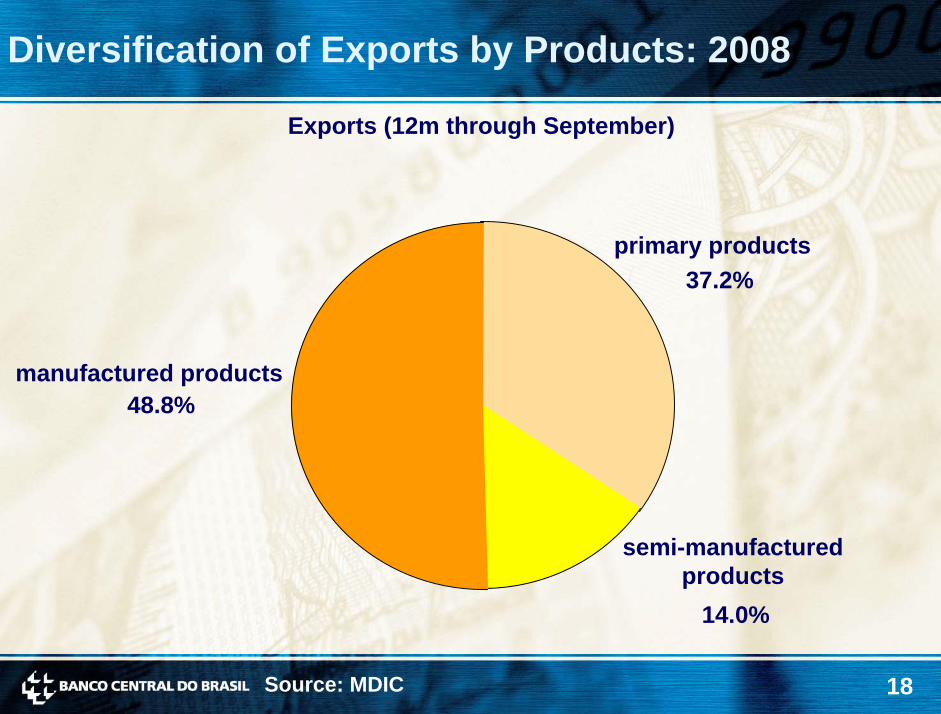
Diversification of Exports by Products: 2008
Exports (12m through September)
primary products
semi-manufacturedproducts
37.2%
manufactured products48.8%
14.0%
Source: MDIC
19
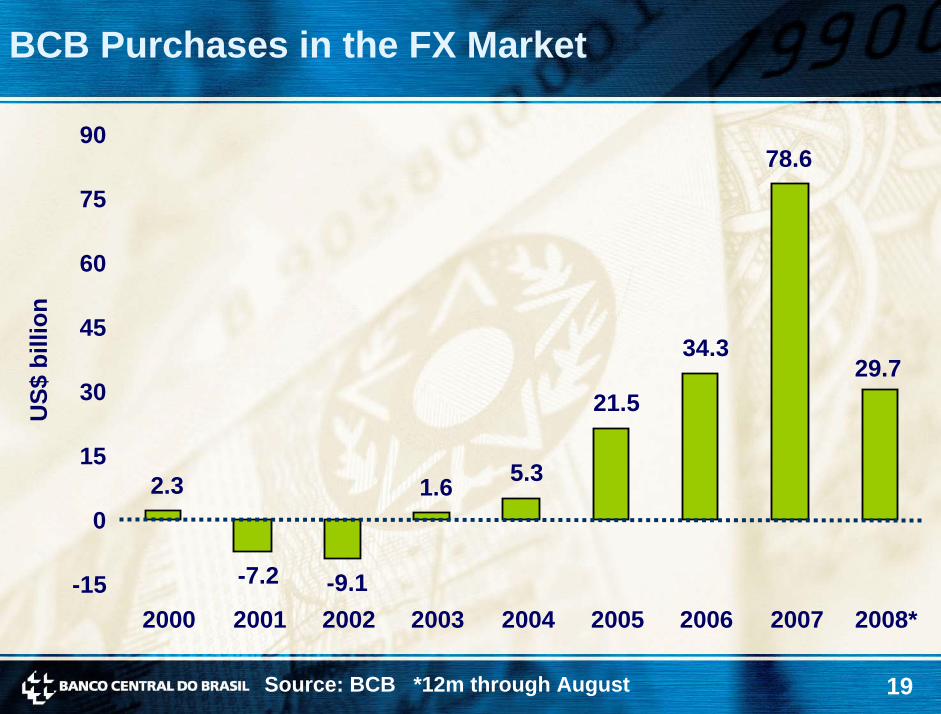
BCB Purchases in the FX Market
9078.6
2.3
-7.2 -9.1
1.6 5.3
21.5
34.329.7
75
60
US$
bill
ion
45
30
15
0
-152000 2001 2002 2003 2004 2005 2006 2007 2008*
Source: BCB *12m through August
20
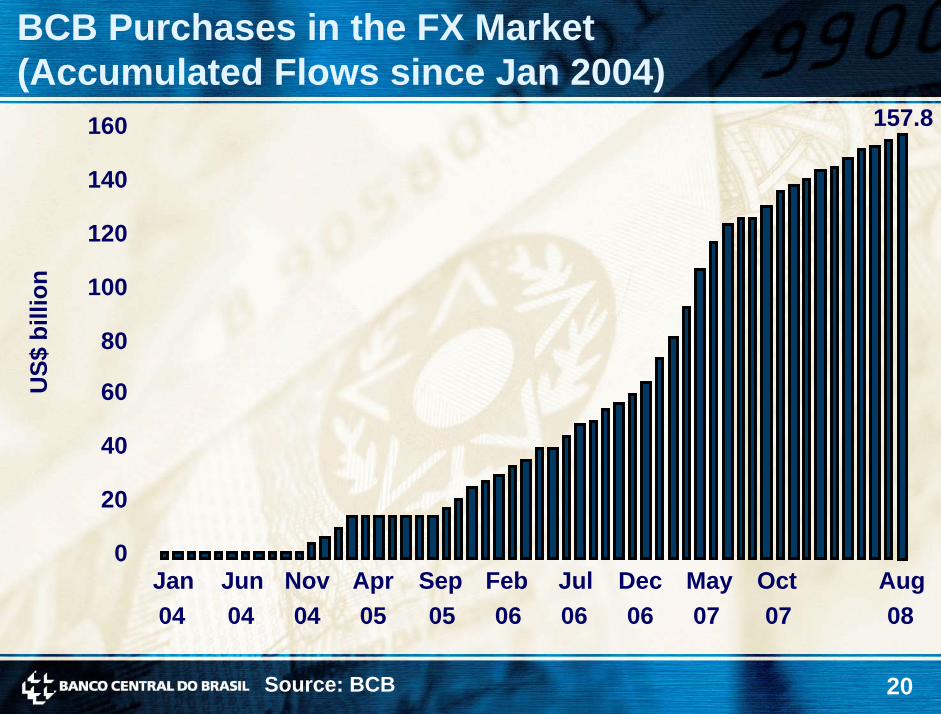
BCB Purchases in the FX Market (Accumulated Flows since Jan 2004)
US$
bill
ion
157.8
0
20
40
60
80
100
120
140
160
Jan04
Jun04
Nov04
Apr05
Sep05
Feb06
Jul06
Dec06
May07
Oct07
Aug08
Source: BCB
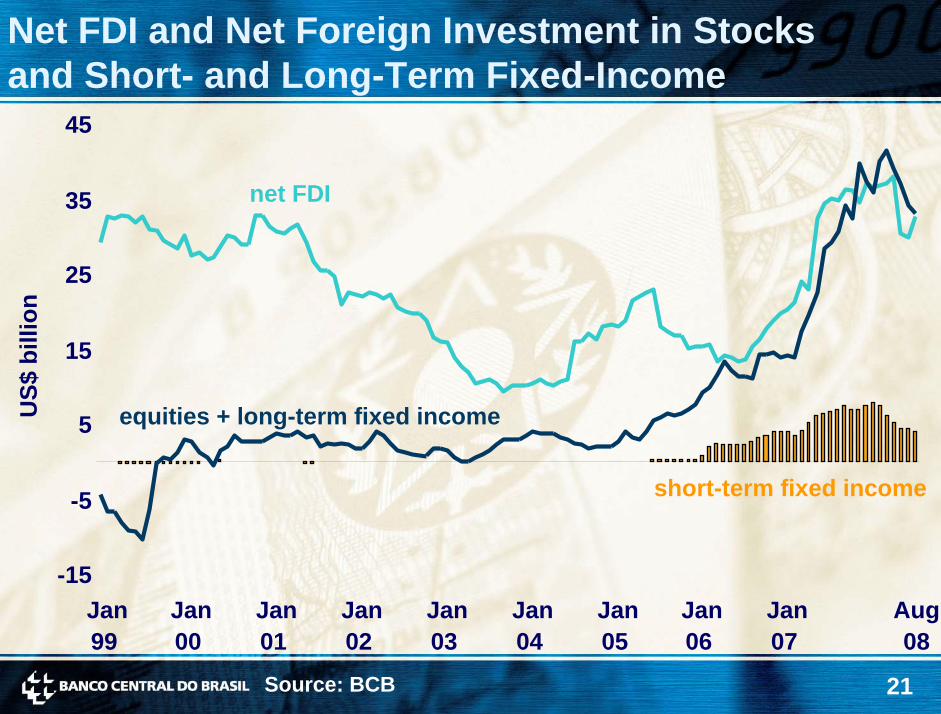
21
Net FDI and Net Foreign Investment in Stocks and Short- and Long-Term Fixed-Income
45
net FDI
equities + long-term fixed income
short-term fixed income-5
5
15
25
35
US$
bill
ion
-15Jan99
Jan00
Jan01
Jan02
Jan03
Jan04
Jan05
Jan06
Jan07
Aug08
Source: BCB
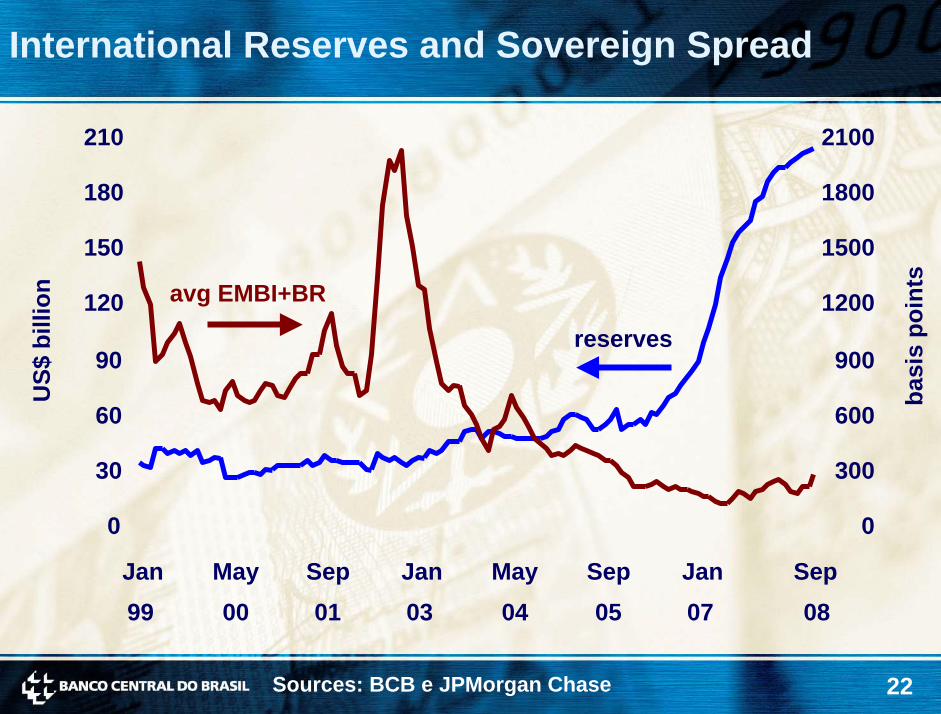
22
International Reserves and Sovereign SpreadU
S$ b
illio
n
basi
spo
ints
reserves
avg EMBI+BR
Sources: BCB e JPMorgan Chase
0
300
600
900
1200
1500
1800
2100210
180
150
120
90
60
30
0
Jan May Sep Jan May Sep Jan Sep99 00 01 03 04 05 07 08
23
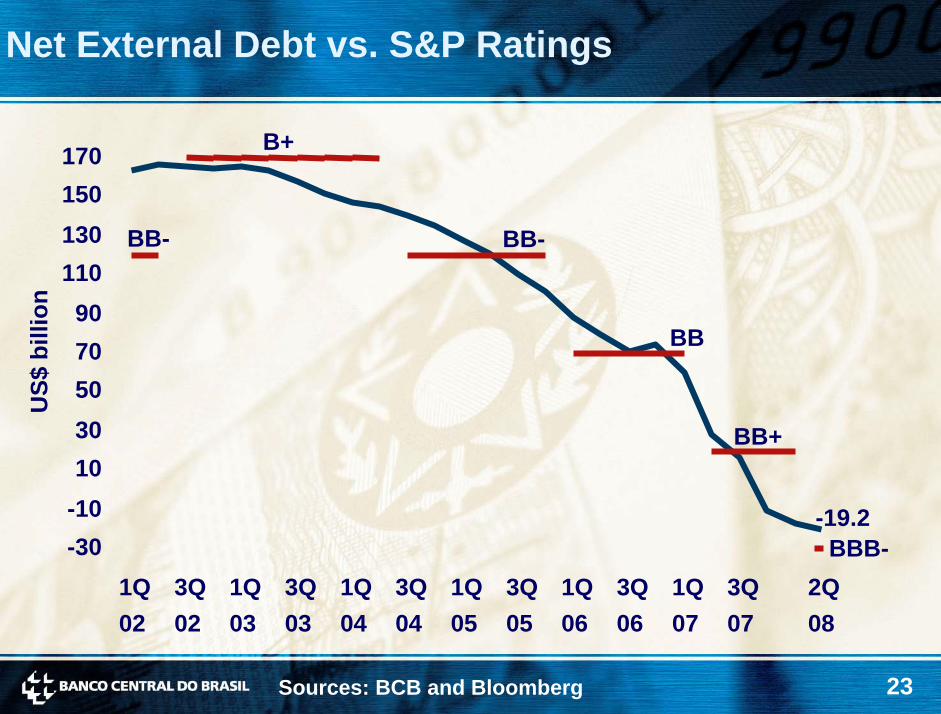
Net External Debt vs. S&P RatingsU
S$ b
illio
n
Sources: BCB and Bloomberg
BBB-
BB+
BB
BB-
B+
BB-
-19.2
170150130110
9070503010
-10-30
1Q02
3Q02
1Q03
3Q03
1Q04
3Q04
1Q05
3Q05
1Q06
3Q06
1Q07
3Q07
2Q08
24
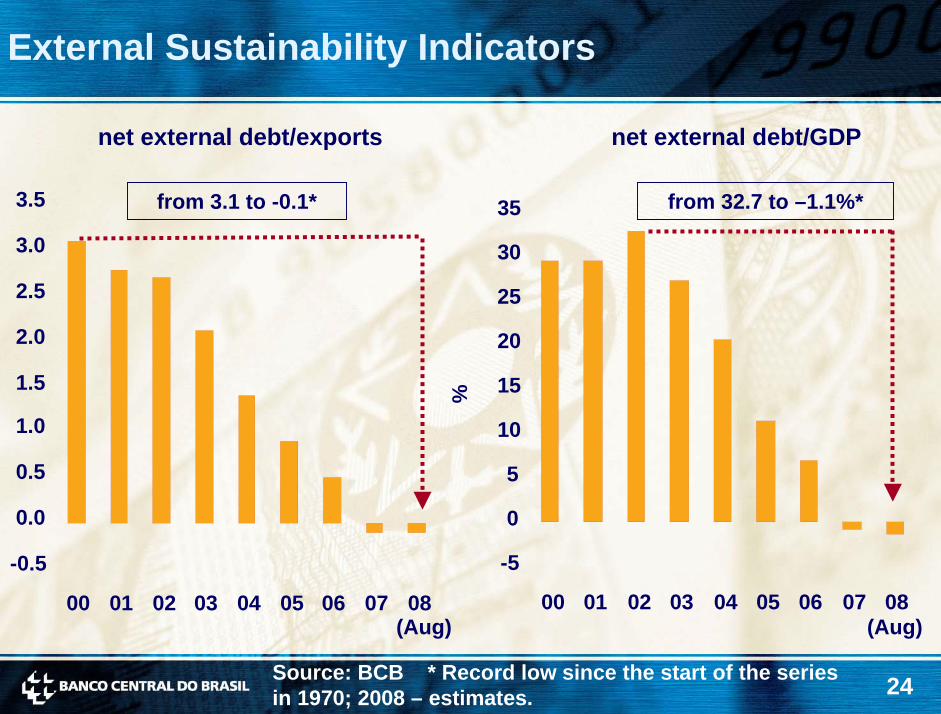
External Sustainability Indicators
net external debt/exports net external debt/GDP
from 3.1 to -0.1* from 32.7 to –1.1%* 3.5 35
Source: BCB * Record low since the start of the series in 1970; 2008 – estimates.
%
(Aug)(Aug)
-0.5
0.0
0.5
1.0
1.5
2.0
2.5
3.0 30
25
20
15
10
5
0
-5
00 01 02 03 04 05 06 07 0800 01 02 03 04 05 06 07 08
25
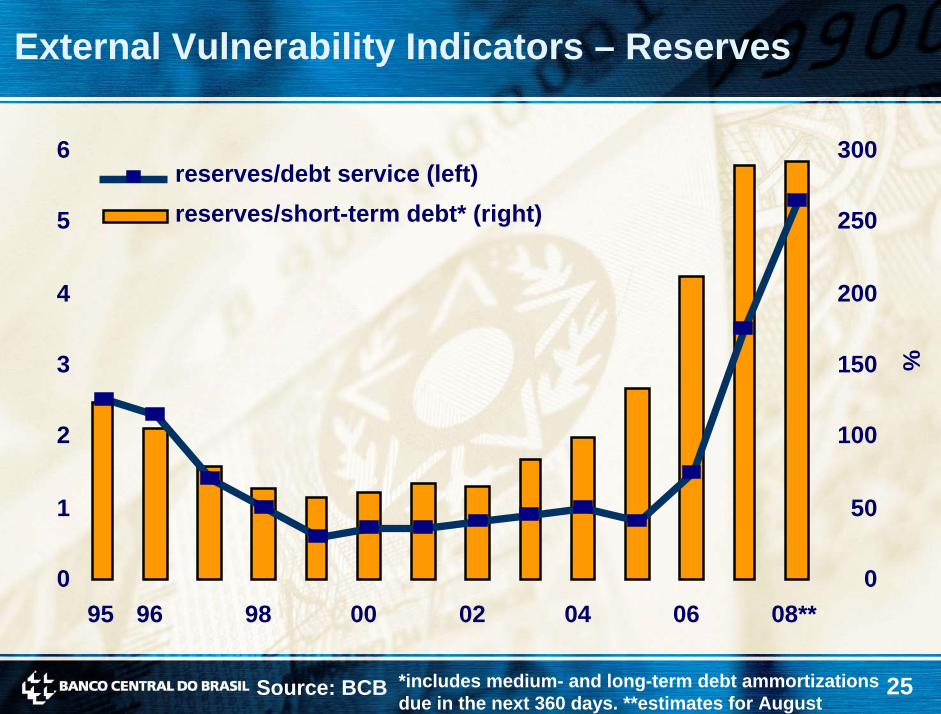
External Vulnerability Indicators – Reserves
3006
reserves/short-term debt* (right)reserves/debt service (left)
96 98 00 02 04 06 08**95
2505
2004
%1503
1002
501
00
Source: BCB *includes medium- and long-term debt ammortizationsdue in the next 360 days. **estimates for August
26
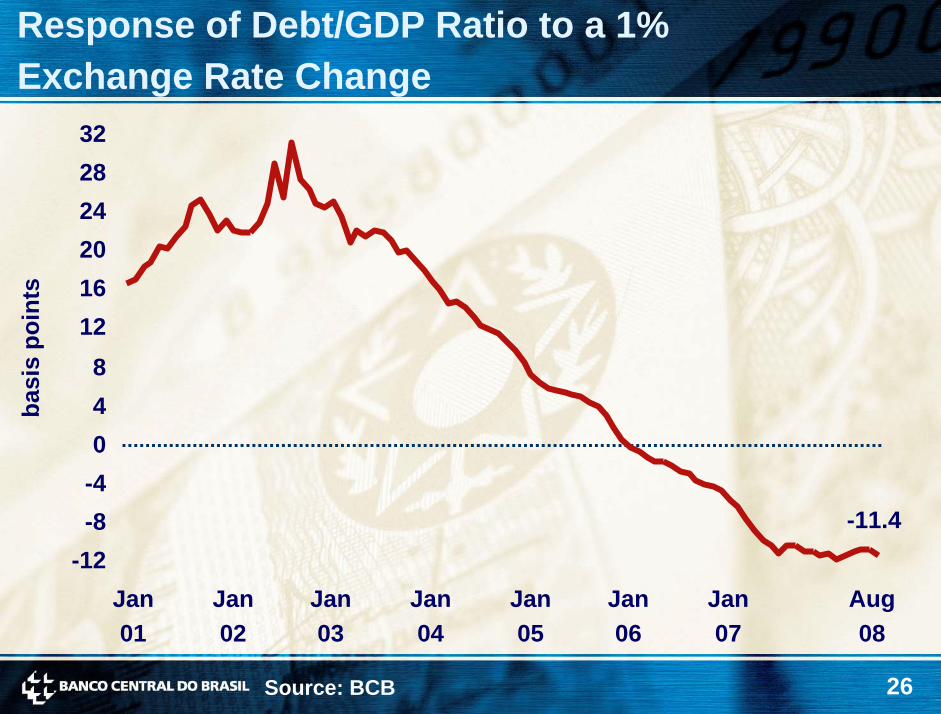
Response of Debt/GDP Ratio to a 1% Exchange Rate Change
basi
spo
ints
-11.4-12
-8-4048
121620242832
Jan01
Jan02
Jan03
Jan04
Jan05
Jan06
Jan07
Aug08
Source: BCB
27
III. Brazil: Inflation Targeting in Practice
28
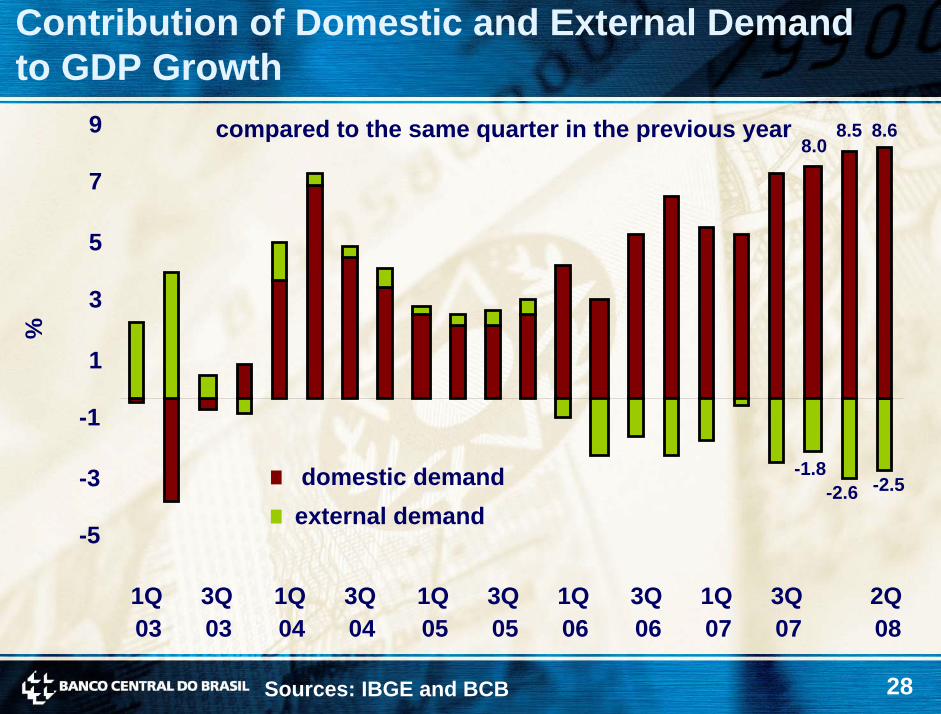
Contribution of Domestic and External Demandto GDP Growth
9 compared to the same quarter in the previous year
domestic demandexternal demand
8.08.5
-2.5-1.8
-2.6
8.6
7
5
3
%
1
-1
-3
-5
1Q03
3Q03
1Q04
3Q04
1Q05
3Q05
1Q06
3Q06
1Q07
3Q07
2Q08
Sources: IBGE and BCB
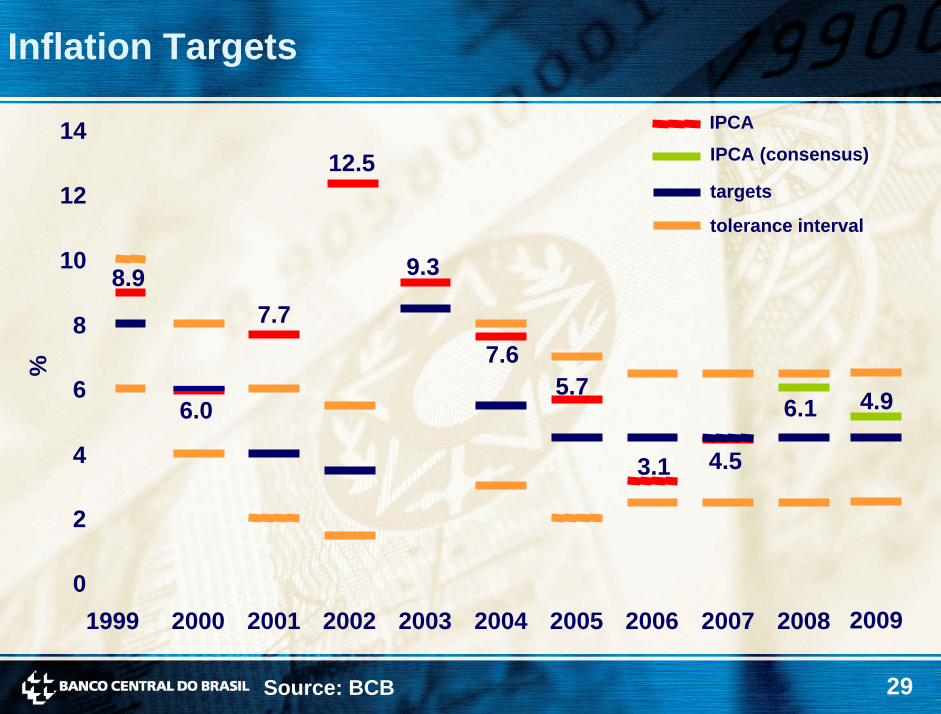
29
Inflation Targets
IPCA14IPCA (consensus)12.5targets12tolerance interval
%
10 9.38.9
0
2
4
6
8
1999
7.77.6
6.0
3.1
5.7
4.5
2000 2001 2002 2003 2004 2005 2006 2007
6.1 4.9
20092008
Source: BCB
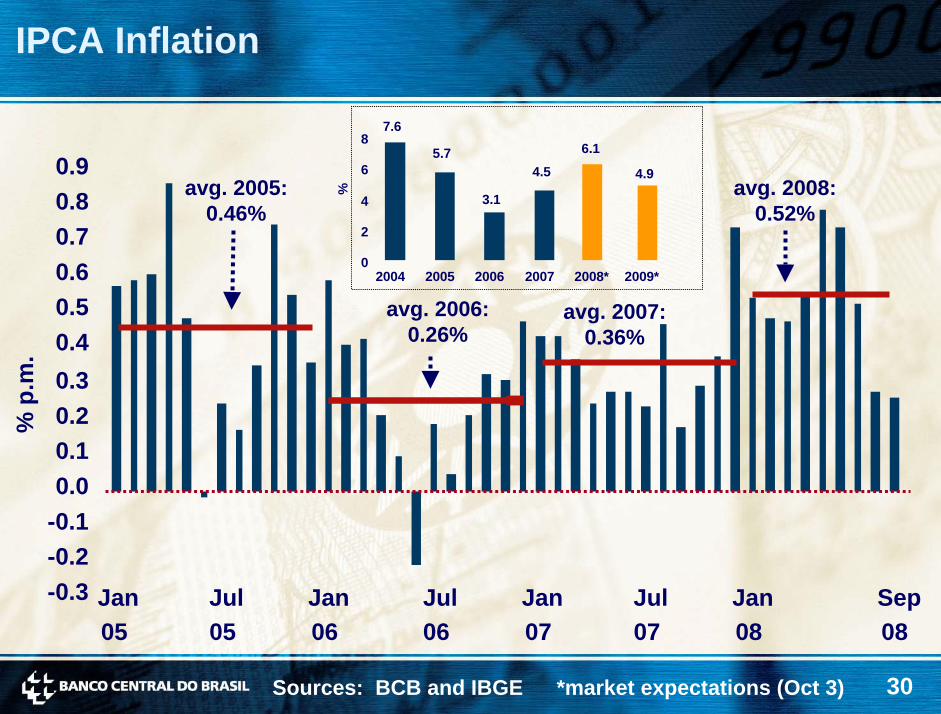
30
IPCA Inflation
%
7.6
5.7
3.1
4.5
6.1
4.9
0
2
4
6
8
2004 2005 2006 2007 2008* 2009*
Sources: BCB and IBGE *market expectations (Oct 3)
% p
.m.
-0.3-0.2-0.10.00.10.20.30.40.50.60.70.80.9
avg. 2006:0.26%
avg. 2007:0.36%
avg. 2008:0.52%
avg. 2005:0.46%
Jan05
Jul05
Jan06
Jul06
Jan07
Jul07
Jan08
Sep08
31
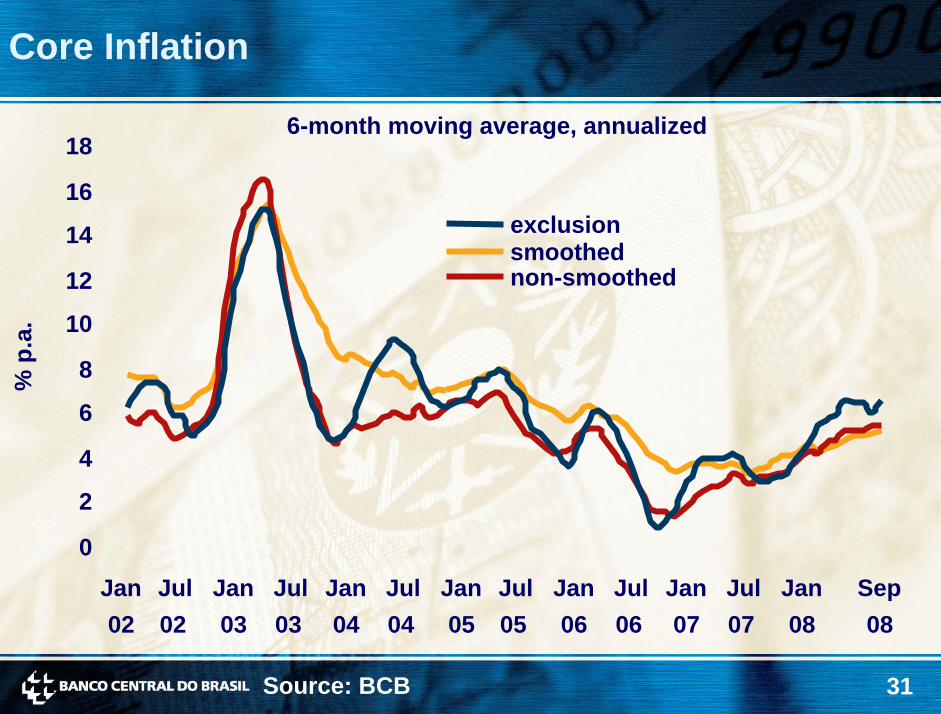
Core Inflation
6-month moving average, annualized18
smoothednon-smoothed
exclusion16
14
12
% p
.a. 10
8
6
4
2
0Jan02
Jul02
Jan03
Jul03
Jan04
Jul04
Jan05
Jul05
Jan06
Jul06
Jan07
Jul07
Jan08
Sep08
Source: BCB
32
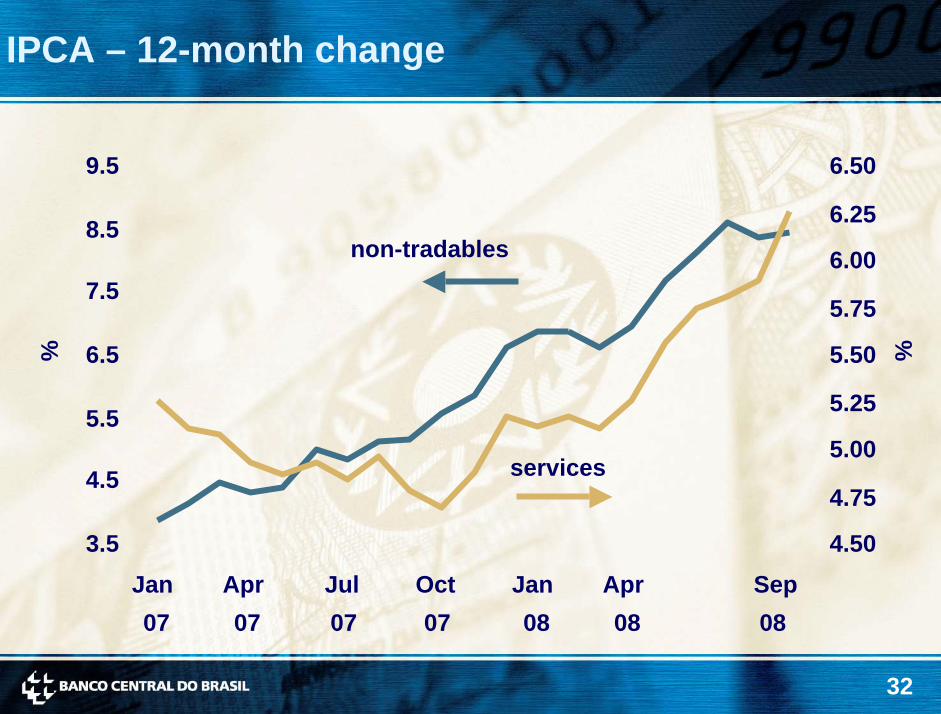
IPCA – 12-month change
6.509.5
non-tradables
services
%
6.258.56.00
7.55.75
% 5.506.5
5.255.55.00
4.54.75
4.503.5Jan Apr Jul Oct Jan Apr Sep07 07 07 07 08 08 08
33
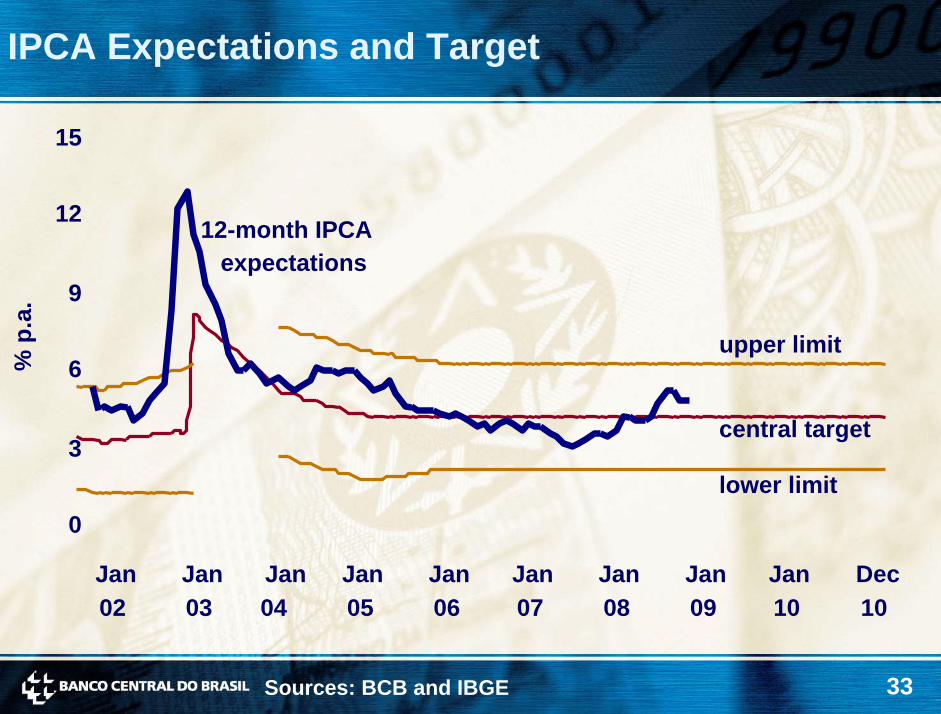
IPCA Expectations and Target
15
central target
12-month IPCA expectations
upper limit
lower limit3
6
9
12
% p
.a.
0
Jan02
Jan03
Jan04
Jan05
Jan06
Jan07
Jan08
Jan09
Jan10
Dec10
Sources: BCB and IBGE
34
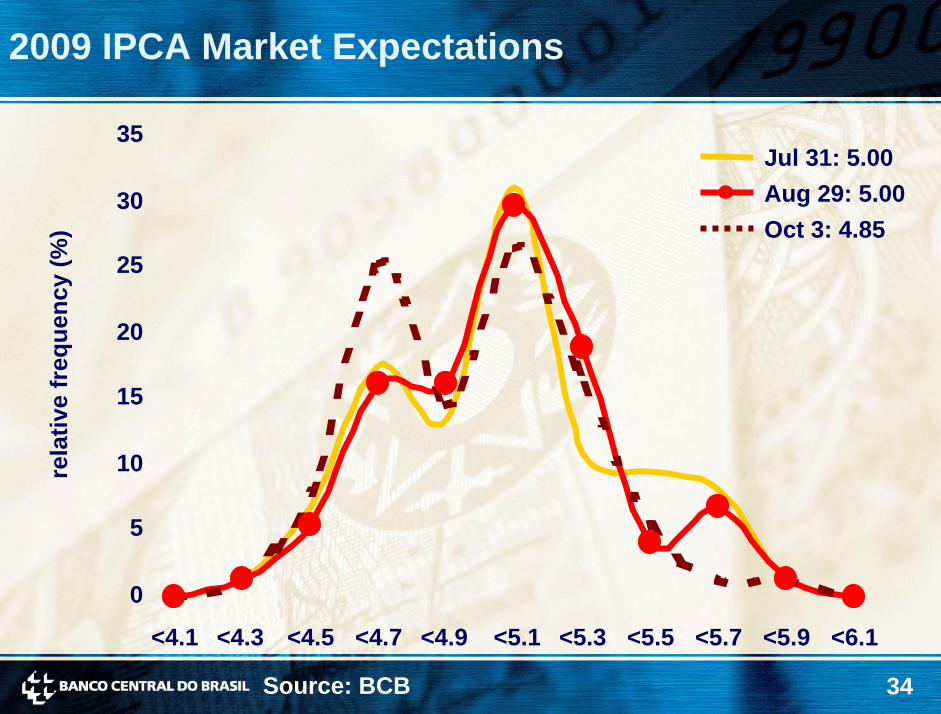
2009 IPCA Market Expectations
35Jul 31: 5.00Aug 29: 5.00Oct 3: 4.85
30
rela
tive
freq
uenc
y(%
)
25
20
15
10
5
0
<4.1 <4.3 <4.5 <4.7 <4.9 <5.1 <5.3 <5.5 <5.7 <5.9 <6.1
Source: BCB
35
Inflation Targeting in an Uncertain External Backdrop
Mário MesquitaOctober 2008
Inflation Targeting in an Uncertain External Backdrop
Mário MesquitaOctober 2008


