202 Vol. 2 INFLUENCE OF A HEAVY PHOSPHATE DRESSING AND SUBSEQUENT RADIATA PINE RESPONSE ON THE PROPERTIES OF A RIVERHEAD CLAY SOIL R. BALLARD* Forest Research Institute, New Zealand Forest Service, Rotorua (Received for publication 3 November 1971) ABSTRACT A study was carried out in 1970 to determine the differences in soil physical and chemical properties between two 0.04 hectare (ha) plots growing radiata pine (Pinus radiata D. Don) in Riverhead Forest; one plot received the equivalent of 2.5 tonnes of superphosphate per ha in 1952 and the other no treatment. During the period 1958-69 the basal area of trees per ha in the treated plot increased by 44.70 m 2 compared to an increase of only 4.52 m 2 in the control plot. Analyses were made on soil samples taken from three depths in three profile pits in each plot. The water table depth in the treated area was generally 500 mm lower than that in the control area; there was a considerable improve- ment in the structure of the treated soil; and the aggregates from the topsoil of the treated profiles were found to be much more water stable than those from the untreated profiles. Associated with the improved structure was a decrease in bulk density (0.93 to 0.82 gm/cc) and an increase in the macroporosity (7.3% to 20.4%) in the topsoil of the treated area. The major changes in the soil physical properties were attributed to the effect of the growth response rather than to a direct fertiliser effect. Except for phosphorus levels, there were only minor differences in chemical properties between the two plots; a small reduction in the pH of the treated topsoil (4.67 to 4.46), and an unaccountable increase in exchangeable sodium levels in the treated soil. Abundant mycorrhizas were seen in the treated soil but virtually none in the untreated soil. Carry-over effects on the establishment and growth of second rotation crops are discussed. INTRODUCTION In 1952 a series of paired plots was established in unthrifty 20-24 yr-old radiata pine (Pinus radiata D. Don) in Riverhead Forest, about 15 miles north-west of Auckland. One of each pair was hand-topdressed with superphosphate at a rate of 2.5 tonnes per ha. The responses in these plots were only assessed visually up until 1958 when the first quantitative measurements were made. Weston (1956) outlined the history of the * Address until 1974: Soils Department, University of Florida, Gainesville, Florida 32601, USA. N.Z. JI For. Sci. 2 (2): 202-16
Transcript
202 Vol. 2
INFLUENCE OF A HEAVY PHOSPHATE DRESSING AND
SUBSEQUENT RADIATA PINE RESPONSE ON THE
PROPERTIES OF A RIVERHEAD CLAY SOIL
R. BALLARD* Forest Research Institute, New Zealand Forest Service, Rotorua
(Received for publication 3 November 1971)
ABSTRACT A study was carried out in 1970 to determine the differences in soil physical
and chemical properties between two 0.04 hectare (ha) plots growing radiata pine (Pinus radiata D. Don) in Riverhead Forest; one plot received the equivalent of 2.5 tonnes of superphosphate per ha in 1952 and the other no treatment. During the period 1958-69 the basal area of trees per ha in the treated plot increased by 44.70 m2 compared to an increase of only 4.52 m2 in the control plot.
Analyses were made on soil samples taken from three depths in three profile pits in each plot. The water table depth in the treated area was generally 500 mm lower than that in the control area; there was a considerable improvement in the structure of the treated soil; and the aggregates from the topsoil of the treated profiles were found to be much more water stable than those from the untreated profiles. Associated with the improved structure was a decrease in bulk density (0.93 to 0.82 gm/cc) and an increase in the macroporosity (7.3% to 20.4%) in the topsoil of the treated area. The major changes in the soil physical properties were attributed to the effect of the growth response rather than to a direct fertiliser effect.
Except for phosphorus levels, there were only minor differences in chemical properties between the two plots; a small reduction in the pH of the treated topsoil (4.67 to 4.46), and an unaccountable increase in exchangeable sodium levels in the treated soil.
Abundant mycorrhizas were seen in the treated soil but virtually none in the untreated soil. Carry-over effects on the establishment and growth of second rotation crops are discussed.
INTRODUCTION
In 1952 a series of paired plots was established in unthrifty 20-24 yr-old radiata pine (Pinus radiata D. Don) in Riverhead Forest, about 15 miles north-west of Auckland. One of each pair was hand-topdressed with superphosphate at a rate of 2.5 tonnes per ha. The responses in these plots were only assessed visually up until 1958 when the first quantitative measurements were made. Weston (1956) outlined the history of the
* Address until 1974: Soils Department, University of Florida, Gainesville, Florida 32601, USA. N.Z. JI For. Sci. 2 (2): 202-16
No. 2 Ballard — Phosphate on Riverhead Clay Soil 203
Riverhead nutritional problem and described the visual response seen in the first 4yr of these early plots.
A feature of these early trials is the marked difference in soil properties between control and treated plots which presumably were similar at establishment. Most of these paired plots have been recently topdressed during routine aerial topdressing operations in the forest, but the A90, A90c pair in which the contrast in soil properties is probably most pronounced, was not covered.
This report presents the results of an investigation undertaken to detail the differences in soil physical and chemical properties between A90 and A90c, and where possible to differentiate between differences caused by direct and indirect fertiliser effects.
Plot and Locality Data
A90 and A90c were established in Compartment (Cpt) 12, Riverhead, in 1952 by Mr G. C. Weston. The area was planted in 1932 with radiata pine at 2.5 X 2.5 m spacing. It was blanked in 1933 and low pruned in October 1958. Each plot is 0.04 ha in size with a buffer zone 20 m wide between it and the next plot.
A summary of the growth data recorded between 1958 and 1969 is shown in Table 1. These data show the virtual stagnation of the control plot (A90c) and the spectacular response in the treated plot (A90).
TABLE 1—Summary of growth data (A90, A90c)
A90
A90c
Difference
A90
A90c
Difference
A90
A90c
Difference
1958
33.65
13.68
19.97
0.099
0.055
0.044
1960
45.15
15.62
29.53
0.133
0.063
0.070
1962 1966 1969
A. Basal area/ha (m2
50.70
16.32
34-38
68.55
18.27
50.28
B. Basal area
0.154
0,068
0.086
0.208
0.079
0.129
C. Mean Height (m)
1962
17.7
10.9
6.8
1969
21 .1
11 .9
9.2
62/69
3.4 1 .0
2.4
78.35
18.20
60.15
i/tree (ir
0.237
0.096
0.141
58/62
:) 17.05
2.64
14.41
t2)
0.055
0.013
0.042
62/66
17.85
1.95
15.90
0.054
0.011
0.043
66/69
9.80
-0.07
9.87
0.029
0.017
0.012
D. Total Volume/ha (IL
1962
370.5
80.8
289.7
1969
628.5
91.4
537.1
62/69
258.0
10.6
247.4
58/69
44.70
4.52
40.18
0.138
0.041
0.097
)
Foliage samples were collected from the two plots in 1955, 1959, 1965, 1966, and 1969. The results of the analyses on these samples are shown in Table 2.
The site elevation is ca. 150 m, the slope 10°-12°, and the aspect southwesterly. The mean annual rainfall at Riverhead is about 1450 mm, well distributed throughout the year. The mean annual temperature is 13.2°C, the mean temperature of the coldest month (July) being 9.2°C
204 New Zealand Journal of Forestry Science Vol. 2
TABLE 2—Foliage analysis results (A90, A90c)
Plot
A90
A90c
A90
A90c
A90
A90c
A90
A90c
A90
A90c
P
0.129
0.068
0.137
0.065
0.120
0.069
0.110
0.058
0.100
0.047
Element {fo Wi)
N K Ca
1 .08
1.05
1.25
1.46
1 .21
1.07
0.96
0.96
0.70
0.75
0.55
0.87
0.70
0.70
0.85
0.91
0.21
0.13
0.16
0.16
0.24
0.15
0.25
0.14
Mg
0.18
0.20
0.17
0.10
0.11
0.12
0.20
0.10
The soil type of the area is Parau clay (New Zealand Soil Bureau, 1954) which is classified as a strongly leached brown granular clay-northern yellow brown earth intergrade formed from a deeply weathered conglomerate of dioritic pebbles, greywacke, argillite, and andesite.
METHODS
Field Work In April 1970, six profile pits were dug in the experimental area to a depth of 122 cm.
Three were dug at randomly selected spots within A90, while, of the other three, representing the control area, one was dug in A90c and the other two were dug 10 m out from the boundaries of A90, one in the buffer strip between the plots and the other on the opposite side of A90. The siting of the control profile pits straddling A90, was designed to ensure as far as possible initial comparability of samples.
Each profile was described and photographed and the decision on sampling depths made following this examination. Horizon depths were similar in all profiles and sampling depths of 0-100, 200-300 and 600-700 mm were selected to represent the A, B, and C horizons respectively. From each profile bulk and volume samples were collected from each depth:
(1) Bulk sample — a sharp knife was used to cut out two bulk samples with dimensions of approximately 10 X 15 X 15 cm. These were immediately transferred to pre-weighed plastic bags and sealed.
(2) Volume sample — two tins, each 10 cm deep and 76 cm diameter, with one sharpened open end, and the other closed but with holes in it, were gently driven into the soil. Once at full depth, the soil was cut flush with the open end.
After the soil samples had been collected from the profiles the pits were re-excavated to a depth of exactly 122 cm and left for measurement of water table depths. Once
No. 2 Ballard — Phosphate on Riverhead Clay Soil 205
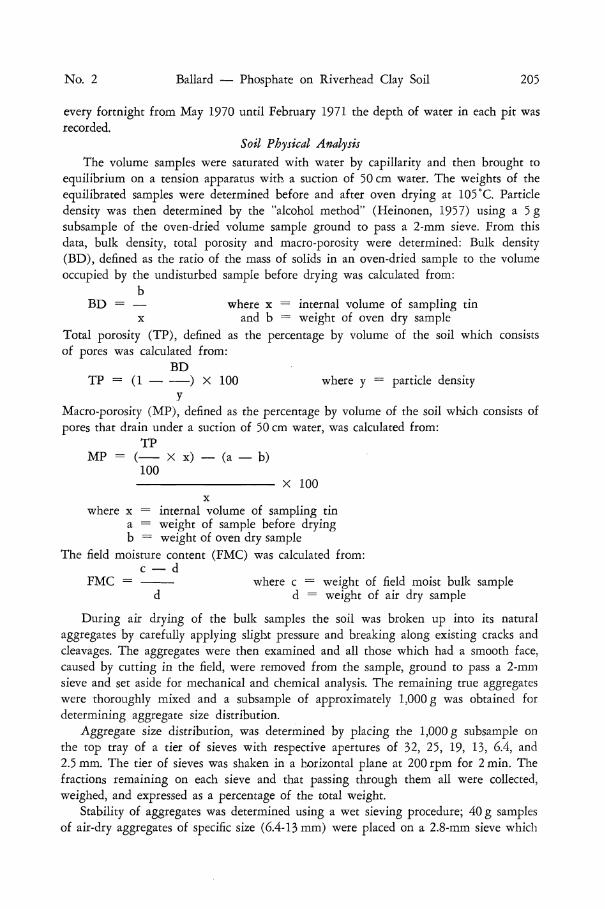
every fortnight from May 1970 until February 1971 the depth of water in each pit was recorded.
Soil Physical Analysis The volume samples were saturated with water by capillarity and then brought to
equilibrium on a tension apparatus with a suction of 50 cm water. The weights of the equilibrated samples were determined before and after oven drying at 105 °C. Particle density was then determined by the "alcohol method" (Heinonen, 1957) using a 5 g subsample of the oven-dried volume sample ground to pass a 2-mm sieve. From this data, bulk density, total porosity and macro-porosity were determined: Bulk density (BD), defined as the ratio of the mass of solids in an oven-dried sample to the volume occupied by the undisturbed sample before drying was calculated from:
b BD = — where x = internal volume of sampling tin
x and b = weight of oven dry sample Total porosity (TP), defined as the percentage by volume of the soil which consists of pores was calculated from:
BD TP = (1 ) X 100 where y = particle density
y Macro-porosity (MP), defined as the percentage by volume of the soil which consists of pores that drain under a suction of 50 cm water, was calculated from:
TP MP = ( X x) — (a — b)
100 X 100
x where x = internal volume of sampling tin
a = weight of sample before drying b = weight of oven dry sample
The field moisture content (FMC) was calculated from: c — d
FMC = where c = weight of field moist bulk sample d d = weight of air dry sample
During air drying of the bulk samples the soil was broken up into its natural aggregates by carefully applying slight pressure and breaking along existing cracks and cleavages. The aggregates were then examined and all those which had a smooth face, caused by cutting in the field, were removed from the sample, ground to pass a 2-mm sieve and set aside for mechanical and chemical analysis. The remaining true aggregates were thoroughly mixed and a subsample of approximately 1,000 g was obtained for determining aggregate size distribution.
Aggregate size distribution, was determined by placing the 1,000 g subsample on the top tray of a tier of sieves with respective apertures of 32, 25, 19, 13, 6.4, and 2.5 mm. The tier of sieves was shaken in a horizontal plane at 200 rpm for 2 min. The fractions remaining on each sieve and that passing through them all were collected, weighed, and expressed as a percentage of the total weight.
Stability of aggregates was determined using a wet sieving procedure; 40 g samples of air-dry aggregates of specific size (6.4-13 mm) were placed on a 2.8-mm sieve which
206 New Zealand Journal of Forestry Science Vol. 2
was gently shaken in a horizontal plane 40 cm below a circular shower head, delivering 120 ml/sec, for 30 min. The weight of soil retained by the sieve was obtained and expressed as a percentage of the original sample weight.
Particle size analysis was carried out by the hydrometer method (Piper, 1950) on a subsample from the soil ground to pass a 2-mm sieve.
Chemical Analysis Exchangeable cations, were determined by atomic absorption on an NH4OAc
leachate of the soil (Metson, 1956). Active iron and aluminium were determined by flame emission on a Tamm oxalate
soil extract (Blakemore, 1968). Carbon was determined by a modification of the method outlined by Metson (1956)
involving a colorimetric determination of the green trivalent chromium ion produced from the partial reduction of chromium trioxide by organic matter.
Nitrogen, was determined by the semi-micro Kjeldahl method (Metson, 1956). Total phosphorus, was extracted by the Na 2 C0 3 fusion method (Jackson, 1958). Available phosphate was extracted by the Bray No. 2 extractant using a 1 : 10,
soil : solution ratio. Phosphate in solution was determined colorimetrically by the ascorbic acid method (Watanabe and Olsen, 1965). The pH was determined at the water saturation percentage point (Jackson, 1958).
RESULTS AND DISCUSSION The most noticeable differences between these two plots, other than the rates of
tree growth, are the moisture conditions underfoot and the understorey vegetation. For most of the year the topsoil in the control plot is soft and sticky with surface waterlogging during the winter months; in the treated plot the topsoil remains firm and dry throughout the year. This moisture difference is reflected in the understorey vegetation which in the control plot consists mainly of hydrophilic rushes, sedges, and mosses, and in the treated plot of broadleaf shrubs, tree ferns, and gorse.
The difference in moisture in the two areas showed very clearly when the profile pits were being dug. Although the digging was done towards the end of an exceptionally dry summer the three control profiles were still sticky throughout their depth, and evidence of a seasonally high water table was seen in the mottled appearance of the topsoil. By comparison, the three treated profiles were firm throughout their depth and showed no signs of mottling. The three profiles in each area were very similar; descriptions of modal profiles for each area are presented in Appendix 1.
Other noticeable differences between control and treated profiles included a thicker organic layer, better developed structure, presence of abundant mycorrhizas, and generally increased fungal activity in the treated profiles. The lack of mycorrhizas in the control area but abundance in the treated area is consistent with the findings reported by Bjorkman (1970) that a severe deficiency of phosphorus, by reducing the level of soluble carbohydrates in the roots, restricts the development of mycorrhizas, but a slight deficiency, by increasing the level of soluble carbohydrates in the roots, favours their development. From a practical viewpoint, this stimulation of mycorrhizal formation is most valuable for not only does it enable utilisation of forms of phosphorus not normally available to uninfected tree roots (Rosendahl, 1942), but it also increases the uptake of other nutrients such as N and K (Hatch, 1937).
No. 2 Ballard — Phosphate on Riverhead Clay Soil 207
Physical Properties The results of the soil physical analysis are summarised in Table 3 in the form of
means and standard errors for the three profiles. (1) Moisture Status
As was expected from field appearances, the FMC of the control profiles was significantly greater than that of the treated profiles at all depths. It is noteworthy that the FMC is fairly constant with depth, in the control profiles but increases with depth in the treated profiles.
The relationship between the depths of water in the 122-cm-deep profile pits and rainfall data (collected in the open, 1 km from the site) is illustrated in Fig. 1. In both treatments fluctuations in water level correlate closely with fluctuations in rainfall, but with water table levels being consistently higher in the control pits. For much of the measurement period from May 1970 until February 1971 the water table in the control area was only 50 cm below the surface as opposed to 100 cm in the treated area. For eight out of the 18 recording dates, water was actually level with the lower lip of the profile pit dug in A90c.
The adverse effects of excess water on the growth and survival of radiata pine are well known (Sutherland et al., 1959; Poutsma and Simpfendorfer, 1962). However, at this site, excess water appears to be only a secondary cause of poor growth as the addition of P fertiliser considerably improved the vigour of the trees. This improved vigour must have assisted in water removal from the soil, through increased evapotrans-piration, which probably resulted in a further increase in growth. A chain of events similar to this has been reported in radiata pine in Australia (Raupach, 1967). (2) Soil Structure
Field examination of the profiles revealed a much better developed structure in the treated area. The results of the dry sieving were practically the same at all depths and thus the result for the 0-100 mm depth illustrated in Fig. 2 is typical for all depths.
The number of macro-aggregates (>32-mm diameter) has increased significantly at the expense of the intermediate size aggregates. Presumably some factor associated with the improved drainage and greater tree growth or a direct fertiliser effect is responsible for binding the small aggregates to form larger ones.
The results from wet sieving of the 6.4-13-mm-diameter aggregates are illustrated in Fig. 3. The water stability of aggregates in the topsoil of the treated plot is significantly greater than in the topsoil of the untreated plot. There are small differences at lower depths but they are not significant. It is not possible to identify the agents responsible for the greater stability of the aggregates in the topsoil of the treated plot, but they could be the consequence of either the improved drainage and/or the higher phosphorus levels.
(3) Porosity Total porosity of the treated topsoil is significantly greater than that of the untreated
topsoil, but the reverse situation holds in the subsoil at the 600-700 mm depth. Macro-porosity shows a similar trend with the difference between topsoils being very pronounced. The greater porosity of the topsoil in the treated area is probably a function of the improved aggregate structure. There appears to be no explanation for the greater porosity of the subsoil in the untreated area as visual examination of the profiles (Appendix 1) did not show the subsoil in the untreated area to have either a better
TABLE 3—Soil physical properties (A90, A90c). Means and their standard errors for three profiles
0-100 mm 200-300 mm 600-700 mm
Bulk density (g/cc)
Particle density (g/cc)
Total porosity (fo)
Macroporosity (fo)
Clay (fo)
Silt (fo)
Pine sand (fo)
Coarse sand (fo)
Field moisture (fo)
Loss on ignition (f>)
Munsell colour
0.82
2.21
62.7
20.4
57.1
22.7
17.5
2.2
20.0
8.7
A90
+
+
+
+
+
+
+
+
+
+
10YR4/2
0.02
0.03
0.88
1.31
1.33
1.33
1.16
0.03
3.15
0.66
A90c
0.93
2.24
58.7
7.3
53.6
22.7
19.0
2.3
44.6
8.5
+
+
+
+
+
+
+
+
+
+
2.5Y4/4
0.02
0.03
0.67
0.99
1 .22
1.33
1 .20
0.12
5.34
0.19
Diff.
* N.S.
* # • *
N.S.
N.S.
N.S.
N.S.
* N.S.
1.16
1.31
49.7
5.3
65.1
20.4
15.7
1.4
23.8
8.3
-
A90
+
+
+
+
+
+
+
+
+
+
0.03
0.03
0.67
1.76
1.53
0.37
1 .40
0.03
1 .98
0.51
A90c
1.14
2.41
52.7
4.6
57.3
22.7
18.6
2.1
43.4
8.0
_
+
+
+
+
+
+
+
+
+
+
0.02
0.02
0.88
1.15
1 .33
1.33
1 .02
0.33
7.40
0.67
Diff.
N.S.
N.S.
N.S.
N.S.
* N.S.
N.S.
N.S.
* N.S.
. 1.13
2.38
52.3
2.7
70.8
22.7
12.4
1.9
28.0
13.9
A90
+ 0.01
+ 0.01
+ 0.33
+ 1 .71
+ 4.23
+ 1.33
+ 1 .52
+ 0.57
+ 1 .58
+ 1.31
1OYR5/6
A90c
0.095
2.41
60.3
10.0
72.2
18.7
11.7
1 .0
44.3
11 .6
+
+
+
+
+
+
+
+
+
+
10YE6/6
0.02
0.01
0.66
1 .88
1.19
1.35
0.86
0.12
1.07
0.85
Diff.
** N.S.
• * *
*
N.S.
N.S.
N.S.
N.S.
**
N.S.
* Differences significant at P 0.01
** Differences significant at P 0.05
No. 2 Ballard — Phosphate on Riverhead Clay Soil
• CM
- •
s St
\\\\\\\\\\\\\\\\\\A
00
m
8 5 SB
[ l l i i i iYiYfXvXl V CO
8S ssacp
CO
R
-a MUli^
•63 ls
( uuuu) S(]OIU3d lN3W3dDSV3kM
N 3 3 M 1 3 8 TlVdNIVU
( uuuu) S l id "HOS
Nl H31VM dO Hld3Q
210 New Zealand Journal of Forestry Science Vol. 2
< CD CD
> 32
3 2 - 2 5
2 5 - 1 9
19 - 13
13 -6 -4
G 4 - 2 5
DIFFERENCE BETWEEN MEANS
P = 0 0 1
N S
N S
N S
20
FIG. 2—Aggregate size distribution (0-10 cm depth). Standard error means shown by horizontal lines.
- 0 -100 E e
eoo-ioolhx-iia
_JL_
20 30 40 50 60
% RETAINED BY 2-8 mm SIEVE
DIFFERENCE BETWEEN MEANS
K* P= 0-001
FIG. 3—Water stability of aggregates (6.4-13 mm). Standard error means shown by horizontal lines.
No. 2 Ballard — Phosphate on Riverhead Clay Soil 211
structure or evidence of greater rooting activity—in fact the reverse appeared to be the case.
The macroporosity of the topsoil in the untreated area is less than the 10% which Foil and Ralston (1967) found critical to survival and growth of loblolly pine (Pinus taeda L.) seedlings, whilst that in the treated area is well above it.
(4) Density Particle densities do not differ significantly between treated and untreated areas at
any depth. The bulk density of the treated topsoil is significantly kwer than that of the
untreated topsoil, which is probably a reflection of the differences in porosity. In terms of stand development these two sites differ by about 10-15 yr (based on differences in height) and the reduction in bulk density of the topsoil with stand development is consistent with overseas findings (Page, 1968). Associated with the inexplicable difference in porosity of the subsoils is a significant difference in bulk density.
(5) Particle Size Except for the amounts of clay at the 200-300 mm depth, the amounts of the
various particle size fractions do not differ significantly between the two soils at any depth. It is unlikely that the difference in amounts of clay at the 200-300 mm depth is the result of treatment effects and must therefore be attributed to a difference between the sites at establishment.
Chemical Properties
The results of chemical analysis carried out on the soils are summarised in Table 4 in the form of means and standard errors for the three profiles.
(1) pH The p H of the treated topsoil is significantly lower than that of the untreated topsoil,
while at the lower depths the pH values are almost identical. Conifers produce a slightly acid litter and during stand development tend to reduce the pH of the topsoil. This effect has been recorded overseas (Page, 1968) and under radiata pine in New Zealand (New Zealand Soil Bureau, I960). Although the treated and untreated stands in this study are of the same age, in terms of stand development they differ by some 10-15 yr, which, in conjunction with a possible slight acidifying effect of superphosphate, probably accounts for the lower pH in the treated topsoil.
(2) Phosphorus As expected, the total and available P levels in the topsoil of the treated plot are
significantly greater than those in the untreated plot. The Bray 2 available P in the topsoil of the untreated plot is considerably below
the 5 ppni proposed as minimal for the normal healthy growth of radiata pine (Ballard, 1970), while that in the treated plot is only slightly above the proposed critical level. This is reflected in the foliar P levels of the trees (Table 2) which in 1970 were substantially below the critical level of 0.10% in the untreated stand and equal to it in the treated stand.
(3) Cation Exchange The cation exchange capacity (CEC) at the 200-300 mm depth in the treated soil
TABLE 4—Soil chemical properties (A90, A90c). Means and their standard errors for three profiles
pH
Carbon (fo)
Nitrogen (fo)
C/N
Total P (ppm
Bray 2 P (ppm)
Tamm Fe (fo)
Tamm Al (fo)
Exchangeable
Exchangeable
Exchangeable
Exchangeable
C.E.C. (m.e.
K (
Ca
Mg
Na
f)
m.e. f)
(m.e. fo)
(m.e. f)
(m.e. fo)
4.46
4.40
0.193
22.5
182.9
5.40
0.81
0.30
0.14
1 .58
2.31
0.54
22.6
0-
A90 +
+
+
+
+
+
+
+
+
+
+
+
+
0.06
0.83
0.015
2.58
6.4
0.78
0.04
0.02
0.02
0.26
0.12
0.04
0.99
00 mm
A90c
4.67
4.21
0.213
19.7
157.7
2.30
0.82
0.24
0.20
1.75
1.81
0.25
19.1
+
+
+
+
+
+
+
+
+
+
+
+
+
0.04
0.19
0.009
0.65
9.7
0.41
0.06
0.02
0.06
0.51
0.33
0.02
2.06
Diff.
* N.S.
N.S.
N.S.
* *
N.S.
N.S.
N.S.
N.S.
N.S.
*# N.S.
4.53
2.41
0.101
23.2
87.4
0.63
0.27
0.09
C.64
1 .58
0.32
18.9
200-300 mm
A90
+
+
+
+
+
-+
+
+
+
+
+
+
0.05
0.23
0.013
0.79
31.6
0.08
0.03
0.01
0.16
0.07
0.03
0.72
A90c
4.54
2.07
0.105
19.8
95.5
0.46
0.21
0.07
0.51
1 .08
0.15
14.1
+
+
+
+
+
-+
+
+
+
+
+
+
0.02
0.14
0.008
1 .68
11 .4
0.01
0.02
0.003
0.04
0.09
0.01
1.22
Diff.
N.S.
N.S.
N.S.
N.S.
N.S.
N.S.
N.S.
N.S.
N.S.
* **
*
4.44
1.33
0.058
23.5
103.6
0.30
0.25
0.10
0.43
1.15
0.39
19.2
600
A90 +
+
+
+
+
-+
+
+
+
+
+
+
0.03
0.08
0.008
3.01
12.2
0.09
0.01
0.01
0.14
0.10
0.04
0.89
-700 mm
A90c
4.45
1.37
0.053
26.8
93.9
0.22
0.22
0.08
0.25
1 .13
0.23
16.9
+
+
+
+
+
-+
+
4-
+
+
+
+
0.01
0.14
0.009
3.57
14.0
0.06
0.01
0.01
0.09
0.13
0.04
0.79
Diff.
N.S.
N.S.
N.S.
N.S.
N.S.
N.S.
N.S.
N.S.
N.S.
N.S.
N.S.
N.S.
Differences significant at P 0.01
Differences significant at P 0.05
No. 2 Ballard — Phosphate on Riverhead Clay Soil 213
is significantly greater than that in the untreated soil. This is probably a reflection of the greater amounts of clay in the treated soil at the 200-300 mm depth, and thus cannot be attributed to a treatment effect. The differences in CEC are not significant at the 0-100 mm and 600-700 mm depths.
The only signicant differences between individual cations are in the amounts of Na at the 0-100 mm and 200-300 mm depths, and the amounts of Mg at 200-300 mm depth. The difference between the amounts of these two cations at the 200-300 mm depth in the treated and untreated soils may be connected to the differences in CEC at this depth. There is no readily apparent explanation for the differences in Na at the 0-100 mm depth, where the amounts in the treated soil are twice those in the untreated soil. It is suspected, however, that this difference may possibly be related to greater interception of salt bearing winds by the taller trees in the treated plot.
(4) Others All other chemical properties examined—amounts of carbon, nitrogen, and active
iron and aluminium—do not differ significantly between treated and untreated soils at any depth.
GENERAL DISCUSSION
Other than for the phosphorus levels, which were expected, the major differences between the soils of the treated and untreated areas are in their physical properties.
The response of the trees growing on the treated area should not be attributed solely to the increased P supply provided by the fertiliser. Initially this may have been the case, but the growth response by lowering the water table and improving structure and macroporosity must have facilitated the exploitation of a greater soil volume by the roots. This would have produced an additional response through increasing the availability of the native P which is governed by both concentration of available P and the volume of soil exploited by the roots. Further, the improved aeration in conjunction with the added fertiliser P promoted the formation of mycorrhizas which would have produced an added response by increasing the utilisation of both native and applied P.
At present, problems are being encountered during the establishment of second rotation crops of radiata pine at Riverhead because of low soil P levels and the poor physical conditions of the soil. We can alleviate the P problem by applying fertiliser, but often, because of the poor structure and drainage of the soil, the seedlings take a year or more to establish themselves and reach the stage where they can effectively utilise the applied P. Thus any improvements in both the P status and physical properties of the soil brought about by the addition of fertiliser to the first rotation crop will probably have a profound influence on the establishment and initial growth performance of the second rotation crop. It is obvious from the available P levels that large P dressings are likely to have substantial carry-over effects even 20 yr after application. The physical properties known and reported to be of importance to seedling survival and growth, drainage (Leyton and Rousseau, 1958), structure, and macroporosity (Foil and Ralston, 1967; Atkinson, 1959) were found to be considerably improved; whether those improvements can withstand the impact of logging and site preparation operations remains to be seen.
In the USA, Trousdell and Hoover (1955) found that after clearfelling a loblolly
214 New Zealand Journal of Forestry Science Vol. 2
pine stand the water table rose to higher levels than in an adjoining area where the forest was left standing. Assuming that increased evapotranspiration is mainly responsible for lowering the water table, we may also expect a rise in the water table following removal of the tree crop. There can be little doubt that the soil disturbance and compaction occurring during logging operations will produce a deterioration in the soil structure and macroporosity, although the extent of the deterioration will probably depend largely on the weather; the wetter the conditions the greater the deterioration. Since the soil aggregates in the treated area were found to have a considerably gerater water stability, areas which have been previously topdressed will probably be less susceptible to logging damage. Nevertheless it is still advisable to restrict logging operations on these clay soils to drier periods or at least to keep soil disturbance to a minimum; Hatchell et al. (1970) found that on moist finer textured soils, logging damage was minimised by restricting extraction routes to a few major tracks.
ACKNOWLEDGMENTS
The author thanks Messrs J. D. Graham, A. Eversfield, and G. Oliver, who assisted in the field work and laboratory analysis of the samples. Thanks are also accorded to the staff at Riverhead Forest for carrying out the water depth determinations.
REFERENCES ATKINSON, I. A. E. 1959: Soils and growth of Pinus radiata at Corn Wallis, Auckland. New
Zealand Journal of Science, 2: 443-72. BALLARD, R. 1970: The phosphate status of the soils of Riverhead Forest in relation to
growth of radiata pine. New Zealand Journal of Forestry 15 (1): 88-99. BJORKMAN, E. 1970: Forest tree mycorrhiza—the conditions for its formation and its
significance for tree growth and afforestation. Plant and Soil 32: 589-610. BLAKEMORE, L. C. 1968: Determination of iron and aluminium in Tamm's soil extracts.
New Zealand Journal of Agricultural Research 11: 515-20. FOIL, R. R., and RALSTON, C. W. 1967: The establishment and growth of loblolly pine
seedlings on compacted soils. Proceedings, Soil Science Society of America 31: 565-68.
HATCH, A. B. 1937: The role of mycorrhizae in afforestation. Journal of Forestry 34: 22-9. HATCHELL, G. E.; RALSTON, C. W., and FOIL, R. R. 1970: Soil disturbances in logging-
effects on soil characteristics and growth of loblolly pine in the Atlantic coastal plain. Journal of Forestry 68: 772-5.
HEINONEN, R. 1957: On the specific gravity of Finnish soils. Journal of Science, Agricultural Society of Finland, 29: 38-40.
JACKSON, M. L. 1958: "Soil Chemical Analysis". Prentice-Hall, Inglewood Cliffs, N.J. LEYTON, L., and ROUSSEAU, L. Z. 1958: Root growth of tree seedlings in relation to
aeration. Physiology of Forest Trees Symposium, Harvard 1957: 467-75. METSON, A. J. 1956: Methods for chemical analysis for soil survey samples. New Zealand
Soil Bureau Bulletin n.s. 12. New Zealand Soil Bureau, 1954: General survey of the soils of the North Island, New Zealand.
New Zealand Soil Bureau Bulletin 5. New Zealand Soil Bureau, 1960: Soils, forestry and agriculture of the northern part, Kainga
roa State Forest and Galatea Basin. New Zealand Soil Bureau Bulletin 18. PAGE, G. 1968: Some effects of conifer crops on soil properties. Commonwealth Forestry
Review 47: 52-62. PIPER, C. S. 1950: "Soil and Plant Analysis" University of Adelaide, Adelaide. POUTSMA, T., and SIMPFENDORFER, K. J. 1962: Soil moisture conditions and pine failure
at Waare, near Port Campbell, Victoria. Australian Journal of Agricultural Research, 13: 426-33.
RAUPACH, M. 1967: Soil and fertiliser requirements for forests of Pinus radiata. Advances in Agronomy 19: 307-53.
ROSENDAHL, R. 0. 1942: The effect of mycorrhizal and non mycorrhizal fungi on the availability of difficultly soluble potassium and phosphorus. Proceedings, Soil Science Society of America 7: 477-9.
SUTHERLAND, C. F.; LEVY, C, and NEWHOOK, F. J. 1959: The association of Phytoph-thora with the mortality of Pinus radiata and other conifers. New Zealand Journal of Agricultural Research, 2: 844-58.
TROUSDELL, K. B., and HOOVER, M. D. 1955: A change in ground water level after clearcutting of loblolly pine in the coastal plain. Journal of Forestry, 53: 493-8.
WATANABE, F. S., and OLSEN, S. R. 1965: Tests of an ascorbic acid method of determining phosphorus in water and NaHC0o extracts from soils. Proceedings, Soil Science Society of America 29: 677-8.
WESTON, G. C. 1956: Fertiliser trials in unthrifty pine plantations at Riverhead Forest. New Zealand Journal of Forestry 7: 35-46.
APPENDIX 1
A90 Profile Description
Identification: Modal profile A90 Location: Plot A90, Cpt 12, Riverhead Slope: 10° Aspect: SSW Altitude: 150 m Rainfall: 1450 mm Parent Material: Weathered conglomerate of andesite and greywacke. Dominant Vegetation: Radiata pine, silver fern, gorse, Geniostoma ligustrifolium O 40-0 mm Decomposing litter A 0-200 mm Dark greyish brown (10YR4/2) clay, with some brown coating on ped and
root channel interfaces; moderately developed crumb and nutty structures with many vertical cracks; firm; abundant roots and abundant fungal hyphae along all structural faces; few earthworm casts; diffuse boundary,
B 200-600 mm yellowish brown (10YR5/6) clay with some diffuse brown mottles; abundant black speckles from worm casts and root holes; moderately developed granular and nutty structures within coarse prismatic structure; firm to sticky; abundant roots and mycorrhizal hyphae; indistinct boundary,
C 600 mm yellowish brown (10YR5/6) clay with white speckles increasing with depth and merging with red speckles and brown weathered rocks below 100 cm; weakly developed nutty structure within weakly developed prismatic structure, firm to sticky; some roots but no mycorrhizas.
Soil Type: Parau clay Classification: Strongly leached brown granular clay—northern yellow brown earth inter
216 New Zealand Journal of Forestry Science Vol. 2
Parent Material: Weathered conglomerate of andesite and greywacke Dominant Vegetation: Radiata pine, Gahnia, rushes, and ferns 0 10-0 mm Decomposing litter A 0-200 mm Olive brown (2.5Y4/4) clay with abundant strong brown (7.5YR5/6)
mottles; sticky; very weakly developed crumb to platy structure; a few earthworm casts; sparse roots and no mycorrhizas; diffuse boundary,
B 200-600 mm brownish yellow (10YR6/6) clay; few strong brown bottles and dark olive grey earthworm casts; massive with very weakly developed platy structure; sticky; very few roots; indistinct boundary,
C 600 mm brownish yellow (10YR6/6) clay with some white speckles which increase in frequency with depth; strong brown (7.5YR5/8) and dusky red (10R3/3) weathered rocks appear below 100 cm; massive; sticky; no roots.
Soil Type: Parau clay Classification: Strongly leached brown granular clay—northern yellow brown earth inter