INFLUENCE OF ACETIC, PROPIONIC, NORMAL BUTYRIC ANDSULPHURIC ACIDS AND POTASSIUM ACETATE ON
ELONGATION OF PRIMARY ROOTS OF SEED-LINGS OF WHITE LUPINE*
MARY COGGESHALL
(WITH TWELVE FIGURES)
CONTENTS
INTRODUCTION .......................................................................................................................................................... 391METHODS AND PROCEDURE.395
THE EXPERIMENTROOM.. 395PREPARATION OF SEEDLINGS.396
THE STANDARD NUTRIENT SOLUTION.397THE EXPERIMENT SOLUTIONS.398
EXPERIMENTAL VARIABLES AND BACKGROUND CONDITIONS.398PREPARATION OF THE EXPERIMENT SOLUTIONS.399HYDROGEN-ION CONCENTRATIONS OF THE SOLUTIONS (fig. 1).400
THE EXPERIMENT PERIODS AND THE INDICES OF ROOT ELONGATION.402GENERAL PLAN OF EXPERIMENTATION .402THE TREATMENT PERIOD.402THE RECOVERY PERIOD.404
ROOT ELONGATION IN THE CONTROL CULTURES.405THE MARCH OF ROOT ELONGATION IN CONTROLS WITH STANDARD NUTRIENT
SOLUTION AT 200 (fig. 2) ........................................................................................................................ 405INFLUENCE OF SLIGHT TEMPERATURE FLUCTUATIONS ON ROOT ELONGATION IN
NUTRIENT SOLUTION CONTROLS.......... 406CONTROLS WITH DISTILLED WATER (fig. 3) .......... 407
RESULTS.1410GENERAL STATEMENTS.410RESULTS WITH ACETIC ACID.411
ACETIC ACID IN NUTRIENT SOLUTION (table I, fig. 4).411ACETIC ACID IN DISTILLED WATER (table II, fig. 4).415
* Botanical contribution from the Johns Hopkins University, no. 114.
ACETIC ACID AT CONTINUOUSLY INCREASING CONCENTRATION IN NUTRIENTSOLUTION (fig. 5) ...................................................................... 416
RESULTS WITH PROPIONIC ACID IN NUTRIENT SOLUTION (table III, fig. 6) ..................... 418
RESULTS WITH NORMAL BUTYRIC ACID IN NUTRIENT SOLUTION (table IV, fig. 7) ...... 421RESULTS WITH SULPHURIC ACID IN NUTRIENT SOLUTION (table V, fig. 8) ..................... 423RESULTS WITH POTASSIUM ACETATE IN NUTRIENT SOLUTION (table VI, fig. 9) ......... 425ASSEMBLED GRAPHS FOR ALL SERIES BASED ON STANDARD NUTRIENT SOLUTION
(figs. 10 and 11) .......... ............................................................. 427COMPARATIVE TOXICITIES OF THE FIVE COMPOUNDS STUDIED ......................................................... 428
CONCENTRATIONS SHOWING GROWTH RETARDATION OF 50 AND OF 90 PER CENT.IN THE TREATMENT PERIOD ............... ....................................................... 428
TIME RELATIONS OF TOXICITY AND STIMULATION ...................................................................... 428
THE POSSIBILITY OF SYNERGISTIC EFFECTS ............................................... ....................... 430RELATIONS BETWEEN DIRECT EFFECTS AND AFTER EFFECTS ................................................... 430
RELATIONS BETWEEN PHYSIOLOGICAL INFLUENCE AND HYDROGEN-ION CONCENTRA-TION ....................................................................... 433
THE GENERAL PROBLEM OF ION AND MOLECULE CONCENTRATIONS .............................. 433
COMPARISONS OF THE FIVE SERIES OF SOLUTIONS WITH RESPECT TO TOXICITY,pH VALUE AND CONCENTRATION OF ADDED COMPOUNDS (table VII,fig. 12) ........ ............................................................... 434
The influence of chemical compounds upon growth and development oforganisms is of unfailing interest. The natural environment is continu-ously supplying the organism with innumerable water-soluble compounds,some of which are essential to nutrition and health while others are notessential. Any of them may be injurious if absorbed too rapidly or in toolarge an amount. Their absorption rates depend in large measure on theirconcentrations in the surroundings. Many substances that have markedlyinjurious effect when supplied to an organism in one concentration rangehave been found to stimulate or accelerate growth and other activities whensupplied in a lower concentration range. Too high concentrations ofusually essential compounds are harmful but physiological processes even-tually become retarded or upset when the essential compounds are inade-quately supplied. Large numbers of apparently unessential chemical com-pounds are commonly present in organisms and in their surroundingswithout producing any physiological effect, either of retardation or stimu-lation, but any of these may have a marked effect if its concentration issufficiently increased. Furthermore, the kind and amount of influenceexerted by a specified compound at a specified concentration on a givenorganism in a given stage of development or physiological state is itselfgreatly influenced by the prevailing concentrations of other compounds.The favorable or unfavorable influence of a certain compound at a specifiedconcentration in the environment may be greatly altered in many instanceswithout any change in the concentration of the compound in question,through suitable alterations in the concentrations of other compounds.Finally, different kinds of organisms or individuals of the same kind inunlike developmental phases or with different degrees of vigor may beaffected very differently by one and the same set of chemical concentrationsin the surroundings.
Various aspects of the chemical relations of organisms have been studiedby many investigators. The whole science of pharmacology and the con-tinually expanding study of antiseptics and their applications deal withthese chemical relations. Applied plant pathology and the control of in-sect pests offer innumerable problems of differential toxicity. From thestandpoint of agronomy and horticulture the chemical relations betweenhigher plants and the chemical compounds in the soil solution have receiveda very large amount of attention. The study of the mineral nutrition ofplants deals wholly with chemical relations and chemical influences andupon its findings since the time of LIBIG have been built up modern ferti-lizer practice and the great fertilizer industries. Research in this generalfield continually results in new knowledge and leads to new applications,
while practical investigations result in scientific as well as practical ad-vance. Some of the most fundamental theoretical conceptions of physiol-ogy are largely based on knowledge of chemical retardation and stimulationgained through experiment; for example permeability, enzyme action, nar-cosis, anaesthesia, the breaking of physiological dormancy and manyothers.
The nature of the problems concerning chemical influence on organismsis such that any single experimental investigation must necessarily be con-fined to a small number of compounds if many different concentrations arestudied or else to few concentrations of each compound if many compoundsare dealt with. Also, it is usually feasible for an investigator to work withonly one kind of plant or animal or with but a few different forms, andwith only one or a very few different developmental or physiological phasesof any organism. Many plant forms have been studied in this connectionby different workers, ranging from bacteria, fungi and algae to such plantsas maize and sunflower. For the higher plants soil: cultures and solutioncultures have been employed to bring out the various influences exerted bysolutes in the aqueous solution about the plant roots. Only rather recentlyhave the influences exerted by gaseous compounds in the air about plantparts been subjected to extensive study, especially in connection with theripening of fruits and other plant products in storage. The substancesalready mentioned in the literature of chemical influence represent almostthe entire range bf chemical compounds, from the simplest inorganic saltsand carbon compounds like carbon monoxide, carbon dioxide and ethyleneto the most complex substances with which chemical science struggles, likeproteins, alkaloids and glucosides.A vast literature is available concerning the influence of inorganic com-
pounds on plants. Some of these compounds supply essential nutritiveelements, as nitrates, phosphates and sulphates of potassium, calcium andmagnesium. These and others are commonly present in the soil solution,sometimes in highly injurious concentrations, and still others have beenstudied primarily to throw light on the general theory of toxicity andstimulation. In Sztcs's article (26) may be found a discussion of antag-onistic ion absorption in plants. A general summary of our knowledgeof inorganic plant poisons has been made available by WINIFRED BRENCH-LEY (1).
Organic compounds have received much attention, especially in connec-tion with applied science, as in medicine, in the search for new antisepticsand in the field of stimulants, narcotics and anaesthetics. Many carboncompounds have been studied to some extent in connection with the prob-lems of nutrition and of biochemistry in general. Substances that usually
occur in the plant or animal body or in natural environments have at-tracted much attention at the hands of experimenters. Studies have beenmade on some of the simpler organic compounds as they may influence bac-teria, fungi or lower animal forms. Much fundamental research on loweranimals has been devoted to the lower fatty acids and related substances,especially with reference to permeability and cell division.A few recent papers may be mentioned. MARY E. COLLETT (5) studied
the influence of organic and inorganic acids on Parantoeciurn and Euplotes.CROZIER (6) studied the permeability of the cells of Chromodoris zebrawith reference to several aliphatic acids. H. WV. SMITH (25) studied theinfluence of these acids on cell division in eggs of Echinarachnius. LUCKEand MNCCUTCHEON (17), working with Arbacia eggs, related the rate ofpenetration of salts of organic acids to valency and other molecularcharacteristics.
Much attention has been given to the toxicity of fatty acids in relationto bacteria and fungi (KR6NIG and PAUL, 15; TAYLOR, 27.). J. F. CLARK(3) studied toxicity with reference to some filamentous fungi, finding,among other things, that acetic acid was more toxic than the common min-eral acids. DUNN (8), working with the fungus Sclerotinia cinerea,thought hydrogen-ion concentration was the main factor determining thetoxicity of the common mineral acids but that it was of only secondary im-portance in determining toxic action due to the simple fatty acids. UPPAL(32) studied the influence of various organic acids on the germination ofspores of Phytophthora colocasiae.
Some organic acids have been studied with regard to their influence onthe growth of higher plants. KAHLENBERG and TRUE (14), HEALD (10),KAHLENBERG and AUSTIN (13), TRUE (30) and CAMERON and BREAZEALE(2) experimented with white lupine, pea, maize, wheat, clover, etc.DACHNOWSKI (7) studied the influence of organic acids on the rate of trans-piration of tomato plants. MACHT and his co-workers have employed rootelongation in young seedlings of white lupine as an indicator of the relativetoxicities of many organic compounds (MACHT and MARGUERITE B. LIV-INGSTON, 20; MACHT and HARRIET P. LEACH, 19) and biological prepara-tions (MACHT and DOROTHY LUBIN, 21; MACHT and W. T. ANDERSON, 18).MACHT has suggested the term "phytopharmacology" to mean the studyof toxicities or other influences by means of plant organisms as indicators.ELSENMENGER (9) studied the toxic effects of a number of aliphatic alco-hols in nutrient solution, on the rate of root elongation of soy-beanseedlings.
In many studies concerning the influences of organic compounds onplants only a few different concentrations of each of the substances in ques-
tion have been tested and attention has been chiefly confined to lethal con-centrations. Comparatively little attention has usually been given to therequisite standardization of the plant material employed or to the back-ground conditions of the experiments. For these and related reasons andbecause most investigators in this field have chosen plant material mark-edly different from that used by others, very little progress has thus farbeen made toward any general understanding of even the simplest organiccompounds in their relation to plants. Systematic study in this field hashardly begun and suitable technique for it remains mostly to be developed.The obvious necessities are: (1) That the plant material used should be asnearly the same as possible for the beginning of all comparable tests andshould be so described as to permit repetitions of the experiments. (2)That all comparable experiments should be performed on material in thesame developmental phase or stage of maturity-preferably a phase inwhich the rate of the physiological process to be measured does not auto-matically alter too much, in the healthy material used for controls, withinthe experiment period, or alters only in ways that may be satisfactorilytaken into account in comparing the numerical results. (3) That theduration factor (lengths of observation intervals and exposure periods)should be given just as serious consideration as is accorded to any otherinfluential feature. (4) That the background conditions of the environ-ment for all comparable tests should be just as adequately controlled, orat least just as thoroughly specified, as are the experimental variablesthemselves, repetition of otherwise fairly satisfactory experiments not in-frequently being rendered impossible because background conditions havenot been suitably defined. (6) That the experimental variables (the com-pounds to be tested and their concentrations) should be adequately speci-fied. (7) Finally, that the effects or responses of the plant material to thevarious treatments or environmental complexes should be measured withadequate precision and should be recorded in suitable terms for convenientcomparison. The last two desiderata are commonly well cared for in ex-
perimentation but at least some of the others are apt to receive but scant
attention. It is of course impossible as yet to fulfill all these requirementsfor ideal experimentation but it is surely desirable now to go as far towardthe ideal as may be permitted by circumstances and facilities and by thenature of the research in question.
The study reported in this paper was largely an attempt to develop a
fairly consistent and feasible technique for studying the concentration rela-tions of chemical compounds to the elongation of the primary roots of whitelupine seedlings. All the seedlings used were very nearly alike, havingbeen grown from selected seeds under standard conditions. Their primary
roots were of nearly the same length and were in that developmental phasein which the rate of their elongation is automatically maintained for a longtime with a maintained environment favorable to health. The treatmentor exposure period, during which a chemical compound was present in thesolutions around the roots, was of such length that control roots in stand-ard nutrient solution always showed a definite increment of elongation inthat period. The external background conditions were specified in termsof a standard nutrient solution, a maintained temperature and a standardexperimental procedure. The three simplest aliphatic acids, the potassiumsalt of one of them and one mineral acid were the compounds tested, witha large number of concentrations of each compound. In each case the con-centrations tested were so chosen that the entire concentration range fromzero to the concentration that inhibited root growth in the treatmentperiod was well represented. The results consequently furnish a pictureof the manner in which the influence of each compound depended on itsconcentration.
This experimentation was carried on in the Laboratory of Plant Physi-ology of the Johns Hopkins University, with advice and guidance from thedirector of that Laboratory, Professor BURTON E. LIVINGSTON. The writerwishes to express her thanks to Professor LIVINGSTON for facilities andequipment as well as for many helpful suggestions concerning procedureand technique, and especially for help in the interpretation of results andin the preparation of this paper.
Methods and procedureTHE EXPERIMENT ROOM
All the experiments of this study were performed in the basement darkroom of the Johns Hopkins Laboratory of Plant Physiology. There wassome movement of air around the frame of the shuttered window andthrough the three-door labyrinth but no light entered the room. It wasalways dark excepting for a period of about three hours each day, when a50-watt electric light was in operation, for observation and manipulation.The air temperature of this room remained nearly constant for long periodsof time but when suitably placed thermographs showed lowering tempera-ture an electric heater was brought into operation. Thus the air aroundthe cultures was maintained between 18.80 and 21.00, but the fluctuationfor any single experiment was not as great as is indicated by these limits.A standardized white spherical atmometer situated near the cultures lostfrom about 13 ml. to about 20 ml. per day, which indicates low, rather uni-form evaporation intensity.
PREPARATION OF SEEDLINGSSEED GERMINATION.-The plant material used was seedlings of white
lupine (Lupinus albus L.) with primary roots about 30 mm. long. Thesehad all been grown from the same lot of seed, supplied by the VaughanSeed Store, in Chicago, and stored in the experiment room. The seeds ofthis lot were very uniform in color, form and size-about 8 mm. in diame-ter and 3 mm. thick-and showed a germination percentage of 98 for theconditions employed. There was no evidence of any seed deteriorationthroughout the period of the study.
For each set of experiments, requiring 90 or 105 selected seedlings,about 400 seeds were soaked 24 hr. in tap water at a temperature of20 + 20 and were then planted in the germinators. These were cylindri-cal glass pans 22 cm. in diameter and 8 cm. high, containing washed quartzsand of medium fineness moistened with 5 ml. of standard nutrient solutionfor each 100 ml. of sand. This medium had a volumetric water-holdingpower of 29.6 per cent., according to the HILGARD test (12) with a 1-cm.column. At the beginning of the study and after each period of use thesand and the germinator pans were thoroughly washed with distilled waterand allowed to drain. The sand was spread out on paper in the green-house, where it became air dry and ready for use.
Sand, moistened with nutrient solution, was rather firmly packed in thegerminator pan to a depth of about 5.5 cm. Approximately 175 soakedseeds were pressed, micropyle down, half way into the smoothed surface,after which air-dry sand was added to fill the pan level with the top. Atthe end of a germination period of about 48 hr. the dry sand was pouredoff and the seedlings were lifted by means of bone-tipped forceps appliedto the cotyledons and all apparently unusual seedlings were discarded.
Each of the selected seedlings from the sand culture was rinsed instandard nutrient solution and its root length was measured before it wasplaced in the preliminary solution culture. For any set of experimentsthe root lengths were all alike within plus or minus 2 mm. and the wholerange of root lengths at this stage was only from 15 mm. to 22mm.Throughout these operations the roots were kept pointing downward andwere not allowed to come in contact with the 15-cm. celluloid metric scaleused in their measurement. About 35 acceptable seedlings with straightroots of the required length were obtained from each 100 seeds originallyplanted.
PRELIMINARY SOLUTION CULTURES.-For the preliminary solution cul-tures cylindrical stone-ware jars ("butter crocks") 30 cm. in diameter and17 cm. deep were used as containers, each with a multiperforate circularcover of reinforced paraffin about 8 mm. thick. This paraffin plate was
prepared from quarter-inch galvanized iron wAire netting by filling andheavily coating with paraffin. The perforations were made with a corkborer. Each plate bore about 200 seedlings, identified by India-inknumerals on the paraffin. The plantlets were supported by their cotyle-dons, each root and hypocotyl extending downward through one of the per-forations and dipping into the solution to a depth of at least 8 mm. Eachjar contained enough standard nutrient solution to bring the liquid surfacenearly up to the plate. The seedlings remained in preliminary culture,where root elongation proceeded at a mean rate of somewhat over 1 mm.per hour until the roots were about 30 mm. long and the hypocotyls about10 mm. They were then removed, measured, recorded and placed in theexperiment tubes for the treatment period. At this transfer only thoseseedlings were used which had straight roots 30 ± 2 mm. long. About 25of these standard seedlings were thus obtained from each hundred seedsoriginally planted.
In measuring for this selection, as well as for subsequent growth rates,only the roots were considered. The hypocotyls attained a length of about10 mm. in the preliminary culture, as has been said, and their subsequentelongation was practically negligible until the roots had attained a lengthof about 70 mm. Measurements were from the root tip to the easily visiblering or collet that marks the junction of root and hypocotyl in seedlingsof this species. Because the collet is somewhat irregular, all measurementsof each particular root were made on the same side, orientation beingsecured by reference to the plane of the cotyledons. Throughout the studythe maximum error of measurement was not more than 1 mm.
THE STANDARD NUTRIENT SOLUTION
The nutrient solution used as standard throughout this study was ofSHIVE'S (24) 3-salt type. It was prepared with distilled water from aBarnstead still and "C. P." crystalline salts, the latter supplied by the J.T. Baker Chemical Co., of Phillipsburg, New Jersey. Each liter of thestandard solution contained 0.820 g. (0.0050 mol.) of Ca (NO3),, 0.9395 g.(0.0069 mol.) of KH2PO4, and 1.128 g. (0.0094 mol.) of MgSO4. The pos-sible error for each salt was not over 0.6 per cent. in any instance. No ironwas added. This solution had been calculated to have equal osmotic pro-portions of the three salts and a total osmotic value of about one atmosphereat 200. It produced very satisfactory growth in the seedlings of this studybut no attempt was made to find an optimal solution and it of course re-mains possible that some other combination of these or other salts mighthave produced even more vigorous root growth. Several preliminary ex-periments showed that the total concentration of this solution might be as
much as 25 per cent. higher or lower without significant alteration in rootelongation.
An 18-1. lot of solution of each salt lasted throughout the entire study.The three single-salt stock solutions were stored in as many 5-gallon bottlesin the experiment room. Each bottle had a rubber stopper bearing an airinlet, guarded by a calcium-chloride tube, and a siphon for removal of solu-tion. The siphon was provided with a bit of rubber tubing bearing a Mohrpinch cock and a short glass tip.
The molar concentrations of the single-salt solutions, as ascertained bygravimetric analysis (TREADWELL and HALL, 28) were as follows: 0.500mol. KH2PO4, 0.532 mol. Ca(NO3)2 and 1.005 mol. MgSO4. The standardnutrient solution was prepared volumetrically from these single-salt solu-tions, usually 18 1. being made up at weekly intervals, or more often. Itwas stored like the single-salt solutions in the experiment room.
THE EXPERIMENT SOLUTIONS
EXPERIMENTAL VARIABLES AND BACKGROUND CONDITIONS.-By means ofspecified experiment solutions the physiological effects of the five com-pounds studied were ascertained by tests. These effects were of coursemeasured in terms of the root elongation of standard seedlings. In themain part of the study the effect of each experiment solution was measuredby comparing the amount of root elongation that occurred in it with theamount that occurred at the same time in standard nutrient solution with-out any added compound. In a single series of experiments distilled waterwas used instead of standard nutrient solution and the control medium forthese was of course distilled water without any added substances at all.All experiment solutions in any series were qualitatively alike at the startfor all tests but differed with regard to the concentration of the sin-gle added compound. The six series of experiment solutions are set forthbelow, with the number of different solutions in each series.
Series 1. Standard nutrient solution plus acetic acid at various con-centrations. 35 solutions.
Series 1 A. Aqueous solutions of acetic acid. 19 solutions.Series 2. Standard nutrient solution plus propionic acid at various
concentrations. 28 solutions.Series 3. Standard nutrient solution plus normal butyric acid at vari-
ous concentrations. 28 solutions.Series 4. Standard nutrient solution plus sulphuric acid at various
concentrations. 18 solutions.Series 5. Standard nutrient solution plus potassium acetate at vari-
In each series of experiments there was just one experimental variable,the concentration of the added compound, and all other influential condi-tions were approximately alike for the beginning of all tests in that series.When different series of the main group (Series 1, 2, 3, 4, 5) are comparedtwo experimental variables have to be considered, the nature of the addedcompounds and their respective concentrations. When the series based ondistilled water (1 A) is compared with any other series, the complex of thethree nutrient salts is of course an experimental variable. Excepting theexperimental variables and the process rate that was to be measured(elongation of primary root), all variables were approximately alike at thebeginning of all tests; that is, they are to be regarded as constants for anyseries and for all series. These constitute the experimental background;they were either maintained within limits of fluctuation set by the generaltechnique or else they altered during the tests in ways determined by theinteraction of seedling and solution. Among the approximately main-tained background conditions of the environment were temperature, light,evaporational intensity and oxygen supply. The internal characteristicsof the standard seedlings were approximately alike at the start of all testsbut they naturally altered with time and in accord with the influences ex-erted by the several experiment solutions.
It should be mentioned that the experiment solutions all altered whilein contact with the roots. A liquid medium surrounding a living rootchances in many ways, through the absorption of molecules and ions by theroot and through the escape of molecules and ions from the root. To avoidthis troublesome consideration it would have been necessary to arrange forthe experiment solutions to flow continuously around and past the roots atadequate rates. This aspect of the technique of physiological experimen-tation has been emphasized by TRELEASE and LIVINGSTON (29) and somelater writers, but its introduction would necessarily narrow the field of anyexperimental study. This difficulty is sometimes avoided to some extentby renewing the experiment solutions at intervals, if the experimentperiods are of suitable length, but other troublesome considerations arethereby introduced.
PREPARATION OF THE EXPERIMENT SOLUTIONS.-The experiment solu-tions were prepared from standard nutrient solution or distilled water andsimple stock solutions of the five chemical compounds whose influences onroot elongation were to be studied. The acetic acid (CH3COOH) used wasMerck's "C. P.," 99.5 per cent. The propionic acid (CH3CH2COOH)was from the Eastman Kodak Co., with boiling point 140-142°. The nor-mal butyric acid (CH3CHCH2COOH) was from the same source, withboiling point 161°-163°. The sulphuric acid (H11S04) and the potassium
acetate (CH3COOK) were from the J. T. Baker Chemical Co., the formerbeing " C. P., " 93.5-9a.9 per cent. and the latter " C. P.," Baker's ana-lyzed. The stock solutions had the following concentrations, as ascertainedby titration:
CH3COOH, 0.12096 N.CH3CH2COOH, 0.16120 N.CH3CH2CH2COOH, 0.09428 N.HSO4, 0.08611 N.
0.1272 N.CH3COOK 0.3046 N.
These were made up with distilled water and were stored in glass bottlesin the experiment room.
The experiment solutions based on standard nutrient solution weremade volumetrically, by diluting the proper simple stock solution withstandard nutrient solution to the required degree. For the lower concen-trations of the added compounds this was accomplished by several steps.The corresponding dilution of the nutrient solution was considered as neg-ligible; for the most concentrated experiment solutions this dilution neveramounted to more than 7 per cent. No experiment solution containing thenutrient salts was ever stored longer than one week.
The experiment solutions based on distilled water without nutrient saltswere prepared from the simple stock solutions just as the others were, ex-cepting that water was used instead of standard nutrient solution.
The actual concentrations of the added compound in each series of ex-periment solutions are shown in tables I-VI, expressed in terms of mil-lionths normal. Thus 2,560 millionths normal means the same as 0.002560N. Of course a solution so designated has 2,560 millionths of a hydrogenequivalent of the specified solute in each liter of solution. Normal andmolar values are identical for the three organic acids and potassium ace-tate, but a normal-concentration value is numerically twice as great as thecorresponding molar-concentration value in the case of sulphuric acid.
HYDROGEN-ION CONCENTRATION OF THE SOLUTIONS.-Approximate hydro-gen-ion concentrations of representative samples of each series of experi-ment solutions containing the nutrient salts were determined by thecolorimetric method of W. M. CLARK (4, p. 38). No buffer was added sinceall these solutions contained KH2PO4 at a concentration of about 0.0023normal. The results, expressed in terms of the pH scale, are plotted infigure 1 with graphs showing the general trends indicated by the points.
From this figure it may be seen that the pH value for the standardnutrient solution was 4.4 and that all the solutions of every series were
l CONCENTRATION, MILLIONTHS NORMAL IFIG. 1. Graphs showing approximate relations of concentration of added compound to
pH value in each of the five series of modified nutrient solutions.
markedly acid. Of the five added compounds only potassium acetate pro-duced solutions of pH values above 4.4. The addition of that salt, even invery small concentration, raised the pH value markedly. As would be ex-pected from its chemical nature, sulphuric acid produced a marked lower-ing of the pH values of the nutrient solutions to which it was added, evenwhen present in very low concentration. With progressively greater con-centrations potassium acetate and sulphuric acid were less effective inaltering the hydrogen-ion concentration of the nutrient solution to whichthey were added. It is interesting to note that these two graphs are nearlysymmetrical about the horizontal line for 4.4, the graph for sulphuric acidlying above that line and the one for the acetate below.
The approximate graphs for the three organic acids appear in figure 1as straight lines sloping upward to the right of their points of intersectionwith the horizontal line for the pH value of 4.4. These points are all farfrom the y axis, which means that a considerable concentration of any oneof the three organic acids was required to lower the pH value below 4.4sufficiently to be detected by the test method used. This critical concen-tration value was found to be about 775 millionths normal for butyric acid,about 825 millionths normal for acetic acid and about 950 millionths nor-mal for propionic acid. But the precision of these colorimetric measure-ments is not high enough to warrant much emphasis on the exact order ofthese critical values.
THE EXPERIMENT PERIODS AND THE INDICES OF ROOT ELONGATION
GENERAL PLAN OF EXPERIMENTATION.-Measured seedlings were allowedto remain in the experiment solutions for a treatment period of about 20hr., after which their roots were again measured. The seedlings were thenrinsed in standard nutrient solution and returned to the preliminary cul-ture from which they had been taken. They remained there for a recoveryperiod of 10 hr. Measurements and observations made in this periodshowed the after effects of the preceding treatment with the experimentsolutions. For the treatment period each seedling occupied a separate testtube with about 27 ml. of experiment solution but for the recovery periodall of the seedlings in any experiment had their roots in the same large jarof standard nutrient solution. All experiments began with measuredstandard seedlings grown as described above, each experiment comprising6 or 7 units of 15 seedlings each, all in any unit being treated alike. Therewas a control unit in each experiment, consisting of 15 seedlings in as manytubes of standard nutrient solution for the treatment period. An addi-tional control of 15 seedlings in as many tubes of distilled water was usedfor the experiments on solutions without the nutrient salts. The seedlingsof both types of control were returned to the nutrient solution in the pre-liminary-culture jar for the recovery period.
The average increment of root elongation was secured for each unit, forthe treatment period and for the recovery period. These averages consti-tute the primary numerical results of this study. Each was finally ex-pressed as a percentage of the average from the corresponding control unitfor the same period.
THE TREATMENT PERIOD.-In the treatment period each plantlet occu-pied a separate rimless test tube of "Pyrex chemically resistant" glass, 15mm. in diameter inside and 150 mm. long. Each tube had a paraffin-impregnated cork 17 mm. long, of the common taper form, with a centralhole 5 mm. in diameter. The corks fitted the tubes so tightly that onlyabout 2 mm. extended inside. Before the beginning of each experiment,tubes and corks were thoroughly washed with distilled water and dried bydraining. When a change was to be made in the kind of experiment solu-tion the tubes were washed with cleaning mixture (concentrated H2SO4saturated with K2Cr2O7). In use, the tubes were held in rectangular wireracks holding 40 tubes each. Instead of tubes or stoppers being markedthe tubes were identified by their positions in the rack. A thermographon the shelf bearing the racks showed a maintained temperature of 20 ± 10.
In setting up an experiment, each of the 15 tubes in each unit receivedabout 27 ml. of the requisite solution and a cork was inserted. As the seed-lings from the preliminary culture were measured and recorded each satis-
factory one was mounted in a tube of the requisite solution, after beingrinsed in a beaker of the same solution. The root was inserted through thecork, on the top of which the cotyledons rested. At that time the rootsextended about 17 mm. into the solution, the free surface of which was ap-proximately 3 mm. below the top of the tube, or about 1 mm. below thebottom of the cork.
The treatment period for each experiment lasted until the seedlingroots of the nutrient-solution control unit had increased in length by about26 mm.; that is, until the roots of that control unit had a mean length of56 mm. The length of the treatment period varied somewhat from oneexperiment to another because it was measured in terms of root growth ofthese control seedlings. Its actual duration was from 18 to 23 hrs. Thevariations may be considered as due to slight differences among the experi-ments with regard to prevailing influential conditions.
The preliminary measurements of the control roots in standard nutrientsolution, for ascertaining just when treatment would be discontinued, weremade by observation through the walls of the tubes, without removing theplantlets, and they were consequently less precise than the subsequentregular measurements at the end of the treatment period, for which theseedlings were of course removed.
At the close of the treatment period every seedling was removed fromits tube and its root length was measured in the regular way. For eachunit of the experiment in question there were thus obtained fifteen indi-vidual elongation increments for the treatment period. The averageincrement for this period was then computed for each unit and eachaverage was expressed as a percentage of the control average for the sameexperiment.
The percentage values thus secured are taken as numerical indices ofroot elongation in the treatment period and those derived from differentseries of experiments, as well as from different units of the same series, arecomparable for all cases based on the same kind of control solution. Thefinal phrase of the last statement is important because distilled water wasthe control medium for the tests made with solutions that did not containthe three nutrient salts while standard nutrient solution was the controlmedium for the other tests. These considerations may be illustrated bythe following examples of typical measurements and computations for thetreatment period. See page 404.
It is seen that the average elongation for unit B is expressed as a per-centage of the corresponding average for control unit A, while the per-centage index for unit D is based on the corresponding average for controlunit C. These data are from one experiment for units A and B and from
Seedling Unit B., Unit D,no. in Unit A standard solu- 605 millionths
experiment m a, tion with addi- Unit C, normalunit of 15 nutrient tion of 1129 distilled CH3 . COOHseedlings slutrien millionths water without
normalutnutrientCH3 COOH salts
mm. mM. mm. Mm.1 22 17 8 4
2 25 20 7 6
3 27 19 6 2
4 25 13 7 2
5 25 16 5 3
6 24 17 7 3
7 28 14 6 3
8 24 21 9 4
9 26 17 3 3
10 28 12 5 4
11 28 19 7 6
12 28 14 3 4
13 23 21 4 2
14 19 16 7 5
15 21 18 6 3
Average for unit 24.8 16.9 6.0 3.6
Percentage index 100.0 68.3 100.0 60.3
another experiment for units C and D. All percentage indices for thetreatment period based on controls with standard nutrient solution arecomparable throughout the whole range of this study. This is also true ofall percentage indices based on controls with distilled water, but the twogroups are to be kept distinct.
THE RECOVERY PERIOD.-At the close of the treatment period eachmeasured seedling was rinsed in standard nutrient solution and thenreturned to the paraffin plate on the preliminary-culture jar from whichit had been removed for treatment. The solution in the jar had not beenchanged. After an interval of about 10 hrs. all roots were again measuredand percentage indices of root elongation were derived in the same way asfor the treatment period. These furnish a second series of growth indices
for each compound studied. Of course they refer to the after effects occur-ring in the 10-hr. interval after the treatments had been discontinued. Theseedlings were left on the paraffin plate for several days and furtherobservations were made, but branching soon occurred in the upper regionof many injured roots and consistent measurements were then difficult orimpossible. Only the first 10 hr. following the close of the treatment periodwill be considered in this report.
ROOT ELONGATION IN THE CONTROL CULTURES
THE MARCH OF ROOT ELONGATION IN CONTROLS WITH STANDARD NUTRIENT
SOLUTION AT 20'.-The rate at which an organ enlarges usually alters asdevelopment proceeds, even when the environmental influences are allmaintained. For organs of limited growth, such as these primary roots,elongation under favorable external conditions is slow at first, then increasesto a relatively rapid rate, which may be maintained while a large incrementis added, and finally decreases as maturity is approached. This grandmarch of the growth rate is controlled by internal changes when externalconditions do not alter in the experiment period and it may be modifiedin any phase by stimulating or retarding influences acting from the out-side. In the lupine roots used in this study, when grown in standardnutrient solution by means of the technique described above for prelimi-nary cultures and nutrient-solution controls, elongation ceased or becamevery slow after a rather definite length had been attained, and further rootgrowth then took the form of development of lateral branches.
Since the results of most of these experiments were to be expressedwith reference to control cultures in standard nutrient solution, it wasimportant to know how the rate of root elongation changed as developmentadvanced when the roots were kept in standard nutrient solution and theother conditions were those of the regular nutrient-solution controls.Three special experiments and two of the regular control units wereemployed to give information in this respect. These tests were performed atdifferent times between October and February. Seedlings were removedfrom the germinator 26 or more hours after planting, being then measuredand immediately placed in experiment tubes of standard nutrient solution,where they remained for a period of about 150 hr. The temperature was20 ± 10. In this period measurements of root length were made at inter-vals, in the regular way. The resulting data are shown graphically infigure 2, where the ages of the seedlings (reckoned from the time of plant-ing the seeds) are plotted as abscissas and the root lengths are ordinates.Each of the different symbols represents a separate experiment.
FIG. 2. Graph showing grand march of primary-root elongation in standard nutrientsolution; the several symbols represent different experiments.
All the points taken together form a remarkably homogeneous and con-sistent series. The average march of root length with respect to time isapproximated by the curve. The growth rate is shown to have increaseduntil about the fortieth hour, when the average root length was about15 mm., after which the average rate was maintained (at a little over 1 mm.per hour) for about 45 hr., until the average length was about 65 mm.The rate then decreased and at the end of about 150 hr. it was only about0.2 mm. per hour, when the root was about 85 mm. long.
This graph is similar to other curves for the grand period of growth inplants. In connection with the root-elongation indices to be consideredbelow, the maintained rate between root lengths of 15 mm. and 65 mm. isspecially interesting. This range of root lengths represents a phase ofrapid enlargement at a nearly constant rate. In this phase enlargementwas practically confined to the primary root. The cotyledons remainedclose together and without marked change, elongation of the hypocotyl wasvery slow and secondary roots had not yet begun to appear. At the endof this phase the hypocotyl began to show rapid elongation.
Most of the experimentation of this study is referred to this develop-mental phase of plantlets in the nutrient-solution controls. According tothe regular procedure the roots of the standard seedlings were about 30 mm.long and those in the nutrient-solution controls became about 56 mm. longin the treatment period and about 66 mm. long in the recovery period.
INFLUENCES OF SLIGHT TEMPERATURE FLUCTUATIONS ON ROOT ELONGATIONIN NUTRIENT-SOLUTION CONTROLS.-The temperature at which the experi-
ments of this study were conducted fluctuated between extremes of 18.80and 21.0°, as has been indicated, and the results to be presented farther onconsequently refer to a maintained temperature of about 200. The follow-ing data seem to show that the temperature deviations may generally beneglected. These data refer to regular control units with standard nutrientsolution, for the treatment period of about 20 hr.
Maintained Length Mean hourly Maintained Length Mean hourlytempera- of rate of root tempera- of rate of root
ture period elongation ture period elongation
deg. C. hours mm. dleg. C. hours}1m.18.8 19.2 1.29 [19.8 1.2319.0 21.1 1.24 20.2 19.8 1.2619.5 19.4 1.24 19.7 1.31
It is clear that there is no consistent relation between temperatures andmean hourly growth rates and that deviations related to unknown influ-ences (including internal variations of the seedlings and errors of observa-tion) must have been sufficiently great to mask any temperature influencethat might be evident if all the non-temperature influences had been ideallyconstant for the series. For the interpretation of the standard-solutioncontrols throughout the entire study it is safe to suppose that such slighttemperature fluctuations as may have occurred may be considered as negli-gible, in relation to the inevitable innate variability of the standard seed-lings and possible errors of technique. The average hourly rate of elonga-tion of these roots in standard nutrient solution, for the regular treatmentperiod is 1.27 mm., which is equivalent to an average enlargement of 25 mm.in a period of 20 hrs. The greatest deviation from this average rate was12.6 per cent. (1.11 mm. in the above tabulation).
CONTROLS WITH DISTILLED WATER.-Very little root elongation occurredin the distilled-water controls during the treatment period and these rootsfailed to elongate further when returned to standard solution for therecovery period. After about four days they began to produce laterals,
however, showing that the distilled-water treatment had not killed theentire root. The relations between distilled-water cultures and nutrient-solution cultures for the treatment period and the succeeding 10-hr. intervalare shown below.
Elongation in Elongation in distilled waterstandard nutri-ent solution Actual Percentage index
mm. mm.Treatment period, about 20 hr. 25.7 4.3 16.7
10-hr. recovery period ....................................... 10.0 0.0 0.0
It will be remembered that the standard seedlings (with roots 30 mm.long) had shown a mean rate of elongation of about 1 mm. per hour inpreliminary solution culture and that this rate had been nearly the samefor the previous 15 mm. of elongation. The control units in standardnutrient solution continued to show this maintained rate of root growth tillthe.end of the recovery period but the control units in distilled water areseen to have been very markedly retarded in the treatment period. Dis-tilled water consequently acted as a highly toxic medium, which is in accordwith the statements of many writers who have experimented with distilledwater as a medium for plant cultures.A special series of measurements was made to secure information con-
cerning the manner in which distilled-water retardation first became mani-fest after the transfer of a seedling from the standard solution. The rootof a standard seedling that had been growing in a tube of standard nutri-ent solution for 2 hours in the experiment room, was measured severaltimes in the next 15 minutes, by means of a horizontal microscope used likea cathetometer. The mean hourly rate of elongation was 1.46 mm., withfluctuation between 1.43 mm. and 1.51 mm. After the mean rate of growthin nutrient solution had been thus ascertained the seedling was quicklyrinsed in distilled water and mounted in a tube of this medium, and themicroscopic readings were continued for 2 hr. Only half a minute wasrequired for the transfer. The distilled water had the same temperatureas the nutrient solution. Its hydrogen-ion concentration was markedlylower than that of the nutrient solution; the pH value of the water wasabout 5.6, while that of the solution was about 4.4. Promptly after thechange of medium the root began to show growth retardation, which gradu-ally increased throughout the period, as is shown by the graph of figure 3.
It is clear from this special series of measurements that injury by dis-tilled water progressed for several hours. In the distilled-water con-
FiG. 3. Graph showing gradual slowing down of primary-root elongation after transferof a standard seedling from standard nutrient solution to distilled water.
trols of the regular experimentation elongation of the primary root hadceased before the end of the treatment period, the mean length of whichwas 21.2 hr. The individual roots of the distilled-water control unitsshowed much greater variability than was shown by those of the nutrient-solution units. This may have been partly due to the fact that these mea-surements were relatively much less precise, because of the small amountof elongation measured, but the same was true of the averages for the sev-eral units, and errors of measurement can scarcely be accountable for that,since there were 15 seedlings in every unit. In some instances thetreatment-period average for a distilled-water unit was as much as 40 percent. larger or smaller than the mean of all such averages. Since no aver-age for any nutrient-solution unit deviated from the mean of all such unitsby more than 8.3 per cent., as has been said, it is clear that the distilledwater used acted on these seedlings not only to retard root elongation to avery great degree but also to make it appear that their- innate variabilitywas much greater than was apparent from the nutrient-solution tests. It
is generally true that the innate variability of a stock of organisms is morepronounced for somewhat unhealthy or injured organisms than for morehealthy ones.
Many writers on toxicity and the chemical stimulation of plants haveemployed distilled water as the only control medium in their experiments.As has been emphasized by TRUE (31) and SHIvE (24), however, such acontrol is very unsatisfactory both logically and practically. Distilledwaters are apt to differ as to their impurities, and cultures in this mediummay therefore be impossible of repetition. Even if laboriously purified byredistillation, etc., distilled water is easily contaminated by contact withthe air or in other ways, and of course it cannot remain pure after organ-isms have been placed in it. Furthermore, for plants with roots in watervery low concentrations of toxic solutes generally have much more markedeffects in the absence of the essential nutrient salts than when those saltsare present in proportions and concentrations suitable to maintain health.Finally, seedlings such as those employed in this study can live but a fewweeks with their roots in distilled water. No matter how nearly pure thewater may be, the plant must be injured from the start, partly through lossof considerable amounts of essential ions and partly because the necessaryabsorption of essential mineral nutrients is of course prevented.
The problem of distilled-water toxicity is interesting in itself and it hasreceived much attention (see, for example: LIVINGSTON, 16; SCARTH, 23;MEvius, 22), but the results of an investigation of any particular lot ofwater can refer only to that lot, because of the great difficulty and uncer-tainty of securing different lots that are alike as to impurities. The im-portance of this problem practically vanishes, however, when a goodnutrient solution is employed as reference basis in studies on nutrition,toxicity and the like. Many workers have noted that very low concentra-tions of impurities such as may occur in fairly good distilled water exertno observable influences on most organisms when the essential nutrient sub-stances are present in suitably balanced concentrations. With these con-siderations in mind it was decided to employ modified nutrient solution forthe main part of this study. Only one series of tests with solutions thatdid not contain the three nutrient salts is reported.
ResultsGENERAL STATEMENTS
The main results of this study will be presented in the five followingsubsections. As has been said, they are regularly in the form of percent-age indices of primary-root elongation. When the index for a given ex-
periment is 100 it means that the average elongation in that test was the
same as in the corresponding control unit; indices above 100 indicate stimu-lation (greater average elongation than was given by the correspondingcontrol unit) and indices below 100 show retardation (less elongation thanwas given by the corresponding control unit). A number of the experi-ment solutions were tested twice, in different experiments, and the indexvalues given in such instances illustrate the general degree of experimentaldeviation that should be allowed for in each series. Because the differentconcentrations of the added compound in any series of experiment solutionsform an ascending series of concentrations with relatively small intervalsor steps, the weight or significance of the index value for any solution isto be estimated mainly with reference to the values for other solu-tions above and below it in its series. In spite of considerable deviations,the percentage indices for each series are remarkably consistent in theirindications concerning the various degrees to which the rate of primary-root elongation was affected by different concentrations or physiologicalintensities of the same compound.
The main numerical data are presented in tables I, III, IV, V, VI andVII, and also graphically in figures 4, 6, 7, 8 and 9. In each of these tablesthe tested concentrations of the added compound are shown in the firstcolumn, as millionths normal, the percentage indices for the treatmentperiod are in the second column and those for the 10-hr. recovery intervalare in the third. In each figure the two series of values are plotted as ordi-nates, with abscissas representing the corresponding concentrations.Points for the treatment series are shown as dots and those for the recov-ery period are circles. Of the two graphs in each of these figures, the fullline represents the treatment indices and the broken line represents therecovery indices.
Besides the regular series of experiment solutions for each of the fivecompounds studied, there were two extra series dealing with acetic acid inspecial' ways. The results of these will appear below.
RESULTS WITH ACETIC ACID
ACETIC ACID IN STANDARD NUTRIENT SOLUTION.-There were 35 differentexperiment solutions containing acetic acid in addition to the regular nutri-ent salts, and the partial concentrations due to the acid ranged from 35 to6,652 millionths normal, as shown in table I. In the same table are pre-sented the percentage indices of primary-root elongation for the treatmentperiod and for the recovery period. The percentage index of growth re-tardation is naturally always 100 minus the elongation index; an elonga-tion of 90 per cent. means a retardation of 10 per cent. Of course thepercentage values show much unaccountable fluctuation as one reads either
RELATIVE AVERAGE ELONGATION EXPRESSED AS PERCENTAGECONCENTRATION OF CORRESPONDING CONTROL AVERAGEOF ACETIC ACIDIN NUTRIENT FOR TREATMENT PERIOD FOR RECOVERY PERIODSOLUTION (NUTRIENT SOLUTION (NUTRIENT SOLUTION
column in the table. The broad-line graphs of figure 4 approximately rep-resent the relations in question and the dots indicate the actual data.
I ""' ACID CONCENTRATION, MILLIONTHS NORMALFIG. 4. Graphs showing influence of acetic acid on primary-root elongation. The
two broad lines represent nutrient solutions to which the acid had been added in variousconcentrations, dots and the continuous line being for the treatment period while circlesand the broken line are for the recovery period; data are from table I. The narrowline represents simple solutions of acetic acid in distilled water, for the treatmentperiod; data are from table I.
For the Treatment Period, during which the roots were subject to thedirect action of the acid in the medium, the continuous broad-line graphindicates that the experiment solutions with concentrations of acid belowabout 500 millionths normal gave less root elongation than was given bythe control nutrient solution without addition of acid. For this concentra-tion range ordinates are less than 100 and the greatest retardation is indi-cated for an ordinate of about 88, with acid concentration of about 175millionths normal. Elongation percentages are shown as less than 90 forthe concentration range from about 110 to about 260 millionths normal.After this minimal region is passed the treatment-period graph bends up-ward and the concentration range from about 500 to about 750 millionthsnormal shows percentages little below 100; for these solutions there waslittle or no retardation of growth, and no stimulation is indicated. The
graph then slopes rapidly downward and becomes nearly rectilinear be-tween ordinates of 90 and 30, corresponding to acid concentrations of-about880 and about 1,520 millionths normal, respectively. For this rangegrowth retardation appears to have increased by 1 per cent. for each acid-concentration increase of about 10 millionths normal. The slope thengradually decreases and the graph again becomes a nearly straight line, butnow nearly parallel with the x axis, beyond the point for a concentrationof 3,000 millionths normal, at which point the ordinate is about 10.
Turning to the Recovery Graph, the broken line of figure 4, which rep-resents the after effect of the acid treatment for the first 10 hr. after treat-ment had ceased with the return of the seedlings to standard nutrientsolution, a pronounced stimulation of growth is indicated for the acid-con-centration range below about 920 millionths normal. This stimulationamounts to 10 per cent. or more for the seedlings treated with acid solu-tions having concentrations between about 300 and about 750 millionthsnormal. For treatments with acid solutions more concentrated than about920 millionths normal the recovery index decreases regularly, as indicatedby a nearly straight line, until the treatment concentration of theacid reaches about 1,750 millionths normal and the percentage index at-tains the low value of 10. For this range of acid concentrations, fromabout 920 to about 1,750 millionths normal, the slope of the graph indicatesan increase in retardation, or a decrease in relative elongation, of 1 percent. for each increase in concentration of about 8 millionths normal. Be-yond the ordinate 10 the graph continues to slope downward with concen-trations still higher than 1,750 millionths normal, but at a decreasing rate,-and the x axis is apparently reached with a concentration of about 2,120millionths normal. This means that previous treatment with an experi-ment solution having an acid concentration of about 2,120 millionths nor-mal, or higher, had so injured the primary roots that they failed to elon-gate at all in the 10-hr. recovery period. All these general indications areof course only approximations, but the actual data are shown by the cir-cles of figure 4.
It is interesting to observe that the two broad-line graphs of figure 4intersect at about the point for 1,575 millionths normal acid concentrationand an elongation index of about 27, which means that treatment with anexperiment solution having this concentration of acetic acid produced adirect effect amounting to a growth retardation of 73 per cent. and that itsafter effect, as here measured, was numerically about the same. However,the two graphs are close together throughout the range of concentrationsfrom about 1,000 to about 1,500 millionths normal and it is probably safeto consider the direct toxicity and the after effect as about alike for thisconcentration range.
It is obvious that the exact shapes of these two broad-line graphs offigure 4 may be quantitatively more or less in error, especially in the re-
gions representing the double reversal and the occurrence of after-effectstimulation. The evidence for these features should be regarded as tenta-tive until more extensive experimentation may be carried out on the growthbehavior of this kind of roots in comparatively low concentrations of aceticacid in nutrient solution. At any rate, a reliable picture of what was actu-ally observed in the present brief study is given by these graphs and theirdots and circles.
ACETIC ACID IN DISTILLED WATER.-Nineteen different concentrations ofacetic acid without the three nutrient salts were tested with control unitsin distilled water. These concentrations ranged from 19 to 3,629 millionthsnormal, as shown in the first column of table II. The numerical results ofthis series of tests are shown for the treatment period in the second columnof the same table, and by the narrow-line graph of figure 4. To avoid con-
TABLE IIDATA FOR ACETIC ACID IN DISTILLED WATER, FOR TREATMENT PERIOD
RELATIVE AVERAGE RELATIVE AVERAGECONCEN- ELONGATION (PERCENT- CONCEN- ELONGATION (PERCENT-TRATION AGE OF CORRESPOND- TRATION AGE OF CORRESPOND-OF ACID ING CONTROL AVERAGE OF ACID ING CONTROL AVERAGE
FOR DISTILLED WATER) FOR DISTILLED WATER)
millionths millionthsnormal per cent. normal per cent.
fusion the actual points of observation for this graph are not shown. Thatthere were large deviations for the least concentrated solutions is clear fromthe table.
On the narrow-line graph of figure 4 a pronounced after-effect stimu-lation is indicated for a range of acid concentrations below about 250 mil-lionths normal and no elongation occurred with solutions more concentratedthan 3,100 millionths normal. Beyond the stimulation range acetic acidappears to have been more toxic when used alone in the treatment periodthan when accompanied by the three nutrient salts. This supports thegeneralization that the poisonous action of a solute may be greatly retardedor prevented through concomitant action of nutrient salts or other sub-stances in the same solution.
As has been mentioned, the control seedlings that had been in distilledwater alone during the treatment period failed to show any root elongationin the recovery period, having been seriously injured by the treatment.Those that had been in simple solutions of acetic acid during the treatmentperiod also failed to show elongation of the primary roots in the 10-hr.recovery period, as would be expected. In the next four days, however,the seedlings from distilled water and those from acetic-acid solutions withconcentrations below about 1,512 millionths normal all developed secondaryroots, showing that the entire root had not been killed either by the dis-tilled-water treatment or by treatment with the less concentrated simplesolutions of this acid.
ACETIC ACID AT CONTINUOUSLY INCREASING CONCENTRATION IN FLOWING
NUTRIENT SOLUTION.-In two like experiments of a preliminary nature aseedling root was measured with a horizontal microscope every 15 minutesfor 9.25 hr., while a continuously changing experiment solution containingacetic acid and the nutrient salts flowed around and past it at a rate ofabout 36 ml. per hour. Only one standard seedling was used in each ex-
periment, mounted in the usual manner but in a 50-ml. test tube. Theparaffined cork bearing the seedling had two extra perforations, for inlettube and outlet tube, and the waste solution dripped into a graduated cyl-inder by means of which the rate of flow was ascertained from time to time.The inlet extended nearly to the bottom of the test tube and the outletreached only slightly below the upper surface of the cork.
Standard nutrient solution and the same solution to which acetic acidhad been added so as to have an acid concentration of 3,024 millionths nor-
mal were brought together at the requisite calculated rates from two 50-ml.burettes. The resulting mixture then passed slowly through two glass mix-ing chambers before being discharged into the culture tube. A verythorough mixing of the two solutions was thus secured and also a very
gradual change in the acid concentration of the slow stream through theculture tube. The rate of flow through the culture tube was kept nearlyconstant but the flow of acid solution into the mixer was regulated by hand,so that the acid concentration of the mixed solution increased graduallyfrom 0 to about 3,024 millionths normal. These two experiments were per-formed in the experiment room but the temperature was higher than usual(about 230) because of a continuously glowing electric lamp and the con-tinuous presence of the operator.
In the beginning the apparatus was filled with standard nutrient solu-tion and several microscopic measurements were made to ascertain the rateat which elongation was taking place in that solution. The average fromthese preliminary measurements was taken as the basis for computing thepercentage increments for succeeding 15-minute intervals after the flowingsolution began to change. At the end of the experiment the root was sur-rounded by a solution containing the nutrient salts just as at the startbut with the addition of acetic acid at a concentration closely approaching3,024 millionths normal.
125
z
LLF
FIG. 5. Graphs showing the march of primary-root elongation in a continuouslyflowing solution with gradually increasing concentration of acetic acid but with the con-centrations of the three nutrient salts maintained as in standard nutrient solution. Thestep graphs represent separate experiments and the curve represents a combination ofthe two.
The numerical results of these two special experiments are showngraphically in figure 5, where abscissas represent time and ordinates arethe elongation percentages. Each percentage value is plotted as at the endof its 15-minute interval, the points for one series being dots and for theother circles. The curve shows the general trend indicated by these twosets of points.
As is readily seen, these two experiments were not in agreement as todetails, especially for the first four hours, but they agree in indicat-ing marked stimulation at first (with very low acid concentrations) andincreasing retardation afterwards (as the acid concentration in the flowingsolution increased). The generalized curve resembles the graphs of figure4 in some respects but differs from them in others. The four graphs can-not be compared in detail, of course, but their combined evidence shows atleast the possibility of marked stimulation of these roots by acetic acid atlow concentrations. Whether or not such stimulation was actually shownseems to have depended on the technique employed in experimentation.Many hypothetical explanations of the differences between these fourgraphs might be elaborated but they need not be presented at this time.
RESULTS WITH PROPIONIC ACID IN NUTRIENT SOLUTION
Twenty-eight different experiment solutions were tested with propionicacid in addition to the regular nutrient salts. The acid concentrationsranged from 30 to 12,090 millionths normal, as shown in the first columnof table III. In the second and third columns are presented the percent-age indices of root elongation for the treatment period and for the recoveryperiod. This table is arranged like table I and the two graphs of figure 6approximately represent the numerical values as in the case of the broad-line graphs of figure 4.
For the Treatment Period, the continuous-line graph of figure 6 slopesrapidly downward from the start, without clear indication of stimulationby the solutions of very low acid concentration. It is nearly rectilinearfor the concentration range from about 250 to about 750 millionths normal,its slope in this region representing a decrease in the elongation index fromabout 85 to 30 and a growth retardation of 1 per cent. for each increase inacid concentration of about 6 millionths normal. Beyond the point for anacid concentration of about 750 millionths normal the slope decreases andthe graph again becomes nearly rectilinear, and not far from horizontal,for the broad concentration range from about 1,500 to about 12,090 mil-lionths normal. For this whole region the ordinate decreases from about11 to 0. The acid concentration for a growth index of 90 per cent., (thatis, for a retardation of 10 per cent.) is shown as about 190 millionths
normal, and the concentration for an index of 10 per cent. (a retardationof 90 per cent.) is about 2,200 millionths normal.
This treatment-period graph for propionic acid in nutrient solutiondiffers from the corresponding graph for acetic acid in that it does not showthe reversals that characterize the other graph near the start and it doesnot approach the base line so rapidly in its final, nearly horizontal portion.The graph for propionic acid is much like that portion of the acetic-acidgraph which lies beyond the ordinate for a concentration about 600 mil-lionths normal. Neglecting the reversals of the acetic-acid graph, wemight say that acetic acid had very little effect in concentrations below
about 600 millionths normal, while propionic acid had a very marked effectin the lowest concentrations tested. Altogether, it appears that propionicacid was considerably more toxic than acetic acid.
For the Ten-Hour Recovery Period, represented by the broken line offigure 6, a pronounced stimulation is indicated for propionic-acid concen-trations below about 200 millionths normal and that concentration appearsto have had no effect. Beyond this region of stimulation the graph descendsvery rapidly at first and then more and more slowly. The ordinate for anelongation index of 10 corresponds to about 1,300 on the scale of abscissasand the complete graph meets the base line at the point representing anacid concentration of about 9,500 millionths normal.
This graph resembles the corresponding one for acetic acid but thestimulation range for propionic acid is apparently much narrower. Thissupports the supposition that propionic acid was the more active physiologi-cally. On the other hand, a much higher concentration of propionic acidwas required to prevent any root elongation in the 10-hr. recovery period.This may suggest that the roots recovered from non-lethal poisoning bypropionic acid more readily than they did from a like degree of injuryproduced by acetic acid.
120-
I 10
00,oo20 ,300oo
U
0~
z
0
30-
20.- ~ ~ 0
1000 2000- 3000
CONCENTRATION, MILLIONTHS NORMAL
FIG. 6. Graphs showing influence of propionic acid on primary-root elongation. Dotsand continuous line represent the treatment period while circles and broken
line represent the recovery period; data are from table III.
The two graphs for propionic acid intersect at the point for an acid con-centration of about 270 millionths normal and a percentage index of about85. Beyond this point they lie close together, the after-effect graph beingbelow the other.
The dots of figure 6 suggest some stimulation in the treatment periodbut the curve does not take this suggestion into account. There seems tobe no doubt of the occurrence of after-effect stimulation, although the initialconvex portion of the broken-line graph, representing this stimulation, maybe somewhat too low or too high.
RESULTS WITH NORMAL BUTYRIC ACID IN NUTRIENT SOLUTION
The experiment solutions with normal butyric acid in nutrient solutionwere 26 in number, ranging in acid concentration from 47 to 4,714 millionthsnormal. The data for this series of experiments are presented in table IVand in figure 7, arranged as are the data in the corresponding tables andfigures for acetic acid and propionic acid.
100
90
80
a70.
~60
30,
20 -
1000 2000 3000 40ACID CONCENTRATION , MILLIONTH1S NORMAL
FIG. 7. Graphs showing influence of normal butyric acid on primary-root elongation.Dots and continuous line represent treatment period while circles and broken
line represent recovery period; data are from table IV.
For the Treatment Period, the continuous-line graph of figure 7 is essen-tially like that for propionic acid but it descends somewhat more rapidly.There is no suggestion of any butyric-acid stimulation in the treatmentperiod. The graph meets the base line at the point for an acid conceiltra-
tion of about 4,000 millionths normal. Butyric acid consequently seemsto have been more toxic than propionic acid. The concentration for anelongation index of 90 is shown as about 30 millionths normal and that foran index of 10 appears as about 2,000 millionths normal.
For the 10-Hour Recovery Period, the graph for butyric acid would benearly like the corresponding one for propionic acid if the latter were moveda little to the left. The broken-line curve is drawn to indicate stimulationfor a very narrow range of the lowest concentrations (below about 85 mil-lionths normal) but this is really no more than a suggestion, for the evi-dence therefor is just the single percentage value for the concentration 71millionths normal.
This butyric-acid graph reaches the base line at the point for a concen-tration of about 2,080 millionths normal. Both of these butyric-acidgraphs, when compared with the corresponding ones for propionic acid,indicate that butyric acid was somewhat more active physiologically thanwas the other acid.
The two graphs of figure 7 intersect at the point representing an acidconcentration of about 150 millionths normal and a percentage index ofelongation of about 69.
RESULTS WITH SULPHURIC ACID IN NUTRIENT SOLUTION
Eighteen different concentrations of sulphuric acid were tested in stand-ard nutrient solution, ranging from 43 to 2,583 millionths normal. Theresults are shown in table V and figure 8.
TABLE VDATA FOR SULPHURIC ACID IN NUTRIENT SOLUTION
RELATIVE AVERAGE ELONGATION EXPRESSED AS PERCENTAGECONCENTRATION OF OF CORRESPONDING CONTROL AVERAGESULPHURIC ACID IN FOR TREATMENT PERIOD FOR RECOVERY PERIODNUTRIENT SOLUTION (NUTRIENT SOLUTION (NUTRIENT SOLUTION
WITH ACID) WITHOUT ACID)
millionths normal per cent. per cent.43 99.0 115.065 98.3 113.0
For the Treatment Period, the sulphuric-acid graph (continuous-line offigure 8) follows the corresponding graph for propionic acid very closelyin the region of acid concentrations from 0 to about 500 millionths normal.
FIG. 8. Graphs showing influence of sulphuric acid on primary-root elongation. Dotsand continuous line represent treatment period while circles and broken
line represent recovery period; data are from table V.
It then descends more rapidly than the one for propionic acid and reachesthe base line about the point for an acid concentration of 2,120 millionthsnormal.
For concentrations below about 500 millionths normal the toxicity ofthis mineral acid appears to have been about like that of propionic acidand for higher concentrations sulphuric acid was apparently considerablymore toxic than either of the organic acids tested. For an elongation per-centage of 90 the concentration of sulphuric acid is shown as about 210millionths normal and for a percentage of 10 (a retardation of 90 per cent.)it appears to have been about 950 millionths normal. There is no sugges-tion of any stimulation by sulphuric acid in the treatment period.
For the Ten-Hour Recovery Period, the graph for sulphuric acid (thebroken line of figure 8) is drawn to indicate stimulation for a narrow rangeof low acid concentrations, very much as are the corresponding graphs forpropionic acid and butyric acid. But actual evidence for stimulation is
not more significant here than in the corresponding case of normal butyricacid (observe the circles at the extreme left). We should say that after-effect stimulation by sulphuric acid is no more than suggested by the data.
Beyond the region of suggested stimulation the graph for sulphuric acidclosely follows the corresponding one for propionic acid as far as the pointrepresenting a concentration of about 500 millionths normal and an elonga-tion index of about 39. From that point onward it descends more rapidlythan the corresponding propionic-acid graph and meets the base line at apoint for a concentration of about 1,430 millionths normal. In this re-spect it is similar to the recovery graphs for both acetic acid and normalbutyric acid.
The two graphs of figure 8 intersect at the point representing an acidconcentration of about 150 millionths normal and a percentage index ofelongation of about 93.
RESULTS WITH POTASSIUM ACETATE IN NUTRIENT SOLUTION
Nineteen different concentrations of potassium acetate in standardnutrient solution were tested, ranging from 228 to 15,230 millionths nor-mal. The results of these tests are shown in table VI and figure 9.
For the Treatment Period, the acetate graph (the continuous line offigure 9) shows no stimulation and the toxicity of this compound appears
20'00 4000 66000 8000 10000
CONCENTRA T ION. MILLIONTHS NORMAL
FIG. 9. Graphs showing influence of potassium acetate on primary-root elongation.Dots and continuous line represent treatment period while circles and broken
line represent recovery period; data are from table VI.
to have been proportional to its concentration from 0 to about 7,500 mil-lionths normal, with some decrease in slope indicated for still higher con-centrations. For the concentration range just mentioned the elongationindex appears to decrease 1 per cent. for an increase in concentration ofabout 105 millionths normal. As might be expected, the toxicity of theacetate is clearly very different in its concentration relations from the tox-icity of any of the acids tested. The concentration giving a growth indexof 90 was about 840 millionths normal. The highest concentration in theseries (15,230 millionths normal) was not high enough to inhibit root elon-gation in the treatment period, for it gave an average percentage index of10.6.
TABLE VIDATA FOR POTASSIUM ACETATE IN NUTRIENT SOLUTION
RELATIVE AVERAGE ELONGATION EXPRESSED AS PERCENTAGE
CONCENTRATION OF OF CORRESPONDING CONTROL AVERAGEACETATE IN NUTRIENT FOR TREATMENT PERIOD FOR RECOVERY PERIOD
SOLUTION (NUTRIENT SOLUTION (NUTRIENT SOLUTIONWITH ACETATE) WITHOUT ACETATE)
millionths normal per cent. per cent.228 99.7 100.0318 95.4 103.0457 89.8 100.0685 89.5 114.0914 92.0 111.0
For the Ten-Hour Recovery Period, the acetate graph (the broken line offig. 9) shows pronounced stimulation, but it differs markedly fromthe others in that the range of concentrations that gave stimulation in thisinstance is very broad, extending from about 0 to about 4,500 millionthsnormal. It is specially notable that two solutions as different as the stand-
ard nutrient solution and the one containing the acetate at the relativelyhigh concentration just mentioned should have been alike physiologically,as far as the average growth index indicates; both of them are shown asgiving standard growth, with index of 100. Between these two limits ofthe stimulation range the graph is approximately symmetrical and therange from about 1,900 to about 2,900 millionths normal is shown as givingmaximal stimulations of about 20 per cent. For acetate concentrationsabove the stimulation range the recovery graph descends as a nearlystraight line with a slope slightly more rapid than that of the treatmentgraph. The highest acetate concentration tested gave an average elonga-tion index of 20.5 for the recovery period; that is, a retardation of onlyabout 80 per cent.
In spite of some considerable deviations the dots and circles of figure9 show that the shapes of the two graphs are not far from correct, for thedata at hand, and there seems to be no room for doubt that, while absenceof stimulation characterized the treatment period, stimulation was clearand definite for the recovery period. Of course the critical concentrationvalues mentioned above are intended to be only fairly approximate.
ASSEMBLED GRAPHS FOR ALL SERIES BASED ON STANDARDNUTRIENT SOLUTION
The graphs for all five series of modified nutrient solutions are collectedin figures 10 and 11 for ready comparison. These are simply reproduc-
I CONCENTRATION, MILLIONTHS NORMAL IFIG. 10. Graphs showing influence of the five compounds studied, for the treatment
period. Here are brought together the continuous-line graphs offigures 4, 6, 7, 8 and 9.
FIG. 11. Graphs showing after effects of the five compounds studied, as shown in 10-hr.recovery period. Here are brought together the broken-line graphs
of figures 4, 6, 7, 8 and 9.
tions of the graphs of figures 4, 6, 7, 8 and 9 and they need no special ex-planations. Figure 10 .represents direct effect, in treatment period, andfigure 11 represents after effect, in recovery period.
COMPARATIVE TOXICITIES OF THE FIVE COMPOUNDS STUDIED
CONCENTRATIONS SHOWING GROWTH RETARDATION OF 50 AND OF 90 PERCENT. IN THE TREATMENT PERIOD.-In order to secure some simple numeri-cal values to represent the relative toxicities of the five compounds studiedwe may consider the concentrations corresponding to growth retardationsof 50 and 90 per cent. in the treatment period and each toxicity index maybe expressed in terms of the reciprocal of the corresponding concentrationfor acetic acid taken as unity. The results of these computations areshown on page 429. Scales of toxicity more or less different from thiswould of course result if the comparisons were made with respect to otherdegrees of growth retardation.
TIME RELATIONS OF TOXICITY AND STIMULATION.-As has been shown, therate of primary-root elongation decreased gradually following the placingof standard seedlings in distilled water, while those kept in standard nutri-
ent solution maintained an approximately uniform rate of elongationthroughout the whole experiment period, including both the treatmentperiod (about 20 hr.) and the recovery period (about 10 hr.). For the126 experiment solutions tested, growth increments were measured onlyfor the treatment period and for the recovery period. No information isavailable as to how the rate of root elongation may have changed in eitherone of these observation intervals, but it was surely not generally main-tained throughout either interval, excepting in the nutrient-solution con-trols and in the tests that gave the percentage index of about 100. Theroots were elongating at the rate of about 1 mm. per hour whenthey were placed in the experiment solutions and all of the solutionscontaining the nutrient salts showed a growth retardation for the treatmentperiod. This retardation may have come on gradually, somewhat as isshown for standard seedlings transferred from nutrient solution to distilledwater. It is possible, however, that growth rates may have been acceler-ated in the first part of the treatment period and then sufficiently retardedin the latter part to show retardation for the period taken as a whole. Ifthe regular treatment period had been shorter than it was and of the rightlength, treatment stimulation might have been shown for the weakest solu-tions of every series. This is suggested by the pronounced after-effectstimulation shown or suggested for all of the compounds tested and by themarked temporary stimulation shown at the beginning in the experimentswith gradually increasing concentrations of acetic acid.
If temporary stimulation may have occurred with some solutions atthe beginning of the treatment period, to be obliterated in the records bysubsequent retardation before the end of the period, it is equally possiblethat a first retarding influence may have been followed either by a decrease
in retardation (possibly amounting to stimulation) or by an increase.Such a progressive increase in growth retardation as time went on wasshown for roots in the distilled-water controls. KAHLENBERG and TRUEand other experimenters have pointed out that a somewhat toxic solution-or other injurious but non-lethal environmental complex-may, in someinstances at least, produce injury only in the early part of the exposureperiod, the organism eventually recovering or becoming acclimated to con-ditions that were temporarily injurious at the beginning of the exposure.Thus a root might at length grow well in a solution that at first exerted apronounced retarding influence.
From these and other considerations it is clear that the time factorneeds to be taken into account in the interpretation of the results of sucha study as this and it is to be borne in mind that this important factor wasamong the influential background conditions of the main series of experi-ments here reported. To test these suggested possibilities would of courserequire much more extensive and elaborate experimentation than wasplanned for the present study.
THE POSSIBILITY OF SYNERGISTIC EFFECTS.-It has been shown that thethree nutrient salts exerted a pronounced influence- on the apparent physio-logical influence of acetic acid, for the acetic-acid series with these saltsgave results for the treatment period very different from those given bythe corresponding series without the salts (compare broad-line graph withthe narrow-line graph of figure 4). It may be supposed that similar effectsof the nutrient salts may be involved in the results secured with the otheradded compounds. In comparing the toxic and stimulating influencesshown in this paper the presence of the nutrient salts in the specified pro-portions and total salt concentration needs, of course, to be borne in mind.This suggestion involves the possibility of synergistic influences exerted bythe many kinds of molecules and ions in these experiment solutions. It willbe superficially considered in the section on hydrogen-ion influences.
RELATIONS BETWEEN DIRECT EFFECTS (TREATMENT PERIOD) AND AFTER
EFFECTS (RECOVERY PERIOD).-Although the records for the treatmentperiod generally fail to show direct stimulation for any of the series ofsolutions containing the nutrient salts, the recovery graphs for these seriesall agree in showing or at least suggesting after-effect stimulation, whichis of course confined to the lower concentrations of the added compounds,acting in the treatment period. The concentration limits below whichsome after-effect stimulation in the recovery period is indicated are approxi-mately as follows:
(The interrogation points in parentheses recall the observations alreadymade, that the experimental data are of low significance with respect toafter-effect stimulation by normal butyric acid and sulphuric acid. Whilethere is uncertainty as to its degree, after-effect stimulation appears to beclearly shown by the actual data for acetic acid, propionic acid and potas-sium acetate.)
For solutions having about these critical concentrations of the respectivecompounds no effect at all is shown for the recovery period but these solu-tions are all shown to produce growth retardation in the treatment period,as is also true of the less concentrated solutions that gave after-effect stimu-lation. This means that direct retardation in the treatment period mightbe followed in the recovery period by either stimulation, absence of effector retardation, according to the treatment concentration. For all theregular experiment solutions excepting the critical ones approximatelyspecified above, the treated seedlings were apparently altered physiolog-ically to such a degree that in the 10 hr. following cessation of treatmenttheir roots elongated either more or less rapidly than did the roots of thecontrol seedlings, which had been in standard nutrient solution through-out the treatment period. Considering the solutions that are shown as
toxic in the recovery period, their after-effect retardation might be eitherless than, greater than, or equal to the retardation produced directly whilethey were in contact with the roots. For the four, acids tested, the con-
centrations that show equal growth indices for the two periods are givenbelow, along with their respective growth indices.
Finally, we may compare the acid concentrations that are shown as justinhibiting primary-root elongation in the two periods, as shown on page 432.It is seen that this limiting concentration is in every case much lower forthe recovery period than for the treatment period. For example, to pre-
vent any measurable growth in the treatment period apparently requiredan acetic-acid concentration of about 6,650 millionths normal, but treat-ment with this acid at a concentration of only about 2,120 millionths normalis shown as preventing root elongation in the period following the cessationof treatment. Concentrations of this acid between these two limits appar-ently permitted more or less root elongation in the earlier portion of thetreatment period but killed the elongating region of the root by the endof the period, or at least rendered it incapable of any elongation in the next10 hr. following its return to standard nutrient solution. Similar state-ments apply to the other acids.
A kind of after-effect stimulation apparently somewhat similar to whatwas encountered in the present study has been described by HILDEBRANDTand BOYCE. (11) for alcohol production by yeast in the fermentation ofcane molasses. These authors tested MnSO4, CuSO4 and NaCN and foundthat each of these salts, when present at a suitable concentration in molassessolution containing growing yeast, apparently affected the yeast so treatedin such a manner as to show unusually great alcohol production in an un-modified molasses solution that was subsequently inoculated with thetreated yeast. In some of these instances there had been some stimulationin the treatment period (seed-yeast culture, with the added salt) but stimu-lation was more pronounced in the recovery period (principal fermentationstage). In other instances, notably with MnSO4, seed yeast that had beenmarkedly retarded by the salt in the seed-culture produced considerablymore alcohol after transfer to the principal fermentation (without the salt)than was produced in the control, which had been seeded with untreatedyeast. The salt treatment apparently altered the seed yeast so that itsoffspring in the second stage was much more vigorous than the poisonedseed culture had been and also more vigorous than the offspring of ordinaryseed cultures.
Relations between physiological influence andhydrogen-ion concentration
THE GENERAL PROBLEM OF ION AND MOLECULE
CONCENTRATIONS
The many modified nutrient solutions tested in this study differed pri-marily with respect to the added compounds and their concentrations.From the viewpoint of physical chemistry their main effective differencescannot be satisfactorily described without reference to their respectiveconcentrations of ions and of undissociated molecules. A large proportionof the solute material in any of these solutions must have been dissociated,and a little of the solvent water also. According to the dissociation theorywe suppose that the standard nutrient solution itself contained the follow-ing kinds of molecules and ions, besides those that may have arisen frominteraction of the nutrient salts among themselves and with the experi-ment compounds (if there were any such), and also any small traces ofother kinds due to impurities that may have been present in the distilledwater or in the salts used:-
Molecules of a Ca (NO3)2 and the ions Ca++ and NO3- resulting from their dissociation.Molecules of KH2PO4 and the ions K+, H2PO4-, HPO4-, H+, and PO- resulting from
their dissociation.Molecules of MgSO4 and the ions Mg-+ and SO4- resulting from their dissociation.Molecules of H120 and the ions H+ and OH- resulting from their dissociation.
In each of the four series of experiment solutions consisting of standardnutrient solution with an added organic compound there must have beenpresent, in addition to these inorganic molecules and ions, one kindof organic molecule (i.e., either CH3COOH, CH3COOK, CH3CH2COOH orCH3CHCH2COOH) and also its particular anion (i.e., either CHCOO-,CHCH2COO-, or CHCHCH2COO-). In the series of solutions contain-ing potassium acetate the amount of K was increased above the amount inthe unmodified nutrient solution. In the series containing sulphuric acidthe amount of SO4 was increased but no kind of ion was intentionally addedwhich was not already present in the solution.A thorough analysis of the relations between the observed physiological
effects and the chemical characteristics of the solutions bringing themabout would of course have to take into account the actual concentrationsof all the kinds of particles present-both the undissociated molecules andtheir ions. But that kind of analysis of such complicated chemical systemsas those here dealt with is practically impossible at present. On the basisof certain assumptions and by means of published tables of apparentionization percentages in simple solutions of the substances considered, the
molecular and ionic concentrations of these solutions may be calculatedwith some degree of probability, but the necessary considerations are com-plicated by the interrelations between the several compounds in the samesolution.
COMPARISONS OF THE FIVE SERIES OF SOLUTIONS WITH RESPECT TO
TOXICITY, PH VALUE AND CONCENTRATION OF ADDED COMPOUND
For such complex aqueous solutions as these the only ion concentrationsthat now lend themselves to ready estimation by direct measurement arethose of hydrogen ions and hydroxyl ions. These are of course interde-pendent, the product of their concentrations being a constant. Table VIIshows, for the treatment period, the relations of growth retardation (thedifference between growth index and 100) to concentration of the addedcompound and to pH value, for each series of solutions. These values wereread from the smooth graphs of figures 1 and 10. Opposite each retarda-tion percentage shown in the first column one may read in the other col-umns the corresponding approximate concentration and pH value for eachof the five different series of solutions. It is to be remembered that thegrowth index of 100 always represents the standard nutrient solution, witha pH value of 4.4, and that all these data refer to the treatment period ofthe experiments, not to the recovery period. This arrangement shows how,for any degree of growth retardation, the concentration of the added com-pound and the pH value of the experiment solution varied from series toseries. The concentrations shown for any given degree of toxicity are gen-erally different for different compounds, although there is fairly closeagreement between propionic acid and sulphuric acid excepting for thegreatest retardations or lowest growth indices. The five series of pH valuesgiven in table VII are shown graphically in figure 12, where the growthindices are plotted as ordinates and abscissas represent pH values. Thereis a separate graph for each series of solutions.
We may conveniently consider toxicity as measured, for the given con-ditions, by -the corresponding percentage of growth retardation. Solu-tions without toxicity show a retardation percentage of 0 and a growth in-dex of 100, and those with the highest degree of toxicity show a retardationpercentage of 100 and a growth index of 0. Of course the standardnutrient solution (with zero concentration of added compound and pHvalue of 4.4) is considered as showing no retardation and is the basis forcomparison.
The series for propionic acid and normal butyric acid agree in showinghigh degrees of toxicity (up to a retardation of 80 per cent.) without anysignificant alteration in pH value due to the added compound. For these
FIG. 12. Graphs showing the relations between primary-root elongation in the treat-ment period and pH value, for each of the five series of modified nutrient
solutions; data are from the smooth graphs of figures 1 and 10.
acids the degree of toxicity, which obviously depends on acid concentrationin some way, is apparently not related to pH value for the broad range ofretardation percentages from 0 to 80. For the toxicity range from a re-
tardation of about 80 per cent. to complete stoppage of growth by thesesolutions the pH value is progressively lower than that of the standardnutrient solution and the high degrees of toxicity that nearly stopped thegrowth of the primary root in the treatment period may well have beenlargely related to high hydrogen-ion concentration.
The series for acetic acid is specially characterized by the complicatedtoxicity relations corresponding to the double reversal near the beginningof its graph (fig. 4 or 10). Within the range of concentrations from 0 toabout 880 millionths normal (throughout which range the pH value doesnot differ significantly from 4.40) these solutions show varying degrees oftoxicity up to a retardation of over 10 per cent. These variations do notappear to be related to pH value, although they are clearly related to acidconcentration. Throughout the concentration range from 1,020 to 1,800millionths normal the pH value for this series of acetic-acid solutions de-creases so slightly that it can hardly be considered as the main factor indetermining growth retardation, which increases correspondingly from 20to 80 per cent. Hydrogen-ion concentration may have been more or less
influential in this range, however. For the highest concentrations of aceticacid, giving growth retardations of above 80 per cent., the value of pHdecreases much more rapidly, in a manner similar to its decrease in thisregion of the graphs for the propionic acid and butyric acid series. In allthree of these series hydrogen-ion concentration may have been an impor-tant factor in determining only the highest degrees of toxicity.
The sulphuric-acid series shows the pH value following the acid concen-tration rather closely. This series is unique in that its graph for normal-ity (fig. 8 or 10) is somewhat similar in form to its graph for pH (fig. 12).This suggests that for this series of solutions hydrogen-ion concentrationmay have been the main physico-chemical factor involved in bringing aboutthe observed toxicity increase with increase in acid concentration.
The pH graph for the acetate series (fig. 12) does not closely resemblethe corresponding normality graph (fig. 9 or 10), which is nearly recti-linear while the pH graph is apparently sigmoid, and pH could hardly-serve as an index of toxicity in this case. It is to be noted that, althoughthis salt acts to decrease the hydrogen-ion concentration of the solution(and of course to increase the hydroxyl-ion concentration and the p11value), yet the highest concentration of acetate shown as giving any rootelongation in the treatment period is still on the acid side of neutrality.The pH value for a solution having equal concentrations of H+ and O-would of course be 7.0.
It appears that other physico-chemical characteristics of these solutions,besides hydrogen-ion concentration, took important part in determining theobserved physiological effects, especially with respect to the three organicacids. Concentration of undissociated molecules and organic anion concen-
tration may be suggested as other solution characteristics most likely to beinvolved. It also appears that different degrees of toxicity of the same
added compound may result from different combinations of the same tox-icity factors. For the highest decrees of toxicity of the three organic acidspH might be regarded as an approximate index of physiological effect, butthis is not true for the lower degrees of toxicity. For example, a growthretardation of about 90 per cent. corresponds (table VII) to the followingconcentrations and their approximate pH values:
While this critical concentration differs markedly for these acids the
corresponding pH values are relatively not very different and all three are
between 0.19 and 0.34 below the pH value for standard nutrient solution.On the other hand, a growth retardation of 50 per cent. corresponds to thefollowing concentrations and pH values:-
For this degree of retardation the last two of the acid solutions show thesame pH value as the standard nutrient solution, while the first shows apH value only 0.06 below that of the standard solution. If we considertoxicity as proportional to the reciprocal of the acid concentration corre-sponding to a growth retardation of 50 per cent. the relative toxicities ofthese three acids are: acetic acid, 1.0; propionic acid, 2.3; normal butyricacid, 4.6. It is remarkable that the least toxic of the three (acetic acid) isthe one showing 4.34 as its critical pHE value for a retardation of 50 percent.
If the growth indices for the first 10 hr. after the treated roots werereturned to nutrient solution are compared with the corresponding pHvalues of the treatment solutions the lack of any general and direct relationbetween after effect and pH value is very obvious. Those comparisonsneed not be discussed here but it may be mentioned that the after-effectstimulations indicated for at least three series of solutions would greatlycomplicate any attempted analysis of the relations between physiologicalaction in the recovery period and hydrogen-ion concentration in the treat-ment period.
It seems clear that the toxicities of these three fatty acids cannot beestimated by reference to pH value alone. The view that the toxic prop-erties of organic acids are mainly due to undissociated molecules ratherthan to ions was expressed by J. F. CLARK (3), who experimented with fila-mentous fungi. He found that acetic acid was about twice as toxic as sul-phuric acid, although the former was only 1 per cent. dissociated and thelatter was 90 per cent. dissociated in the solutions in question. The resultsof the present study on root elongation lead to a similar conclusion. MARYE. COLLETT (5), working with Paramoecium and Euplotes, reached the con-
clusion that organic-acid molecules were the agents of the toxic action ofthese acids in her solutions. In reporting experiments on the fungus
Sclerotinia cinerea, DUNN (8) regarded hydrogen-ion concentration as theprincipal toxicity factor for the common mineral acids but considered theundissociated molecules as of chief importance for the toxicity of the fattyacids. UPPAL (32) reached the same conclusion from a study on the germi-nation of spores of the fungus Phytophthora. The results of the presentstudy seem to furnish additional evidence in favor of the conclusions ofDUNN and UPPAL.
SummaryThis paper reports the main results of an experimental study on the
influence exerted by acetic acid, propionic acid, normal butyric acid, sul-phuric acid and potassium acetate upon the elongation of primary roots ofyoung seedlings of white lupine (Lupinus albus L.). The experimenta-tion was carried on at the Laboratory of Plant Physiology of the JohnsHopkins University in 1929-30.
The seedlings used were all very nearly alike, having been selected fromlots that had been grown from selected seeds under specified conditions.Their primary roots were about 30 mm. long and their hypocotyls wereabout 10 mm. long. At the beginning of each experiment 15 standard seed-lings were transferred from preliminary culture in standard nutrient solu-tion to as many separate tubes of one of the experiment solutions, wherethey remained for a treatment period of about 20 hr. For control unitsthe tubes contained standard nutrient solution. At the close of the treat-ment period the seedlings were returned to the preliminary-culture jarcontaining standard nutrient solution, for a 10-hr. recovery period at theend of which after effects of the treatment were observed.
The main series of numerical data are the amounts of primary-root elon-gation that occurred in the treatment period and in the recovery period.These data are always averages from the 15 seedlings of single experimentunits. They are expressed as relative indices of elongation, the correspond-ing average for the control unit always being taken as 100. Accelerationof growth (stimulation) is thus indicated by index values above 100,growth retardation is shown by values below 100 and index values of 100indicate that the experiment solution used had no considerable effect onroot elongation in the time interval considered. There are two growth in-dices for each experiment solution, one showing the direct effect of the solu-tion in the treatment period while the other shows any after effect broughtout in the 10-hr recovery period.
The standard nutrient solution, which was used generally for controlsand as basis for the experiment solutions, was a 3-salt solution containingCa(NO3)2, KH2PO4 and MgSO4, in molar concentrations of 0.0050, 0.0069and 0.0094, respectively. With the specified standard technique the rate
of elongation of roots in this solution (i.e., the average rate for controlunits) was approximately maintained throughout both time intervals, at alittle more than 1 mm. per hour. Any considerable deviations from thisrate, in either of the time intervals, must have been due to influences ex-erted by the experiment solutions in the treatment period.
There were five main series of experiment solutions based on standardnutrient solution. The salt content was alike for all of these but everyseries differed from each of the remaining four with respect to the natureof an additional compound. The many solutions of each series differedamong themselves only with respect to concentration of the additional com-pound. Thus, for example, the propionic-acid series of experiment solu-tions were all standard nutrient solution modified to different degrees bythe addition of propionie acid to give various concentrations of the acid.The concentrations of the additional compound were so chosen in eachseries that the whole concentration range was covered, from zero (standardnutrient solution without added compound, in control cultures) to a con-centration high enough to prevent root elongation in the treatment period.
Besides the five main series of modified nutrient solutions there weresome experiments on simple solutions of acetic acid in distilled water, withdistilled-water controls. In those instances the experiment solutions werelike those of the main series excepting that the three nutrient salts of thestandard nutrient solution were not present.
The numerical results of this study are set forth by means of tablesand graphs, which show many interesting relations. For the treatmentperiod the modified nutrient solutions generally gave growth retardation,which was progressively more pronounced as the concentration of the addi-tional compound was higher, until root growth was stopped altogether. Ofcourse the degree of toxicity shown by any of these solutions that did notstop growth varied with the nature of the additional compound as well aswith its concentration.
The acetic-acid series of modified nutrient solutions is an exception tothis generalization. Although solutions with very low concentrations ofthis compound gave notable retardation, those with somewhat higher con-centrations showed practically no effect and those with still higher concen-trations showed retardation. In the second range of concentrationsproducing retardation the degree of toxicity was greater as the acid con-centration was higher and growth was stopped with the highest concentra-tions tested. Consequently, if abscissas represent concentrations of aceticacid in modified nutrient solution and ordinates are indices of root elonga-tion, the treatment-period graph exhibits two reversals of direction. Nosuch reversals appear in the graphs for the other four series of modified
nutrient solutions; the other acids and the acetate were generally some-what toxic at low concentrations and progressively more toxic at higherconcentrations until the concentration was high enough to prevent growth.There was, however, some suggestion of stimulation by very low propionic-acid concentrations in the treatment period.
The series of simple solutions of acetic acid in distilled water-withoutthe salts of the nutrient solution-was the only series that surely showedstimulation in the treatment period. This is indicated for a narrow rangeof low acid concentrations. Solutions of somewhat higher concentrationsproduced little or no effect while those of still higher concentrations re-tarded growth, as in the higher concentration ranges of the other series.
For the first 10 hr. following the treatment period, after the plantletshad been rinsed and returned to standard nutrient solution, the roots thathad been treated with acetic acid, propionic acid or potassium acetate ex-hibited after-effect stimulation for a range of low concentrations of theadditional compound used in the treatment. Some experiment units whoseseedlings had been treated with normal butyric acid or sulphuric acid gaveaverage growth indices that indicate after-effect stimulation but the evi-dence for this is only suggestive. The recovery-period graphs for all seriesof modified nutrient solution are drawn to indicate a region of stimulationat the left, above the 100-line, but the actual data are shown in each in-stance. Their general form is like that of the treatment period graph forthe series of simple solutions of acetic acid.
Some attention was given to the toxicity of the distilled water used.Standard seedlings transferred from nutrient solution to distilled waterpromptly showed growth retardation, which increased as time went on.The toxic action of this distilled water was apparently corrected by thesalts in the standard nutrient solution.
Roots in flowing nutrient solution with a gradually increasing addi-tional concentration of acetic acid were studied by means of microscopicmeasurements made at short intervals. At first the increasing acid con-centration produced increasing stimulation of elongation, then decreasingstimulation, then no effect, and finally increasing retardation.
The toxicities of the five compounds added to standard nutrient solu-tion may be compared in various ways. For example, if toxicity ismeasured in terms of the concentration required to produce a growth re-tardation of 50 per cent. in the treatment period, the relative toxicities ofthe five compounds may be estimated as shown on page 442, considering thetoxicity of acetic acid as unity.
Some what different scales of toxicity would result if these comparisonswere made with respect to other degrees of growth retardation. In gen-
eral it may be said, however, that normal butyric acid was much more toxicthan either propionic acid or sulphuric acid, that propionic acid and sul-phuric acid were about alike in their toxicity and much more toxic thanacetic acid, and that acetic acid was much more toxic than potassium ace-tate, which was the least toxic of all the five compounds studied. For thethree aliphatic acids toxicity is apparently more pronounced as the num-ber of carbon atoms in the molecule is greater.
Stimulation, as an after-effect occurring in the recovery period, mightamount to as much as 10 or 20 per cent. It was greatest for potassiumacetate, somewhat less for acetic acid and still less for propionic acid. Itwas suggested for normal butyric acid and sulphuric acid but the evidencefor stimulation by these two acids is not in itself very significant, becauseof unexplained deviations in the average growth indices. The concentra-tion limit below which after-effect stimulation was shown or suggested dif-fered for the different compounds added to standard nutrient solution, asset forth below. These values are in terms of millionths normal and the in-terrogation points refer to the questionable instances already mentioned.
For modified nutrient solutions with about these critical concentrations ofthe respective additional compounds, no effect at all was shown in the re-covery period, but these solutions all produced marked growth retardationin the treatment period. For modified nutrient solutions with lower con-centrations of the additional compounds than those just given, after-effectstimulation was generally shown, or was at least suggested, but the directeffect (in the treatment period) was more or less pronounced retardation-excepting the narrow range of acetic-acid concentrations that producedpractically no direct effect and the very narrow range of lowest propionic-acid concentrations that may have produced some direct stimulation.
The five series of experiment solutions with the nutrient salts presentare compared with respect to hydrogen-ion concentration (expressed aspH) as well as with respect to concentrations of the additional compoundsand physiological effects. With the possible exception of the sulphuric-acid series, it appears that the pH value cannot generally be considered asan index of toxicity, but it is also indicated that hydrogen-ion concentra-tion was markedly influential as one of several or many conditions deter-mining the toxicity of the most toxic solutions. Other solution character-istics-perhaps concentration of anions or of undissociated molecules-were apparently predominant in determining toxicity for the lower con-centrations of the organic acids.
Many other interesting relations are shown or suggested by the tablesand graphs and some of them are discussed. Influence of the time factorreceives some attention and the possibility of synergistic influences in suchcomplex solutions as these is emphasized.
LITERATURE CITED1. BRENCHLEY, WINIFRED E. Inorganic plant poisons and stimulants.
2 ed. Cambridge, 1927.2. CAMERON, F. K., and BREAZEALE, J. F. The toxic action of acids and
salts on seedlings. Jour. Phys. Chem. 8: 1-13. 1904.3. CLARK, J. F. On the toxic effect of deleterious agents on the germi-
nation and development of certain filamentous fungi. Bot. Gaz.28: 289-327, 378-404. 1899.
4. CLARK, W. M. The determination of hydrogen ions; etc. Baltimore,1920.
5. COLLETT, MARY E. Toxicity of acids to ciliate infusoria: I, II. Jour.Exp. Zool. 29: 443-472. 1919.
6. CROZIER, W. J. Cell penetration of acids: VI. The chloracetic acids.Jour. Gen. Physiol. 5: 65-79. 1922.
7. DACHNOWSKI, ALFRED. The effect of acid and alkaline solutions uponthe water relation and the metabolism of plants. Amer. Jour.Bot. 1: 412-439. 1914.
8. DUNN, M. S. Effects of certain acids and their sodium salts upon thegrowth of Sclerotinia cinerea. Amer. Jour. Bot. 13: 40-58.1926.
9. EISENMENGER, W. S. Toxicity of some aliphatic alcohols. PlantPhysiol. 5: 131-156. 1930.
10. HEALD, F. D. On the toxic effect of dilute solutions of acids and saltsupon plants. Bot. Gaz. 22: 125-153. 1896.
11. HILDEBRANDT, F. M., and BOYCE, F. F. Stimulation of cane molassesfermentation by certain metallic salts. Jour. Ind. Eng. Chem.22: 1011-1014. 1930.
12. HILGARD, E. W. Soils, their formation, properties, composition, etc.New York, 1914.
13. KAHLENBERG, L., and AUSTIN, R. M. Toxic action of acid sodium saltson Lupinus albus. Jour. Phys. Chem. 4: 553-569. 1900.
14. and TRUE, R. H. On the toxic action of dissolved saltsand their electrolytic dissociation. Bot. Gaz. 22: 81-124. 1896.
15. KR6NIG, B., and PAUL, TH. Die chemischen Grundlagen der Lehrevon der Giftwirkung und Desinfektion. Zeitschr. Hygiene undInfectionskr. 25: 1-112. 1897.
16. LIVINGSTON, B. E. Further studies on the properties of unproductivesoils. U. S. Dep,. Agr., Bur. of Soils, Bull. 36. 1907.
17. LUCKE, BALDWIN, and MCCUTCHEON, MORTON. The effect of valenceof ions on cellular permeability to water. Jour. Gen. Physiol.12: 571-580. 1929.
18. MACHT, D. I., and ANDERSON, W. T. Clinical and experimental stud-ies on phototherapy in pernicious anemia. Jour. Pharmacol. andExp. Therapeut. 34: 365-389. 1928.
19. and LEACH, HARRIET P. Pharmacological studies oftwenty-three isomeric octyl alcohols. Jour. Pharmacol. and Exp.Therapeut. 39: 71-97. 1930.
20. - and LIVINGSTON, MARGUERITE B. Effect of cocaine onthe growth of Lappinus albus, etc. Jour. Gen. Physiol. 4: 575-584. 1922.
21. and LUBIN, DOROTHY S. A phyto-pharmacologicalstudy of menstrual toxin. Jour. Pharmacol. and Exp. Therapeut.22: 413-466. 1923.
22. MEVIUS, WALTER. Weitere Beitriige zum Problem des Wurzelwachs-tums. Jahrb. wiss. Bot. 69: 119-190. 1928.
23. SCARTH, G. W. The toxic action of distilled water and its antagonismby cations. Trans. Roy. Soc. Canada III. 18: 97-104. 1924.
24. SHIVE, J. W. A study of physiological balance in nutrient media.Physiol. Researches 1: 327-397. 1915.
25. SMITH, H. W. The action of acids on cell division with reference topermeability to anions. Amer. Jour. Physiol. 72: 347-371. 1925.
26. Sztfcs, J. Experimentelle Beitrige zu einer Theorie der antagonis-tischen Jonen-wirkung: I Mitteilung. Jahrb. wiss. Bot. 52: 85-142. 1912.


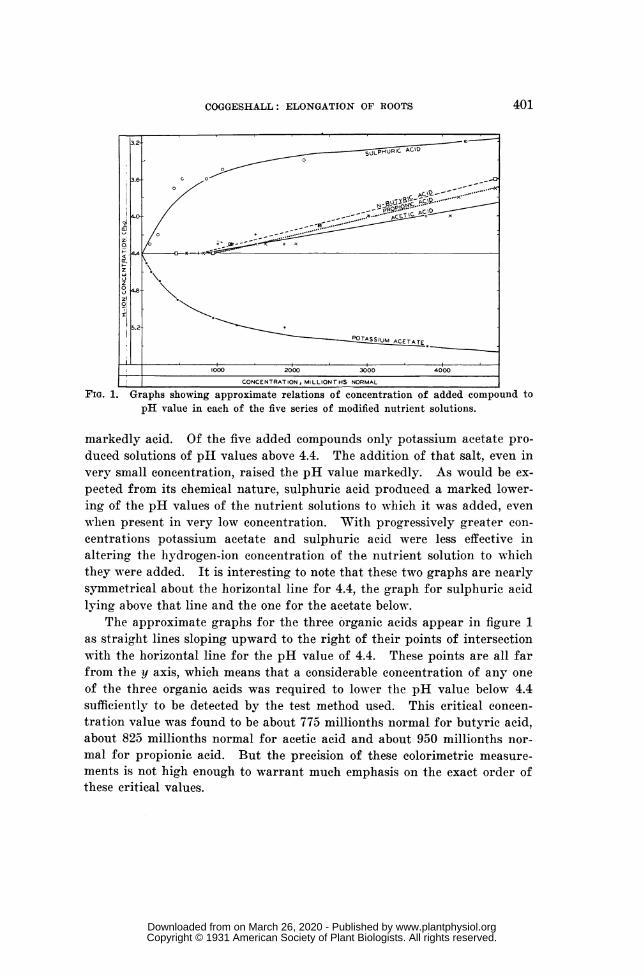


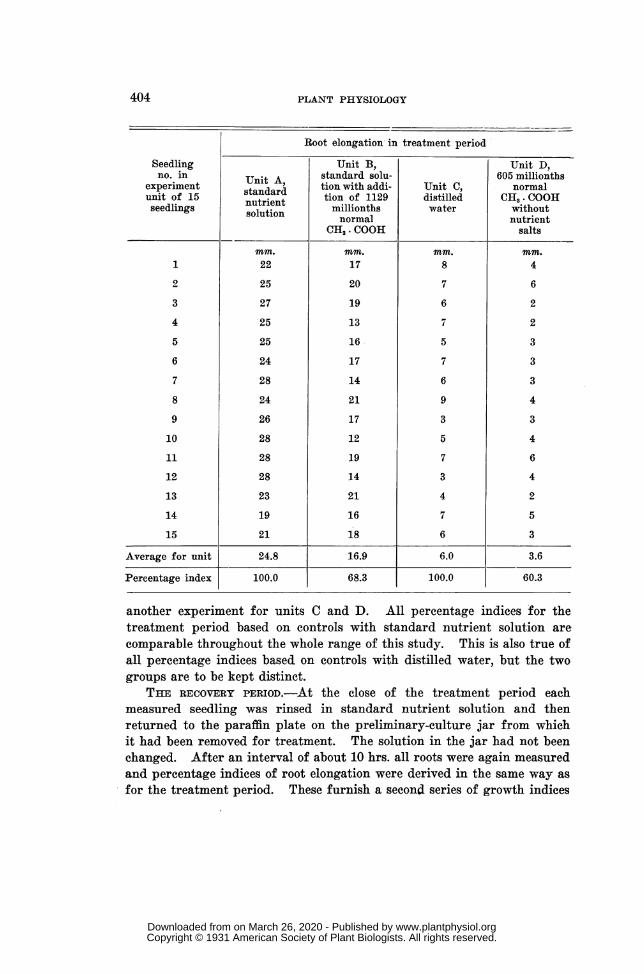
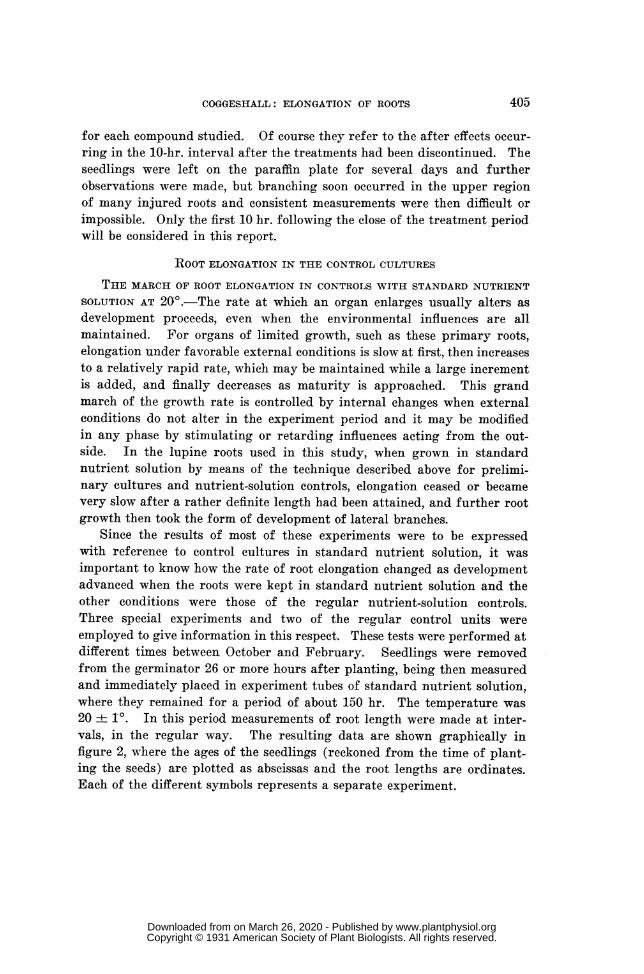
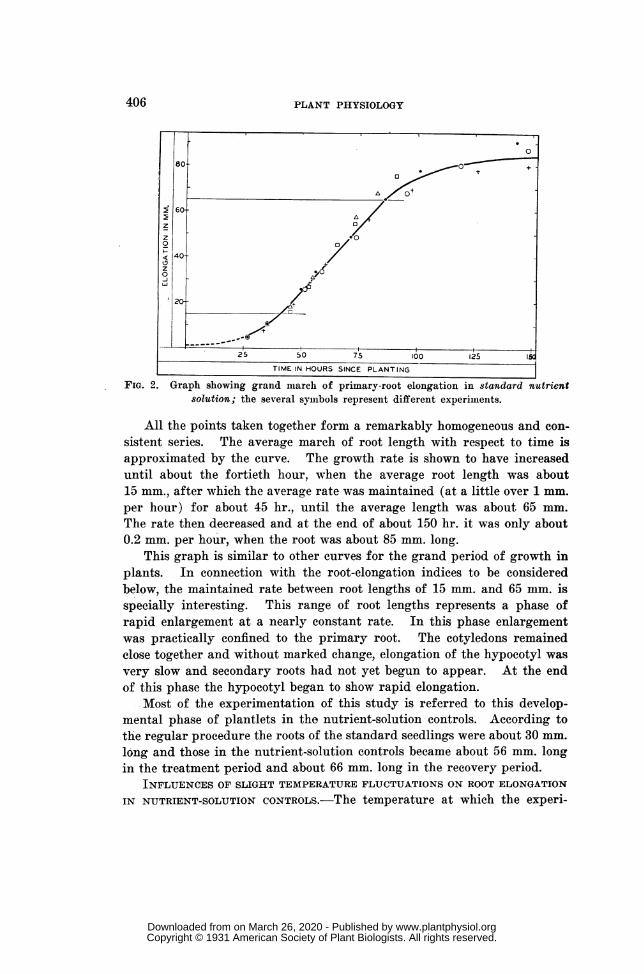


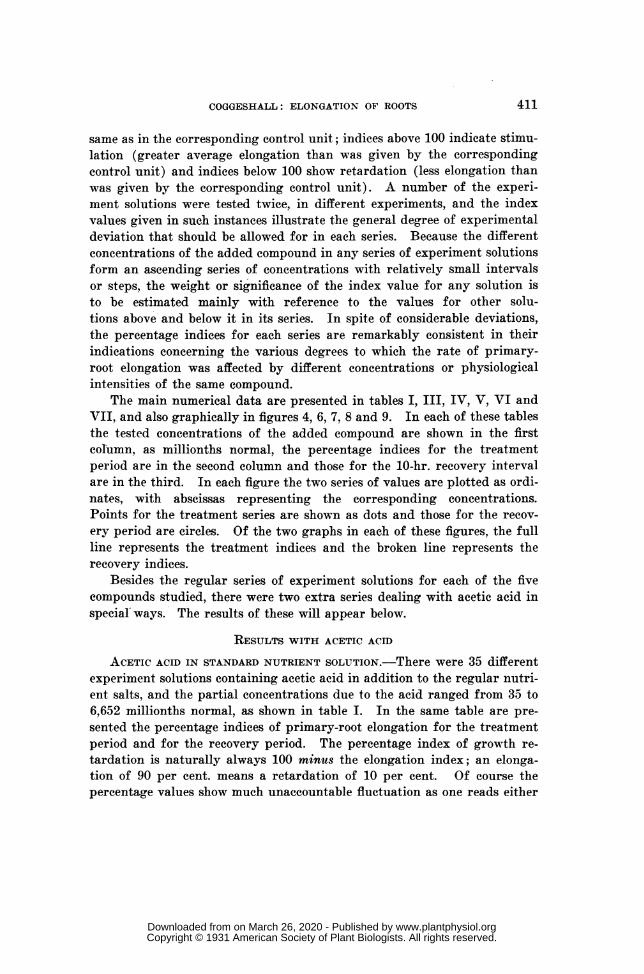

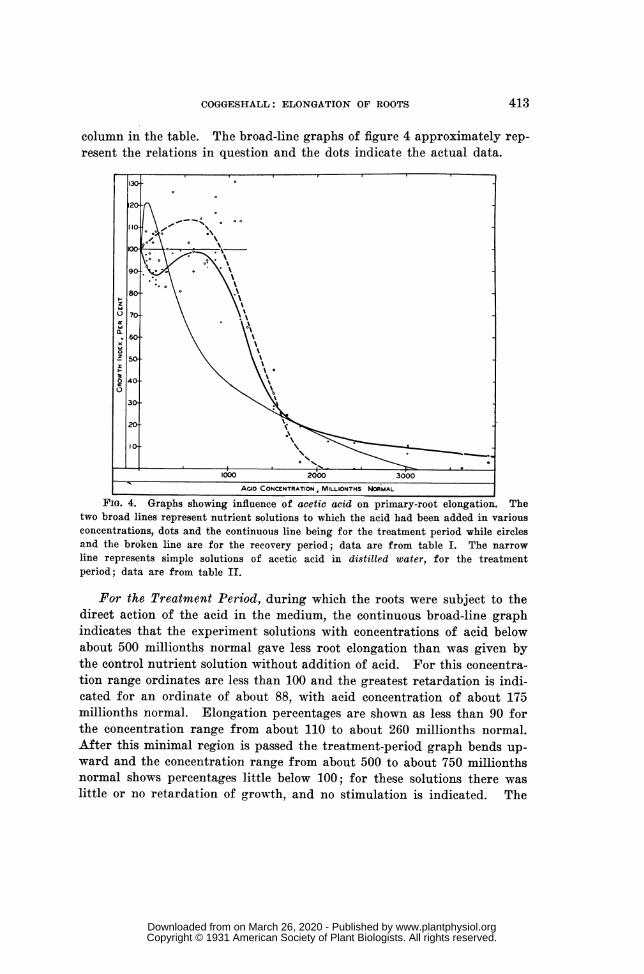
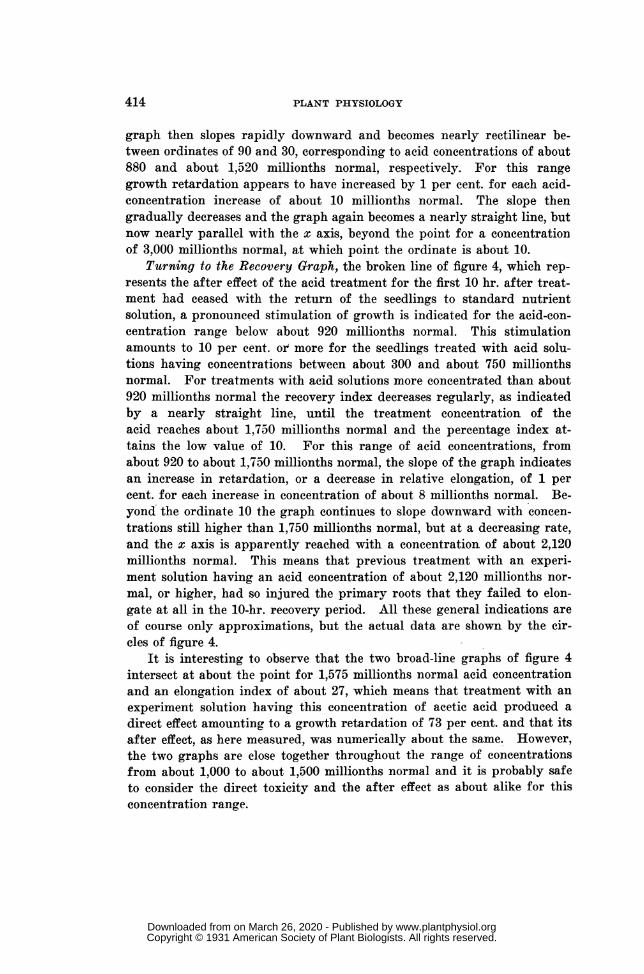


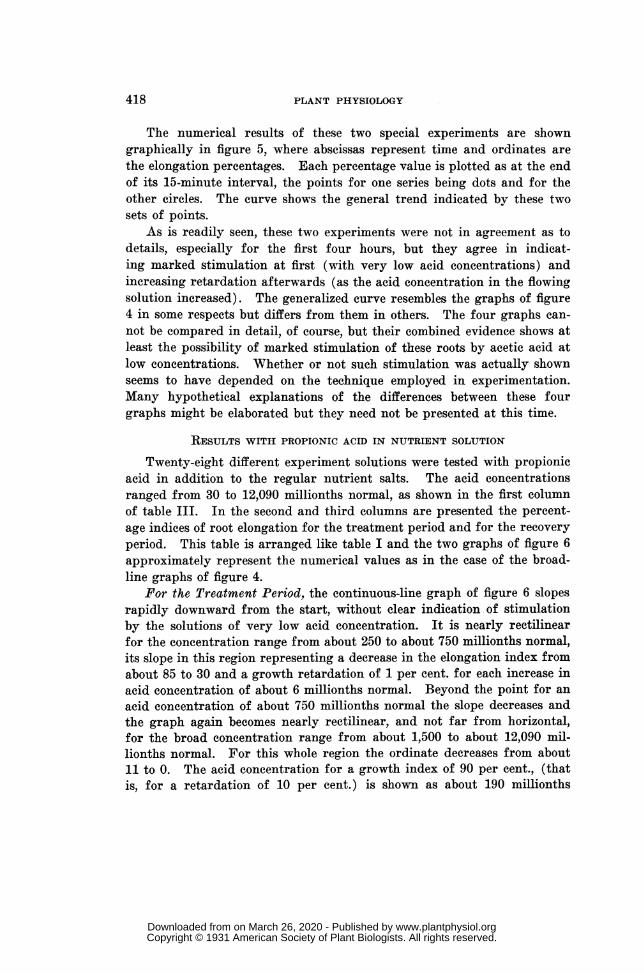
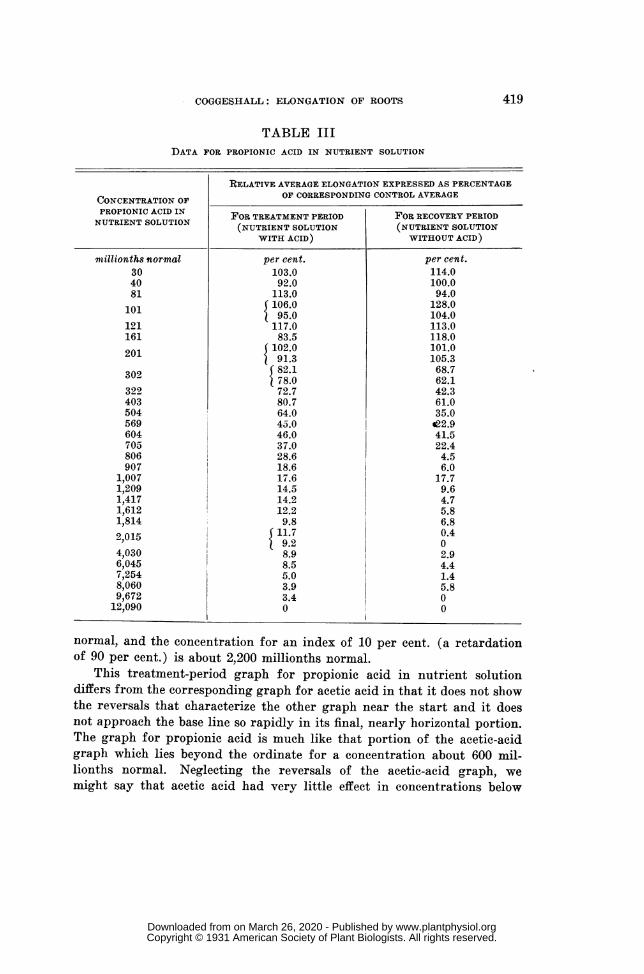
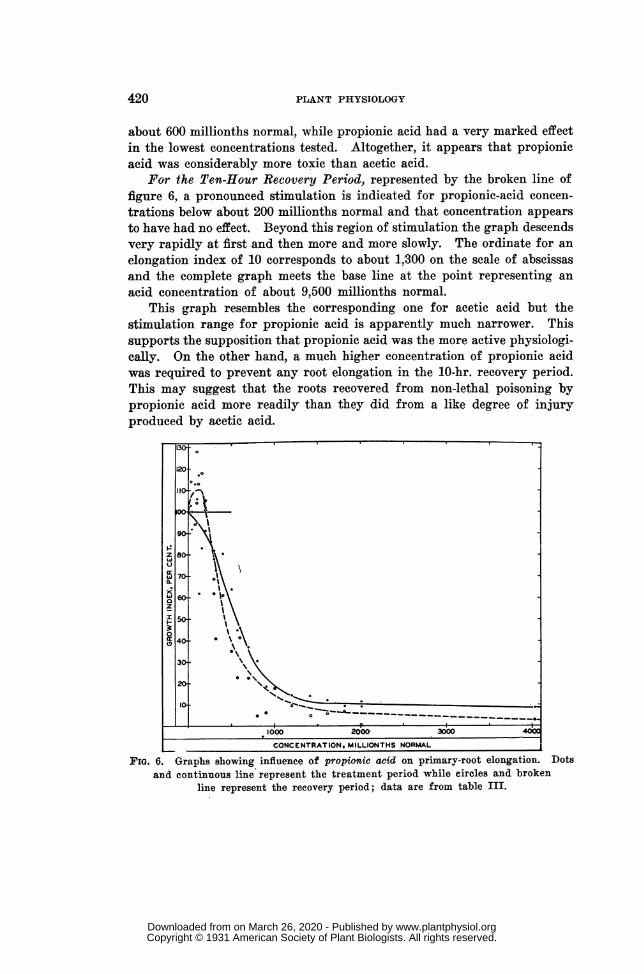
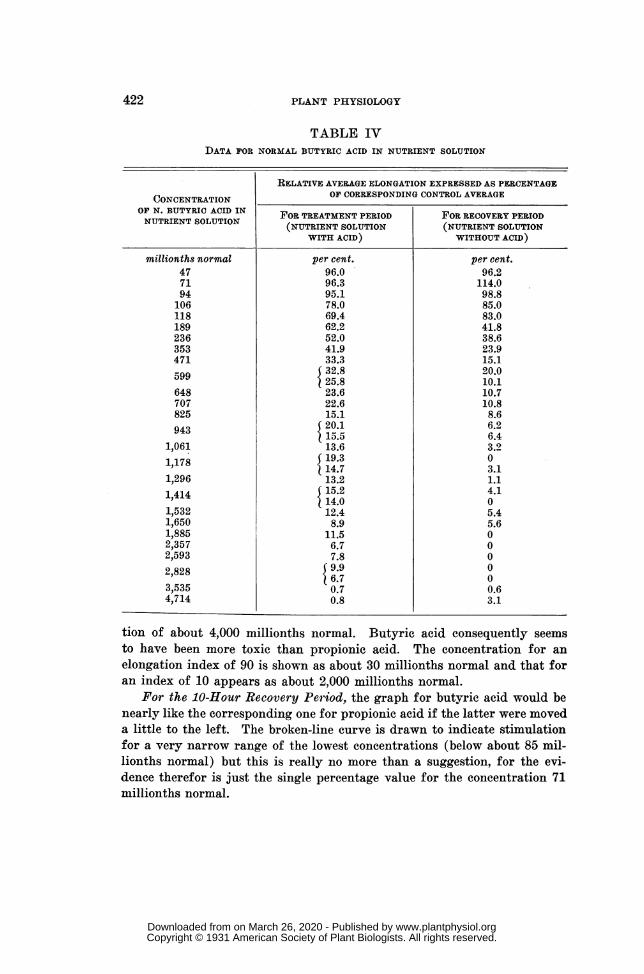
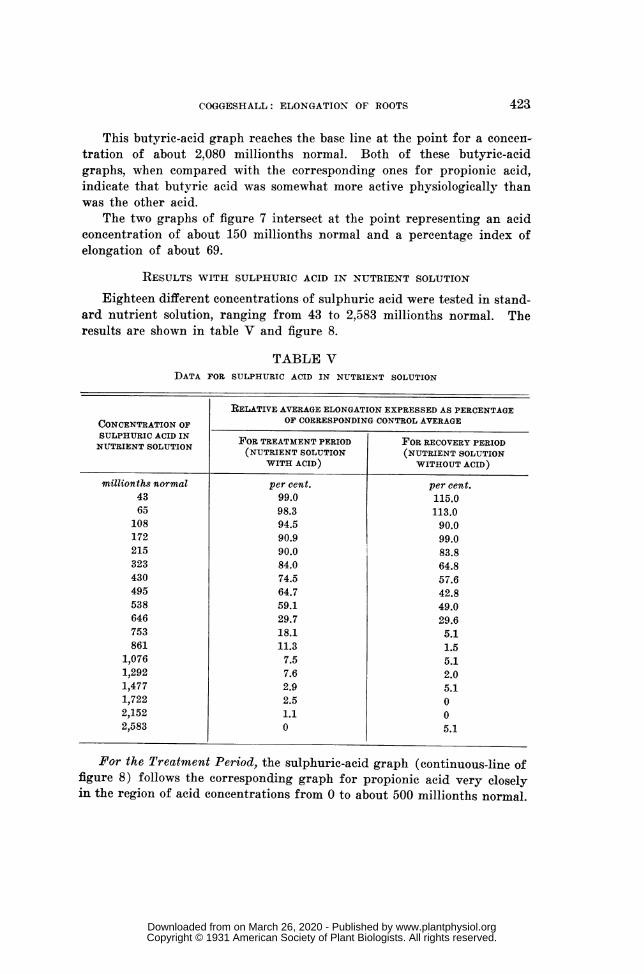


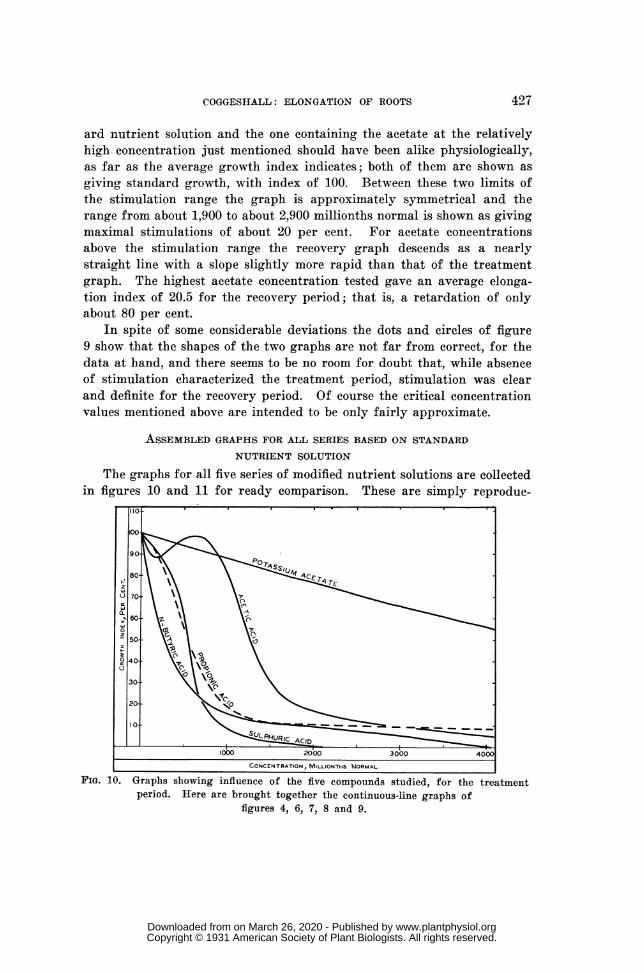

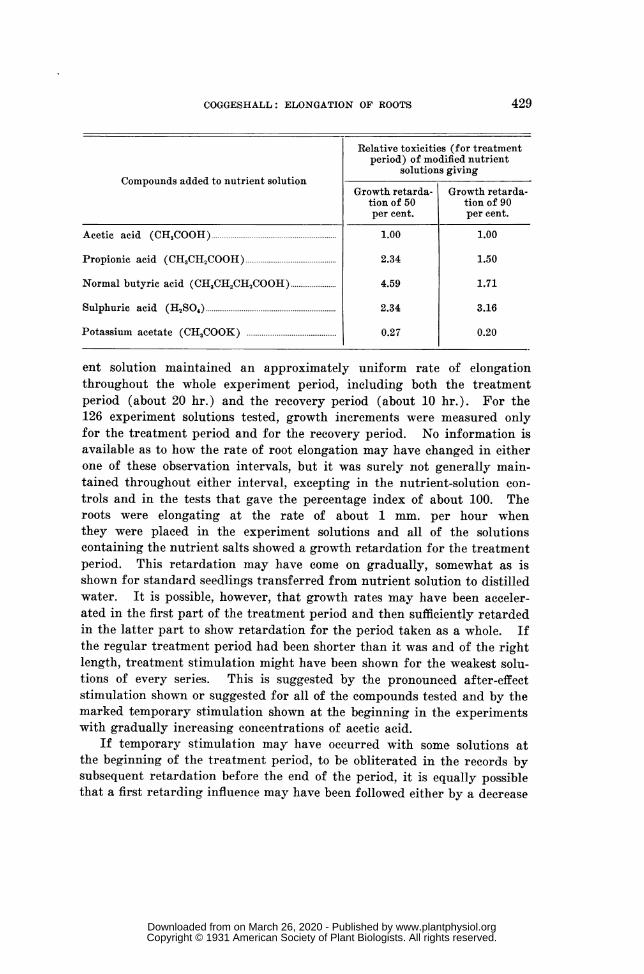
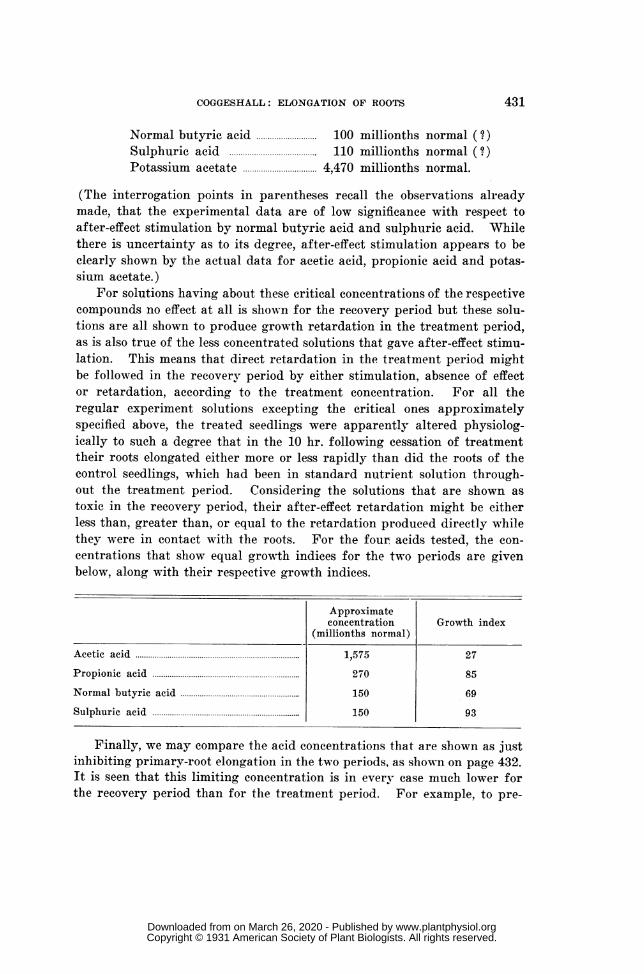


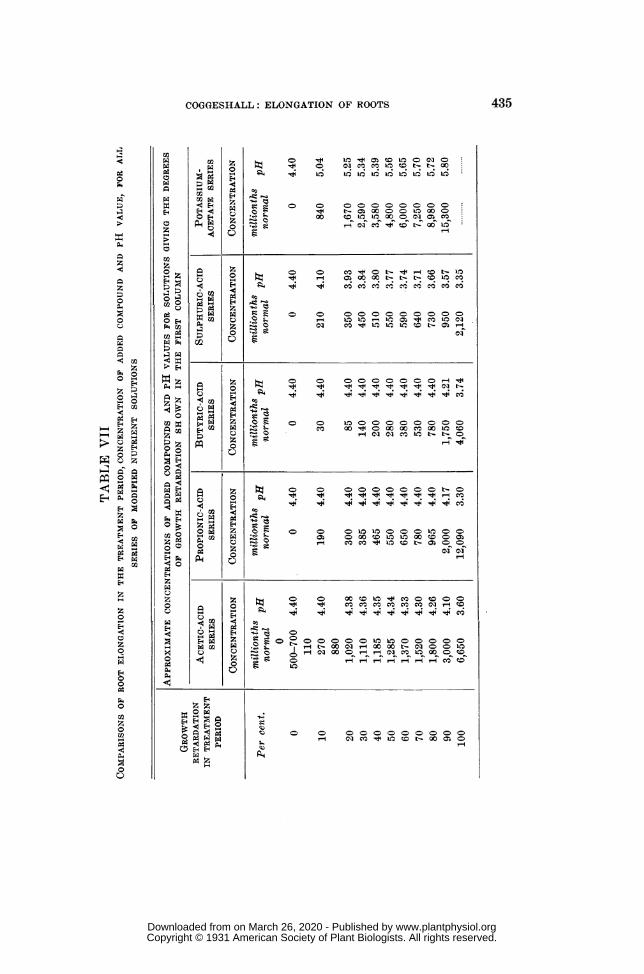


![Conventional and Inverted Photovoltaic Cells Fabricated ...koreascience.or.kr/article/JAKO201416760764766.pdf61–butyric acid methyl ester or [6,6]-phenyl-C 71-butyric acid methyl](https://static.documents.pub/doc/80x56/6095158a83c7e40411746c95/conventional-and-inverted-photovoltaic-cells-fabricated-61abutyric-acid-methyl.jpg)


