Some filler metals contain alloy additions of deoxidisers, such as phosphorous, lithium
and other elements that have strong affinities for oxygen. These additions can make the
filler metal self-fluxing without the application of prepared fluxes or controlled
atmospheres. It must be realised however, that these fillers are self-fluxing only in the
25
molten state and will oxidise during the heating cycle [19]. It is therefore recommended
that a protective atmosphere or fluxes in combination with these fillers be used.
When the brazing cycle is complete, it is necessary to remove the residual flux to avoid
problems such as corrosion or oxidation of the brazed parts when in service. This is
usually done by washing the brazed parts in warm or cold water, or by using an abrasive
such as a wire brush to dislodge stubborn flux residue [19].
2.2.3.5 Filler alloys
There are several characteristics that a brazing filler alloy must possess so that it is
compatible with a particular base alloy. A filler alloy must have a liquidus temperature
that is less than the solidus temperature of the base metal. In practice, heat-resistant
alloys are normally brazed with Ni or Co-base filler alloys that contain an MPD
element(s) such as B, Si, and P. Other elements such as Al, Ti and C are deliberately
excluded or kept to a minimum in the filler alloy as they are found to form stable
interfacial phases in the bond [2]; these phases are brittle and can weaken the joint. A
filler alloy must also be able to produce a joint with the required mechanical properties
as well as attractive chemical properties (e.g. oxidation/corrosion resistance). For this
reason, Cr is added to many filler alloys at an amount as high as 20% [21]. Another
important feature that a filler alloy must possess is proper fluidity at the brazing
temperature to ensure wetting and flow by capillary action. The best spreading
characteristics are usually associated with filler alloys with eutectic compositions rather
than those with hypo- or hyper-eutectic compositions [22]. The filler alloy must also be
26
capable of producing a bond at a temperature that will not damage the properties of
the base metal.
Filler alloys are available in several forms to suit the shape of the surface to be joined or
repaired. Available filler alloy forms include powder, paste, tape, foil, and sheet. Brazing
powders are usually produced by inert gas atomization and available in specified particle
sizes. The powders may be mixed with organic binders to facilitate positioning onto the
base metal surface. Brazing tapes are made of powders that are uniformly applied to a
flexible organic backing strip, with or without an adhesive backing [23]. Brazing foils are
amorphous and made by rapid solidification during melt spinning operations. Brazing
tapes and foils are usually utilised for applications that require a large bond area, good
fit-up, or where flow and wettability are a challenge [24].
2.2.3.6 Base alloy characteristics
In order to produce satisfactory braze joints, it is important to consider certain
characteristics of the base metal. The base metal must be able to adequately
accommodate the diffusing MPD element. It is also desirable to utilise base metals
which do not form second phases at the brazing temperature. The base alloy should
possess sufficient strength and thermodynamic stability at the brazing temperature. It is
also important that the solidus temperature of the base alloy be considerably higher
than the liquidus temperature of the filler alloy. Another factor that must be considered
is that base alloys with an initial concentration of the MPD element may behave
differently compared to base alloys which contain no MPD element [20].
27
Advantages of brazing
Strong, uniform and leak proof joints can be rapidly and simultaneously made.
Components with complex geometries and varying thickness can usually be
brazed together.
Ability to preserve protective metal coating or cladding on the materials that are
being joined.
Multicomponent assemblies can be joined with low distortion and good
resistance to thermal shock. This is made possible by heating the entire part to
the brazing temperature.
Cast and wrought alloys can be joined together to produce an integral
component.
It is possible to cosmetically produce neater joints without the need for costly
secondary operations.
Limitations of brazing
Having mentioned the attractive features of brazing, the fact still remains that a brazed
joint is not a homogeneous body, but rather, is heterogeneous, composed of different
phases with differing physical and chemical properties.
2.2.4 Transient liquid phase (TLP) bonding
TLP bonding is a high temperature fluxless process that came about as an advancement
to vacuum brazing [25]. This fairly newly developed process incorporates the beneficial
28
features of liquid phase joining and solid-state diffusion bonding. This offers the
potential to produce joints with microstructures and mechanical properties close to
those of the base material [14]. It differs from diffusion bonding in that the formation of
a liquid interlayer eliminates the necessity for a high bonding force [26].
As shown in Figure 2.6, the TLP bonding process involves the use of an interlayer that
contains an MPD element, such as B, Si and/or P. As the temperature of the joint
assembly is raised to the bonding temperature, which is well below the solidus
temperature of the base material, the interlayer melts and interdiffusion of alloying
elements takes place between the base material and the fused interlayer. As a result,
changes in the composition of the solid and liquid phases will occur until a state of
equilibrium is attained at the interface of the joint. The continuous diffusion of the MPD
element into the base material raises the melting point of the liquid filler, which results
in isothermal solidification. Therefore, for a joint to achieve complete isothermal
solidification, it must be held at the bonding temperature for a sufficient amount of time
before cooling to an ambient temperature. This is to allow for the diffusion of the entire
MPD element into the base material. Following complete isothermal solidification,
holding the joint at the bonding temperature for a longer time is usually necessary to
homogenise both the microstructure and the composition of the bonded material.
Advantages of TLP bonding process
Compared to diffusion bonding, diffusion brazing has the advantage of not
requiring the rather high pressure typically involved in a solid-state diffusion
29
Figure 2.6: Illustration of TLP bonding process
30
bonding process [27]. Moreover, it can be suitably employed for joining
intermetallic base materials, which have stable oxide films and are difficult to
joint by diffusion bonding techniques [28].
It is capable of successfully joining heat resistant alloys that are inherently
susceptible to HAZ cracking during welding or post-weld heat treatment [2, 29,
30]. It is also capable of producing sound joints between dissimilar alloy
combinations and metal-matrix composites.
Complex-shaped parts can be joined by using simple tooling and joint surface
preparation.
It allows for the mass production of parts and hence processing costs can be
significantly reduced.
Joints with microstructural and mechanical properties similar to those of the
parent metal can be produced. It is also possible to enhance the quality of the
joints by employing a suitable post-joining heat treatment.
Limitations of TLP bonding process
Long processing times that can typically be several hours. This is due to the
dependence of the isothermal solidification stage on the solid-state diffusion of
the solute element from the liquid interlayer into the base metal.
Insufficient holding time at the bonding temperature can result in the formation
of brittle phases. These brittle phases generally tend to degrade the mechanical
and chemical properties of the joint.
31
Diffusion of the MPD solute from the liquid interlayer into the base metal causes
the precipitation of second phase particles at the brazed joint interface. These
particles can have adverse effects on the mechanical properties and corrosion
resistance of the joint.
2.2.4.1 Mechanisms of TLP Bonding
Duvall et al. [2] developed TLP bonding as an alternate method to join heat resistant
alloys. In their study, where a eutectic composition interlayer was used, they described
four basic stages for TLP bonding, namely: melting of the interlayer, base metal
dissolution, isothermal solidification, and solid bond homogenisation. Tuah-Poku et al.
[27] carried out a comprehensive study on TLP bonding. By utilising a pure interlayer, a
four-stage process was defined as: dissolution of the pure interlayer, homogenisation of
the liquid interlayer, isothermal solidification, and homogenisation of the bonded
region. To account for the possible loss of the MPD solute during heating to the bonding
temperature, MacDonald and Eager [26] added an initial stage (stage 0) prior to the
base metal dissolution stage. This effect was reported by Niemann and Garret [31] and
Nakagawa et al [32] for slow heating rates which allow for the premature diffusion of
the MPD solute into the base material, resulting in a lack of liquid formation at the joint
interface.
To simplify the theoretical description of the TLP bonding stages (as shown in Figure
2.7), it is most appropriate to use an interlayer with a eutectic composition of CE. This is
32
Figure 2.7: Schematic of the mechanisms controlling TLP bonding process [33]
33
inserted between two pure A base metals of composition CA. Therefore, the assembly
can be described as an A/A-B/A system, where B is the MPD solute.
a) Heating and melting of the Interlayer
During this stage (Figure 2.7a), the assembly to be bonded is heated to the bonding
temperature, TB, which is normally above the melting point (eutectic temperature), TM,
of the filler alloy. Thus, the filler alloy melts and fills the joint. During the heating stage,
before the interlayer reaches the melting point, some solid state diffusion may take
place between the filler alloy and the base metal. The amount of diffusion will depend
on several factors amongst which are the heating rate and the diffusivity of the MPD
element. As mentioned earlier, very slow heating rates may cause the MPD solute to
diffuse out of the filler before reaching the melting temperature; therefore, very little
or no liquid will form upon reaching the bonding temperature. This problem is more
pronounced when using very thin filler alloys and fillers with low MPD solute
concentrations [31].
b) Base Metal Dissolution
Base metal dissolution occurs after the liquation of the filler alloy at its melting
point and continues until the bonding temperature is achieved. The local melt-back
of the base metal occurs as a result of the continuous diffusion of the MPD solute
(atoms of B) from the liquid filler into the base metal, consequently increasing the
concentration of B at the base metal mating surfaces to amounts greater than C L.
Therefore, in order to attain equilibrium at the solid-liquid interface (i.e. interfacial
34
melts back into the liquid filler, and results in an increase in the volume of the
interlayer liquid phase as shown in Figure 2.7b). The interfacial reactions causing
base metal dissolution are rapid and controlled by liquid diffusion.
The dissolution stage becomes of great importance in applications such as those by
the aerospace industry. Excessive base metal dissolution of structures such as
honeycomb and rocket fins cannot be tolerated, as this can lower the load bearing
capability of thin sections. The extent of base metal melt-back depends on several
factors, including the initial concentration of the MPD solute in the filler CE, initial
filler thickness and solubility of the MPD solute into the base metal.
c) Isothermal Solidification
It is normally assumed that isothermal solidification is initiated after the dissolution
stage at a constant bonding temperature, TB, during which the MPD solute diffuses
out of the liquid interlayer and into the base metal. A state of local equilibrium is
maintained at the solid-liquid interface at all times during the isothermal
solidification stage and the composition of the liquid and adjoining solid remains
fixed at CL and C L respectively. However, as the MPD solute continues to diffuse
into the base metal, the volume of liquid which can be maintained at equilibrium
progressively decreases in order to satisfy the solute mass balance across the
interface. Therefore, solidification occurs inward from both mating surfaces by the
migration of the solid-liquid interface towards the centerline of the joint [2]. Once
the maximum concentration of the MPD solute within the joint region has been
35
reduced to C L, then the liquid is entirely removed and isothermal solidification is
completed (Figure 2.7d).
The isothermal solidification stage is very slow compared to the dissolution stage as
it is controlled by the solid-state diffusion of the MPD solute into the base metal.
The time necessary to achieve complete isothermal solidification depends on the
diffusion flux of the solute in the base metal and on the amount of solute that
needs to be diffused. These depend on several factors, including initial filler
thickness, diffusion of the MPD solute into the base metal, solubility of the MPD
solute and its concentration gradient in the base metal.
d) Joint Homogenisation
Following the isothermal solidification stage, a homogenisation process is carried
out at a temperature which may be different from the bonding temperature. During
homogenisation, the remainder of the MPD solute diffuses out of the joint and its
concentration is decreased whilst other alloying elements diffuse from the base
alloy into the joint [34]. Ideally, at the end of the homogenisation process, the joint
will be identical both in chemistry and microstructure to the base alloy. After
homogenisation is completed, there can be a tolerable amount of the MPD solute
that remains in the joint, which generally depends on the material and the intended
application of the repaired part as well as the practicality of the homogenisation
treatment.
36
2.2.4.2 Modeling of Isothermal Solidification Kinetics
An extensive body of work on modeling the TLP bonding process has been built over
many years in an effort to accurately predict the conditions needed to complete
bonding. One of the common goals that drive the modeling work is to predict the
completion times required for each stage of the process (i.e., base metal dissolution,
isothermal solidification, and homogenisation). However, the bulk of the work has been
geared towards modeling of the isothermal solidification stage, as its kinetics are
controlled by the slow solid state diffusion of the solute element into the base metal,
and thus, requires a much longer completion time than that required for the other
stages. For this reason, it was suggested that a reasonable estimation of the completion
time for the isothermal solidification stage can be used as an approximation for the
whole process [26, 35]. Other common goals of the modeling work include the ability to
select an optimum filler alloy (i.e. composition and thickness) and bonding parameters
(e. g. temperature and time), which will optimise the completion time of the TLP
bonding process [36].
The following is a review of some of the research work that has been done on the
modeling of the isothermal solidification stage. In these models, some fundamental
assumptions are made, amongst which, local equilibrium is assumed to exist at the
solid-liquid interface at the bonding temperature. They also assume that the effect of
convection in the liquid is negligible due to the small thickness of the liquid interlayer
[27]. The interdiffusion coefficients in the solid and liquid (DS and DL) are considered to
37
be independent of the composition [27] and the base metal is assumed to be a semi-
infinite medium.
Premised on the previous assumptions, the analytical modeling of the isothermal
completion time can be classified into two major categories, single-phase solution and
two-phase solution. In the single-phase solution, the system is treated as a single semi-
infinite phase, with the base metal having a constant solute concentration (C L) at its
surface. The two-phase solution, however, treats the system as two semi-infinite phases
with a diffusion-controlled solid-liquid moving interface [37]. The latter solution is much
more accurate in approximating real situations, especially as it allows for the
advancement of the interface towards the centerline as the liquid is consumed.
Based on the single-phase model approach, Tuah-Poku et al [27] utilised an error
function to represent the solute distribution in a semi-infinite base metal, as described
below:
tD
xerfCCCtxC
s
LML4
)(),( (1)
where C L is the solute concentration at the surface of the base metal
CM is the initial solute concentration in the base metal
Ds is the solute diffusivity in the base metal_
t is the solidification time
38
x is the distance along the specimen length from the surface.
By using the above error function, the total amount of solute (Mt) diffused into the base
metal at time (t) is given by:
tDCCdt
dx
dcM s
ML
t
t )(20
(2)
If the amount of solute diffused into the base metal during the heating and dissolution
stages is assumed to be negligible, then the total amount of solute diffused into the
base metal at the end of the isothermal solidification stage can be considered equal to
the original solute concentration of the filler metal [35], such that:
tDCCWC s
MLoE )(4 (3)
where CE and Wo are the original solute concentration and the initial width of the filler
metal, respectively.
Upon rearrangement of Equation (3), the isothermal solidification completion time may
be expressed as follows:
2
16
ML
oE
s CC
WC
Dt
(4)
The above approach was also followed by Onzawa et al [38], Ikawa et al [39], and Nakao
et al [40] to model the isothermal solidification stage.
39
By adopting a two-phase analytical approach, Lesoult [41] aimed for a more accurate
treatment of the problem. A general error function was employed to represent the
solute distribution in the solid phase as shown below:
tD
xerfAAtxC
s4),( 21 (5)
where A1 and A2 are constants determined by the specific boundary conditions:
When x , MCAAtC 21),( (6)
and at the moving solid/liquid interface, i.e. x = X(t)
L
s
CtD
tXerfAAttXC
4
)()),(( 21 (7)
where C L is the solute concentration of the solid phase at the interface.
Since Equation (7) must be satisfied for all values of t, X(t) must be proportional to t½
i.e.,
tDktX s4)( (8)
where k is the rate constant. An increasing k results in a faster solid/liquid interface
motion and a shorter isothermal solidification completion time.
Mass balance at the interface produces the following expression:
40
)(
),()()(
tXx
LLx
txCD
dt
tdXCC
(9)
where CL is the solute concentration in the liquid phase at the moving solid/liquid
interface.
The solving of Equations (5) and (9) produces:
LL
ML
CC
CC
k
kerfk
)exp(
))(1(2
2
1
(10)
Numerical methods were employed by Lesoult [41] to calculate the rate constant k in
Equation (10), which is eventually used to compute the time necessary for complete
isothermal solidification as shown in the expression below:
Dk
Wt
2
2
max
16 (11)
where Wmax is the maximum liquid width calculated by using the mass balance method
[27]. Comparable solutions to the above were also derived by Sakamoto et al [42] and
Ramirez and Liu [43] by using a similar approach.
The single-phase solution (Equation (4)) derived by Tuah-Poku et al [27] was found to
greatly overestimate the isothermal solidification completion time. They explained this
overestimation with the possibility that the solidification process has been accelerated
due to ledge-type interface migration, as well as the effect of grain boundary grooving.
Work carried out later by Zhou [37] suggested that the overestimated time predicted by
41
Equation (4) may actually be due to an inaccurate assumption made during the
derivation. A major assumption made in the single-phase solution is a stationary
interface, and accordingly, Equation (1) is used to represent the distribution of the
solute in the solid base metal. This assumption is unsuitable in most cases, since in
reality, it is known that the liquid/solid interface migrates during the isothermal
solidification stage. There is, however, an exception where Equation (4) can closely
estimate the isothermal completion time. In cases where k is very small (this occurs
when values of CM and C L are very small compared to that of CL (Tuah-Poku et al [27]),
the rate of isothermal solidification becomes very slow and the solid/liquid interface can
be considered stationary [35].
The previously discussed models assume that the base metal dissolution and the
isothermal solidification stages occur in a sequential fashion. Gale and Wallach [44, 45] ,
however, took a different approach in which they considered these two stages to be
occurring simultaneously rather than sequentially. Nakagawa et al [32] and Lee et al [46]
also proposed this same assumption. In this approach, the liquid phase and the solid
substrate are treated as a continuum, which is represented by using the following
equation:
tD
xherf
tD
xherfCCCtxC
ss
MEM442
1, (12)
where CM is the initial solute concentration in the base metal
CE is the initial solute concentration in the interlayer
42
C(x,t) is the initial solute concentration as a function of distance from the
center of the interlayer (x) and time (t).
This equation presents the solute distribution in a semi-infinite substrate for an
unsteady state diffusion of specie from a source with an initial thickness 2h, which is of
the order of the diffusion distance (Dt)½. At the end of the isothermal solidification
stage, the solute concentration at the center of the interlayer is reduced to the solidus
value C L such that C(x,t) = C L at x = 0. Taking this into account, Equation (12) can be
reduced to estimate the isothermal completion time, tf, as follows:
fs
MEMLtD
herfCCCC
4 (13)
This approach has been reported to show reasonable agreement between the estimated
and experimental values of tf [44, 45, 47].
One of the fundamental assumptions made in analytical modeling is considering the
base metal to be a semi-infinite medium. This assumption is only valid for applications
where the thickness of the parts to be joined is much larger than the diffusion distance.
For applications that involve thin sections, such as those found in the microelectronics
industry and in honey-comb structures, the assumption of a semi-infinite medium can
be greatly incorrect [48].
43
2.2.4.3 Development and applications of TLP bonding for superalloys
The earliest mention of the modern industrial application of TLP bonding is attributed to
Lynch et al [49], in which they prepared an interface free TLP joint in Ti by using an Ni-
copper interlayer, and called the process ‘eutectic brazing’. Owczarski et al [50] joined
dissimilar metals Zircaloy 2 to 304 stainless steel without incorporating an interlayer,
but rather, a eutectic was formed that progressively dissolved each metal, and this was
termed ‘eutectic bonding’. The ‘solid-liquid interdiffusion bonding’ (SLID) process was
introduced by Bernstein and Bartholomew [51, 52] , by which they produced bonds on
electrical components through the use of a ternary system Ag-In-Sn. In this variation,
isothermal solidification was not completed; however, successive bonds were produced
at decreasing temperatures and high temperature exposure helped to homogenise the
joint.
By the 1970s, the TLP bonding process was being developed as a bonding technique in
the aerospace industry. While working for General Electric at the Air Craft Engine Group,
Hoppin and Berry [53] developed ‘activated diffusion bonding’ (ADB) for joining several
superalloys through the use of an Ni-base eutectic interlayer. By using a process
patented by Owczarski et al [54], Duvall et al [55] joined superalloy Udimet 700 by using
an Ni-Co interlayer at Pratt and Whitney. Later, in 1974, Duvall et al called the joining
process ‘transient liquid phase bonding’ (TLP) and copyrighted the term; they used the
TLP process to join several similar alloys by using an Ni foil that contained B as the MPD
solute and achieved joints with near base metal properties [2].
44
Several researchers have reported the use of the TLP technique for a spectrum of
superalloys. Besides the application of this technique for joining alike base-metal
components, it has also been used for joining dissimilar superalloys as well as single
crystal and oxide dispersion strengthened superalloys [56, 25, 57]. Specific applications
include the repair of Ni-base superalloy turbine blade components and joining of heat-
resistant alloys that are inherently susceptible to hot cracking or post-weld heat
treatment cracking [25, 58, 59, 60, 61].
In addition to those previously mentioned, there are other variants of the TLP bonding
process. ‘Liquid interface diffusion’ (LID) was developed to bond honeycomb sandwich
structures [62]. Another variant is wide-gap TLP bonding for 100-500 μm gaps by using
multiple layers of melting and non-melting constituents within the joint. It was initially
developed by Nakao et al [63, 64], and later modified to include the use of powder
within the joint [65]. This technique can also be used in conventional TLP bonding to
accelerate isothermal solidification [66, 67]. New technologies are also evolving, such as
‘temperature gradient TLP’ (TG-TLP) bonding [68, 69], where a temperature gradient is
imposed across the substrate-joint interface to decrease the time required for complete
isothermal solidification.
2.3 Scope of the present work
As discussed in the previous sections, TLP bonding is proving to be a promising
technique for the effective joining of difficult-to-weld Ni-base superalloys with a high
45
volume fraction of the γ’ phase. An important process parameter in the consideration of
TLP bonding for commercial applications is the holding time (tf) required to achieve
complete isothermal solidification, which is necessary for preventing the formation of
eutectic constituents that degrade the properties of the joined material. Several studies
have been undertaken to investigate the effect of different parameters and factors, such
as bonding temperature, filler alloy thickness and composition, on the rate of the
isothermal solidification of the liquated interlayer that determines the tf during TLP
bonding. However, an important factor that can highly influence the TLP bonding
process and ultimately affect the processing time (tf), is the chemical composition of the
base-alloy, and this is seldom reported in the literature.
In view of the above, the primary objective of this work is to study the influence of base-
alloy composition on tf during the TLP bonding of different Ni-base superalloys. To
achieve this objective, three Ni-base superalloys, namely, polycrystalline IN738, DS
Rene80, and DS IC6, are selected to be bonded at various temperature and time
combinations. These commercial nickel-base superalloys with different chemical
compositions were selected for this study as representatives of the general qualities
possessed by different Ni-base superalloy groups. Conventionally cast IN 738, although
considered an old generation superalloy, is still heavily utilised in the manufacture of
hot section components of air craft engines and power generation turbines, as it is
renowned for its high creep rupture strength and remarkable hot corrosion resistance at
service temperatures of up to 980oC. Alloy Rene80, a newer generation Ni-base
superalloy, is also used at service temperatures close to those of IN 738 and found in
46
parts such as the blades and vanes of aero-engines and power generating gas turbines.
However, directional solidification processing allows Rene80 to be utilised at higher
service temperatures with a reported 4 times increase in creep rupture life compared to
the conventionally cast material. A newly developed class of Ni-base superalloys are the
Ni aluminides. These intermetallic-base alloys have developed as prime alternates for
existing Ni-base superalloys which have almost reached their peak temperature limit of
application. Alloy DS IC 6 is one of the Ni3Al-based alloys that has been developed at the
Beijing Institute of Aeronautical Materials as a high-temperature structural material for
manufacturing advanced jet-engine components. It exhibits advanced creep-rupture
properties, and can withstand service temperatures of up to 1100oC, which is higher
than that of the majority of currently used Ni-base superalloys.
This work, as well as other studies, has shown that alloy IN738 suffers from an
anomalous behaviour where prolonged holding time is required to achieve complete
isothermal solidification, when the bonding temperature is increased. In an effort to
reduce the tf in such alloys, an experimental study is carried out to explore the
effectiveness of using a composite powder mixture, which comprises filler and base
alloy powders, as an alternative to filler alloy alone.
A complementary experimental investigation is also carried out to study the effect of
various factors on the dissolution of gap-filler powder particles present in the composite
powder mixtures. The factors studied include: bonding temperature, mixing ratio of
47
filler alloy to gap-filler alloy (RF:G), type of MPD solute, type of gap filler, and size of gap
filler powder particles.
48
3 Experimental techniques
3.1 Base and filler alloys
The Ni-base superalloys used in the experimental investigation of this work are
polycrystalline IN738, DS Rene80, and DS IC6. Alloys IN738 and DS IC6 were used in the
as-cast condition, while DS Rene80 was used in the solution-treated condition (2 hrs at
1204oC). The chemical compositions of the alloys to be investigated are listed in Table
3.1. The brazing alloys used are Metglass MBF-80 brazing foil and Nicrobraz 150 powder
and additive gap-filler alloys Amdry7380 and Amdry7381 powders. The chemical
compositions and size of the brazing alloys are listed in Table 3.2.
3.2 Sample Preparation and TLP Bonding
The as-received base material plates were sectioned into various sample configurations
by using numerically controlled electro-discharge machining (EDM). Following this, all
mating surfaces were grounded by using 600 grade SiC paper, to ensure the removal of
any oxide layer formed during the machining operation. After grinding, the specimens
were ultrasonically cleaned in an acetone solution for about 15 minutes. A ceramic
coating was applied to the non-mating surfaces of the specimens to prevent spillage and
escape of the molten filler from the joint during bonding.
When using the foil filler alloy, the bond assembly consisted of two 2.5 x 8 x 10 mm base
alloy coupons placed onto one another, with the filler foil placed between them as
49
Table 3.1: Nominal chemical composition of base materials
Base Material Nominal Chemical Composition wt%
Inconel 738LC
15.84Cr, 8.5Co, 1.88Mo, 2.48W, 0.92Nb,
3.6Al, 3.47Ti, 0.07Fe, 1.69Ta, 0.11C,
0.012B, 0.04Zr, 0.001S, Bal. Ni
DS Rene80
14.1Cr,9.82Co, 3.98Mo,4.0W, 0.02Nb,
2.9Al, 4.98Ti, 0.18Fe, 0.2C, 0.012B, 0.028Zr,
0.001S, 0.02Hf, Bal. Ni
DS IC 6 14.0Mo, 8.0Al, 0.06B, Bal. Ni
Table 3.2:Nominal composition of filler alloys and gap-filler powder size
Filler Alloy Nominal Chemical Composition wt%
Nicrobraz 150 15.0Cr, 0.03C, 3.5B, Bal. Ni
MBF80 15.0Cr, 0.06C, 4.0B, Bal. Ni
Additive Gap-Filler Nominal Chemical Composition wt% /
Powder Size
Amdry7381 (coarse powder) Same as IN738 (Table 3.1)/ -120 +325mesh
(-125 +45 μm)
Amdry7380 (fine powder) Same as IN738 (Table 3.1)/ -325 mesh (-45 μm)
50
schematically shown in Figure 3.1 a. However, when the powder filler alloy was used
(with or without the additive gap-filler), a butt-joint configuration was also used, as
shown in Figure 3.1 b, in which a gap of 200 or 350 μ was created half way in the 2 x 8 x
5 mm base alloy coupons to facilitate the accommodation of the powder material. The
TLP bonding operations were carried in a vacuum furnace, operated at a vacuum of
approximately 5 x 10⁻⁵ torr, and programmed to follow a temperature-time cycle as
schematically shown in Figure 3.2.
3.3 Microscopic Examination
Bonded samples were sectioned by using EDM and prepared via a standard
metallographic procedure for microstructural examination. The sectioned samples were
polished, and then etched by using a Marbles reagent that contained 4 g CuSO4 + 20 ml
HCl + 20 ml H2O. Electrolytic etching was applied to some samples by using a solution of
12 ml H3PO4 + 40 ml HNO3 + 48 ml H2SO4 at 6V for 5 seconds. The microstructure of the
bonded samples was examined via an inverted optical microscope and a JEOL 5900
scanning electron microscope (SEM) equipped with an ultra thin window Oxford energy
dispersive x-ray spectrometer (EDS). For samples that contained a centerline eutectic,
an average of 20 measurements was taken across the eutectic to determine its width.
Semi-quantitative chemical compositional analysis of the phases formed in the joint was
carried out by EDS equipped with INCA analytical software.
51
Figure 3.1: Configuration of samples: (a) lap joint, (b) butt-joint
Figure 3.2: Heating cycle used during TLP bonding
0
200
400
600
800
1000
1200
1400
0 20 40 60 80 100 120 140 160
Tem
pe
ratu
re (
De
g.C
)
Time (min)
Ramping to bonding temperature in 60 min
Bonding Temperature/Time
Furnace cooling
52
4 Results and Discussion
4.1 Microstructural examination of pre-bonded alloys
4.1.1 Microstructure of as received IN738
IN738 has a coarse grain size that ranges from 500 – 800 μm. The grains show well
serrated boundaries, as shown in Figure 4.1, which is known to hinder grain boundary
sliding and instead promote intragranular deformation [70]. The cast alloy essentially
consists of the γ matrix with extensive precipitates of the γ’ intermetallic phase. MC
carbides, mainly consisting of Ti (47-50 at.%), Nb (20-27 at.%) and Ta (17-23 at.%), and
γ-γ’ eutectics are also present, as shown in Figure 4.2.
4.1.2 Microstructure of as received DS IC 6
The typical microstructure of the as received DS IC6 specimen is shown in Figure 4.3.
The back scatter electron image in Figure 4.4 shows three major phases confirmed by
the EDS analysis to be γ’, γ, and borides. Area A is the interdendritic area that consists
of fine cubic shaped γ’-Ni (Al, Mo), with a chemical composition of 73-74 at.% Ni, 20-21
at.% Al, and 4.9 -5.4 at.% Mo, surrounded by a skeleton of γ and the white particles of
boride. Area B is a dendrite arm that consists of large blocky shaped γ’ phase particles
surrounded by a two phased (γ’+γ) network similar to that present in Area A.
4.1.3 Microstructure of as received DS Rene 80
The microstructure of the as received DS Rene 80 is shown in Figure 4.5, which depicts
the solidification direction of the alloy. The as received alloy mainly consists of
53
Figure 4.1: Optical micrograph showing serrated grain boundary in as cast IN738
Figure 4.2: SEM micrograph of γ-γ’ eutectic island and MC carbide in as cast IN738
MC Carbide
γ – γ’ eutectic
54
Figure 4.3: Optical micrograph showing interdendritic (A) and dendritic (B) microstructure in as received DS IC6 alloy
Figure 4.4: SEM micrograph showing Mo-rich borides in the interdendritic area (A) in the as received DS IC6 alloy
A
B
A
B
Mo-rich borides
55
secondary γ’ particles and MC-type carbides surrounded by the γ phase (Figure 4.6). The
SEM EDS analysis of the MC-type carbides shows that the main metallic constituent in
most of the carbides is Ti (70-75 at.%) , as well as smaller amounts of Mo (12-15 at.%)
and W (6-7.5 at.%). Additionally, many incipiently melted regions were observed in the
microstructure (Figure 4.7). Chemical analysis of different phases in these incipiently
melted regions by SEM EDS indicates the presence of Cr-Mo-rich borides (Cr 36.4 at.%,
Mo 37.7 at.%), and rod-shaped sulfocarbides rich in Ti, Zr and S.
4.2 Microstructural observation of post-bonded alloys
4.2.1 Microstructure of TLP bonded alloys at 1100oC
IN 738 alloy coupons were TLP bonded in vacuum for various holding times that ranged
from 30 to 240 min by using an 80 μm thick foil of MBF-80 filler sandwiched between
two coupons, at a temperature of 1100oC. The microstructure of a section of the
bonded sample after 60 min of holding time is shown in Figure 4.8. It can be seen that
the microstructure consists of a centerline eutectic as well as an isothermally solidified
pro-eutectic region on either side, bordered with second phase precipitates at the joint-
base metal interface. As suggested by the EDS semi-quantitative compositional analysis
(Table 4.1), the centerline eutectic is found to consist of Ni-rich and Cr-rich boride
phases (presence of B was detected in these phases, but it is not possible to quantify B
as a result of the limitation of the EDS analytical software in quantifying light elements
56
Figure 4.5: Optical micrograph showing direction of solidification in as received DS Rene80
Figure 4.6: SEM micrograph showing secondary γ’ and MC carbides in the microstructure of as received DS Rene80
MC Carbides
57
Figure 4.7: SEM micrograph showing an incipiently melted region in the microstructure of as received DS Rene80
Figure 4.8: SEM microstructure of centerline eutectic for a joint in alloy IN738 bonded at 1100 oC for 1hr using NB150 filler alloy
MC Carbide
Mo-Cr-rich
boride
Sulfocarbide
Cr-rich boride γ – solid solution
Ni-rich boride
Base alloy
Isothermally solidified region
Isothermally solidified region
58
Table 4.1: Composition of metallic constituents of centerline eutectic for a joint in alloy IN738 bonded at 1100 oC for 1hr using NB150 filler alloy
Element Nickel rich boride
phase (at.%)
Chromium rich
boride phase (at.%)
γ –solid solution
phase (at.%)
Al 0.8 - 1.8
Ti 5.4 0.8 0.9
Cr 8.7 90.1 18.4
Co 3.0 0.2 2.3
Ni 80.0 2.7 75.2
Nb 1.1 - -
Ta 1.0 - 0.5
W 0.3 1.2 0.9
Mo - 4.9 -
59
with an atomic number less than 10 [47]), as well as a third phase identified to be an Ni-
base γ-solid solution phase. Previous research on diffusion brazing [2, 71], has shown
that these phases are formed during the athermal solidification of the residual liquid
interlayer as a result of incomplete isothermal solidification at the bonding temperature.
Figure 4.8 also shows an isothermally solidified pro-eutectic region on either side of the
centerline eutectic. The EDS compositional analysis reveals that this region has a
composition similar to that of the Ni-base γ-solid solution phase present in the eutectic
centerline. This pro-eutectic region is formed by interdiffusion induced compositional
changes, which result in the isothermal solidification of the liquid insert.
Similar to alloy IN738, the coupons of alloys DS IC6 and DS Rene80 were also TLP
bonded at 1100oC for holding times that varied between 30 and 240 min by using an 80
μm thick foil of MBF-80 filler alloy. The microstructures of a section of the bonded
sample, for both DS IC6 and DS Rene80, after 60 min of holding time, are shown in
Figures 4.9 and 4.10 respectively. The SEM EDS compositional analysis of the centerline
eutectic of both alloys (Tables 4.2 and 4.3) suggests that it consists of Cr-rich and Ni-rich
borides, as well as a γ-solid solution similar to the isothermally solidified region.
Since the centerline eutectic represents the liquid that remains prior to athermal
solidification at the end of each holding time, the width of the centerline eutectic (liquid
remaining) was found to constantly decrease with increases in holding time (Figure
4.11), such that, complete isothermal solidification of the joints was achieved within 240
min at a temperature of 1100oC. All three alloys showed comparable behaviour in terms
60
Figure 4.9: SEM microstructure of centerline eutectic for a joint in alloy DS IC6 bonded at 1100 oC for 1hr using NB150 filler alloy
Figure 4.10: SEM microstructure of centerline eutectic for a joint in alloy DS Rene80 bonded at 1100 oC for 1hr using NB150 filler alloy
Base metal
γ-solid solution Ni-rich boride Cr-rich boride
Isothermally solidified region
Cr-rich boride
Ni-rich boride γ-solid solution
61
Table 4.2: Composition of metallic constituents of centerline eutectic for a joint in alloy DS IC6 bonded at 1100 oC for 1hr using NB150 filler alloy
Element Nickel rich boride
phase (at.%)
Chromium rich
boride phase (at.%)
γ –solid solution
phase (at.%)
Al 2.8 - 5.9
Cr 10.0 61.8 12.3
Mo 1.1 18.0 1.3
Ni 86.1 20.2 80.5
Table 4.3: Composition of metallic constituents of centerline eutectic for a joint in alloy DS Rene80 bonded at 1100 oC for 1hr using NB150 filler alloy
Element Nickel rich boride
phase (at.%)
Chromium rich
boride phase (at.%)
γ –solid solution
phase (at.%)
Al 1.8 - 1.2
Ti 5.8 1.0 2.3
Cr 7.3 65.7 16.9
Co 3.1 2.3 3.2
Ni 81.5 15.7 74.8
Nb - - 0.1
W 0.1 2.4 0.4
Mo 0.4 12.8 1.2
62
of the rate of isothermal solidification at this temperature and followed the parabolic
pattern for the advance of the liquid/solid interface predicted by analytical models [45].
This behaviour is somewhat expected since all three alloys are Ni-base alloys and
expected to have comparable solid-state diffusion rates (diffusivity) of B into the base
metal substrate.
4.2.2 Microstructure of TLP bonded alloys at 1150oC
A butt-joint configuration (200 μm wide) of IN 738, DS IC6, and DS Rene80 alloys were
TLP bonded in vacuum for various holding times that ranged from 1 to 52 hrs by using a
filler alloy powder of Nicrobraz150 at a temperature of 1150oC. The microstructure of a
section of the bonded sample of IN738 after 1 hr of holding time is shown in Figure 4.12.
It can be seen that the microstructure consists of a centerline eutectic as well as an
isothermally solidified pro-eutectic region on either side, bordered with second phase
precipitates at the joint-base metal interface. This is similar to what was observed in the
microstructure of joints bonded at 1100oC. The microstructure of the centerline eutectic
found in the joints of DS IC6 and DS Rene80 after 1 hr is analogous to that found in alloy
IN738, as shown in Figures 4.13 and 4.14. The SEM EDS compositional analyses of the
components of the centerline eutectic for joints made with IN738, DS IC6 and DS
Rene80, after 1 hr at 1150oC are listed in Tables 4.4, 4.5 and 4.6 respectively.
Similar to the observation made at 1100oC, the eutectic thickness in all three alloys
continued to be comparable up to 7.5 hrs of holding time. Again, this is the expected
outcome when taking into consideration that the three alloys studied are all Ni-base
63
Figure 4.11: Plot of average eutectic width vs. square root of time for alloys IN738, DS IC6, and DS Rene80 bonded at 1100 oC
Figure 4.12: SEM microstructure of centerline eutectic for a joint in alloy IN738 bonded at 1150 oC for 1hr using NB150 filler alloy
-10
0
10
20
30
40
50
60
0 5 10 15 20
Ave
rage
eu
tect
ic w
idth
(μ
m)
Time½ (min ½)
IN738
IC6
Rene80
Linear (IN738)
Linear (IC6)
Linear (Rene80)
Centerline
eutectic
Second phase precipitates
(DAZ)
Second phase precipitates
(DAZ)
64
Figure 4.13: SEM microstructure of centerline eutectic for a joint in alloy DS IC6 bonded at 1500 oC for 1hr using NB150 filler alloy
Figure 4.14: SEM microstructure of centerline eutectic for a joint in alloy DS Rene80 bonded at 1500 oC for 1hr using NB150 filler alloy
65
Table 4.4: Composition of metallic constituents of centerline eutectic for a joint in alloy IN738 bonded at 1150 oC for 1hr using NB150 filler alloy
Element Nickel rich boride
phase (at.%)
Chromium rich
boride phase (at.%)
γ –solid solution
phase (at.%)
Al 1.6 - 3.8
Ti 3.7 0.8 1.3
Cr 10.6 84.9 16.9
Co 3.4 0.4 3.3
Ni 79.1 6.2 73.9
Nb 0.5 - -
Ta 0.7 - 0.4
W 0.3 3.0 0.4
Mo - 4.7 -
Table 4.5: Composition of metallic constituents of centerline eutectic for a joint in alloy DS IC6 bonded at 1150 oC for 1hr using NB150 filler alloy
Element Nickel rich boride
phase (at.%)
Chromium rich
boride phase (at.%)
γ –solid solution
phase (at.%)
Al 3.4 - 6.6
Cr 10.4 55.0 12.4
Mo 1.2 30.1 1.4
Ni 84.7 14.8 79.5
66
Table 4.6: Composition of metallic constituents of centerline eutectic for a joint in alloy DS Rene80 bonded at 1150 oC for 1hr using NB150 filler alloy
Element Nickel rich boride
phase (at.%)
Chromium rich
boride phase (at.%)
γ –solid solution
phase (at.%)
Al 1.6 - 3.1
Ti 4.5 2.1 1.9
Cr 11.8 56.5 17.0
Co 3.8 2.4 3.9
Ni 77.7 28.7 72.9
Nb - - 0.1
W 0.2 2.7 0.6
Mo 0.5 7.6 0.7
67
alloys, and it is reasonable to say that the rate at which the MPD solute (B in this case)
will diffuse into the base alloy is comparable. However, beyond the 7.5 hr holding
period, the comparability in eutectic thickness between the three alloys appears to
cease. Figure 4.15 shows the residual liquid (centerline eutectic) in the joints of all three
alloys after 12 hrs. It is clear that the average eutectic width for the IN738 alloy is larger
than that for the DS Rene80 and DS IC6 alloys. With further increase in the holding time
to 16 hrs, alloy DS IC6 shows evidence of a joint with complete isothermal solidification,
while alloy IN738 joint continues to show a centerline eutectic as evidence of
incomplete isothermal solidification (Figure 4.16). For a joint fabricated by TLP bonding
to be of sound quality, complete isothermal solidification of the joint must take place by
diffusing the MPD solute out of the joint and gradually reducing the liquid interlayer
until it completely disappears. Evidence of residual liquid in the joint in the form of a
centerline eutectic indicates the need for an extended holding time to allow for further
diffusion of the MPD solute. Thus, the departure from comparability in eutectic
thickness experienced by IN738, points to the need for a longer holding time tf to
achieve complete isothermal solidification. As such, a longer processing time is needed
to achieve a reliable joint in alloy IN738 as compared to alloy IC6. An experiment
showed that even after 52 hrs of holding time, the IN738 joint was still showing
evidence of discrete eutectic constituents. Alloy Rene80 also experienced some
departure from comparability in eutectic thickness, as it needed 26 hrs of holding time
to produce a joint with complete isothermal solidification compared to alloy IC6 which
68
Figure 4.15: SEM micrograph of centerline eutectic for a joint in alloy (a) IN738, (b) DS IC6, and (c) DS Rene80, bonded at 1150 oC for 12hrs using NB150 filler alloy
a
c
b
69
Figure 4.16: SEM micrograph of a joint in alloy (a) IN738 and (b) DS IC6, bonded at 1150 oC for 16hrs using NB150 filler alloy
a
b
70
needed 16 hrs. However, the extension in tf required by alloy Rene80 is far less than that
required by alloy IN738.
A plot of the average eutectic width against square root of holding time for the three
studied alloys at 1150oC is presented in Figure 4.17. It shows a linear relationship up to a
holding time of 7.5 hrs, beyond which significant deviation from linearity occurs for alloy
IN738, while DS IC6 retains a linear relationship to the end of the isothermal
solidification, and DS Rene80 suffers from some deviation towards the end. The
relationship between the average eutectic width and the square root of time is
predicted by standard analytical models to be of a parabolic nature (linear relationship).
Moreover, although deviation from parabolic behaviour has been reported to occur in
Ni-base superalloys, it is rather unexpected to see alloys with the same base constituent
(Ni in this case) to behave in a different fashion when bonded under the same
conditions (temperature, time, and brazing filler alloy), such that an alloy like DS IC6
maintains a constant behaviour until a eutectic-free joint is achieved, while another
alloy, such as IN738, significantly deviates from the parabolic behaviour and
consequentially suffers an extension in tf. The difference in the behaviour of the three
studied alloys when bonded at 1150oC is especially unexpected in view of the fact that
these same alloys had shown comparable behaviour when bonded at a temperature of
1100oC (Figure 4.11). It is well recognised that the diffusivity of the MPD solute into the
base-metal substrate is the main factor that controls the rate of isothermal
solidification, and thus, the tf required to achieve a eutectic-free joint. Hence, the
comparable behaviour shown by the three studied alloys when bonded at 1100oC,
71
Figure 4.17: : Plot of average eutectic width vs. square root of time for alloys IN738, DS IC6, and DS Rene80 bonded at 1150 oC
-20
0
20
40
60
80
100
120
140
160
180
200
0 10 20 30 40 50 60
ave
rage
eu
tect
ic w
idth
(m
icro
me
ters
)
square root of time (min^0.5)
Rene80
IC6
IN738
72
leading to a similar tf in all three alloys, would suggest that they all have similar
diffusivity of MPD solute into the base-alloy substrate. As such, the anomalous
difference in the behaviour of the alloys when bonded at a temperature of 1150oC
would suggest that another factor other than diffusivity is coming into play at higher
bonding temperatures. This factor appears to be overriding the effect of diffusivity at
higher bonding temperatures and causing an extension in tf for some alloys such as IN
738, while aiding in achieving a reasonable tf for alloys such as DS IC6.
4.2.3 Cause of extension in tf for alloy IN738 with increase in temperature
Standard analytical TLP bonding models are based on solving Fick’s second law of
diffusion equation:
2
2
x
CD
t
C
(1)
where ∂C/∂t is the change in the solute concentration with time at a given position in
the base metal, D is the diffusion coefficient, and ∂2C/∂x2 is the rate of change of the
solute concentration gradient (∂C/∂x) with respect to distance (x) [26, 27, 35, 72].
Generally, these standard analytical models make the assumption that during the
isothermal solidification stage, diffusion-induced displacement of the solid/liquid
interface, h, follows a parabolic law,
)(2 2
1
th (2)
73
where t is the holding time and the parameter φ indicates the rate of the interface
migration. This implies a linear relationship between the residual interlayer liquid
thickness and square root of holding time. An inherent assumption in these models is
that the base metal is of infinite or semi-infinite thickness; this in turn, permits the use
of error function solutions of the Fick’s diffusion equation to represent solute
distribution in the solid substrate. As such, the advance of the solid-liquid interface is
allowed to maintain a parabolic relationship with time during the continual diffusion of
the MPD solute into the base metal, even though its concentration gradient in the solid
is constantly reducing. Based on this approach, it was previously found that predicted
holding times required to achieve complete isothermal solidification agreed reasonably
well with experimentally determined values for different alloy systems, including Ni-
base alloys. However, recent studies [27, 42, 61, 73, 74, 75] have shown that deviation
from this parabolic rule can occur with increases in bonding temperature, with the
consequence of an increase in the isothermal solidification time tf. This behaviour is
considered rather anomalous since it is generally perceived that an increase in bonding
temperature would reduce the time required to achieve complete isothermal
solidification. This is premised on the increased isothermal solidification rate due to
higher diffusivity with increased temperature. Several suggestions have been made in
the literature for the cause of this anomalous behaviour, namely:
formation of second phase particles within the base metal at the joint-substrate
interface are claimed to slow down the diffusion of the solute elements, and
74
thus, the solidification process. This can lead to an elongation in the time
required to produce a eutectic-free joint [42],
increase in liquated volume of the filler insert caused by increased base metal
dissolution with increases in bonding temperature would seemingly require a
longer holding time for complete isothermal solidification [74],
existence of more than one MPD solute in the filler alloy with one having a
slower diffusivity, and thus, slowing down the solidification process and
prolonging the holding time [73], and
decrease in the solubility of the MPD solute into the base metal with increases
in the bonding temperature, thus causing a reduction in the rate of isothermal
solidification [27].
Experimental observations made by Ramirez and Liu [43] show that the precipitation of
second phase particles is considerably reduced with increased bonding temperature.
Moreover, the occurrence of the anomalous behaviour in systems that do not form
interfacial precipitates cannot be attributed to the formation of second phase particles.
Likewise, attributing this anomalous behaviour to the presence of a second MPD solute
in the filler alloy is not reasonable, since its occurrence has been reported in systems
that exclusively contain one MPD solute [43].
At first glance, an increase in the liquated volume of the filler insert as a result of base
metal ‘melt-back’ with increase in bonding temperature may appear to be a rational
75
explanation for deviation from the parabolic rule. As explained by Abdelfatah and Ojo
[76], if the effect of reduced solubility with increase in temperature is to be excluded, an
increase in liquid size at higher temperatures cannot account for deviation from the
parabolic rule, thus causing an increase in holding time. This is because an increase in
the bonding temperature is accompanied with an increase in the rate of solute diffusion
that would overcome the effect of the increased liquid size and eventually lead to a
reduced holding time as compared to a lower temperature.
To investigate the role of a decrease in the MPD solute solubility with increase in
temperature towards deviation from the parabolic rule, analytical modeling of TLP
bonding was performed while keeping the maximum width of the liquid interlayer
constant [77]. While the results of the simulation show that indeed, with an increase in
temperature, there exists a critical temperature, Tc, beyond which, a decrease in solute
solubility will cause deviation from the parabolic rule and lead to the extension of tf.
However, the analytically predicted Tc was found to be excessively higher than what had
been experimentally observed [61].
Recent studies [77, 78] that applied newly developed numerical simulation models to
TLP process have shown that the inherent assumption made by analytical models, and
by which, a parabolic relationship between holding time and solid/liquid interface
migration is maintained with continual diffusion, can only hold while the concentration
gradient, ∂C/∂x, decreases to a critical level (∂C/∂x)c. Beyond this critical level, any
76
diffusion-induced decrease in ∂C/∂x would result in considerable deviation from the
parabolic rule.
One important consequence of the deviation from parabolic behaviour with increase in
temperature is the considerable increase in holding time, tf, required to produce a
eutectic free TLP joint. In the present investigation, while the three alloys studied
(IN738, DS IC6, and DS Rene80) show comparable behaviour and follow the parabolic
rule predicted by standard analytical models when bonded at 1100oC; however, this is
not the case when the bonding temperature is increased to 1150oC. At the start of the
bonding process, all three alloys follow the parabolic rule in a comparable fashion
(Figure 4.17); however, after 7.5 hrs of holding time, alloy IN738 shows significant
deviation. As stated above, a considerable increase in the time required to achieve
complete isothermal solidification is the major consequence of deviation from parabolic
behaviour at higher temperatures. Notably, while alloy DS IC6 maintained parabolic
behaviour throughout the bonding process and a eutectic-free joint was produced after
16 hrs, alloy IN738 which showed significant deviation, required 52 hrs of holding time
to produce an almost eutectic-free joint. With less severity than alloy IN738, alloy DS
Rene80 also showed deviation from parabolic behaviour towards the end of the
solidification, and complete isothermal solidification was achieved after holding for 26
hrs.
As stated above, alloy DS Rene80 showed less deviation than alloy IN738, and hence,
required less time to achieve complete isothermal solidification. The onset of deviation
77
from parabolic behaviour took place at a later stage in alloy DS Rene80 than in alloy
IN738 and as such, a narrower deviation zone, and hence, a shorter tf was observed for
alloy DS Rene80.
In applying their newly developed simulation numerical model, Goneim and Ojo [76, 78,
79] explain that at the commencement of deviation, the constant parameter φ in
Equation (2) becomes unsuitable for representing the isothermal solidification rate
because of the continuous reduction in rate within the deviation zone and hence, the
size of the zone, which in turn determines that the tf, is dependent on the magnitude of
∂c/∂x. They further stated that the concentration gradient ∂C/∂x is influenced by the
solubility of the MPD solute into the base metal, such that a decrease in the MPD solute
(B) would result in a wider deviation zone and concomitant increase in the tf due to a
reduced ∂C/∂x.
The above discussion demonstrates why alloy IN738 has an extension in tf upon increase
in bonding temperature. The next valid query would be to determine why alloy DS IC6
did not suffer the same anomalous behaviour as alloy IN738. This is especially
interesting in light of the fact that all three alloys behave in a similar parabolic fashion,
with complete isothermal solidification achieved in a comparable time frame when
bonded at a lower temperature of 1100oC.
4.2.4 Diffusion affected zone
Based on the above discussion, it is inferred that any increase in the solubility of the
diffusing solute into the base metal would increase ∂2C/∂x2 and hence, result in a higher
78
rate of diffusion-controlled isothermal solidification. Similarly, any method or
mechanism that can enhance the base metal accommodation capability of the diffusing
MPD solute, such that ∂C/∂x will not exceed a critical level, can aid in increasing the rate
of isothermal solidification, and thus, prevent or minimise an increase in the tf with an
increase in temperature. The formation of solute-rich second-phase precipitates within
the base metal region adjacent to the joint has been reported to be a favourable
mechanism for the depletion of a substrate matrix of solute atoms and by which, an
increase in the rate of isothermal solidification was observed [80]. In the current work,
such second-phase particles are noticed to be considerably more pronounced in alloys
DS IC6 and DS Rene80 compared to IN738 (Figure 4.18).
Figure 4.19 shows the DAZ in the base metal adjacent to the joint region in alloys IN 738
and DS IC6 bonded for 12 hrs at a temperature of 1150oC, where IN 738 shows
considerable deviation from parabolic behaviour compared to alloy DS IC6.
The Zeiss Axiovert 25 inverted reflected-light optical microscope equipped with a
CLEMEX vision 3.0 image analyzer was used to determine the volume fraction of the
second-phase precipitates formed in the DAZ of the bonded specimens, and the volume
fraction of these precipitates for alloys IN 738 and DS IC6 was found to be 8% and 20%
respectively.
As alloys DS IC 6 and IN 738 represent both ends of the spectrum where no deviation
and significant deviation from parabolic behaviour occurs respectively at a bonding
temperature of 1150oC, a microstructural study of the second-phase precipitates
79
Figure 4.18: SEM micrograph of second phase precipitates in DAZ of (a) DS IC6. , (b) IN738, and (c) DS Rene80, bonded at 1150 oC for 12 hrs using NB150 filler alloy
a
b
c
80
Figure 4.19: SEM micrograph of DAZ of (a) IN738 and (b) DS IC6, bonded at 1150 oC for 12 hrs using NB150 filler alloy
Ce
nte
rlin
e eu
tect
ic
Iso
ther
mal
ly s
olid
ifie
d r
egio
n
DAZ
Base metal
Iso
ther
mal
ly s
olid
ifie
d r
egio
n
a
b
Base metal
DAZ
81
formed in the DAZ was carried out for samples bonded for 12 hrs. These second-phase
precipitates, as suggested by the EDS X-ray mapping, were found to be rich Mo-B
particles in alloy DS IC6 (Figure 4.20) and in alloy IN738, observed to be Cr-Mo-B rich
particles (Figure 4.21). Mo is known to have a high affinity for B and several Mo-rich
borides, such as M3B2 and M5B3 forms in Ni-base alloys [81, 82]. The EDS compositional
analysis, coupled with the volume fraction of the second-phase precipitates formed in
the DAZ of both alloys IN738 and DS IC6, would suggest that alloy DS IC6, which is richer
in Mo, has a higher capability to accommodate diffusing B atoms from the liquated
interlayer, through the formation of an extensive mesh of Mo-rich borides.
To further study the enhanced solute accommodation capability of alloy DS IC 6, a
technique known as laser ablation-inductively coupled plasma-mass spectrometry
(LAICP-MS), which is becoming popular for quantifying light trace elements like B, was
used to determine the B concentration profile in the base-metal region adjacent to the
joint (DAZ) in specimens bonded at 1150oC, for both alloys IN738 and DS IC 6, where
deviation from parabolic behaviour had occurred in alloy IN738. The technique involves
the use of an ultraviolet laser to ablate material in air-tight cells and form a stream of
fine particles from the specimen surface. The ablated material is subsequently carried in
a helium aerosol carrier system into an inductively coupled plasma mass-spectrometer
(ICP-MS) where ionisation occurs in argon-plasma at approximately 6000 K. Figures 4.22
and 4.23 show the laser ablation B concentration profile of the bonded materials as
compared to that of the as-received material. In both alloys, the DAZ shows a high
concentration of B compared to the rest of the matrix and the as received specimen. In
82
Figure 4.20: EDS X-ray maps analysis of second phase precipitates in DAZ of DS IC6 bonded at 1150 oC for 12 hrs using NB150 filler alloy
83
Figure 4.21: EDS X-ray maps analysis of second phase precipitates in DAZ of IN738 bonded at 1150 oC for 12 hrs using NB150 filler alloy
84
Figure 4.22: MPD solute (B) in TLP bonded and as received DS IC6 performed by laser ablation analysis
Figure 4.23: MPD solute (B) in TLP bonded and as received IN738 performed by laser ablation analysis
-50
0
50
100
150
200
250
300
350
0 100 200 300 400 500 600
Co
nce
ntr
atio
n (
pp
m)
Base Metal Distance (mic)
IC6-12hrjoint
as resieved
0
50
100
150
200
250
300
350
0 100 200 300 400 500 600
Co
nce
ntr
atio
n (
pp
m)
Base Metal Distance (mic)
IN738-12hrjoint
as resieved IN738
85
comparing the B concentration profile of the bonded materials to one another (Figure
4.24), a much higher concentration of B in the DAZ of DS IC 6 is evident as opposed to
IN738. Interestingly, the concentration profile in the DAZ of alloy IN738 shows high
peaks and depressions, thus indicating the detection of B rich particles and base-metal B
concentration respectively. However, these depressions in the concentration profile are
not observed for the DAZ of alloy DS IC 6. This observation, coupled with the fact that
the concentration of B in the DAZ of DS IC 6 is higher than that of IN738, indicates the
formation of a highly dense mesh of B rich particles, such that it is difficult to detect
base-metal B concentration by using this particular mapping speed.
In view of the preceding discussion, it can be said that the timely finish of the isothermal
solidification stage of alloy DS IC6 with increase in bonding temperature (compared to
alloy IN738, which suffered a significant extension in tf) cannot be attributable to higher
MPD solute diffusivity in DS IC6 compared to IN738, especially as the tf was comparable
in both alloys at lower bonding temperatures. Additionally, the extension in the tf
experienced by IN738 with increase in temperature, as a result of the deviation from the
parabolic rule, is independent of the solute diffusivity. As such, the enhanced capability
of alloy DS IC6 to host diffusing B (by forming extensive boride particles), rather than
higher diffusivity of B in DS IC6, is the responsible factor for the timely termination of
the isothermal solidification stage which leads to a reasonable tf.
86
Figure 4.24: MPD solute (B) in TLP bonded DS IC6 and IN738 performed by laser ablation analysis
0
50
100
150
200
250
300
350
0 50 100 150 200 250 300 350
Co
nce
ntr
atio
n (
pp
m)
Base Metal Distance (mic)
IC6 joint
IN738 joint
87
4.3 Reduction in tf in materials that exhibit significant deviation from
parabolic rule
As discussed in the previous section, the fundamental factor that causes an extension in
the tf upon increase in temperature during TLP bonding is the deviation of diffusion-
controlled liquid-solid interface migration from its parabolic relationship with holding
time [76]. Since the occurrence of deviation from parabolic behaviour is attributed to
the reduction of ∂C/∂x below (∂C/∂x)c due to the continuous diffusion of the MPD solute
into the base metal, it is therefore, theoretically speaking, possible to reduce the TLP
processing time, tf, by limiting the extent of reduction in the ∂C/∂x within the base
metal. A reduction in the amount of MPD solute that must diffuse out of the joint into
the base metal substrate to achieve complete isothermal solidification can be effective
in limiting the reduction in the ∂C/∂x. A reported practical way to achieve this [83] is by
using a composite powder interlayer that consists of a mixture of a commercial filler
alloy powder which contains an MPD solute and a base metal-like powder (called gap-
filler) that is essentially free of MPD solute. This approach is typically used for wide-gap
brazing of polycrystalline materials and reported to be beneficial in reducing liquid-
phase erosion of substrate material, as well as enriching the joint with base material
alloying elements [66, 67, 84].
In the current work, an experimental study is carried out to investigate the possibility of
reducing the tf by using the composite powder mixture method for alloys, such as IN738,
where significant deviation from parabolic behaviour unavoidably occurs with increase
in bonding temperature. To study this, 350 μm gap-sized butt-joint IN 738 samples were
88
TLP bonded in vacuum for various periods of times, which ranged from 1 to 36 hrs at a
temperature of 1150oC. For one set of samples, NB 150 filler alloy alone (conventional
method) was used as the brazing alloy, while the other set of samples was joined by
using a composite powder with a filler alloy (NB 150) to a gap filler (IN 738) powder ratio
of 7:3 (R7:3) by weight.
A plot of the average eutectic widths at the end of each holding time against the
bonding time for both the conventional TLP bonding method (by using 100% NB 150
filler alloy) and the composite powder mixture method (by using a powder mixture with
R7:3) is presented in Figure 4.25. While both curves follow a similar trend, the composite
powder method has the advantage of starting the isothermal solidification stage with
less B to diffuse out of the joint, as indicated by the average eutectic width that
represents the amount of liquid present at each time. A similar plot (Figure 4.26) was
also constructed, by bonding sets of butt-joint samples joined at a temperature of
1180oC by using filler alloy alone and composite powder mixtures of R7:3 and R1:1. While
it is true that the onset of deviation from parabolic behaviour will take place in both
cases at the same time, it must be noted that the rate of isothermal solidification
continuously slows down with time within the deviation zone. As such, the use of a
powder composite with less MPD solute as opposed to the filler alloy alone, would imply
that complete isothermal solidification could be achieved at an earlier stage in the case
of using a powder composite, whereas more MPD solute would have to diffuse out of
the joint at an ever decreasing rate in the case where a filler alloy alone is used.
89
Figure 4.25: Plot of average eutectic width vs. holding time for alloy IN738 bonded at 1150 oC using 100% filler alloy and composite powder with R7:3
Figure 4.26: Plot of average eutectic width vs. holding time for alloy IN738 bonded at 1150 oC using 100% filler alloy and composite powders with R7:3 and R1:1
0
50
100
150
200
250
300
350
400
450
0 500 1000 1500 2000 2500
Ave
rage
eu
tect
ic t
hic
kne
ss
(mic
rom
ete
re)
Holding time (min)
100% NB150
composite powder(R7:3)
0
20
40
60
80
100
120
0 500 1000 1500 2000 2500
Ave
rage
Eu
tect
ic W
idth
(m
icro
me
ter)
Holding Time (min)
100% NB150
composite powder (R 7:3)
composite powder (R 1:1)
90
To clearly demonstrate the effectiveness of using the composite powder mixture
method as a means of minimising tf, an experiment was carried out at a temperature of
1150oC by using a butt-joint IN738 sample with a gap size of 200 μm. It was found that
the composite powder mixture with a mixing ratio of R7:3 is able to achieve complete
isothermal solidification within 26 hrs compared to the 52 hrs needed to produce a
eutectic-free joint when using filler alloy alone. In addition to minimising tf, the
composite powder mixture method can aid in reducing liquid-phase erosion of the
substrate, which is particularly important in thin sections to prevent compromising of
the integrity of the joined or repaired component. This method can also be useful in
favourably enriching the joint with base metal alloying elements provided by the gap
filler present in the composite powder mixture.
4.4 Factors that affect dissolution of gap-filler powder particles
In the course of this investigation, it was observed (and contrary to what is normally
reported in the literature for wide-gap TLP bonding) that for some bonding conditions,
complete dissolution of the gap-filler within the powder composite occurred. Moreover,
this complete melting of the gap-filler was found to be beneficial for the general quality
(mainly presence of porosity) of the joint produced. Figure 4.27 is an example of two
joints produced by using the powder composite method. It can be clearly seen that the
joint that contains the powder composite with R1:1 (in which the gap-filler particles are
partially melted, see Figure 4.27a) suffers from severe void formation, while the joint
91
Figure 4.27: Optical micrograph showing a joint bonded at 1150 oC using a composite powder mixture with (a) R1:1 and (b) R7:3
a
b
92
that contains the powder composite with R7:3 (where complete dissolution of the gap-
filler has occurred, see Figure 4.27b) appears to be visually sound. In light of this
important observation, an experimental study of some of the factors (material and
process variables) that affect the extent of the gap-filler dissolution was carried out. The
factors investigated in this work include: bonding temperature, mixing ratio of filler alloy
to gap filler alloy (RF:G), type of MPD solute, type of gap filler, and size of gap filler
powder particles. Unless otherwise stated, it should be noted that the filler alloy
referred to in the following discussion is NB150 powder and the gap-filler is IN738
powder and deposited onto an IN738 substrate.
Effect of bonding temperature
For a composite powder mixture that comprises a specific filler alloy and a gap-filler
with a constant particle size, it was found that an increase in the bonding temperature
of a mixture with a fixed RF:G aids to dissolve gap-filler particles, until a temperature is
reached where complete dissolution of the gap-filler would occur. Figure 4.28 depicts a
case where a composite powder with R7:3 shows incomplete melting of the gap-
fillerwhen held at 1100oC (Figure 4.28a); however, when the temperature is increased to
1150oC, the microstructure shows solidification dendrites, which is indicative of the
complete melting of the gap-filler particles.
93
Figure 4.28: Optical micrograph showing a composite powder mixture with R7:3 at (a) 1100 oC and (b) 1150 oC
a
b
Residual gap-filler
94
Effect of mixing ratio RF:G
If it is not possible to increase the bonding temperature above a certain value, for
reasons such as compromising the properties of the base metal, complete dissolution of
gap-filler particles that have not melted at the bonding temperature can be achieved by
altering the RF:G of the composite powder mixture. Figure 4.29 shows how altering the
mixing ratio from R1:1 to R7:3 can induce complete melting of the gap filler at 1150oC.
Effect of gap-filler powder size
Another important variable that influences the extent of gap-filler melting is the size of
the gap-filler powder particles. For two composite powder mixtures which have the
same mixing ratio of R1:1, with one that contains a fine gap-filler powder (Amdry7380)
and the other a coarse gap-filler powder (Amdry7381), Figure 4.30 shows the resultant
microstructure at 1180oC. The mixture that contains the coarse gap-filler (Figure 4.30a)
shows remnants of unmelted gap-filler particles. However, at the same temperature,
the mixture that contains the fine gap-filler (Figure 4.30b) exhibits a solidification
dendritic microstructure, thus indicating complete melting of the gap-filler particles.
Effect of type of gap-filler powder
To examine the effect of the type of gap-filler on the general melting behaviour, two
different gap-fillers, namely Nicrogap 108 (15 Cr - 0.75 Si – 7 Fe - 0.2 B – bal. Ni) wt.%
and HY282 (20 Cr – 10 Co – 8.5 Mo – 2.1 Ti – 1.5 Al – 1.5 Fe – 0.3 Mn – 0.15 Si – 0.06 C –
0.005 B – bal. Ni) wt.%, were used for comparison with the general melting trend
exhibited by the IN738 gap-filler. Figure 4.31 shows the microstructure of composite
95
Figure 4.29: Optical micrograph showing a composite powder mixture at 1150 oC, with (a) R1:1 and (b) R7:3
b
a
96
Figure 4.30: optical micrograph showing a composite powder mixture with R1:1 at 1180 oC using (a) coarse and (b) fine gap-filler
b
a
97
Figure 4.31: Optical micrograph showing a composite mixture containing (a) IN738, (b) HY282 and (c) Nicrogap108 gap-fillers at 1150 oC with R1:1
a
b
c
98
powder mixtures with R1:1 for gap-fillers IN 738, HY 282 and Nicrogap 108, at a
temperature of 1150oC. Like the mixture that contained gap-filler IN 738, the other two
mixtures also show residual unmelted powder particles at this temperature. For the
same temperature of 1150oC, reduction in the amount of gap-filler in all mixtures, such
that the mixing ratio is altered to R7:3, means that complete dissolution of all gap-filler
types would occur, as shown in Figure 4.32. Other experiments were also conducted, in
which the temperature and/or mixing ratio were altered, and the melting behaviour of
the three gap-fillers examined followed a similar pattern. This would imply that rather
than gap-filler powder type, it is the proper combination of temperature and mixing
ratio that is imperative to achieving complete dissolution of the composite powder.
Thus, the choice of gap-filler would be based on the microstructural features desired
within the joint.
Effect of type of MPD solute
Finally, the effect of the type of MPD solute on the dissolution behaviour of gap-filler
powder particles was studied. Filler alloys that contained B as the MPD are usually
preferred, owing to its high diffusivity in Ni based alloys, thus leading to shorter
processing times. However, the use of B filler alloys is prohibited in the repair of nuclear
power plant parts by TLP bonding. This is because of two reasons; one is that material
that contain B have a large neutron absorption cross-section, thus resulting in reduced
nuclear reactor performance, and second, when B is subjected to radiation, it
transforms to helium, thus causing swelling of the structural material [85]. For this
study, a filler alloy that bears Si as its MPD solute, namely, Amdry 100 with the
99
Figure 4.32: Optical micrograph showing a composite mixture containing (a) IN738, (b) HY282 and (c) Nicrogap108 gap-fillers at 1150 oC with R7:3
a
c
b
100
composition (Ni –19 Cr– 10 Si) wt.%, was used for comparison with the NB150 filler
alloy. Figure 4.33 shows a composite powder mixture (R1:1) at 1150oC, with Amdry 100
as the filler alloy and IN738 as the gap-filler. The gap-filler particles are largely unmelted
at this temperature. When the amount of gap-filler is decreased, such that the mixing
ratio becomes R7:3, this is sufficient enough to induce complete melting in the mixture
that contains NB 150 (Figure 4.29b); however, in the mixture that contained Amdry 100,
with R7:3, unmelted particles are evident (Figure 4.34). In an attempt to induce complete
melting of the R7:3 mixture, the temperature was increased to 1200oC. This, however,
did not produce complete melting of the gap-filler particles. To explain this, it should be
recalled that from the mechanisms of the TLP bonding process, the melting of the gap-
filler occurs in order to dilute the solute concentration in the liquated filler to the solidus
and liquidus compositions, in order to achieve equilibrium at the bonding temperature.
Looking at Figures 4.35 and 4.36 which show the Ni-B and Ni-Si phase diagrams
respectively, it can be seen that for filler alloy NB 150 which melts at 1055oC, large
amounts of the solid particles (solid substrate) would have to be melted at a high
temperature, such as 1150oC, to achieve equilibrium solidus and liquidus compositions.
In contrast, filler alloy Amdry100, which melts at 1140oC, would only have to melt small
amounts of the solid particles at a temperature such as 1150oC, because its composition
is already close to that of equilibrium. Therefore, if a Si-containing filler alloy must be
used, and complete melting is desired, a very fine gap-filler powder would be
favourable.
101
Figure 4.33: Optical micrograph showing a composite powder containing Amdry100 filler alloy at 1150 oC with R1:1
Figure 4.34: Optical micrograph showing a composite powder containing Amdry100 filler alloy at 1150 oC with R7:3
102
4.35: The Nickel-Boron Phase Diagram [86]
4.36: The Nickel-Silicon phase diagram [86]
103
5 Summary and Conclusions
The influence of base alloy composition on the time required to achieve complete
isothermal solidification (tf) during the TLP bonding of three Ni-base superalloys was
experimentally studied. The summary and main conclusions of the study are as follows:
1. The three alloys (IN738, DS Rene80 and DS IC 6) showed similar behaviour, with
comparable tf, when bonded at 1100 oC. The experimental data are concurrent with
conventional TLP bonding analytical models, which assume a parabolic
relationship between solid/liquid interface migration and holding time. This is an
indication that the rate at which the MPD solute diffuses into the base alloy is
comparable in all three alloys.
2. An incomparable behaviour is evident in these three alloys when bonded at 1150 oC.
Alloy IN738 shows deviation from the expected parabolic behaviour, while alloy
DS IC6 maintains a parabolic relationship to the end, and alloy DS Rene80 suffers
a slight deviation towards the end of the isothermal solidification stage. This
incomparable behaviour of the alloys at higher temperatures results in an
excessively prolonged holding time in alloy IN738 (52 hrs), compared to DS IC6
(16 hrs) and DS Rene80 (26 hrs).
3. The fundamental factor that causes the prolonged tf during TLP bonding is the deviation
of diffusion-controlled liquid-solid interface migration from its parabolic relationship
with holding time. This deviation from parabolic behaviour occurs due to diffusion-
induced reduction of solute concentration gradient (∂C / ∂x) in the base material below
a critical value (∂C / ∂x)C.
104
4. This investigation shows that the ability of alloy DS IC6 to complete isothermal
solidification within a reasonable time frame is attributable to its capability to
accommodate the diffusing MPD solute, through the formation of a densely
packed second-phase precipitates in diffusion affected zone.
5. A composite powder mixture (which comprises filler and base alloy powders) is
used as an alternative to filler alloy alone to reduce the tf in the alloy IN738,
which shows deviation from parabolic behaviour. It is found that by using a
composite powder with a 7:3 mixing ratio of NB150 filler alloy powder to IN738
base alloy powder, this can reduce the tf by 50%, as compared to using NB150
filler alloy alone. The presence of base alloy powder within the joint reduces the
amount of filler alloy used, thus reducing the amount of boron required to
diffuse out of the joint to achieve complete isothermal solidification.
6. It is found that a composite powder mixture, in which the gap-filler particles
remain unmelted at the bonding temperature, would produce a joint with large
porosity. In contrast, complete melting of the gap-filler in the composite powder
mixture would produce a joint free of porosity. Some of the factors that can affect
the extent of dissolution of gap-filler powder particles include: bonding
temperature, mixing ratio of filler alloy to gap-filler alloy (RF:G), type of MPD
solute, type of gap filler, and size of gap filler powder particles.
7. Normally, when joining or repairing components using TLP bonding, the main
factor that is usually considered in order to achieve complete isothermal
solidification of the joint within an economical time frame is selection of
105
appropriate filler alloy containing a fast diffusing MPD solute. However, this work
shows that another very important factor, namely, base alloy composition, ought
to be considered as it can in some cases effectively override the effect of high
diffusivity at high temperatures and lead to an undesirable extension of in
processing time.
106
6 Suggestions for Future Work
The following are possible work suggestions for future study:
1. Design a post-bond heat treatment to homogenize bonded materials and
remove boron-rich precipitates in the DAZ, which have been reported to degrade
properties of bonded material.
2. Perform mechanical tests to evaluate properties of bonded and homogenized
joined components.
3. Study other superalloy families such as Cobalt-based in order to assess the
influence of base-alloy composition on processing time during TLP bonding.
107
7 Bibliography
[1] D. S. Duvall and W. A. Owczarski, "Further Heat-Affected-Zone studies in heat resistant


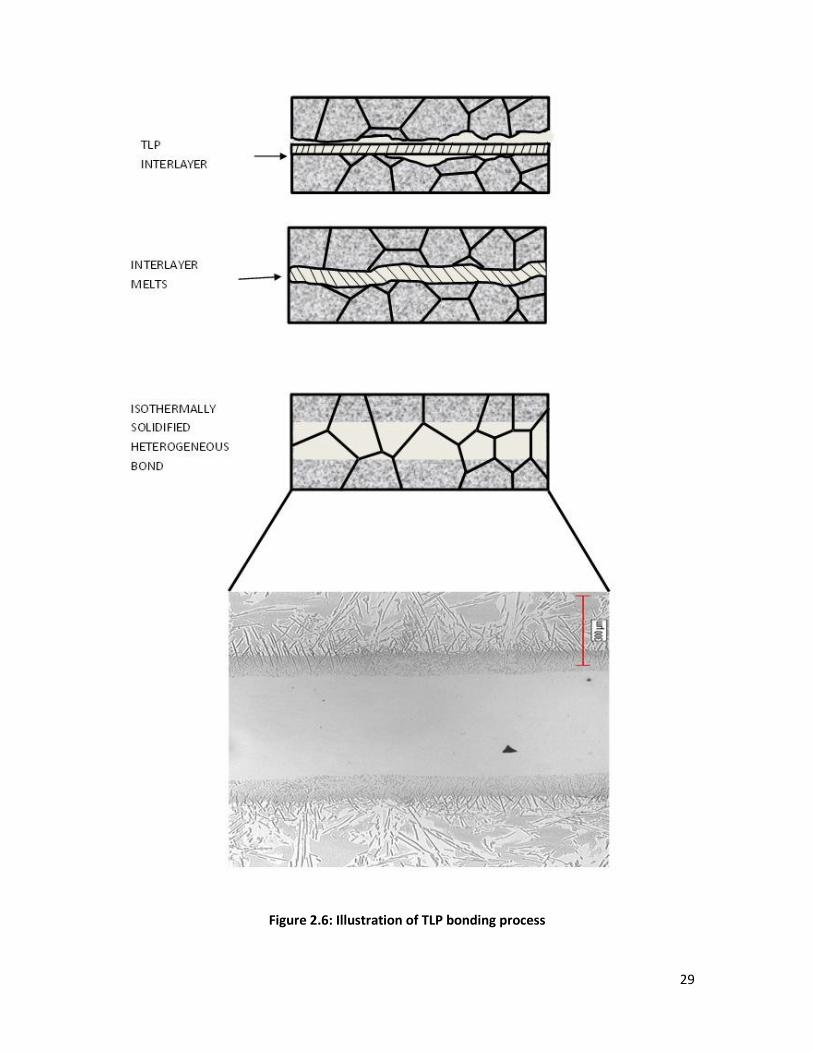


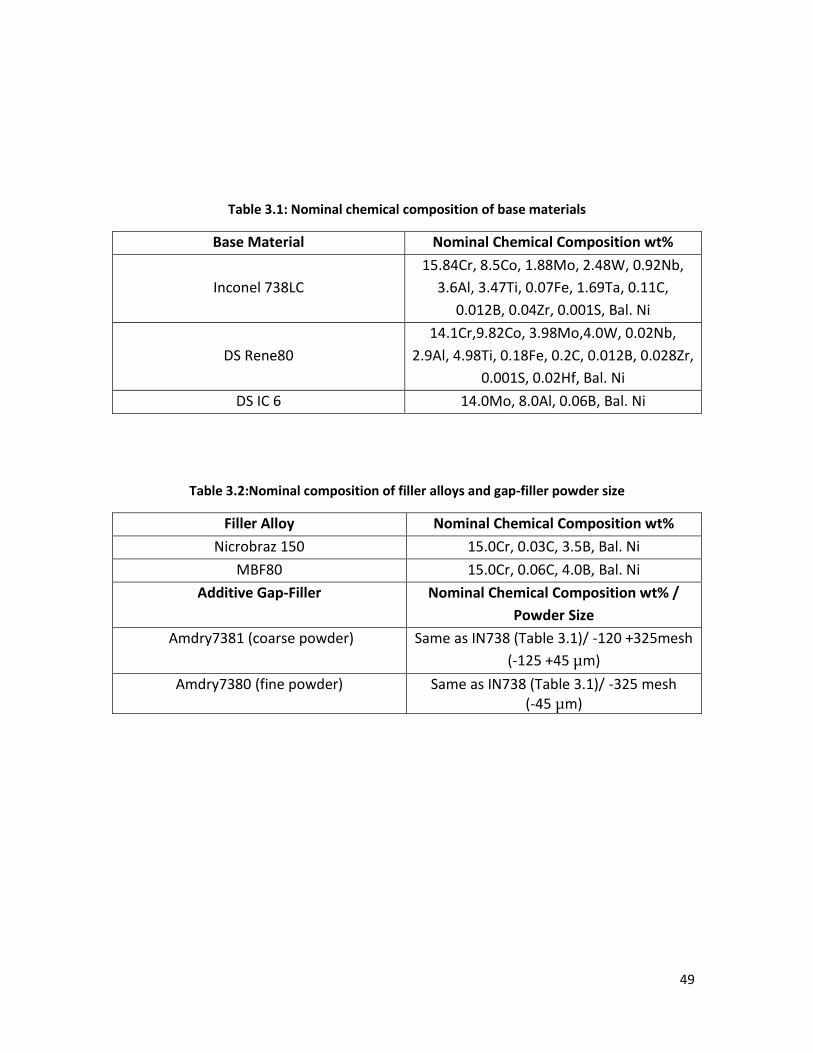


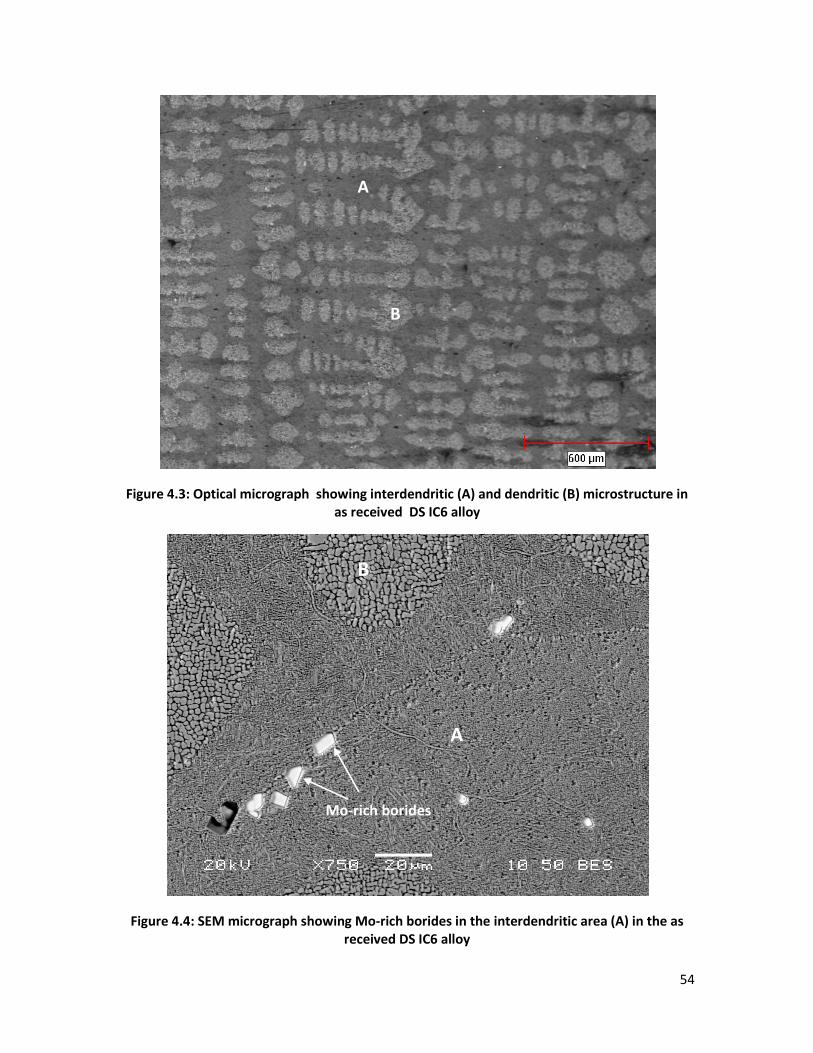


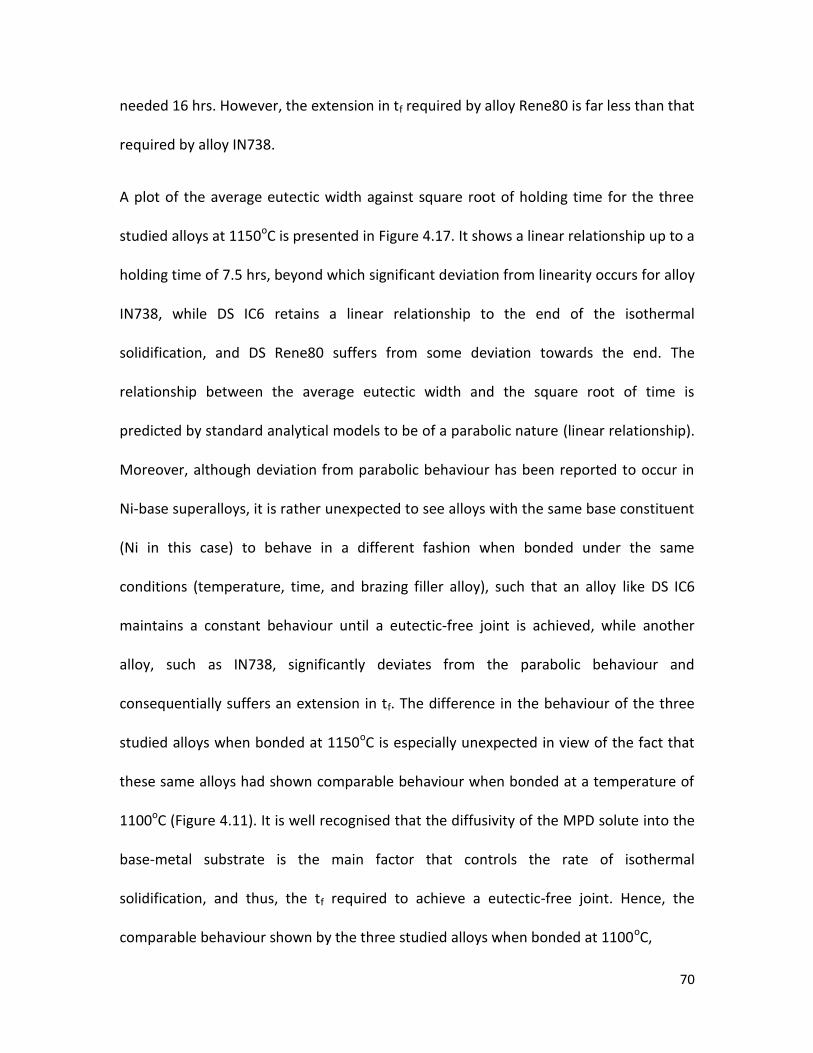


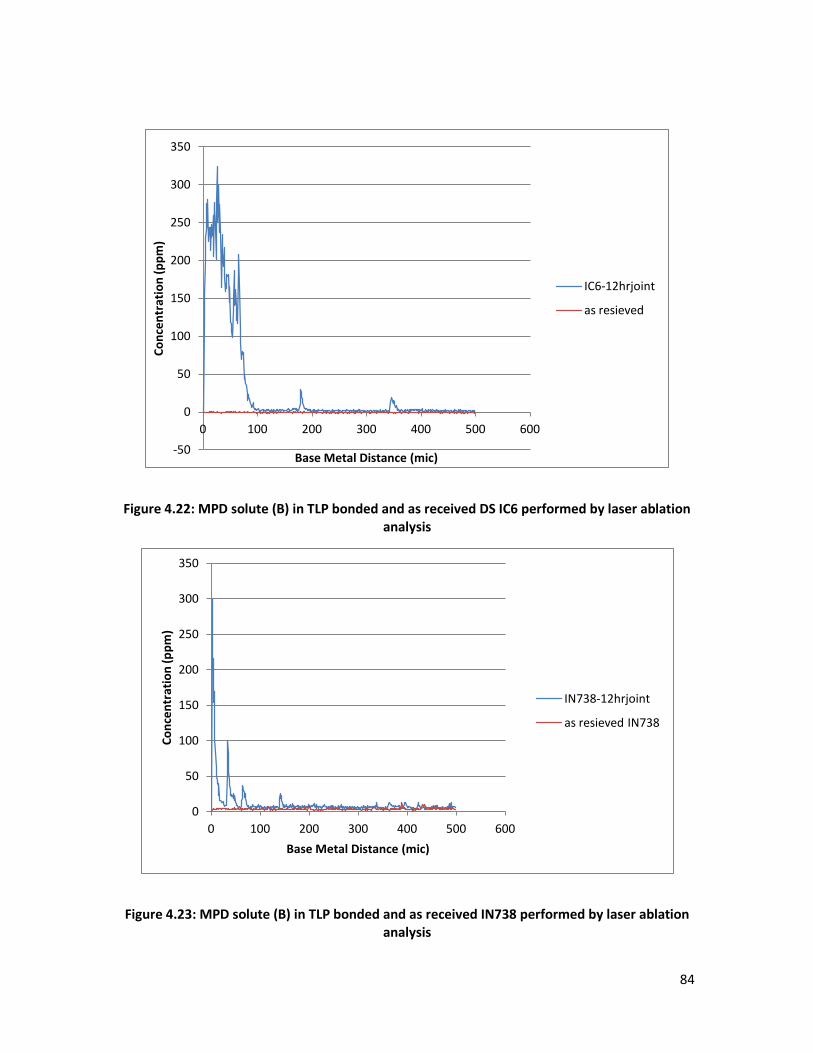
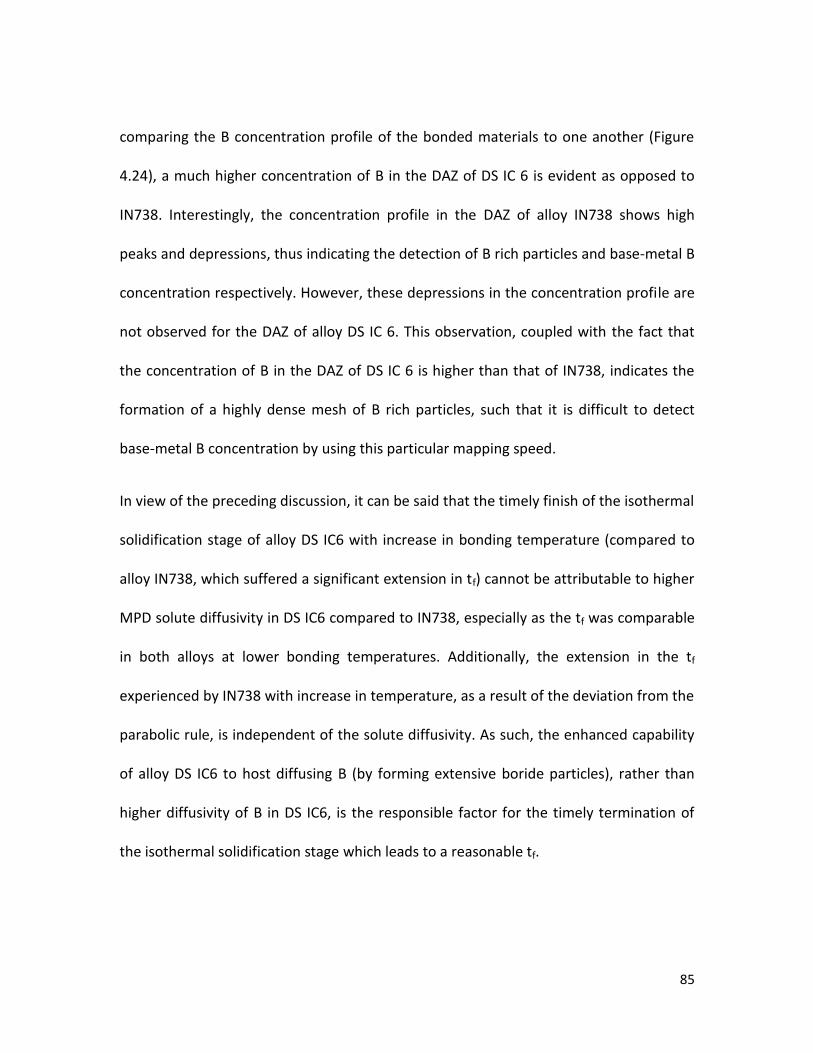


![Influence of Filler Alloy Composition and Process Parameters on … · 2017-10-10 · inautogenousgastungstenarc(GTA)weldingofAA7108 alloy containing scandium,[65] as well as in metal](https://static.documents.pub/doc/80x56/5f2da2d0459c0f221f1c04c3/influence-of-filler-alloy-composition-and-process-parameters-on-2017-10-10-inautogenousgastungstenarcgtaweldingofaa7108.jpg)


