Summary We studied the influence of branch autonomy onthe growth of reproductive and vegetative organs by establish-ing different patterns of fruit distribution within and betweenlarge branch units (scaffolds) in mature peach trees (Prunuspersica (L.) Batsch cv. ‘Elegant Lady’). Different patterns offruit distribution were established by defruiting either wholescaffolds (uneven fruit distribution between scaffolds; US) orseveral selected hangers (small fruiting branches) per tree (un-even fruit distribution between hangers; UH). The effects ofthese patterns were compared with the effects of an even fruitdistribution treatment (EVEN) in which fruits were thinned toachieve maximum uniformity of fruit distribution within thecanopy. The desired fruit loads were obtained by differentiallythinning the remaining bearing parts. On a tree basis, the re-sponse of mean fruit mass to fruit load was strongly affected byfruit distribution. The steepest mean fruit mass to fruit load re-lationship was found in US trees, whereas the relationship inUH trees was intermediate between the US and EVEN trees.On a scaffold basis, differences in fruit size between EVENand US trees with similar fruit loads, though statistically sig-nificant, were relatively small, indicating that scaffolds werealmost totally autonomous with respect to dry matter partition-ing to fruit during the final stage of peach fruit growth. Hangersalso appeared to exhibit significant autonomy with respect tothe distribution of dry matter during the final phase of fruitgrowth. Branch autonomy was evident in scaffold growth:defruited scaffolds in the US treatment grew more than fruitedscaffolds, and fruit distribution treatments had little impact onscaffold cross-sectional area on a tree basis. On the other hand,as observed for fruit growth, branch autonomy did not appearto be complete because the fruited scaffolds grew more in UStrees than in EVEN trees under heavy cropping conditions.However, the effect of fruit distribution occurred only overshort distances, and was negligible on organs located fartheraway from the source of heterogeneity (fruits), such as thetrunk and roots.
Keywords: fruit distribution, fruit load, tree water status.
Introduction
Carbon movement through the plant appears to be constrainedto certain directions at specific times, and it is widely ac-knowledged that large branches on mature trees are relativelyautonomous with respect to their carbon budget during thegrowing season, i.e., after initial shoot elongation has ceased(Sprugel et al. 1991). Branch autonomy becomes more promi-nent after the initial spring flush, probably because the springflush is supported in part from root and trunk carbon reserves(Dickson 1991, Lacointe et al. 1995). However, from latespring until the end of the season, branches import little carbonand either use current photosynthates or export them to otherorgans of the plant (trunk and roots) (Sprugel et al. 1991). Inpeach trees (Prunus persica (L.) Batsch cv. ‘Spring Lady’),most shoot elongation occurs during the first 15 weeks afteranthesis, whereas branch diameter growth continues until au-tumn (Grossman and DeJong 1995).
Carbohydrate partitioning among plant organs is thought tobe driven by differences in organ sink strength (i.e., growthpotential) (DeJong 1999). A hierarchy of sink strengths hasbeen established: fruits > young leaves and stem tips > matureleaves > cambia > roots > storage tissue (Kramer and Koz-lowski 1979). Because the capacity to generate carbon isunevenly distributed in the tree (some branches are shadedwhereas others are well lit) and fruit competition represents afunctional limitation to final fruit size (Wardlaw 1990), wepredicted that heterogeneity in fruit distribution in a tree af-fects its capacity to supply dry matter to fruits.
In addition, the impact of organ competition on growth maybe modulated by the degree of autonomy occurring in any par-ticular location. For instance, growth of fruits that are local-ized in a specific portion of a tree may be more influenced byfruit-to-fruit competition if that portion is relatively autono-mous compared with a nonautonomous region in which car-bon resources are obtained from the tree as a whole. Becauseboth shoot and root growth are usually enhanced when fruitload decreases (Williamson and Coston 1989, Kappel 1991,
Influence of branch autonomy on fruit, scaffold, trunk and rootgrowth during Stage III of peach fruit development
JORDI MARSAL,1 BORIS BASILE,2 LUIS SOLARI3 and THEODORE M. DEJONG3,4
1 Institut de Recerca i Tecnologia Agroalimentàries (IRTA), Area de Tecnologia Frutícola, Centre UdL-IRTA, Avda Rovira Roure 177, E-25198Lleida, Spain
2 Dipartimento di Arboricoltura, Botanica e Patologia Vegetale, Sezione di Arboricoltura, Università degli Studi di Napoli Federico II, Portici,Napoli, Italy
3 Department of Pomology, University of California, Davis, CA 95616, USA4 Author to whom correspondence should be addressed ([email protected])
Received December 11, 2001; accepted September 6, 2002; published online March 3, 2003
Grossman and DeJong 1995), it is commonly assumed that re-ductions in fruit load increase the total amount of carbohy-drates available for growth of other organs (Wardlaw 1990,Grossman and DeJong 1994). Therefore, if fruit growth is sup-ported autonomously within branches, a tree with a hetero-genous fruit distribution has more surplus carbon available forroot and stem growth than a tree with uniform fruitdistribution. When fruit carbon demand is low, net carbon gainper tree may decrease because of low net assimilation rate perunit of leaf area (DeJong 1986b, Gucci et al. 1991, Palmer1992); however, this decrease can be partially compensatedfor by the development of more leaves in defruited trees(Wünsche and Palmer 1997). Within the conceptual frame-work of branch autonomy, we therefore hypothesized that het-erogeneity in fruit distribution will (1) reduce dry matterallocated to fruits, and (2) enhance the growth of organs otherthan fruits (e.g., scaffolds, trunks and roots) even when overallcrop loads per tree are similar. We predicted that these effectswould increase with increasing fruit load. Our study objectivewas to evaluate the growth responses of fruit and vegetativeorgans, including the main trunk, scaffolds and roots, to differ-ent patterns of fruit distribution in mature peach trees withvarying fruit loads.
To study these growth responses under the most favorableconditions, tree fruit load was manipulated during the part ofthe season when fruit sink strength was expected to be great-est, that is during the phase of maximum fruit growth (StageIII; Grossman and DeJong 1995) in peach. A transport–com-petition model for fruit growth was used (DeJong and Gross-man 1995) to quantify the degree of branch autonomy for fruitgrowth. To obtain different patterns of fruit distribution, eitherwhole scaffolds or several selected fruiting shoots per treewere defruited at the onset of Stage III of fruit development.The desired fruit loads were obtained by differentially thin-ning the remaining bearing parts.
Materials and methods
Orchard conditions
Seventy-eight trees from 11 rows of 10-year-old ‘ElegantLady’ peach (Prunus persica) trees, on ‘Lovell’ rootstock,were selected for uniformity in a block at the UC DavisWolfskill Experimental Orchard, Winters, CA. The orchardwas planted in a high density formation (5.5 × 2 m spacing)and trained to a Kearney perpendicular-V with two main scaf-folds per tree (DeJong et al. 1995). Trees received standardcommercial dormant pruning and 100 kg ha–1 N fertilizationin the spring before the experiment. The trees were irrigatedtwice weekly by microjet sprinklers, receiving 100% replace-ment of reference evapotranspiration (ET0, data obtained fromthe California Irrigation Management System for Winters).There was no rainfall during the experimental period.
Thinning treatments
Thinning treatments were applied just before the start of StageIII, the final exponential phase, of fruit growth on May 15.Three main bearing pattern treatments were established ac-cording to differences in fruit distribution in the tree: (1) fruitsdistributed evenly (EVEN); (2) fruits distributed unevenly bytotally defruiting one of the two available main branches (scaf-folds) per tree (uneven distribution between scaffolds; US);and (3) fruits distributed unevenly by totally defruiting se-lected fruiting shoots (hangers) from both scaffolds (unevendistribution among hangers; UH). A hanger is defined as a1-year-old shoot selected during dormant pruning for fruitingin the next growing season. Three fruit thinning sub-treat-ments were imposed to obtain a range of fruit loads withineach main fruit bearing treatment. In general, the scaffolds orhangers in each bearing treatment were unthinned, lightlythinned or normally thinned (Table 1). In UH trees, the desiredrange of fruit counts per tree was achieved by manipulating theproportion of defruited hangers; for the low and normal croploads, one out of two hangers was defruited, whereas for theheavy crop load, only one out of three hangers was defruited.Additionally, the fruited hangers were slightly thinned in thelow crop load treatment (Table 1). Although these sub-treat-ments were applied as discrete treatments on the individualscaffolds, they provided a continuous range of crop loads pertree or scaffold, ranging from heavily cropped to lightly crop-ped (Table 2). In addition to the three bearing treatments, afourth treatment was defined by selecting six trees that werethinned to a low crop load of < 50 fruits tree–1 (Table 1), whichwere used to estimate the potential fruit growth response forthe particular orchard and study period. The number of trees inthe US treatment was twice that in the EVEN and UH treat-ments, because scaffolds were used as the reference unit forcomparisons. Eighteen trees were assigned to the EVEN andUH treatments and 36 trees were assigned to the US treatment.These trees were chosen for homogeneity in fruit load and as-signed to the different bearing treatments following a com-pletely randomized spatial distribution.
Fruit harvest
Fruits were harvested on July 2, about one week before com-mercial maturity, in order to avoid significant fruit drop. Allfruits were removed from each scaffold and counted. Cropfresh mass for each scaffold was determined and a 30-fruitsubsample per tree was collected. The sample was weighedbefore and after drying at 65 °C in a forced air draft oven. Rel-ative dry mass was calculated as the ratio of sample fresh massto dry mass. Mean fresh mass and mean dry mass per fruitwere calculated by dividing total crop fresh mass and totalcrop dry mass, respectively, by total fruit number.
Water status measurements
Because cropping can influence tree water status and therebyaffect fruit dry matter accumulation (Berman and DeJong1996), water status was measured at key points during the ex-periment. Stem water potential (Ψstem) (McCutchan and
314 MARSAL, BASILE, SOLARI AND DEJONG
TREE PHYSIOLOGY VOLUME 23, 2003
Shackel 1992) was measured with a pressure chamber (SoilMoisture Equipment, Santa Barbara, CA). Measurementswere made at solar noon on shaded leaves located close to thebase of each scaffold. Leaves were bagged for at least 1 h be-fore measurement. The leaf bags were plastic sheaths coveredwith aluminum foil. Midday leaf conductance (gl) was mea-sured under light-saturated conditions with a portable steadystate porometer (Model LI-1600, Li-Cor, Lincoln, NE). Wemeasured Ψstem and gl on one and two leaves per scaffold, re-spectively, in all trees of the treatment–sub-treatment combi-nations that represented the most extreme fruit load andbearing patterns conditions, i.e.: (1) maximum crop load(EVEN-M); (2) scaffold-defruited + heavy crop load (US-H);and (3) potential fruit growth (PFG) treatments. Measure-ments were taken on 3 days during Stage III of fruit growth:
just after fruit thinning (May 19), mid-Stage III (June 6) andone week before fruit harvest (June 24).
Analysis of treatment effects and quantification of limitationsin fruit growth
To analyze the effects of the bearing patterns on final fruitmass, fresh mass and dry mass were plotted against fruit countper tree. Regression analysis was used to account for a possi-ble interaction of the bearing treatments with crop load. In ad-dition, to test the possibility of a favorable influence of acompletely defruited scaffold on the fruit mass of the neigh-boring loaded scaffold, the same data were expressed on ascaffold basis. This procedure was valid only for comparisonsof EVEN and US treatments because both treatments hadevenly distributed fruits at the scaffold level.
TREE PHYSIOLOGY ONLINE at http://heronpublishing.com
BRANCH AUTONOMY AND PEACH FRUIT GROWTH 315
Table 1. Cropping patterns and applied thinning strategies pertaining to the bearing treatments.
Potential fruit growth Heavily thinned to a minimum crop load PFG(50 fruits tree–1)
Even distribution of fruits EVENMaximum crop Both scaffolds unthinned EVEN-MHeavy crop Both scaffolds lightly thinned EVEN-HNormal crop Both scaffolds normally thinned EVEN-N
Uneven distribution of fruits—scaffold defruited USScaffold defruited + heavy crop One scaffold defruited, other scaffold unthinned US-HScaffold defruited + normal crop One scaffold defruited, other scaffold lightly thinned US-NScaffold defruited + low crop One scaffold defruited, other scaffold normally thinned US-L
Uneven distribution of fruits—hanger defruited UHHanger1 defruited + heavy crop Both scaffolds with selected hangers (1 out of 3) UH-H
defruited. Other hangers unthinned.Hanger defruited + normal crop Both scaffolds with selected hangers (1 out of 2) UH-N
defruited. Other hangers unthinned.Hanger defruited + low crop Both scaffolds with selected hangers (1 out of 2) UH-L
defruited. Other hangers lightly thinned.
1 A hanger is a 1-year-old shoot selected during dormant pruning for fruiting in the next growing season.
Table 2. Crop load, sample size and ranges achieved with the different thinning treatments.
Treatment and sub-treatment Sample size Mean no. Min–max no.(no. trees) fruits per tree fruits per tree
Quantification of the limitation of fruit growth by the differ-ent bearing patterns was carried out according to the proceduredescribed by DeJong and Grossman (1995), which enables es-timation of the degree of sink and source limitation onfruit growth. In our study, the focus was on calculation ofthe transport–competition component of the supply limitation(TRANS–COMPlim), because we were interested in testing iffruit distribution affected this component. The calculation re-quires a continuous function of dry mass fruit growth rate thatis dependent on fruit load. The different intensities of fruitthinning provided the required range of fruit loads. A briefsummary of the calculations is outlined.
Potential relative growth rate (RGRpot) was calculated as:
RGRpote PFG) e (PFG
2
=log – log
–( )W W
T T2 1
1
(1)
where W2(PFG) and W1(PFG) are the mean individual fruit drymasses at harvest dates T2 and T1, corresponding to the trees ofthe PFG treatment with a minimum number of fruits (50 pertree). We estimated W1(PFG) from dry mass and fruit countsfrom five defruited scaffolds (US treatment) at the time of fruitthinning. Total potential fruit sink demand rate (SINKpot;g day–1) for trees with different numbers of fruits per tree orscaffold was modeled as:
SINKe
pot
(RGR (
2
pot 2
= ( – )
–
* – )) *W W n
T T
T T1 1
1
1
(2)
where n is fruit number and W1* is mean fruit dry mass at the
onset of Stage III, which was calculated based on the initialmean fruit size developed from data obtained on defruitedscaffolds and applied to EVEN trees. The potential sourcesupply rate (SOURCEpot) was estimated from fruit growth un-der source-limited conditions, such as on EVEN trees in themaximum crop treatment (EVEN-M):
SOURCEpotEVEN-M EVEN-M=
( – )
–( ) ( )W W n
T T2 1
2 1
(3)
The rate of actual total fruit dry mass growth rate (FGRactual)during a growth period was calculated as:
FGRactual = ( – )
–
W W n
T T2 1
2 1
(4)
where n is number of fruits per sample unit.The data obtained per tree were fitted to linear (y = a + bx)
and logarithmic (y = a b x+ ln ) functions for SINKpot andFGRactual, respectively. The data obtained per scaffold were fit-ted to quadratic and simple logarithmic expressions forSINKpot and FGRactual, respectively. The transport–competi-tion limitation parameter, TRANS–COMPlim, was calculatedfrom the estimates of the previously fitted functions. IfSINKpot > SOURCEpot, fruit growth may have been limited by
both supply limitation and transport–competition limitation.In this case, TRANS–COMPlim was calculated as:
TRANS–COMPSOURCE FGR
SOURCElimpot actual
pot
=–
(5)
However, when SINKpot < SOURCEpot, source supply did notlimit fruit growth and the entire source limitation was due totransport–competition limitation:
TRANS–COMPSINK FGR
SINKlimpot actual
pot
=–
(7)
Vegetative growth measurements
The cross-sectional area of the trunk (TCSA) and the two scaf-folds per tree (SCSA) were calculated from circumferencetape measurements. To minimize error in circumference mea-surements, two pins were placed in opposite sides of thebranch to mark the place of the initial reading. These measure-ments were repeated four times during Stage III of fruitgrowth. Growth rates of TCSA and SCSA during Stage IIIwere calculated as:
GRCSA – CSA
= f i
f iT T–(7)
where CSAf and CSAi are the final and initial values ofcross-sectional area, respectively, and Tf – Ti, the elapsed timein days between measurements. The evolution in growth rateduring Stage III was calculated for the treatment and sub-treatment combinations that represented the extreme fruit loadand bearing pattern conditions, i.e.: (1) maximum crop load(EVEN-M); (2) scaffold defruited + high crop load (US-H);and (3) potential fruit growth (PFG) treatments.
Root growth measurements
Root growth was evaluated by an ingrowth bag method (Majdi1996, Finer and Laine 2000). The day after fruit thinning,holes were dug in the alleyways on either side of each tree. Thecut ends of roots with a mean diameter of 8 mm and locatedabout 20 cm below the soil surface were inserted into a meshbag filled with root-free growing medium. Each bag contained1.8 l of 100% calcined clay (TurfaceTM, Profile Products, IL)with a bulk density of 0.67 g cm–3. One root was inserted ineach bag. The root bags were custom-made with root cloth thatcannot be penetrated by roots. The nutrient content of thegrowth medium was enriched by submerging each bag inHoagland's solution No. 1 before placing the bags in the soil.A total of three trees (12 bags) were sampled for each of theEVEN, US and PFG treatments. In the case of the UH treat-ment, root growth of three trees (12 bags) of only the highestcropping load sub-treatment was evaluated (UH-H).
316 MARSAL, BASILE, SOLARI AND DEJONG
TREE PHYSIOLOGY VOLUME 23, 2003
Statistical analysis
The significance of treatment effects on water relations wasevaluated by repeated measures analysis of variance(ANOVA). The effect of treatments on the sensitivity of fruitfresh and dry mass to fruit load was tested by analysis ofcovariance (ANCOVA) using the test of heterogeneity ofslopes. Daily patterns for TCSA and SCSA growth duringStage III of fruit growth were analyzed for all sub-treatments,but only the extreme fruit thinning treatments are reported. Forclarity, regressions between accumulated growth values andfruit load data were averaged by sub-treatments. The effect ofthe fruit distribution treatments was analyzed by ANCOVAthat tested for heterogeneity in the slope of treatment re-sponses to fruit load. Particular differences in the slopes be-tween the EVEN and either the US or UH treatment weresubsequently tested by orthogonal contrasts. To analyze theeffect of the US treatment on growth rate of either defruited orfruited scaffolds, data for each sub-treatment were subjectedto one-way ANOVA. Both ANOVA and ANCOVA tests wereperformed by considering trees and scaffolds as sample units.
Results
Thinning treatments resulted in a continuous range of fruitloads from 100 to 850 fruits tree–1, with overlap in fruit countamong the thinning sub-treatments. However, because wedefruited half of each US tree, the highest counts in this treat-ment did not exceed 463 fruits (Table 2), whereas UH treeshad as many as 763 fruits per tree (Table 2).
Higher fruit loads were significantly correlated with morenegative values of Ψstem and higher values of gl (Table 3). Fruitrelative dry mass was unaffected by fruit load and remainedconstant among the thinning sub-treatments (Table 3).
Mean fruit dry mass at harvest was strongly correlated withfruit load (Figure 1). The different bearing patterns affectedthe response of fruit mass to fruit load (Figure 1). In general, ahigher degree of fruit clumpiness was correlated with steeper
slopes of the relationship between mean fruit fresh or dry massand fruit load (Figure 1; Table 4). That is, the relationships forUS trees had the steepest slopes, whereas the relationships forEVEN trees had the shallowest slopes (Figure 1). The slopes
TREE PHYSIOLOGY ONLINE at http://heronpublishing.com
BRANCH AUTONOMY AND PEACH FRUIT GROWTH 317
Table 3. Effects of fruit load on midday stem water potential (Ψstem),midday stomatal conductance (gl) and fruit relative dry mass (RDM)for trees in the treatments with the extreme fruit distributions.
Treatments and Ψstem gl Fruit RDMsub-treatments (MPa) (mmol m–2 s–1) (%)
Maximum crop –0.66 a1 324 a 14.9(EVEN-M)
Scaffold defruited + –0.60 b 290 b 14.9heavy crop (US-H)
Potential fruit growth –0.55 c 257 c 15.3(PFG)
Probability2 0.0005 0.0004 0.6883
1 Within a column, different letters indicate significant differences atP < 0.05 (Duncan's test).
2 Significance of the thinning treatments, time and time × treatmenteffect in the repeated measurements ANOVA.
Figure 1. Relationships between mean fruit dry mass and fruit loadper tree at the end of Stage III of peach fruit development. Simple lin-ear functions were fitted to dry mass relationships. Each value repre-sents a tree mean. Definitions: EVEN = even fruit distribution; US =uneven fruit distribution–scaffold defruited; and UH = uneven fruitdistribution–hanger defruited.
Table 4. Probabilities for test of heterogeneity of slopes in ANCOVAfor mean final fruit fresh mass and dry mass as a function of numberof fruits per tree or scaffold. Each tree represents a statistical unit. SeeTable 1 for definition of abbreviations.
ANCOVA Fruit fresh Fruit drymass mass
Comparison with tree as sample unitTreatment (TRT) 0.0028*1 0.0108*
Covariable (no. fruits) 0.0001 0.0001Heterogeneity of slopes (TRT × no. fruits) 0.0001 0.0001Contrast of treatment slopes
EVEN versus US 0.0001 0.0001EVEN versus UH 0.1129 0.1522
Comparison with scaffold as sample unitTreatment (TRT) 0.0081 0.0082Covariable (no. fruits) 0.0001 0.0001Heterogeneity of slopes (TRT × no. fruits) 0.2900 0.1925Least squares means for TRT effect (g fruit–1)
EVEN 100.3 b2 15.4 bUS 107.1 a 16.2 aUH 91.4 c 13.8 c
1 When the heterogeneity of the slopes is significant, the assumptionsfor a covariance analysis are invalid and therefore the probabilitiesfollowed by an asterisk are not relevant.
2 Different letters indicate significance differences at P < 0.05 (Stu-dent t-test).
differed significantly between treatments (Table 4). Whenfruit dry mass was expressed per scaffold, differences betweenthe slopes were not significant, but there was a marginal treat-ment effect on dry mass, indicating a slight advantage for fruiton US trees (Table 4 and Figure 2).
Differences between bearing treatments in actual fruitgrowth rates (FGRactual) were not evident at low fruit loads butincreased progressively with increasing fruit load per tree(Figure 3A). The EVEN trees tended to accumulate the high-est total fruit dry mass, whereas US trees had the lowest fruitdry mass growth rate (Figure 3A). On the other hand, theTRANS–COMP limitation rates manifested a peak at about350 fruits tree–1 and progressively decreased at both lower andhigher fruit loads (Figure 3B). Maximum limitation rates forfruit growth were about 52% in US trees, whereas limitationswere slightly lower in UH trees (42%) and lowest in EVENtrees (33%) (Figure 3B). When the same calculations wereperformed on a scaffold basis, FGRactual for EVEN and UStrees had similar trends and the calculated TRANS–COMPlimitations were only an average of 4% higher in EVEN treesthan in US trees (Figure 4A). Maximum limitations were ob-served at 150 fruits per scaffold, and the limitations at this cropload were similar to those of EVEN trees when calculated on atree basis (Figures 3B and 4B).
The daily increases in TCSA and SCSA differed betweentrees with different fruit loads (Figures 5A and 5B). Whenfruit load was greatest (EVEN-M sub-treatment), there was al-most no SCSA growth or even a slight TCSA shrinkage. Thereason for this TCSA shrinkage is unknown; however, it wasunrelated to water stress because Ψstem values were high intrees in all treatments (< –0.7 MPa, Table 3). At the lowestcropping load (PFG), there were steady and noticeable in-
creases in SCSA and TCSA with time (Figures 5A and 5B).Scaffolds of US-H trees grew at rates that were intermediatebetween those of PFG and EVEN-M trees, but the standard er-rors for the US-H sub-treatment were substantially larger thanfor any other sub-treatment (Figure 5A).
The relationship between fruit load at the scaffold level andthe mean growth rate of both scaffolds per tree (fruited anddefruited scaffolds) was linear (Figure 6A). In general, higherfruit loads resulted in lower SCSA growth; however, this re-sponse was not evident in US trees in which growth ratesseemed to be independent of the mean fruit load of both scaf-folds (Figure 6A). The scaffold growth response of UH treesappeared to follow the same general trend as in trees withevenly distributed fruit (Figure 6A). The fruit load effect in US
318 MARSAL, BASILE, SOLARI AND DEJONG
TREE PHYSIOLOGY VOLUME 23, 2003
Figure 2. Relationships between mean fruit dry mass and fruit loadper scaffold at the end of Stage III of peach fruit development. Datawere fitted by simple linear functions. Each value represents a treemean. Definitions: EVEN = even fruit distribution; and US = unevenfruit distribution–scaffold defruited.
Figure 3. Relationships between fruit load and rates of potential sinkdemand, potential source supply, actual total fruit dry mass growth(A) and transport–competition limitation on a tree basis for Stage IIIof peach development (B). In panel A, the solid horizontal line repre-sents potential source supply and the solid line fitted to the open dia-monds represents potential sink demand. Potential sink data wascalculated according to Equation 2. Closed circles, open circles andshaded squares represent the actual growth rates of even fruit distribu-tion (EVEN), uneven fruit distribution–scaffold defruited (US) anduneven fruit distribution–hanger defruited (UH) treatments, respec-tively.
trees was more evident when the response of scaffold growthto scaffold fruit load was analyzed only for the loaded scaf-folds, rather than based on the mean of both scaffolds (Fig-ure 6B). Nevertheless, the fruit load effect in the US treesappeared to be weaker than in trees in the other treaments (Fig-ure 6B). Analysis of covariance (ANCOVA) revealed that theslope of the SCSA growth to fruit load relationship in theloaded scaffold of US trees was significantly different fromthat in EVEN trees; therefore, data from US trees were consid-ered separately from the general regression (Figure 6B). A sig-nificant difference was found for the two highest fruit loadsub-treatments (US-N and US-H) when we compared growth
of the fruited scaffolds with the non-fruited scaffold of UStrees (Table 5). In these sub-treatments, non-fruited scaffoldssurpassed the growth of the fruited scaffolds and in the case ofUS-H trees, the values more than doubled (Table 5).
The response of trunk growth (TCSA) to fruit load wasstrong and linear (Figure 7). Fruit number per tree explainedup to 90% of the variation in trunk growth (Figure 7). Al-though trunk growth (TCSA) of US trees had a tendencytoward positive residuals in the general regression (Figure 7),based on the ANCOVA, differences in the slopes of the re-gressions for US and EVEN trees were not statistically signifi-cant (Table 6). The fruit load effect on trunk growth (TCSA) inUH trees did not differ from that in other treated trees (Fig-ure 7).
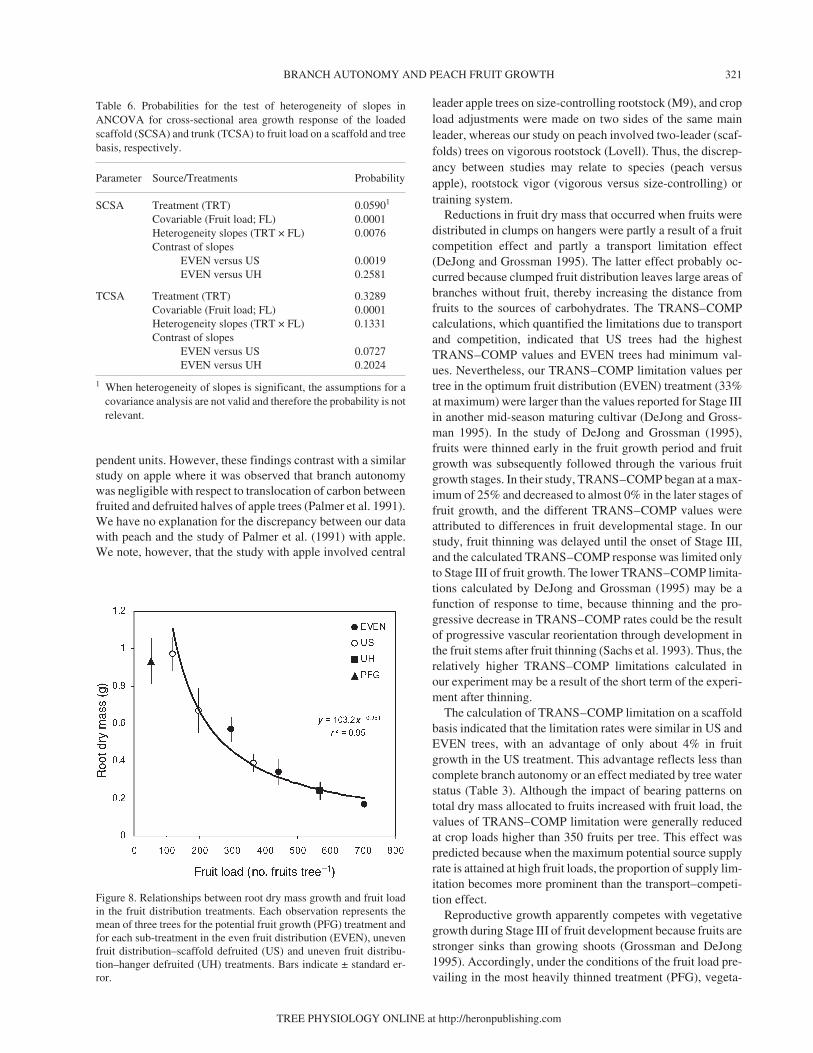
Root growth was strongly related to fruit load with a ten-dency toward saturation at high fruit loads (> 350 fruits tree–1)
TREE PHYSIOLOGY ONLINE at http://heronpublishing.com
BRANCH AUTONOMY AND PEACH FRUIT GROWTH 319
Figure 4. Relationships between fruit load and rates of potential sinkdemand, potential source supply, actual total fruit dry mass growth(A) and transport–competition limitation on a scaffold basis (B) forStage III of peach fruit development. In panel A, the solid horizontalline represents potential source supply and the solid line fitted to opendiamonds represents potential sink demand. Potential sink data weremodeled using the ACTUAL fruit size data from the EVEN treatmentand multiplied by the corresponding fruit load. Symbols: � = actualgrowth rate of even fruit distribution treatment (EVEN); and � = ac-tual growth rate of uneven fruit distribution–scaffold defruited (US)treatment. In panel B, the dotted and solid lines represent EVEN andUS treatments, respectively.
Figure 5. Seasonal patterns of the increase in mean scaffold cross-sec-tional area (SCSA) (A) and trunk cross-sectional area (TCSA) (B) forthe extreme fruit distribution treatments. Each symbol represents themean of six trees in the even fruit distribution–maximum crop(EVEN-M) and potential fruit growth (PFG) treatments and 12 treesin the uneven fruit distribution–scaffold defruited–heavy crop(US-H) treatment. Bars indicate ± standard error.
(Figure 8). No clear patterns emerged between fruit distribu-tion treatments designed to allow differentiation from the gen-eral relationship that was observed between root growth andcrop load (Figure 8).
Discussion
The cropping treatments in this study produced clear differ-ences in the responses of fruit dry mass growth to fruit load.The impact of fruit distribution on total dry mass allocated tofruit was most evident at the highest fruit loads, with US treesand, to a lesser extent, UH trees having a reduced capacity toaccumulate fruit dry matter. However, when data for US and
EVEN trees were normalized by expressing the values perscaffold, most differences between them disappeared, indicat-ing that branches operated mostly as independent units. In UStrees and within EVEN and UH trees, the defruited scaffoldhad little influence on fruit growth of the fruited scaffold. Thisevidence of autonomy in large branches is in general agree-ment with other experiments in which vegetative sinks orsources were manipulated instead of fruit sinks (Stephenson1980, Honkanen and Haoukioja 1994). Furthermore, the re-duction in accumulation of fruit mass in UH trees comparedwith EVEN trees indicates that branch autonomy was func-tional at the level of smaller branch units (i.e., the hangerlevel). This supports the conclusion of Audergon et al. (1993)that peach branches older than 3 years can be considered inde-
320 MARSAL, BASILE, SOLARI AND DEJONG
TREE PHYSIOLOGY VOLUME 23, 2003
Figure 6. Relationships between scaffold growth in cross-sectionalarea (SCSA) and scaffold fruit load for various fruit distribution treat-ments, for both scaffolds averaged per tree (A) and only for the loadedscaffolds in the case of the uneven distribution–scaffold defruitedtreatment (US) (B). Data from the US treatment were excluded fromthe general linear fitting. Each observation represents the mean of sixtrees for the potential fruit growth (PFG) treatment and for eachsub-treatment in the even fruit distribution (EVEN) treatment, where-as 12 trees were averaged per sub-treatment for the US treatment.Bars indicate ± standard error. Definition: UH = uneven fruit distri-bution–hanger defruited.
Table 5. Effects of fruit load and absence of fruit on adjacent scaffolds(uneven fruit distribution treatment, US) on growth rate of cross-sec-tional area measured at the base of the scaffold. The fruit load on thebearing scaffold was low, normal and high for US-L, US-N andUS-H, respectively.
1 Within a row, similar letters indicate no statistical significance be-tween sub-treatments according to the Duncan’s test at α < 0.05.
2 Probability of effect of presence or absence of fruit in one-wayANOVA.
Figure 7. Relationships between trunk cross-sectional area (TCSA)and fruit load in the fruit distribution treatments. Each observationrepresents the mean of six trees for the potential fruit growth (PFG)treatment and for each sub-treatment in the even fruit distribution(EVEN) treatment, whereas 12 trees were averaged per sub-treatmentfor the uneven fruit distribution–scaffold defruited (US) treatment.Bars indicate ± standard error. Definition: UH = uneven fruit distribu-tion–hanger defruited.
pendent units. However, these findings contrast with a similarstudy on apple where it was observed that branch autonomywas negligible with respect to translocation of carbon betweenfruited and defruited halves of apple trees (Palmer et al. 1991).We have no explanation for the discrepancy between our datawith peach and the study of Palmer et al. (1991) with apple.We note, however, that the study with apple involved central
leader apple trees on size-controlling rootstock (M9), and cropload adjustments were made on two sides of the same mainleader, whereas our study on peach involved two-leader (scaf-folds) trees on vigorous rootstock (Lovell). Thus, the discrep-ancy between studies may relate to species (peach versusapple), rootstock vigor (vigorous versus size-controlling) ortraining system.
Reductions in fruit dry mass that occurred when fruits weredistributed in clumps on hangers were partly a result of a fruitcompetition effect and partly a transport limitation effect(DeJong and Grossman 1995). The latter effect probably oc-curred because clumped fruit distribution leaves large areas ofbranches without fruit, thereby increasing the distance fromfruits to the sources of carbohydrates. The TRANS–COMPcalculations, which quantified the limitations due to transportand competition, indicated that US trees had the highestTRANS–COMP values and EVEN trees had minimum val-ues. Nevertheless, our TRANS–COMP limitation values pertree in the optimum fruit distribution (EVEN) treatment (33%at maximum) were larger than the values reported for Stage IIIin another mid-season maturing cultivar (DeJong and Gross-man 1995). In the study of DeJong and Grossman (1995),fruits were thinned early in the fruit growth period and fruitgrowth was subsequently followed through the various fruitgrowth stages. In their study, TRANS–COMP began at a max-imum of 25% and decreased to almost 0% in the later stages offruit growth, and the different TRANS–COMP values wereattributed to differences in fruit developmental stage. In ourstudy, fruit thinning was delayed until the onset of Stage III,and the calculated TRANS–COMP response was limited onlyto Stage III of fruit growth. The lower TRANS–COMP limita-tions calculated by DeJong and Grossman (1995) may be afunction of response to time, because thinning and the pro-gressive decrease in TRANS–COMP rates could be the resultof progressive vascular reorientation through development inthe fruit stems after fruit thinning (Sachs et al. 1993). Thus, therelatively higher TRANS–COMP limitations calculated inour experiment may be a result of the short term of the experi-ment after thinning.
The calculation of TRANS–COMP limitation on a scaffoldbasis indicated that the limitation rates were similar in US andEVEN trees, with an advantage of only about 4% in fruitgrowth in the US treatment. This advantage reflects less thancomplete branch autonomy or an effect mediated by tree waterstatus (Table 3). Although the impact of bearing patterns ontotal dry mass allocated to fruits increased with fruit load, thevalues of TRANS–COMP limitation were generally reducedat crop loads higher than 350 fruits per tree. This effect waspredicted because when the maximum potential source supplyrate is attained at high fruit loads, the proportion of supply lim-itation becomes more prominent than the transport–competi-tion effect.
Reproductive growth apparently competes with vegetativegrowth during Stage III of fruit development because fruits arestronger sinks than growing shoots (Grossman and DeJong1995). Accordingly, under the conditions of the fruit load pre-vailing in the most heavily thinned treatment (PFG), vegeta-
TREE PHYSIOLOGY ONLINE at http://heronpublishing.com
BRANCH AUTONOMY AND PEACH FRUIT GROWTH 321
Figure 8. Relationships between root dry mass growth and fruit loadin the fruit distribution treatments. Each observation represents themean of three trees for the potential fruit growth (PFG) treatment andfor each sub-treatment in the even fruit distribution (EVEN), unevenfruit distribution–scaffold defruited (US) and uneven fruit distribu-tion–hanger defruited (UH) treatments. Bars indicate ± standard er-ror.
Table 6. Probabilities for the test of heterogeneity of slopes inANCOVA for cross-sectional area growth response of the loadedscaffold (SCSA) and trunk (TCSA) to fruit load on a scaffold and treebasis, respectively.
1 When heterogeneity of slopes is significant, the assumptions for acovariance analysis are not valid and therefore the probability is notrelevant.
tive growth continued at constant high rates throughout StageIII of fruit growth. In general, fruit load had a dramatic impacton growth of SCSA and TCSA and the fruit distribution treat-ments also appeared to cause major differences on individualscaffolds; defruited scaffolds grew at higher rates than thefruited scaffolds in the US treatment. The high growth rates ofthe defruited scaffold can be explained by the lack of fruitgrowth competition in the defruited branch and thus by the ex-istence of a surplus of carbon confined to this scaffold. Thegrowth rate difference between fruited and defruited scaffoldsindicates significant branch autonomy.
On the other hand, not all growth differences are necessarilyrelated to carbon immobility. Differences in carbon acquisi-tion per tree or scaffold are expected, because net assimilationrates in peach leaves are associated with fruit demand for car-bon (DeJong 1986b, Ben Mimoum et al. 1996). However,these differences are often compensated for by the develop-ment of new canopy on the defruited scaffolds (Wünsche andPalmer 1997). Furthermore, if there were a significant effectof defruiting on the net assimilation rate of one scaffold whilethe adjacent scaffold was cropped, this would indicate thatscaffolds are autonomous with respect to carbon demand aswell as carbon supply.
In retrospect, the finding that scaffold growth of UH andEVEN trees was similar is not surprising, because growth wasmeasured at the scaffold level. Likewise, differences in SCSAgrowth between adjacent scaffolds may have been cancelledout on a whole-tree basis because tree-averaged SCSA data re-sulted in a nonsignificant effect of fruit distribution treat-ments.
Although branch autonomy for scaffold growth appeared tobe significant, it was not absolute. Loaded scaffolds grewmore under heavy cropping conditions in US trees than inEVEN trees, indicating that some carbon probably movedfrom the defruited scaffold to the fruited scaffold. This possi-ble carbon movement did not seem to involve trunk growth,because TCSA in the US trees was not significantly differentfrom that in the EVEN or UH trees for similarly cropped con-ditions.
Growth of the root system was unaffected by fruit distribu-tion treatments. Because root growth was sensitive to fruitload but did not benefit from an apparent lack of total branchautonomy, this may indicate that, during Stage III of fruit de-velopment, roots were unable to compete equally with scaf-folds for carbon resources. It appears that the incompletebranch autonomy was only apparent among the abovegroundorgans and at a local level, thus defining a broader unit of au-tonomy that may isolate the aboveground part of the tree fromthe root system. This behavior supports the functional equilib-rium concept between aboveground and belowground parts ofthe tree which holds that current-year growth in fine roots isthought to be proportional to the production of new leaves(Kozlowski et al. 1991). Calculations performed with a carbonbalance model, in which root growth is supported by carbohy-drates residual to aboveground growth, indicates that, withmodest fruit loads, little carbon is available for root growth
during Stage III (PEACH model, Grossman and DeJong1994). This may explain the high sensitivity of root growth tofruit load at medium crop loads (100–300 fruits tree–1),whereas at higher crop loads, root growth occurred at a mini-mal but constant rate. The strong response of root growth tofruit load is in accordance with the concept that roots areweaker carbon sinks relative to other vegetative organs (Heimet al. 1979, Kramer and Kozlowski 1979).
In summary, scaffold branches appeared to function primar-ily as autonomous units in supplying carbon for Stage III fruitgrowth, when peach fruits are believed to be strong sinks.Fruiting hangers also exhibited significant autonomy relativeto the distribution of dry matter within the tree. We predictedthat extreme heterogeneity in fruit distribution would producea growth enhancement in organs other than fruits, includingthe root system. However, this enhancement was observedonly in organs at short distances from the fruit positions (i.e.,defruited scaffolds grew more than fruited scaffolds), but notin organs located farther away from the source of heterogene-ity such as the trunk and roots.
Acknowledgments
The authors thank Prof. Ken Shackel for insightful advice on the pa-per, and the staff at the Wolfskill Experimental Orchard for help withthe field work.
References
Audergon, J.M., P. Monestiez and R. Habib. 1993. Spatial depen-dences and sampling in a fruit tree: a new concept for spatial pre-diction in fruit studies. J. Hortic. Sci. 68:99–112.
Ben Mimoun, M., J.J. Longuenesse and M. Genard. 1996. Pmax as re-lated to leaf:fruit ratio and fruit assimilate demand in peach. J.Hortic. Sci. 71:767–775.
Berman, M.E. and T.M. DeJong. 1996. Water stress and crop load ef-fects on fruit fresh and dry weights in peach (Prunus persica). TreePhysiol. 16:859–864.
DeJong, T.M. 1986a. Effects of reproductive and vegetative sink ac-tivity on leaf conductance and water potential in Prunus persica(L.) Batsch. Sci. Hortic. 29:131–137.
DeJong, T.M. 1986b. Fruit effects on photosynthesis in Prunuspersica. Physiol. Plant. 66:149–153.
DeJong, T.M. 1999. Developmental and environmental control ofdry-matter partitioning in peach. HortScience 34:1037–1040.
DeJong, T.M. and Y.L. Grossman. 1995. Quantifying sink and sourcelimitations on dry matter partitioning to fruit growth in peach trees.Physiol. Plant. 95:437–443.
DeJong, T.M., K.R. Day, J.F. Doyle and R.S. Johnson. 1995. TheKearney Agricultural Center perpendicular “V” (KAC-V) orchardsystem for peaches and nectarines. Hort. Tech. 4:362–367.
Dickson, R.E. 1991. Assimilate distribution and storage. In Physiol-ogy of Trees. Ed. A.S. Raghavendra. John Wiley & Sons, NY,509 p.
Finer, L. and J. Laine. 2000. The ingrowth bag method in measuringroot production on peatland sites. Scand. J. For. Res. 15:75–80.
Grossman, Y.L. and T.M. DeJong. 1994. PEACH: a simulationmodel of reproductive and vegetative growth in peach trees. TreePhysiol. 14:329–345.
Grossman, Y.L. and T.M. DeJong. 1995. Maximum vegetativegrowth potential and seasonal patterns of resource dynamics dur-ing peach growth. Ann. Bot. 76:473–482.
322 MARSAL, BASILE, SOLARI AND DEJONG
TREE PHYSIOLOGY VOLUME 23, 2003
Gucci, R., C. Xiloyannis and J.A. Flore. 1991. Gas exchange parame-ters, water relations and carbohydrate partitioning in leaves offield-grown Prunus domestica following fruit removal. Physiol.Plant. 83:497–505.
Heim, G., J.J. Landsberg, R.L. Watson and P. Brain. 1979. Eco-physi-ology of apple trees: dry matter production and partitioning byyoung Golden Delicious trees in France and England. J. Appl.Ecol. 16:179–194.
Honkanen, T. and E. Haukioja. 1994. Why does a branch suffer moreafter branch-wide than after tree-wide defoliation? Oikos 71:441–450.
Kappel, F. 1991. Partitioning of above-ground dry matter in ‘Lam-bert’ sweet cherry trees with or without fruit. J. Am. Soc. Hortic.Sci. 116:201–205.
Kozlowski, T.T., P.J. Kramer and S.G. Pallardy. 1991. The physio-logical ecology of woody plants. Academic Press, San Diego, CA,657 p.
Kramer, P.J. and T.T. Kozlowski. 1979. Physiology of woody plants.Academic Press, New York, 811 p.
Lacointe, A., A. Kaji, F.A. Daudet, P. Archer and J.S. Frossard. 1995.Seasonal variation of photosynthetic carbon flow rate into youngwalnut and its partitioning among the plant organs and functions. J.Plant Physiol. 146:222–230.
Majdi, H. 1996. Root sampling methods—applications and limita-tions of the minirhizotron technique. Plant Soil 185:255–258.
McCutchan, H. and K.A. Shackel. 1992. Stem water potential as asensitive indicator of water stress in prune trees (Prunus domesticaL. cv French). J. Am. Soc. Hortic. Sci. 117:607–611.
Palmer, J., W., Y.-L. Cai and Y. Edjamo. 1991. Effect of part-treeflower thinning on fruiting, vegetative growth and photosynthesisin ‘Cox’s Orange Pippin’ apple. J. Hortic. Sci. 66:319–325.
Palmer, J.W. 1992. Effects of varying crop load on photosynthesis,dry matter production and partitioning of Crispin/M.27 apple trees.Tree Physiol. 11:19–33.
Sachs, T., A. Novoplansky and D. Cohen. 1993. Plants as competingpopulations of redundant organs. Plant Cell Environ. 16:765–770.
Sprugel, D.G., T.M. Hinckley and W. Schaap. 1991. The theory andpractice of branch autonomy. Annu. Rev. Ecol. Syst. 22:309–334.
Stephenson, A.G. 1980. Fruit set, herbivory, fruit reduction, and thefruiting strategy of Catalpa speciosa (Bignoniaceae). Ecology 61:57–64.
Wardlaw, I.F. 1990. The control of carbon partitioning in plants.Tansley Review No. 27. New Phytol. 116:341–381.
Williamson, J.G. and D.C. Coston. 1989. The relationship among rootgrowth, shoot growth, and fruit growth of peach. J. Am. Soc.Hortic. Sci. 114:180–183.
Wünsche, J.N. and J.W. Palmer. 1997. Portable through-flow cuvettesystem for measuring whole-canopy gas exchange of apple trees inthe field. HortScience 32:653–658.
TREE PHYSIOLOGY ONLINE at http://heronpublishing.com