Page 1
Influence of chlorine dioxide on cell death and cell cycle of
human gingival fibroblasts
Ryo Nishikioria, Yuji Nomuraa,*, Masahiko Sawajirib, Kohei Masukia, Isao Hirataa, and
Masayuki Okazakia
aDepartment of Biomaterials Science, Graduate School of Biomedical Science,
Hiroshima University, Hiroshima, Japan
bHiroshima University Hospital, Hiroshima, Japan
Running title: Apoptotic influence of dental disinfectants
Keywords: apoptotic influence; dental disinfectants; chlorine dioxide; human gingival
fibroblast
Number of reprints: 100
Page 2
ABSTRACT
Objectives: The effects of chlorine dioxide (ClO2), sodium hypochlorite (NaOCl), and
hydrogen peroxide (H2O2) on cell death and the cell cycle of human gingival fibroblast
(HGF) cells were examined.
Methods: The inhibition of HGF cell growth was evaluated using a Cell Counting Kit-8.
The cell cycle was assessed with propidium iodide-stained cells (distribution of cells in
G0/G1, S, G2/M phases) using flow cytometry. The patterns of cell death (necrosis and ap
optosis) were analyzed using flow cytometry with annexin V-FITC/PI staining.
Results: The lethal doses for 50% of the cells (LD50) of ClO2, NaOCl, and H2O2 were 0.
16 mM, 0.79 mM, and 0.11 mM, respectively. All three dental disinfectants induced G0/
G1 cell cycle arrest. H2O2 induced apoptosis at concentrations of 0.05 and 0.1 mM, while
NaOCl and ClO2 did not induce significant apoptosis at any concentration examined.
Conclusions: These results suggest that ClO2 is sufficient for use as a dental disinfectant
compared with H2O2 or NaOCl.
1
Page 3
1. Introduction
Various disinfectants are used in endodontics and for gingival and soft tissue irrigation.
Disinfectants are administered to the oral mucosa or to the root canals of pulpless teeth
directly.1–3 These disinfectants can be absorbed into the bloodstream through the oral
mucosa or by passing through the apical foramen of teeth.4–6 Consequently, tissue
cytotoxicity and biocompatibility must be considered when choosing a disinfectant.
Sodium hypochlorite (NaOCl) and hydrogen peroxide (H2O2) are widely used as
endodontic irrigants.7–11 However, H2O2 and NaOCl have deleterious effects on cell
DNA, and have been implicated in several pathological processes, such as cancer.12–14
Chlorine dioxide (ClO2) is currently used as a water purifier, surface disinfectant,
and in some commercial mouth rinses.15–18 ClO2 has bactericidal activity and is toxic to
both enveloped and non-enveloped viruses.19, 20 It has been considered for use as a root
canal irrigant, but little is known about its cytotoxicity.
This study was performed to evaluate the cytotoxicity of aqueous solutions of ClO2
on human gingival fibroblast (HGF) cells in comparison with H2O2 and NaOCl, and to
compare the effects of these disinfectants on the HGF cell cycle and cell death.
1
Page 4
2. Materials and Methods
2.1. Chemicals
This study used the chemicals 30% H2O2 (Santoku Chemical Industries, Tokyo, Japan),
10% NaOCl (Sigma-Aldrich, Tokyo, Japan) solution, and aqueous ClO2 (Kurosaki,
Fukuoka, Japan). The aqueous ClO2 solution was prepared by mixing solution A (chiefly
NaOCl2) and solution B (chiefly HCl), resulting in a concentration of 0.3% (45 mM) after
1 h. We diluted samples of each stock solution to the appropriate final concentration using
Dulbecco’s modified Eagle’s medium (DMEM; Sigma-Aldrich) supplemented with 10%
fetal bovine serum (FBS; Daiichi Pure Chemicals, Tokyo, Japan) immediately before use.
2.2. Cells and cell culture
Human gingival fibroblasts were cultivated from gingiva obtained from a patient’s tooth
after obtaining informed consent according to institutional committee regulations. We
incubated the cells in culture medium consisting of DMEM, 10% FBS, 100 U/ml
penicillin, and 100 mg/ml streptomycin at 37°C in a humidified atmosphere of 5% CO2.
2.3. Growth assay
We used a Cell Counting Kit-8 (Dojindo, Kumamoto, Japan) to determine the lethal dose
2
Page 5
50% (LD50). We seeded an equal number of HGF cells (1 × 10⁴ cells/well) in 100 µl of
DMEM into 96-well microplates and incubated the cells overnight at 37°C in a
humidified atmosphere of 5% CO2. We prepared a stock solution of each disinfectant and
then diluted each solution serially in the cell culture medium. Then, we treated the cells
with each disinfectant diluted in 100 µl of DMEM to obtain final concentrations of 10–0,
10–1, 10–2, 10–3, 10–4, and 10–5 mM.
Following incubation for 24 h, 10 µl of Cell Counting Kit-8 solution was added to each
well and the plates were incubated for an additional 2 h at 37°C. We measured the
absorbance at 450 nm with an immunoreader (Microplate Reader 550; Bio-Rad, Tokyo,
Japan) and calculated the number of cells from the absorbance value relative to a standard
curve.
2.4. Cell cycle analysis
We plated 5 × 10⁵ HGF cells in 60-mm culture dishes and incubated them in DMEM with
0.5% FBS for 48 h to synchronize the cells in G0/G1 phase by serum deprivation.21 We
induced the cells to re-enter the cell cycle by incubation in fresh medium with the
disinfectants at the final concentration (determined from the growth assay results) for a
further 24 h.
3
Page 6
The cellular DNA content was determined by flow cytometry, as described
previously.22 We collected the floating and attached cells using trypsin-EDTA and
resuspended them in DMEM (no FBS). The cells were fixed for 30 min in an ice-cold
70% ethanol solution containing ribonuclease (RNase; 2 mg/ml). We washed the cells in
PBS, and then stained them with propidium iodide (PI) for 10 min. The PI-elicited
fluorescence was measured for individual cells using a flow cytometer (FACSCalibur;
Becton Dickinson, Tokyo, Japan) with laser excitation at 488 nm. Emissions greater than
590 nm were collected in a linear/log scale fashion. We analyzed a total of 1 × 10⁴ cells
for each sample and determined the percentages of cells in G0/G1, S, and G2/M phases
using standard ModiFit and Cell Quest software (Becton Dickinson).
2.5. Annexin V-FITC/PI assay
To detect apoptosis, the cells were stained with PI and fluorescein isothiocyanate
(FITC)-conjugated annexin V using an Annexin V-FITC Apoptosis Detection Kit I
(Becton Dickinson). Annexin V-FITC identifies cells in early apoptosis by detecting
externalized phosphatidylserine, and PI identifies cells that have lost plasma membrane
integrity (i.e., necrotic or late apoptotic cells). We added the disinfectant concentration
that previously produced growth in the HGF cultures and incubated the cells for 24 h at
4
Page 7
37°C. After incubation, the cells were harvested by trypsin-EDTA treatment and washed
with DMEM. We resuspended the cells in 50 μl of 1× binding buffer supplemented with 5
μl of annexin V-FITC and 10 μl of PI, and kept the cells at room temperature in the dark
for 15 min according to the manufacturer’s instructions. Following the addition of 450 μl
of 1× binding buffer, the stained cells were kept on ice and subjected to
fluorescence-activated cell sorter analysis (FACS) using a FACSCalibur flow cytometer.
We measured the FITC fluorescence between 515 and 545 nm and the PI fluorescence
between 564 and 606 nm.
2.6. Data analysis
The data are expressed as the means ± standard error (SE) of at least three independent
experiments; they were analyzed using the Student’s t test; p < 0.05 was considered
significant.
5
Page 8
3. Results
3.1. Growth assay
We expressed cell proliferation as the percentage of cells that proliferated in the presence
of a disinfectant relative to proliferation in its absence. The LD50 for HGF cells was 1.6 ×
10–1 mM for ClO2, 1.1 × 10⁻¹ mM for H2O2, and 7.9 × 10⁻¹ mM for NaOCl (Fig. 1).
3.2. Cell cycle analysis
Serum-deprived cells were arrested in G0/G1 phase (Fig. 2; control 0 h). When these cells
were returned to culture medium containing 10% FBS, cell proliferation was stimulated
after 24 hours and the number of cells in S and G2/M phases increased and the number in
G0/G1 phase decreased, compared with control 0 h (Fig. 2; control 24 h). By contrast, the
cells exposed to the disinfectants caused a large percentage of cells to remain in G0/G1
phase, with a small percentage in S and G2/M phases (Fig. 3).
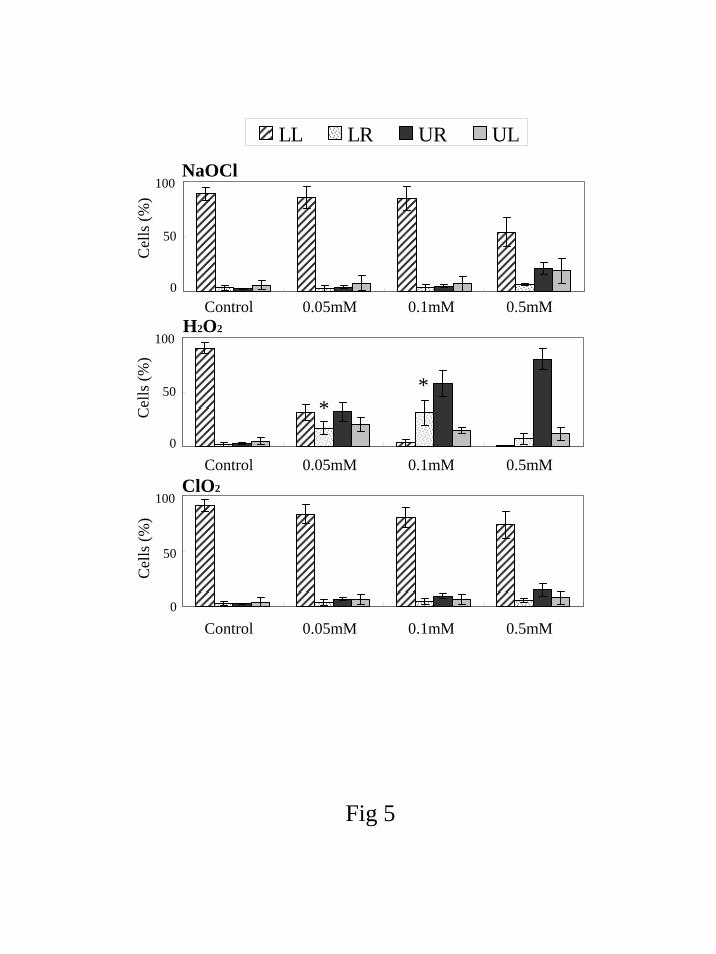
3.3. Annexin V-FITC/PI assay
Figure 4 shows the distribution of the cell populations after treatment with disinfectants
for 24 h. A dot-plot of annexin V-FITC vs. PI showed four separate clusters: viable cells
(lower left quadrant), early apoptotic cells (lower right quadrant), necrotic or late
6
Page 9
apoptotic cells (upper right quadrant), and necrotic cells (upper left quadrant). The
Student’s t test revealed that H2O2 (0.05 and 0.1 mM) induced significantly more
apoptosis compared to the control 24 h (p < 0.05), while ClO2 and NaOCl did not produce
significant levels of apoptosis (Fig. 5).
7
Page 10
4. Discussion
NaOCl and H2O2 are widely used as endodontic disinfectants. NaOCl, which is used at a
concentration of 5.25% (7.8 × 10² mM), was shown to have both antibacterial and
necrotic tissue dissolution properties. 8, 9,23 H2O2 is used as a cleansing agent in wound
debridement and as an intracanal disinfectant at concentrations of 2.5–3.5% (7.4 × 10² to
1.0 × 10³ mM).1
Chlorine dioxide (ClO2) is currently used as a water purifier, surface disinfectant,
and in some commercial mouth rinses.15–18 ClO2 has recently been considered as a root
canal irrigant because of its antibacterial activity and compatibility with living tissue,19
but at present, little is known about its cytotoxicity.
ClO2 is used as a disinfectant at concentrations of 0.1–15 mM,15, 24, 25 but an effective
clinical concentration has not been determined. If a lower effective concentration can be
determined, ClO2 may prove to be a relatively nontoxic disinfectant.
In this study, the LD50 for HGF cells at 24 h was found to be 1.6 × 10⁻¹ mM for ClO2,
1.1 × 10⁻¹ mM for H2O2, and 7.9 × 10⁻¹ mM for NaOCl (Fig. 1). The results of the cell
cycle analysis suggested that at the LD50, the HGF cells were arrested in G0/G1 phase
(Fig. 3). This implies that disinfectant inhibition of cell growth was due to the arrest of
DNA replication in the cell cycle.
8
Page 11
The inhibition of cell growth causes cell death either through necrosis (i.e.,
accidental cell death) or apoptosis (i.e., programmed cell death).26-28 The morphological
changes associated with necrosis are swelling, membrane rupture, and cell lysis. In
contrast, during apoptosis, condensation and fragmentation of the cytoplasm and nucleus
occur in the target cells, while the normal organelle structures are maintained. Several
studies have indicated that exposing cells to exogenous oxidants can induce apoptosis.29
During the early stages of apoptosis, a loss of phospholipid asymmetry occurs that
results in the translocation of negatively charged aminophospholipid phosphatidylserine
(PS) from the inner to the outer leaflet of the cell membrane.30 The annexin V-FITC/PI
assay used to identify apoptotic cells detects this change as a marker of apoptotic cells. In
the presence of calcium ions, annexin V binds specifically to PS, and the externalization
of PS is an important cell-surface signal for the macrophage clearance of apoptotic
cells.31, 32
Apoptosis is a physiological process involved in cell deletion during organogenesis,
and it controls cell proliferation and differentiation in adult tissues.33 The deregulation of
apoptosis has been implicated in a variety of diseases. Excessive apoptosis has been
related to sepsis, ischemic heart disease, stroke, and neurodegenerative diseases, while
9
Page 12
functional deficiencies in the activation of apoptosis may facilitate the development of
cancer and autoimmune diseases.34
We examined the effects of disinfectants on cell death using an annexin V-FITC/PI
assay at close to the LD50 concentration (0.05, 0.1, and 0.5 mM). The dose-independent
effect showed that H2O2, but not ClO2 or NaOCl, induced cell death by producing an
apoptotic signal at 0.05 and 0.1 mM (Fig. 4, 5). We demonstrated that these disinfectants
consistently arrested cells at G0/G1 phase of the cell cycle and induced apoptosis and
necrosis. H2O2 arrested cells at G0/G1 phase of the cell cycle and induced apoptosis. ClO2
and NaOCl arrested cells at G0/G1 phase of the cell cycle, however, did not induce
apoptosis. In summary, ClO2 and NaOCl may be better dental disinfectants than oxidative
agents, such as H2O2.
Chlorinating agents, such as Cl2 and NaOCl, used as disinfectants for drinking water
react with natural organic matter to produce halogenated disinfectant by-products.
Trihalomethanes and haloacetic acids are the two most prevalent groups of disinfectant
by-products formed during the chlorination of natural water.35 A recent study showed that
trihalomethane is an animal carcinogen and a suspected human carcinogen.36 ClO2
produces little or no trihalomethanes,37 and may be a better dental disinfectant than
NaOCl.
10
Page 13
These findings suggest that ClO2 is sufficient for use as a dental disinfectant
compared with H2O2 or NaOCl. Further in vitro and in vivo studies are required to
determine the clinical relevance of our findings.
11
Page 14
References
1. Hori I, Higo Y, Ohno M, Tsutsui TW, Tsutsui T. Assessment using human dental pulp
cells of clastogenicity of antiseptics used in dental practice and agents for root canal
enlargement and cleaning. Odontology / the Society of the Nippon Dental University
2007; 95:30-7.
2. Ari H, Erdemir A, Belli S. Evaluation of the effect of endodontic irrigation solutions on
the microhardness and the roughness of root canal dentin. Journal of endodontics 2004;
30:792-5.
3. Siqueira JF Jr, Magalhães KM, Rôças IN. Bacterial reduction in infected root canals
treated with 2.5% NaOCl as an irrigant and calcium hydroxide/camphorated
paramonochlorophenol paste as an intracanal dressing. Journal of endodontics 2007;
33:667-72.
4. Myers DR, Shoaf HK, Dirksen TR, Pashley DH, Whitford GM, Reynolds KE.
Distribution of 14C-formaldehyde after pulpotomy with formocresol. Journal of the
American Dental Association 1978; 96:805-13.
5. Bartelstone HJ. Radioiodine penetration through intact enamel with uptake by
bloodstream and thyroid gland. Journal of dental research 1951; 30:728-33
6. Someya H, Higo Y, Ohno M, Tsutsui TW, Tsutsui T. Clastogenic activity of seven
12
Page 15
endodontic medications used in dental practice in human dental pulp cells. Mutation
research 2008; 650:39-47.
7. Whitten BH, Gardiner DL, Jeansonne BG, Lemon RR. Current trends in endodontic
treatment: report of a national survey. Journal of the American Dental Association 1996;
127:1333-41.
8. Gomes BP, Ferraz CC, Vianna ME, Berber VB, Teixeira FB, Souza-Filho FJ. In vitro
antimicrobial activity of several concentrations of sodium hypochlorite and chlorhexidine
gluconate in the elimination of Enterococcus faecalis. International endodontic journal
2001; 34:424-8.
9. Hand RE, Smith ML, Harrison JW. Analysis of the effect of dilution on the necrotic
tissue dissolution property of sodium hypochlorite. Journal of endodontics 1978; 4:60-4.
10. Qing Y, Akita Y, Kawano S, Kawazu S, Yoshida T, Sekine I. Cleaning efficacy and
dentin micro-hardness after root canal irrigation with a strong acid electrolytic water.
Journal of endodontics 2006; 32:1102-6.
11. Erdemir A, Ari H, Güngüneş H, Belli S. Effect of medications for root canal treatment
on bonding to root canal dentin. Journal of endodontics 2004; 30:113-6.
12. Ohnishi S, Murata M, Kawanishi S. DNA damage induced by hypochlorite and
hypobromite with reference to inflammation-associated carcinogenesis. Cancer Lett
13
Page 16
2002; 178:37-42.
13. López-Lázaro M. Dual role of hydrogen peroxide in cancer: possible relevance to
cancer chemoprevention and therapy. Cancer Lett 2007; 252:1-8.
14. Daroui P, Desai SD, Li TK, Liu AA, Liu LF. Hydrogen peroxide induces
topoisomerase I-mediated DNA damage and cell death. J Biol Chem 2004; 279:14587-94.
15. Wirthlin MR, Marshall GW JR. Evaluation of ultrasonic scaling unit waterline
contamination after use of chlorine dioxide mouthrinse lavage. Journal of periodontology
2001; 72:401-10.
16. Wirthlin MR, Marshall GW JR, Rowland RW. Formation and decontamination of
biofilms in dental unit waterlines. Journal of periodontology 2003; 74:1595-609.
17. Zani C, Feretti D, Buschini A, Poli P, Rossi C, Guzzella L, Caterino FD, Monarca S.
Toxicity and genotoxicity of surface water before and after various potabilization steps.
Mutation research 2005; 587:26-37.
18. Peruzzo DC, Jandiroba PF, Nogueira Filho Gda R. Use of 0.1% chlorine dioxide to
inhibit the formation of morning volatile sulphur compounds (VSC). Braz Oral Res 2007;
21:70-4.
19. Barnhart BD, Chuang A, Lucca JJ, Roberts S, Liewehr F, Joyce AP. An in vitro
evaluation of the cytotoxicity of various endodontic irrigants on human gingival
14
Page 17
fibroblasts. Journal of endodontics 2005; 31:613-5.
20. Zoni R, Zanelli R, Riboldi E, Bigliardi L, Sansebastiano G. Investigation on virucidal
activity of chlorine dioxide. experimental data on feline calicivirus, HAV and Coxsackie
B5. Journal of preventive medicine and hygiene 2007; 48:91-5.
21. Kühholzer B, Prather RS. Synchronization of porcine fetal fibroblast cells with
topoisomerase-inhibitor hoechst 33342. Animal reproduction science 2001; 66:109-16.
22. Otsubo A, Bhawal UK, Nomura Y, Mitani Y, Ozawa K, Kuniyasu H, Sugiyama M.
UCN-01 (7-hydroxystaurosporine) induces apoptosis and G1 arrest of both primary and
metastatic oral cancer cell lines in vitro. Oral surgery, oral medicine, oral pathology, oral
radiology, and endodontics 2007; 103:391-7.
23. Shih M, Marshall FJ, Rosen S. The bacterial efficiency of sodium hypochlorite as an
endodontic irrigant. Oral surgery, oral medicine, and oral pathology 1970; 29:613-9.
24. Li JW, Xin ZT, Wang XW, Zheng JL, Chao FH. Mechanisms of inactivation of
hepatitis A virus in water by chlorine dioxide. Water research 2004; 38:1514-9.
25. Isomoto H, Urata M, Kawazoe K, Matsuda J, Nishi Y, Wada A, Ohnita K, Hirakata Y,
Matsuo N, Inoue K, Hirayama T, Kamihira S, Kohno S. Endoscope disinfection using
chlorine dioxide in an automated washer- disinfector. The Journal of hospital infection
2006; 63:298-305.
15
Page 18
26. Yonish-Rouach E, Grunwald D, Wilder S, Kimchi A, May E, Lawrence JJ, May P,
Oren M. p53-mediated cell death: relationship to cell cycle control. Molecular and
cellular biology 1993; 13:1415-23.
27. Liu L, Trimarchi JR, Keefe DL. Thiol oxidation-induced embryonic cell death in
mice is prevented by the antioxidant dithiothreitol. Biology of reproduction 1999;
61:1162-9.
28. Mazière C, Meignotte A, Dantin F, Conte MA, Mazière JC. Oxidized LDL induces an
oxidative stress and activates the tumor suppressor p53 in MRC5 human fibroblasts.
Biochem Biophys Res Commun 2000; 276:718-23.
29. Chen HY, Zheng CY, Zou GL, Xie DX, Gong JP. Peplomycin induces G1-phase
specific apoptosis in liver carcinoma cell line Bel-7402 involving G2-phase arrest. Acta
pharmacologica Sinica 2004; 25:1698-704
30. Maulik N, Kagan VE, Tyurin VA, Das DK. Redistribution of
phosphatidylethanolamine and phosphatidylserine precedes reperfusion-induced
apoptosis. The American journal of physiology 1998; 274:H242-8.
31. Masuki K, Nomura Y, Bhawal UK, Sawajiri M, Hirata I, Nahara Y, Okazaki M.
Apoptotic and necrotic influence of dental resin polymerization initiators in human
gingival fibroblast cultures. Dental materials journal 2007; 26:861-9.
16
Page 19
32. Kagan VE, Gleiss B, Tyurina YY, Tyurin VA, Elenström-Magnusson C, Liu SX,
Serinkan FB, Arroyo A, Chandra J, Orrenius S, Fadeel B. A role for oxidative stress in
apoptosis: oxidation and externalization of phosphatidylserine is required for
macrophage clearance of cells undergoing Fas-mediated apoptosis. Journal of
immunology 2002; 169:487-99.
33. Yuan J, Murrell GA, Trickett A, Wang MX. Involvement of cytochrome c release and
caspase-3 activation in the oxidative stress-induced apoptosis in human tendon
fibroblasts. Biochimica et biophysica acta 2003; 1641:35-41.
34. Formichi P, Radi E, Battisti C, Tarquini E, Leonini A, Di Stefano A, Federico A.
Human fibroblasts undergo oxidative stress-induced apoptosis without
internucleosomal DNA fragmentation. Journal of cellular physiology 2006;
208:289-97.
35. Aggazzotti G, Fantuzzi G, Righi E, Predieri G. Environmental and biological
monitoring of chloroform in indoor swimming pools. Journal of chromatography 1995;
710:181-90.
36. Lévesque B, Ayotte P, Tardif R, Ferron L, Gingras S, Schlouch E, Gingras G,
Levallois P, Dewailly E. Cancer risk associated with household exposure to chloroform.
Journal of toxicology and environmental health Part A 2002; 65:489-502.
17
Page 20
37. Hua G, Reckhow DA. Comparison of disinfection byproduct formation from chlorine
and alternative disinfectants. Water research 2007; 41:1667-78.
18
Page 21
Figure captions
Fig. 1. Dose-related cytotoxicity following 24-h exposure to the disinfectants. Cells (104
cells) in 96-well culture plates were exposed to different concentrations of disinfectant
for 24 h. The LD50 concentration of each reagent is indicated by the intersection of the
plotted line.
Fig. 2. A: The representative flow cytometry profile of HGF cells at 0 and 24 h in the
control condition. The high peak (left) indicates cells in G0/G1 phase, the smaller peaks
(right) represent cells in G2/M phase and the area between the peaks represents the cells in
S phase. B: The histogram representing percentage of cells in each cell cycle phase at 0
and 24 h under the control condition.
Fig. 3. The percentage of cells in G0/G1, S, and G2/M phases. Cultures exposed to NaOCl,
ClO2, and H2O2 have significantly more cells in G0/G1 phase compared to the control.
*Significantly different from the control at 24 h.
Fig. 4. The FACS analyses after staining with annexin V-FITC and PI show the induction
19
Page 22
of apoptosis and necrosis in HGF cells after a 24-h exposure to the disinfectants. In each
plot, the lower left quadrant (LL) represents viable cells, the upper left quadrant (UL)
indicates necrotic cells, the lower right quadrant (LR) denotes early apoptotic cells, and
the upper right quadrant (UR) represents necrotic or late apoptotic cells.
Fig. 5. The FACS statistical analysis for each disinfectant. The only significant difference
found was an increase in apoptotic cells (LR) induced by H2O2 at 0.05 mM and 0.1 mM
(*p < 0.05). The lower left (LL) shows viable cells; the upper left (UL) shows necrotic
cells; the lower right (LR) shows early apoptotic cells; and the upper right (UR) shows
necrotic or late apoptotic cells.
20
Page 23
Concentration (mM)10-3 10-2 10-1 10010-4
50
100
010-5
NaOCl
ClO2
H2O2Cel
l Via
bilit
y (%
)
Fig. 1
Page 24
Control 0 h Control 24 h
B
Control 0 h
Tota
l Cel
l Pop
ulat
ion
(%)
Control 24 h
20
60
40
80
100
G0/G1
S
G2/M
DNA content
Fig 2
A
00 600 800 1000200 400
400
160
80
240
320
Cou
nts
00
600 800200 400
400
160
80
240
320
Cou
nts
1000DNA content
Page 25
Control 0 h
Control 24 h
ClO2 H2O2NaOCl
20
60
40
80
100
Tota
l Cel
l Pop
ulat
ion
(%)
Fig. 3
SG0/G1 G2/M
* * *
**
** *
Page 26
Fig. 4
NC
NC
NC
0.05 mM NaOCl
0.05 mM H2O2
0.05 mM ClO2
0.5 mM NaOCl
0.1 mM NaOCl
0.1 mM H2O2
0.5 mM H2O2
0.1 mM ClO2
0.5 mM ClO2
Page 27
Fig 5
LL LR UR UL
**
NaOCl
H2O2
ClO2
Cel
ls (%
)
0
50
100
Control 0.5mM0.1mM0.05mM
Control 0.5mM0.1mM0.05mM
Control 0.5mM0.1mM0.05mM
Cel
ls (%
)
0
50
100
Cel
ls (%
)
0
50
100