A three dimensional coupled biophysical model was used to examine the supply ofoceanic nutrients to the shelf of the East China Sea (ECS) and its role in primary pro-duction over the shelf. The model consisted of two modules: the hydrodynamic modulewas based on a nested model with a horizontal resolution of 1/18 degree, whereas5
the biological module was a low trophic level ecosystem model including two typesof phytoplankton, three elements of nutrients, and biogenic organic material. Modelresults suggested that seasonal variation in chlorophyll-a had a strong regional depen-dence over the shelf of the ECS. The area with high chlorophyll-a appears firstly atthe outer shelf in winter, and gradually migrates toward the inner shelf (offshore region10
of Changjiang estuary) from spring to summer. Vertically, chlorophyll-a was generallyhomogenous from the coastal zone to the inner shelf. In the middle and outer shelves,high chlorophyll-a appeared in the surface in spring but moved to the subsurface fromsummer to early autumn. The annual averaged onshore flux across the shelf breakwas estimated to be 1.53 Sv for volume, 9.4 kmol s−1 for DIN, 0.7 kmol s−1 for DIP, and15
18.2 kmol s−1 for silicate, which are supplied mainly from the northeast of Taiwan andsouthwest of Kyushu. From calculations that artificially increased the concentration ofnutrients in the Kuroshio water, the additional oceanic nutrients were distributed in thebottom layer from the shelf break to the region offshore of Changjiang estuary fromspring to summer, and appeared in the surface layer from autumn to winter. The con-20
tribution of oceanic nutrients to primary production over the shelf was found not only inthe surface layer (mainly at the outer shelf and shelf break in winter and in the regionoffshore of Changjiang estuary in summer) but also in the subsurface layer over theshelf from spring to autumn.
In addition to the terrestrial input of nutrients, marginal seas also receive nutrients fromthe open ocean (hereafter referred to oceanic nutrients) through cross-shelf water ex-change. From a timescale of several decades, terrestrial inputs are affected by bothanthropogenic activities and climate change, with oceanic nutrients mainly driven by5
climate change. Quantifying the oceanic nutrient flux and evaluating its role in driv-ing primary production in marginal seas therefore addresses two key issues in under-standing potential influences of climate change on these economically and ecologicallyimportant ecosystems.
The East China Sea (ECS) is one of the major marginal seas of the northwestern10
Pacific (Fig. 1). Many rivers including the Changjiang River (Yangtze River) representa substantial input of freshwater and nutrients into the adjacent sea (Zhang, 1996). Onthe other hand, the ECS also receives water and associated nutrients from the SouthChina Sea through the Taiwan Strait, in which its volume transport is greater than riverdischarge into the ECS by as much as two orders of magnitude (Isobe, 2008). The15
ECS has a long shelf break (see 200 m-isobath in Fig. 1), by which onshore volumetransport across the shelf break has been reported to be within the same order as thatthrough the Taiwan Strait (Guo et al., 2006; Isobe, 2008).
There are strong seasonal variations in the spatial distribution of nutrients in theECS (Chen, 2009). The concentration of surface nutrients in the ECS is high in winter,20
depletes in spring and summer, and reverts smoothly in autumn to the concentration inwinter (Wang, et al., 2003; Chen, 2009). Such seasonal variations are tightly coupledto biological processes such as phytoplankton blooms in spring through summer andthe remineralization of detritus in autumn as well as on the physical processes suchas summer stratification and winter mixing. In addition, seasonal changes in inputs of25
terrestrial nutrients from rivers and of oceanic nutrient from the Taiwan Strait and theshelf break are also important to the concentration of nutrients in the ECS.
Using a box model, Chen and Wang (1999) calculated the annual nutrient budgetover the shelf of the ECS and suggested a more important role of Kuroshio subsur-face water in supplying nutrients onto the ECS shelf compared to rivers. Zhang etal. (2007b) revisited this calculation using data collected in summer and winter, re-spectively, and confirmed that nutrients supplied by Kuroshio subsurface water intru-5
sion onto the shelf was important in both seasons, in particular for phosphate. Thesefindings are supported by the distribution of passive tracer released only in the Kuroshioregion east of Taiwan in a three dimensional numerical model (Guo et al., 2006).
Although oceanic nutrients have been shown to be important to the nutrient budgetof the ECS (Chen and Wang, 1999; Zhang et al., 2007b), it is still unknown whether10
oceanic nutrients are readily utilized by phytoplankton over the shelf. If oceanic nutri-ents significantly contribute to primary production over the shelf of the ECS, we shouldclarify where and when primary production occurs, and to what extent is attributed toinputs from oceanic nutrients. Furthermore, we also need to address the physical pro-cesses that transport oceanic nutrients inside the Kuroshio subsurface water up to the15
euphotic zone in the shelf region. In this study, we applied a three dimensional nu-merical biophysical model to evaluate the role of oceanic nutrients in driving primaryproduction in the ECS. The physical processes related to the transport of oceanic nu-trients to the euphotic zone will be discussed by a companion paper in the near future.
Model configurations and calculation plans are described in Sect. 2. Then, we com-20
pared model results (nutrients and chlorophyll-a) with observations and examined thenutrient flux across the shelf break in the ECS by presenting its spatial distributionalong the shelf break and its seasonal variations in Sect. 3. By changing the con-centration of nutrients in the Kuroshio water, we reran the simulations and examinedchanges in concentrations of nutrients and chlorophyll-a over the shelf of the ECS, and25
in the onshore nutrient flux across shelf break in Sect. 4. Finally, we summarize thisstudy in Sect. 5.
Our model consisted of two modules, a hydrodynamic module and a biological module.The hydrodynamic module provided physical parameters such as water temperature,velocities and diffusivity coefficients to the biological module that is online coupled tothe hydrodynamic module, i.e., the two modules were run simultaneously.5
The hydrodynamic module is based on the Princeton Ocean Model (Blumberg andMellor, 1987; Mellor, 2003) and configured with a nesting method to obtain high hori-zontal resolution (1/18 degree) for the ECS, as described in details by Guo et al. (2003).In the vertical, 21 sigma levels were used. Differences from the previous version werethe explicit inclusion of freshwater input from sea surface and rivers and the addition of10
tidal forcing (M2, S2, K1 and O1 tides) along the lateral boundary (Wang et al., 2008).The biological module is based on the biological part of NORWECOM (Skogen and
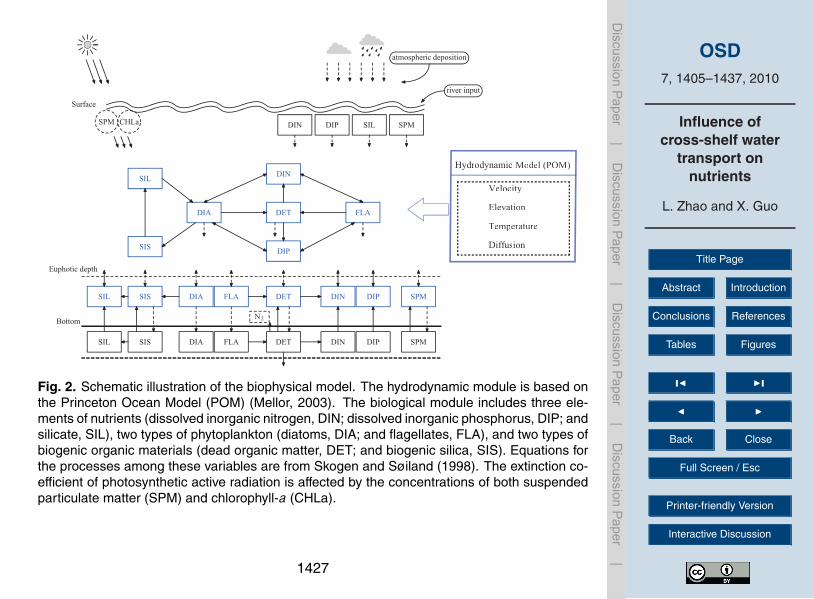
Søiland, 1998) and reconstructed for the ECS. The model components include threeelements of nutrients (dissolved inorganic nitrogen, DIN; dissolved inorganic phospho-rus, DIP; and silicate, SIL), two types of phytoplankton (diatoms, DIA; and flagellates,15
FLA), and two types of biogenic organic material (dead organic matter, DET; and bio-genic silica, SIS). A schematic diagram showing relationships among these compo-nents is presented in Fig. 2.
The biological module treats the water column and benthic layer as two individualparts. Biological processes in the water column include photosynthesis, respiration20
and mortality of phytoplankton, remineralization of detritus and the shading effects ofphytoplankton on underwater light. Because of the high turbidity in the ECS, con-centrations of suspended particulate matter (SPM) from satellite-based data (Wangand Jiang, 2008) were included in the biological module to determine the extinctioncoefficient of photosynthatic active radiation that is affected by the concentrations of25
both SPM and chlorophyll-a. Processes in the benthic layer are remineralization ofdetritus, sediment burial and denitrification. Sedimentation and resuspension throughthe sediment-water interface and the atmospheric dry and wet deposition of nutrients
through the air-sea interface are included in the biological module. The equations forthe biochemical processes follow those given by Skogen and Søiland (1998). Parame-ters used in the equations for biochemical processes were based on the values in theliterature (Moll, 1998; Skogen and Moll, 2000; Wei et al., 2004), but were adjusted bytrial and error.5
The model domain covers the Bohai Sea, Yellow Sea and ECS with the open bound-ary along southern and eastern boundaries (Fig. 1). With the objective of reproducingseasonal variation, the hydrodynamic module was driven by monthly forcing such asriver runoff, wind stress, heat flux, evaporation and precipitation rates, ocean and tidalcurrents, as described by Wang et al. (2008). The biological module was also pre-10
scribed the same monthly conditions to reproduce spatial distributions of nutrients andchlorophyll-a and their seasonal variations.
Calculation was started with an initial condition in winter and was spun up for twoyears; model results in the third year were analyzed. The initial and open boundaryconditions for three elements of nutrients are from World Ocean Atlas 2005 (WOA2005)15
(Garcia et al., 2006a; 2006b) and Marine Atlas of Bohai Sea, Yellow Sea, East ChinaSea, Chemistry (Wang, 1991), and monthly SPM concentrations were from SeaWiFS-derived data (Wang and Jiang, 2008). Runoff from ten major rivers (Fig. 1) were fromthe Marine Atlas of Bohai Sea, Yellow Sea, East China Sea, Hydrology (Chen, 1992).The concentrations of nutrients in rivers and those for atmospheric dry and wet deposi-20
tion of nutrients were obtained from published data (Zhang, 1996; Liu et al., 2009; Wanet al., 2002; Zhang et al., 2007a). Solar radiation was calculated by the model givenby Dobson and Smith (1988) and cloud cover data was from NCEP/NCAR reanalysis(Kalnay et al., 1996). The validation data of nutrients and chlorophyll-a were from theJapan Meteorological Agency (JMA) monitoring data along the PN line (see Fig. 1 for25
3.1 Temporal and spatial variations of chlorophyll-a and nutrients
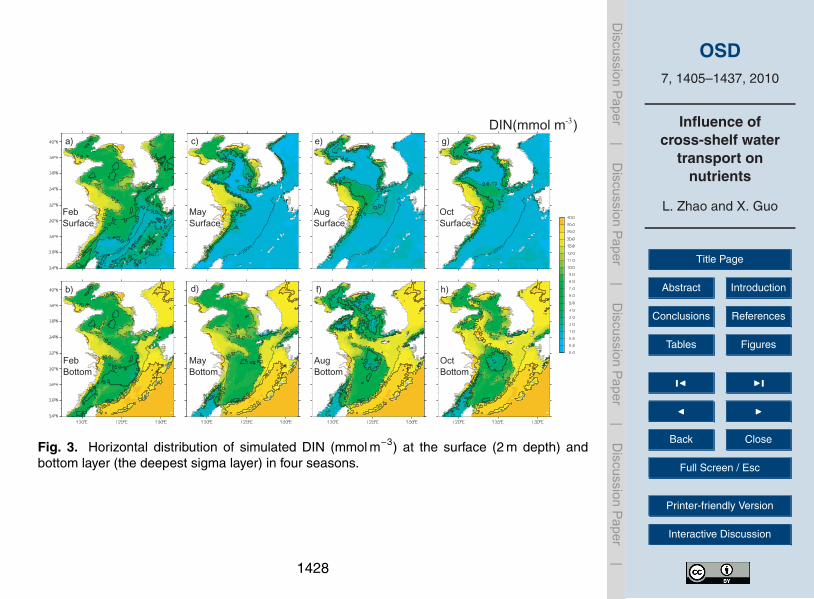
For a direct comparison with the observations (Chen, 2009), we selected DIN as anexample of simulated nutrients and presented its horizontal distribution in the surfaceand bottom layers for four seasons (Fig. 3). The corresponding observations can be5
found in Chen (2009).In winter, the surface DIN concentration was high along the western coast of the
ECS and eastern coast of the Yellow Sea, but was low in the central Yellow Sea andthe northwestern coast of the Yellow Sea (Fig. 3a). The lowest DIN concentrationswere found along and out of the shelf break where there is the occurrence of nutrient-10
poor Kuroshio surface water. Because of tidal mixing and strong wind stirring in wintermonths, the DIN in the bottom layer of the Yellow Sea and the inner shelf of ECS(Fig. 3b) displayed a similar distribution to that observed in the surface layer (Fig. 3a).However, in the bottom layer of the middle and outer shelves, the DIN concentrationwas higher than that of the surface layer. Apparently, the onshore transport of nutrient-15
rich Kuroshio subsurface water across the shelf break contributed to this distribution.High nutrients northeast of Taiwan and west of Kyushu in the bottom layer were con-sistent with the spatial distribution of Kuroshio onshore transport along the shelf breakin the ECS (Guo et al., 2006).
In spring, surface DIN concentrations are similar to levels observed in winter along20
western coast of the ECS, but decreases sharply in the central Yellow Sea and frommiddle shelf to outer shelf of the ECS (Fig. 3c). In the bottom layer (Fig. 3d), the DINconcentration decreased markedly in the Taiwan Strait but increased from north Taiwanto the middle shelf south of 30◦ N; bottom DIN also increased in the central Yellow Sea.The decrease in surface nutrients is easily related to the intensification of biological25
activity and the reduction of nutrients supply from the lower layer to the upper layer inspring. With increasing of solar radiation and weakening of winds from winter to spring,stratification in the ECS and Yellow Sea has formed by May. Thermal stratification
reduces upward transportation of nutrients from the bottom layer to the surface layer.At the same time, the dissolved nutrients released by the remineralization of sinkingparticulate organic matter in the bottom layer were kept there, inducing an increasein DIN. In addition, the intensification of Kuroshio subsurface water intrusion in springmay also influence the increase of DIN in the bottom layer over the middle and outer5
shelves (Jacobs et al., 2000).In summer, a significant change in the surface layer is the dispersal of nutrient-poor
water (DIN<1 mmol m−3) from the central area to coastal areas in the Yellow Sea, andthe offshore spreading of nutrient-rich water (DIN>1 mmolm−3) from the Changjiangestuary toward Jeju Island in the ECS (Fig. 3e). The reduction of surface nutrients in10
the Yellow Sea can be easily explained by the intensification of stratification in sum-mer, while the mechanism of long distance offshore transport of nutrients from theChangjiang estuary has been given by Isobe and Matsuno (2008). In the bottom layer,nutrients increased in the northern shelf of the ECS (southwest of Jeju Island) but de-creased in the offshore area of Changjiang estuary and the northern part of the Yellow15
Sea (Fig. 3e,f).In autumn, the concentration of surface DIN was low in the central Yellow Sea and
over the middle and outer shelves of the ECS, with increased levels in the western andeastern coasts of the Yellow Sea (Fig. 3g). In the bottom layer (Fig. 3h) nutrient-richwater was found from the central Yellow Sea to the northern shelf of the ECS, and20
farther to the shelf break, indicating a possible route of nutrient supply from Kuroshiosubsurface water.
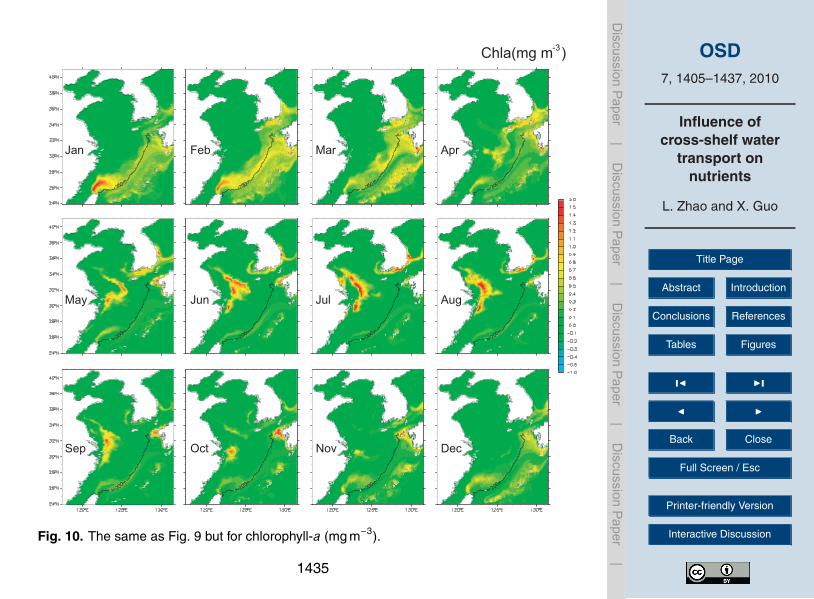
In general, not only nutrients but also light intensity, water temperature and strati-fication controlled phytoplankton growth in the surface water. With increasing surfacetemperatures in spring, the water column becomes stable and high surface chlorophyll-25
a initially appears in the central region of Yellow Sea during April (Fig. 4). From Aprilto September, the high surface chlorophyll-a area moved gradually to coastal waters ofthe Yellow Sea. Meanwhile, a band of high surface chlorophyll-a was maintained fromthe western Yellow Sea to the offshore region of the Changjiang estuary. In autumn
(e.g., October) slightly higher chlorophyll-a values were found again in the central re-gion of the Yellow Sea. In the area from the Changjiang estuary to the ECS shelf break,a high surface chlorophyll-a area appeared firstly at the outer shelf (northeast of Tai-wan) in winter (e.g., January), then gradually moved to the inner shelf from spring tosummer, and remained offshore of the Changjiang estuary in autumn (e.g., October).5
The Changjiang River provides not only nutrients but also suspended sediments to theECS. The reason for relatively low chlorophyll-a levels in close proximity to the estu-ary is due to high turbidity caused by the amount of suspended sediments from theChangjiang River, significantly weakening subsurface light intensity.
3.2 Vertical distribution of chlorophyll-a and nutrients along a transect across10
the shelf break
There is an established transect in the ECS, called the PN line, where hydrographicsurveys have continued for more than 40 years by JMA. Usually, the survey is carriedout four times a year, with each survey corresponding to one season. Here we firstdescribe the common features of nutrients and chlorophyll-a in the observations and15
model results (Figs. 5 and 6), then address the possible causes for the differences be-tween the observations and model results. The observations are from nutrients (repre-sented by DIN) and chlorophyll-a averaged in each season from 1965 to 2004, whereasthe model results are the same variables but with monthly means from February, May,August and October, representing winter, spring, summer and autumn, respectively.20
In winter, both nutrients and chlorophyll-a were vertically homogenous over the shelfdue to intensive mixing. Nutrients were higher in the inshore side compared to theoffshore side in the upper layer (water depth <100 m). The highest nutrients werefound in the lower layer (water depth >100 m) from the shelf break to the open ocean,and are expected to be an important source of nutrients to the upper layer and middle25
shelf. Chlorophyll-a was high in the surface layer from the shelf break to the openocean.
In spring, nutrients in the surface layer were quickly depleted with advent of phyto-plankton growth. This occurred from the inshore side of the shelf to the shelf break,with the maximum chlorophyll-a occurring in the surface layer or shallow subsurfacelayer. With changes in phytoplankton production, the euphotic zone becomes shal-lower from the inshore side of the shelf to the shelf break, but becomes deep farther5
offshore. In the bottom layer, nutrient-rich water can be identified from the inshore sideof the shelf to the shelf break. From the depth of the euphotic zone and distribution ofnutrients, it can be deduced that the nutrient-rich bottom water largely contributes tophytoplankton growth.
In summer, the concentration of surface nutrients decreases and becomes a limiting10
factor on the growth of phytoplankton. With a decrease in surface phytoplankton, theeuphotic zoon is deepened and phytoplankton can utilize nutrients in the deeper layer.Consequently, the subsurface chlorophyll-a maximum over the shelf appears deeper insummer than in spring and the concentration of nutrients in the bottom layer decreasesslightly.15
In autumn, the concentration of surface nutrients recovers slightly due to the inten-sification of surface mixing. Chlorophyll-a still has a large concentration in the middlelayer, indicating a persistent contribution of nutrient-rich bottom water to primary pro-duction from spring to autumn.
Although we can confirm the above features from both observations and model re-20
sults, differences were also apparent. For example, the high chlorophyll-a observedon the inshore side of the shelf in winter and autumn was not reproduced by themodel. The high chlorophyll-a at the open ocean side was always found in modelresults but could not be confirmed in the model results. In addition, the concentrationof chlorophyll-a in the subsurface layer over the shelf in summer and the concentra-25
tion of nutrients below the subsurface layer from the shelf break to the open oceanside were generally higher in the model results than in the observations. These fun-damental differences may have been caused by either incomplete observational dataspecified along the open boundary or incomplete structure of our biological module.
Improvement of the former depends on the extent of data collection east of Taiwanand within the Taiwan Strait, while the latter can be addressed by adding biologicalcomponents such as zooplanktons, or by including additional processes such as mi-crobial loop. Nevertheless, a continuous effort on improving the model performance isnecessary in the future.5
3.3 Seasonal and spatial variations in onshore fluxes of nutrients across theshelf break
Using flow velocity and nutrients concentration in the model results, we can calculatethe onshore flux of water and nutrients across the shelf break of the ECS (Fig. 7),defined as the 200 m-isobath (Fig. 1) following Guo et al. (2006). Since it is the main10
stream of the Kuroshio that flows along the shelf break, flux across the shelf break inthe ECS is also referred as the Kuroshio onshore flux. Because of this, our calculationscan be compared to the nutrient flux from the Kuroshio water mass to the shelf of theECS, previously estimated by Chen and Wang (1999) and Zhang et al. (2007b) whoused a box model for the shelf of the ECS.15
The volume of Kuroshio onshore flux displayed significant seasonal variation (Fig. 7),reaching a minimum of ∼0.5 Sv (1 Sv=106 m3 s−1) in June and a maximum of ∼3 Svin November. The annual mean volume of Kuroshio onshore flux was estimated tobe 1.53 Sv with a standard deviation of 0.97 Sv. All are consistent with the resultscalculated by a previous version of the hydrodynamic module (Guo et al., 2006), in20
which the tidal currents were excluded and river discharge was not explicitly included.The Kuroshio onshore flux of DIN and DIP followed the seasonal variation in vol-
ume flux however there was a little difference. Both DIN and DIP reached a minimumin March, not in June when minimum volume flux occurs. Afterward, both increasegradually until November when they reached maximums of ∼16.0 kmol s−1 for DIN and25
∼1.1 kmol s−1 for DIP; this was the same as the volume flux. The Kuroshio onshoreflux of silicate showed different seasonal variation from those of volume, DIN and DIP.Silicate displayed a minimum in March as seen with DIN and DIP, however thereafter
it increased erratically. Before November when silicate reaches its maximum, we ob-served three peaks in the Kuroshio onshore flux of silicate.
The seasonal variations in Kuroshio onshore flux of DIN, DIP and silicate presentedFig. 7 is essentially consistent with those estimated by Zhang et al. (2007b) whoshowed a double input of DIN and DIP and a triple input of silicate from the Kuroshio5
to the shelf from summer to winter. The annual mean of Kuroshio onshore flux was9.4 kmol s−1 for DIN, 0.7 kmol s−1 for DIP, and 18.2 kmol s−1 for silicate; the standard de-viation was 4.6 kmol s−1 for DIN, 0.4 kmol s−1 for DIP, and 12.0 kmol s−1 for silicate. Theannual means given here are at the same order as those estimated by the box mod-els of 10.7 kmol s−1 for DIN, and 0.34 kmol s−1 for DIP from Chen and Wang (1999);10
9.7 kmol s−1 for DIN, 0.65 kmol s−1 for DIP, 14.95 kmol s−1 for silicate from Zhang etal. (2007b).
In addition to quantifying total flux across the shelf break, the model results can alsoprovide a spatial measure of the Kuroshio onshore flux of volume and nutrients alongthe shelf break (Fig. 8). There were two areas where positive onshore flux was concen-15
trated. One was northeast of Taiwan where the Kuroshio bumps against the shelf breakand induces a large onshore flux of water volume and nutrients. The integration of theKuroshio onshore flux northeast of Taiwan (from point 1 to point 6 in Fig. 8) gave valuesof 5.8 Sv for volume, 21.1 kmol s−1 for DIN, 1.8 kmol s−1 for DIP and 48.3 kmol s−1 forsilicate. The other was located southwest of Kyushu where the Kuroshio veers toward20
Tokara Strait and induces a large onshore flux of water volume and nutrients. The in-tegration from this area (from point 22 to point 32 in Fig. 8) gave values of 0.5 Sv forvolume, 7.8 kmol s−1 for DIN, 0.6 kmol s−1 for DIP and 18.7 kmols−1 for silicate. Alongthe shelf break between them, Kuroshio onshore flux of water volume and nutrientswere generally negative, indicating an offshore transport of water and nutrients. Inte-25
gration along the 200 m isobath from ∼26◦ N to ∼29◦ N (point 7 to point 21 in Fig. 8)gave values of −4.7 Sv for volume, −19.7 kmol s−1 for DIN, −1.6 kmol s−1 for DIP and−48.9 kmol s−1 for silicate.
4 Sensitivity experiments on the enrichment of oceanic nutrients
Although we obtained a positive onshore flux of oceanic nutrients across the shelfbreak, we still do not know whether these nutrients are involved in photosynthesisover the ECS shelf. As presented in Guo et al. (2006), half of the water through theTsushima Strait is from the Kuroshio in summer and this ratio increases to 80% in5
winter. Therefore, it is possible that all the oceanic nutrients across the shelf break justflows toward the Tsushima Strait and maybe have no opportunity to contribute to theprimary production over the ECS shelf.
Direct evaluation on how much the nutrients from the Kuroshio area contribute to theprimary production over the ECS shelf needs to isolate the oceanic nutrients from the10
nutrients with other sources. This isolation is usually problematic in a nonlinear marineecosystem. Instead of isolation, we applied sensitivity experiments, in which we arti-ficially changed the nutrients concentration of the Kuroshio water specified along thelateral boundary of the model and consequently changed the supply of oceanic nutri-ents across the shelf break from the Kuroshio. The difference in the results between15
the sensitivity experiments and the simulation presented in Sect. 3 (hereafter referredas the control experiment) is caused only by the change in the supply of oceanic nu-trients across the shelf break and therefore can give us some insight as to the role ofoceanic nutrients in lower trophic level dynamics of the ECS ecosystem.
We carried out four sensitivity experiments, in which only the concentrations of nutri-20
ents (DIN, DIP and silicate) from sea surface to the bottom along the southern bound-ary (from Taiwan to 124◦ E) where Kuroshio water occupies were multiplied by a con-stant of 1.1, 1.2, 1.3 and 1.4. The other boundary conditions and initial conditions aswell as model integration schedule were the same as those in the control experiment.As a result, the onshore flux of volume across shelf break was the same between25
the sensitivity experiments and the control experiment, with onshore flux of nutrientsartificially increased in the sensitivity experiments.
4.1 Changes in surface nutrients and chlorophyll-a over the shelf of the ECS
The additional oceanic nutrients (e.g. DIN) in the surface layer appeared mostly off-shore of the Changjiang estuary (Fig. 9). In summer (June–August), the positiveanomaly of DIN concentration (sensitivity experiment – control experiment) was foundalong the coastal area from 29◦ N to 34◦ N, in which the offshore DIN anomaly was5
negative. After September, the area with a positive anomaly of DIN concentration wasenlarged and extended to the Jeju Strait (the channel between Jeju Island and south-ern coast of Korea) and farther to the Tsushima Strait in winter (December–February).After March, the DIN positive anomaly gradually retreats to the coastal area. Althoughnot as apparent as offshore the Changjiang estuary, the additional oceanic nutrients10
could also be identified over the middle and outer shelves in winter.The response of chlorophyll-a in the surface layer to additional oceanic nutrients
in winter appeared in the pathway of the Kuroshio, in particular northeast of Taiwanwhere a local maximum in the anomaly of chlorophyll-a between the sensitivity andcontrol experiment can be identified (Fig. 10). The additional oceanic nutrients do not15
produce additional chlorophyll-a over the shelf in winter, which can be understood fromthe low chlorophyll-a levels over the shelf in the control experiment (Fig. 4). Apparently,primary production over the shelf in winter is not nutrient limited.
From May to September, the positive anomaly of chlorophyll-a in the surfacelayer caused by additional oceanic nutrients appeared in the offshore region of the20
Changjiang estuary. A part of the area with a positive anomaly of chlorophyll-a (Fig. 10)corresponded to the area with a negative anomaly of DIN in the inner shelf, offshorethe Changjiang estuary (Fig. 9). This feature was caused by different ratios of DIN toDIP in the Changjiang River water and in the Kuroshio water and will be discussed inmore detail in Sect. 4.3.25
4.2 Changes in subsurface nutrients and chlorophyll-a across the shelf of theECS
The increment of oceanic nutrients applied to the sensitivity experiments dependedon the original concentration in the control experiment, and therefore was small in thesurface layer and large in the subsurface and bottom layer. From January to March, the5
contours of additional oceanic DIN concentration were horizontally distributed alongthe PN section (Fig. 11), indicating a small supply of oceanic nutrients across theshelf break in winter. From April to June, the contours of 1 mmol m−3 and 2 mmol m−3
of additional DIN concentration moved from the shelf break to the middle and innershelf (Fig. 11), suggesting the intrusion of Kuroshio subsurface water onto the bottom10
layer over the shelf. From July to October, the high concentration of additional oceanicDIN as represented by the contour of 2 mmol m−3 (Fig. 11) was maintained at thebottom layer over the shelf. This high concentration of additional oceanic DIN shows anonshore movement in November but retreats to the shelf break in December (Fig. 11).According to the fact that the supply of oceanic nutrients to the middle and inner shelves15
weakens in winter, the high concentration of additional oceanic nutrients offshore theChangjiang estuary from November to next April (Fig. 9) are those that have intrudedin spring or summer.
The additional oceanic nutrients cause an increase in chlorophyll-a in the surfacelayer in cold months (November to next March) and in the subsurface in warm months20
(June to October) (Fig. 12). April and May appears to be a transition period when the in-crease in chlorophyll-a moves from the surface to subsurface layer. By observing shiftsin euphotic depth in Fig. 11, we can infer the consumption of additional oceanic nutri-ents in the subsurface layer. Therefore, the stable concentration of additional oceanicDIN at the bottom layer over the shelf from June to October (Fig. 11) reflects a bal-25
ance between consumption and supply of oceanic nutrients. With the same idea, anincrease in additional oceanic DIN at the bottom layer over the shelf in November
(Fig. 11) can be caused by either a reduction in phytoplankton growth (Fig. 12) or anincreased supply of oceanic nutrients, or both.
4.3 Changes in nutrients flux across the shelf break and the influence ofelement ratio of oceanic nutrients on the consumption of nutrients over theshelf5
With an increase in the concentration of oceanic nutrients in the sensitivity experiments,the onshore flux of DIN, DIP and silicate across the 200 m-isobath generally increasedin the same ratio (Table 1). This is a natural result since the onshore flux of volume doesnot change in all of these calculations. However, there is also an apparent differencein the increased ratio of three elements of nutrients. The increased ratio of silicate was10
highest, while that of DIN was lowest. Such differences are probably related to thedifferent elemental ratio of nutrients in the water pre-existing over the shelf that wastransported in an offshore direction across the shelf break, and in the oceanic waterthat was transported in an onshore direction.
The ratio of DIN to DIP in total onshore flux of nutrients in the control experiment15
was 13 (=9.36/0.72 in Table 1), which is less than the Redfield ratio of 16 used inthe model calculation; the average ratio of DIN to silicate is ∼0.5, which is also lessthan the ratio of 16:15 used in the model calculation; the average ratio of silicate toDIP was 25, which is higher than the ratio of 15 used in model the calculation. Asshown in Fig. 11, the additional oceanic nutrients can reach the offshore area of the20
Changjiang estuary, where nutrient limitation has been reported to be DIP based onthe observed atomic ratio of DIN, DIP and silicate (Liu et al., 2003). In our simulation,the average ratio of DIN to DIP in Changjiang River water was 59, the average ratio ofDIN to silicate 0.35, and the average ratio of silicate to DIP was 166. Consequently,nutrient limitation in our simulation was also dependent on DIP for the Changjiang di-25
luted water that spreads offshore the Changjiang estuary in summer. This is why weobtained a negative anomaly in that region for DIN, between the control experimentand sensitivity experiments (Fig. 9). Therefore, the supply of oceanic nutrients to the
shelf contributed to phytoplankton growth not only by themselves but also by their el-ement ratio, because the low ratio of DIN to DIP in the Kuroshio water promotes theconsumption of DIN in the pre-existing shelf water.
5 Conclusions
By combining a low trophic level ecosystem model with a hydrodynamic model, we5
were able to reproduce general features of spatial and temporal variations in nutri-ents and chlorophyll-a in the Yellow Sea and ECS. Horizontally, the area with highchlorophyll-a first appeared in the central Yellow Sea in spring, and then it moved to-ward coastal zones in summer; in the ECS, the area with high chlorophyll-a first ap-peard northeast of Taiwan, i.e., at the outer shelf and shelf break in winter, and then10
gradually moved toward the middle and inner shelves in summer and autumn. Ver-tically, high chlorophyll-a appeared in the surface in spring at the middle and outershelves and in the subsurface in summer and autumn, corresponding to changes inlight intensity and nutrients.
The onshore flux of volume and nutrients across the shelf break, calculated from15
model results, have noticeable seasonal variations. The flux of onshore volumereaches a minimum in June and a maximum in November, while the flux of nutrientsreach a minimum in March and a maximum in November. The annual average onshoreflux was estimated as 1.53 Sv for volume, 9.4 kmol s−1 for DIN, 0.7 kmol s−1 for DIP, and18.2 kmol s−1 for silicate. Along the shelf break of the ECS, areas northeast of Taiwan20
and southwest of Kyushu supply onshore flux of volume and nutrients, whereas themiddle shelf break between them provides offshore flux of volume and nutrients.
By artificially increasing the concentration of oceanic nutrients in the Kuroshio water,we confirmed the contribution of oceanic nutrients to primary production over the shelfof the ECS. The additional oceanic nutrients distributed into the bottom layer from the25
shelf break to the offshore region of the Changjiang estuary from spring to summer, andappeared in the surface layer mainly from autumn to winter. The contribution of oceanic
nutrients to primary production over the shelf can be found not only in the surface layer(mainly at the outer shelf and shelf break in winter and in the region outside the turbidityzone of the Changjiang estuary in summer) but also in the subsurface layer over theshelf from spring to autumn.
Since the ratio of three elements of nutrients in the Kuroshio water was different5
from that in the pre-existing shelf water, in particular from the Changjiang plume, thecontribution of oceanic nutrients to photosynthesis over the shelf promoted the con-sumption of residual DIN in that area. In this sense, it can be concluded that the supplyof oceanic nutrients to the shelf of the ECS contributes to phytoplankton growth notonly in itself but also by its element ratio.10
Acknowledgements. The authors thank Jing Zhang at East China Normal University for thediscussions on model results, Todd Miller at Ehime University for his help on English correction.Liang Zhao was supported by the National Science Foundation of China (No. 40806001 and40830854), National Basic Research Program of China (973 Program 2010CB428904) andGlobal COE Program from the Japanese Ministry of Education, Culture, Sports, Science and15
Technology. Xinyu Guo was supported by Global COE Program from the Japanese Ministry ofEducation, Culture, Sports, Science and Technology and JSPS KAKENHI (21310012).
References
Blumberg, A. F. and Mellor, G. L.: A description of a three dimensional coastal ocean circulationmodel, in: Three-Dimensional Coastal Ocean Models, Coastal and Estuarine Series, No. 4,20
edited by: Heaps, N., Am. Geophys. Union, 1–16, 1987.Chen, C. T. A.: Chemical and physical fronts in the Bohai, Yellow and East China Seas, J. Mar.
Syst., 78(3), 394–410, 2009.Chen, C. T. A. and Wang, S. L.: Carbon, alkalinity and nutrient budgets on the East China Sea
continental shelf, J. Geophys. Res., 104(C9), 20675–20686, 1999.25
Chen, D. X.: Marine Atlas of Bohai Sea, Yellow Sea, East China Sea, Hydrology, edited by:Chen, G. Z., China Ocean Press, Beijing, 530 pp., 1992.
Dobson, F. W. and Smith, S. D.: Bulk models of solar radiation at sea, Q. J. Roy. Meteor. Soc.,114, 165–182, 1998.
Garcia, H. E., Locarnini, R. A., Boyer, T. P., and Antonov, J. I.: World Ocean Atlas 2005, Dis-solved Oxygen, Apparent Oxygen Utilization, and Oxygen Saturation, vol. 3, edited by: Lev-itus, S., NOAA Atlas NESDIS 63, US Government Printing Office, Washington, DC, 342 pp.,2006.
Garcia, H. E., Locarnini, R. A., Boyer, T. P., and Antonov, J. I.: World Ocean Atlas 2005, Nutri-5
Guo, X., Hukuda, H., Miyazawa, Y., and Yamagata, T.: A triply nested ocean model for simulat-ing the Kuroshio-roles of horizontal resolution on JEBAR, J. Phys. Oceanogr., 33, 146–169,2003.10
Guo, X., Miyazawa, Y., and Yamagata, T.: The Kuroshio onshore intrusion along the shelf breakof the East China Sea: the origin of the Tsushima Warm Current, J. Phys. Oceanogr., 36,2205–2231, 2006.
Isobe, A.: Recent advances in ocean circulation research on the Yellow Sea and East ChinaSea shelves, J. Oceanogr., 64, 569–584, 2008.15
Isobe, A. and Matsuno, T.: Long-distance nutrient-transport process in the Changjiangriver plume on the East China Sea shelf in summer, J. Geophys. Res., 113, C04006,doi:10.1029/2007JC004248, 2008.
Jacobs, G. A., Hur, H. B., and Riedlinger, S. K.: Yellow and East China Seas response to windsand currents, J. Geophys. Res., 105, 21947–21968, 2000.20
Kalnay, E., Kanamitsu, M., Kistler, R., and Collins, W.: The NCEP/NCAR 40-year reanalysisproject, B. Am. Meteorol. Soc., 77(3), 437–471, 1996.
Liu, S. M., Zhang, J., Chen, H. T., Wu, Y., Xiong, Y., and Zhang, Z. F.: Nutrients in theChangjiang and its tributaries, Biogeochemistry, 62(1), 1–18, 2003.
Liu, S. M., Hong, G.-H., Zhang, J., Ye, X. W., and Jiang, X. L.: Nutrient budgets for large25
Chinese estuaries, Biogeosciences, 6, 2245–2263, doi:10.5194/bg-6-2245-2009, 2009.Mellor, G. L.: Users guide for a three-dimensional, primitive equation, numerical ocean model,
Program in Atmospheric and Oceanic Sciences, Princeton University, 53 pp., 2003.Moll, A.: Regional distribution of primary production in the North Sea simulated by a three-
dimensional model, J. Mar. Syst., 16(1–2), 151–170, 1998.30
Skogen, M. D. and Søiland, H.: A User’s guide to NORWECOM v2.0, in: The NORWegianEcological Model system, Bergen, Institute of Marine Research, 42. Technical Report Fiskenog Havet 18/98, 1998.
Skogen, M. D. and Moll, A.: Interannual variability of the North Sea primary production: com-parison from two model studies, Cont. Shelf Res., 20(2), 129–151, 2000.
Wan, X. F., Wu, Z. F., Chang, Z. Q., and Zhang, X. L.: Reanalysis of atmospheric flux ofnutrients to the South Yellow Sea and the East China Sea, Mar. Environ. Sci., 21(4), 14–18,2002.5
Wang, B. D., Wang, X. L., and Zhang, R.: Nutrient conditions in the Yellow Sea and the EastChina Sea, Estuarine, Coast. Shelf Sci., 58, 127–136, 2003.
Wang, Q., Guo, X. Y., and Takeoka, H.: Seasonal variations of the Yellow River plume in theBohai Sea: a model study, J. Geophys. Res., 113, C08046, doi:10.1029/2007JC004555,2008.10
Wang, W. J. and Jiang, W. S.: Study on the Seasonal Variation of the Suspended SedimentDistribution and Transportation in the East China Seas Based on SeaWiFS Data, Journal ofOcean University of China (Oceanic and Coastal Sea Research), 7(4), 385–392, 2008.
Wang, Y. H.: Marine Atlas of Boshi Sea, Yellow Sea, East China Sea, Chemistry, edited by:Chen, G. Z., China Ocean Press, Beijing, 257 pp., 1991.15
Wei, H., Sun, J., Moll, A., and Zhao, L.: Phytoplankton dynamics in the Bohai Sea-observationsand modeling, J. Mar. Syst., 44, 233–251, 2004.
Zhang, G. S., Zhang, J., and Liu, S. M.: Characterization of nutrients in the atmospheric wetand dry deposition observed at the two monitoring sites over Yellow Sea and East ChinaSea, J. Atmos. Chem., 57, 41–57, 2007a.20
Zhang, J., Liu, S. M., Ren, J. L., Wu, Y., and Zhang, G. L.: Nutrient gradients from the eutrophicChangjiang (Yangtze River) Estuary to the oligotrophic Kuroshio waters and re-evaluation ofbudgets for the East China Sea Shelf, Prog. Oceanogr., 74, 449–478, 2007b.
Zhang, J.: Nutrient elements in large Chinese estuaries, Cont. Shelf Res., 16(8), 1023–1045,1996.25
Table 1. Annual onshore fluxes of nutrients across 200 m isobath in control experiment and foursensitivity experiments. The positive flux is defined as onshore direction and the unit is kmol s−1.“ctl” denotes control experiment while “+10%”–“+40%” denote the sensitivity experiments inwhich the concentration of oceanic nutrients in the Kuroshio water was artificially increased by10%–40%, respectively. The values in brackets denote ratios of increased fluxes in sensitivityexperiments to the initial flux in control experiment.
Fig. 1. Model domain and bathymetry. Contours with numbers are isobaths in meters. The200 m-isobath along the shelf break is overlapped by a line with dots and numbers, acrosswhich the fluxes of volume and nutrients are calculated and presented in Figs. 7 and 8.
Fig. 2. Schematic illustration of the biophysical model. The hydrodynamic module is based onthe Princeton Ocean Model (POM) (Mellor, 2003). The biological module includes three ele-ments of nutrients (dissolved inorganic nitrogen, DIN; dissolved inorganic phosphorus, DIP; andsilicate, SIL), two types of phytoplankton (diatoms, DIA; and flagellates, FLA), and two types ofbiogenic organic materials (dead organic matter, DET; and biogenic silica, SIS). Equations forthe processes among these variables are from Skogen and Søiland (1998). The extinction co-efficient of photosynthetic active radiation is affected by the concentrations of both suspendedparticulate matter (SPM) and chlorophyll-a (CHLa).
Fig. 5. Simulated (upper panels) and observed (lower panels) distributions of DIN (mmol m−3)along the PN line in four seasons. Dashed blue line in the upper panels denotes euphoticdepth.
Fig. 7. Monthly onshore flux of volume (Sv) and nutrients (kmol s−1) across the entire 200 m-isobath shown in Fig. 1. The positive direction of flux is toward the shelf of the ECS. Black solidline denotes volume, red solid line for DIN, black dashed line for DIP, and red dashed line forSIL.
Fig. 8. Spatial distribution along the 200 m-isobath of annual averaged onshore flux of volume(Sv) and nutrients (kmol s−1). The value at each point is the integrated flux between two pointsdenoted by dots along the 200 m-isobath in Fig. 1. The positive direction is toward the shelf ofthe ECS. Black solid line denotes volume, red solid line for DIN, black dashed line for DIP, andred dashed line for SIL.
Fig. 9. The anomaly of monthly DIN (mmol m−3) at the surface layer (2 m depth) between thesensitivity experiment, in which the oceanic nutrients were enriched by 30%, and the controlexperiment.
Fig. 11. The anomaly of monthly DIN (mmol m−3) along the PN line between the sensitivityexperiment, in which the oceanic nutrients are enriched by 30%, and the control experiment.Dashed blue line denotes euphotic depth.