Page 1
Coupled Systems Mechanics, Vol. 7, No. 2 (2018) 177-195
DOI: https://doi.org/10.12989/csm.2018.7.2.177 177
Copyright © 2018 Techno-Press, Ltd. http://www.techno-press.org/?journal=csm&subpage=8 ISSN: 2234-2184 (Print), 2234-2192 (Online)
Influence of ductility classes on seismic response of reinforced concrete structures
Željana Nikolić*, Nikolina Živaljića and Hrvoje Smoljanovićb
Faculty of Civil Engineering, University of Split, Architecture and Geodesy, Matice hrvatske 15, 21000 Split, Croatia
(Received June 29, 2017, Revised August 8, 2017, Accepted August 17, 2017)
Abstract. Reinforced concrete buildings in a seismically active area can be designed as DCM (medium
ductility) or DCH (high ductility) class according to the regulations of Eurocode 8. In this paper, two RC
buildings, one with a wall structural system and the other with a frame system, previously designed for
DCM and DCH ductility, were analysed by using incremental dynamic analysis in order to study differences
in the behaviour of structures between these ductility classes, especially the failure mechanism and ultimate
collapse acceleration. Despite the fact that a higher behaviour factor of DCH structures influences lower
seismic resistance, in comparison to DCM structures, a strict application of the design and detailing rules of
Eurocode 8 in analysed examples caused that the seismic resistance of both frames does not significantly
differ. The conclusions were derived for two buildings and do not necessarily apply to other RC structures.
Further analysis could make a valuable contribution to the analysis of the behaviour of such buildings and
decide between two ductility classes in everyday building design.
Keywords: ductility classes; Eurocode 8; incremental dynamic analysis; reinforced concrete buildings
1. Introduction
One of the most convenient ways in the design of earthquake resistant structures is determining
the seismic effects on the basis of modal response spectrum analysis using linear-elastic behaviour
of the structures. The capacity of the structure to dissipate energy is ensured through the
application of design spectrum, which represents the elastic response spectrum of ground
acceleration reduced by behaviour factor q. This factor is equal for the whole group of structures
and gives a rough estimation of its real behaviour. The European standard for earthquake
resistance design of the structures (Eurocode 8 2005, further referred to as EC8) allows the design
of reinforced concrete buildings (RC buildings) by choosing between two ductility classes with
different value of behaviour factor, DCM (medium ductility) and DCH (high ductility), depending
on their hysteretic dissipation capacity. In order to provide the appropriate amount of ductility,
Corresponding author, Professor, E-mail: [email protected] aAssistant Professor, E-mail: [email protected] bAssistant Professor, E-mail: [email protected]
Page 2
Željana Nikolić, Nikolina Živaljić and Hrvoje Smoljanović
specific provisions for all structural elements ought to be met in each class. Due to the requirement
of a higher behaviour factor, DCH structures are designed for lower lateral strength, but have
stringent rules for detailing and strength assessment. Design and detailing rules required for DCM
structures are less demanding than for DCH. Therefore, DCH has been little used, and some of its
detailing provisions are found hard to achieve in practice (Boot 2014).
Two ductility classes prescribed by EC8 are suggested to predefine the behaviour of structures,
leading to different responses. However, the behaviour of the structure cannot be fully
predetermined due to many factors that play a key role in such a problem. Specifically, the
diversity of the nature of earthquake can produce significant differences in structural behaviour
with respect to the same ductility class. Furthermore, each of the ductility classes implies
completely different perspective regarding the design of the building. Hence, one needs to make a
judicious choice between the two classes balancing between the desired response of the structure,
costs and complexity of design and construction.
Powerful numerical models stand as significant tools for obtaining more insight into the
particularities of each structure. Moreover, the overall analyses of couple of characteristic
earthquakes in terms of DCM and DCH classes of a certain structure can give us a more elaborate
answer to this question. The model of this kind should be able to produce highly non-linear effects
for realistic description of the structural behaviour under the cyclic loading until the collapse,
especially opening and closing of the cracks in concrete, slip of the reinforcing bar due to a high
plastic deformation under reversed cyclic loading, as well as yielding and failure of the
reinforcement. Incorporating these phenomena in a satisfactory manner ensures realistic modelling
of energy dissipation capacity and response of the structure during seismic loading.
Modelling of opening and closing of the cracks caused by cyclic excitation is crucial for
realistic modelling of energy dissipation in RC structures and their non-linear dynamic response
due to earthquakes. Available non-linear numerical models for time-dependent analysis of RC
structures under seismic loading are mostly based on finite element method and smeared crack
approach, where the cracked material is represented as a continuum, and local displacement
discontinuities are smeared over some tributary areas. A combination of this approach with
classical plasticity or damage models can give a relatively good approximation of the global
structural response with low computational cost. However, more accurate computation of energy
dissipation caused by concrete cracking under the extreme earthquake’s excitation can be obtained
with discrete crack approach.
The classical modelling approach of discrete cracks in quasi-brittle materials was performed
through the framework of finite element method by using cohesive elements across element edges
(Ortiz and Pandolfi 1999) or by considering adaptive refinement techniques (Ortiz and Quigley
1991). The other possibility is discontinuum-based modelling where discontinuum state of the
structure is assumed a priori, leading to discrete element method (DEM) (D’Addetta et al. 1999)
with different variations of connections between discrete elements presented through lattice
discrete models (Schlangen and Garboczi 1997, Cusatis et al. 2006, Nikolic et al. 2017a) and rigid
body spring models (Yamamoto et al. 2014). In the last two decades, an increasing number of
models attempted to combine the advantages of continuum and discontinuum-based modelling
(Ghaboussi 1997, Pearce et al. 2000, Munjiza 2004) where the cracking was considered along the
finite element edges. Some approaches are based on the modelling of the discontinuity inside the
finite elements through the finite element method with embedded strong discontinuities (ED-FEM
method) (Simo et al. 1993, Armero and Garikipati 1996, Armero and Linder 2009, Ibrahimbegovic
et al. 2010, Nam Do et al. 2015a, Nam Do et al. 2015b), extended finite elements (X-FEM
178
Page 3
Influence of ductility classes on seismic response of reinforced concrete structures
method) (Moes et al. 1999, Wells et al. 2002, Rethore et al. 2005) or lattice discrete models with
strong discontinuity (Nikolic et al. 2015, Nikolic and Ibrahimbegovic 2015, Nikolic et al. 2016).
Microplane model based on the monitoring of stresses in predefined directions, which is similar to
discrete models, was also applied in predicting the fracture phenomena (Bažant et al. 2000, Ožbolt
et al. 2001).
The intention of this paper is to give more insight into the failure of RC buildings due to
earthquake excitation. Hence, we provide the simulations from two different modelling
approaches, namely one based on finite discrete methodology (Živaljić et al. 2013, Nikolić et al.
2017b) and the other based on finite elements, where material inelasticity and the cross-section
behaviour are presented through the fibre approach (SeismoStruct). The goal of both models is to
apply the knowledge of influence of ductility classes from EC8 on structural resistance. More
precisely, we studied development of damage zones, ultimate bearing capacity and corresponding
failure mechanisms on two reinforced concrete buildings with different structural resistant system
(wall and frame structural system) using incremental dynamic analysis (Vamvatsikos and Cornell
2002).
2. Input for incremental dynamic analysis
Dynamic response of the buildings in both modelling approaches presented in this paper was
conducted by the incremental dynamic analysis (IDA) up to the failure (Vamvatsikos and Cornell
2002). This method is widely used in performance based seismic design (Pramanik et al. 2016).
The buildings were subjected to a series of realistic earthquake excitations in terms of time-history
analyses of increasing intensity (e.g., peak ground acceleration is incrementally scaled from a low
elastic response value up to the failure). Careful attention was given to the selection of time-
history records in order to satisfy the acceleration spectrum assumed in design.
Seismic loading was represented by horizontal ground acceleration recorded on the soil class B
during real earthquakes. The set of seven ground motion records were chosen from the European
Strong-Motion according to Iervolino et al. (2008). Selected earthquakes are listed in Table 1 and
shown in Fig. 1.
Table 1 Selected ground motion records (European Strong-Motion Database)
Event Name Country Station name Code Date amax
South Iceland Iceland Selsund 004677xa 17/06/2000 0.33 g
Montenegro Montenegro Bar-Skupstina Opstine 000199ya 15/04/1979 0.44 g
Montenegro (aftershock) Montenegro Petrovac-Hotel Rivijera 000229ya 24/05/1979 0.33 g
Montenegro (aftershock) Montenegro Budva-PTT 000230ya 24/05/1979 0.32 g
Erzincan Turkey Erzincan-Meteorologij
Mudurlugu 000535ya 13/03/1992 0.61 g
South Iceland Iceland Hella 004673ya 17/06/2000 0.57 g
South Iceland
(aftershock) Iceland Kaldarholt 006328ya 21/06/2000 0.47 g
The selected accelerograms were scaled by taking into account that maximum value of the
179
Page 4
Željana Nikolić, Nikolina Živaljić and Hrvoje Smoljanović
acceleration ought to be agS, where ag was design ground acceleration, and S was the soil
parameter according to EC8. The acceleration spectra of the selected earthquakes for damping
=5%, their average value and Type 1 elastic spectrum for ag=0.3 g according to EC8 are shown in
Fig. 2. Namely, according to the most of the seismic design codes, including EC8, if seven or more
time-histories are used in analysis, than the average structural response is valid for the design. The
average elastic spectrum of seven selected earthquakes should not drop below the value of 90% of
elastic spectrum prescribed by EC8 in any period of the structure. Comparison between average
response spectra of selected earthquakes and Type 1 elastic spectrum (Fig. 2) shows that this
condition was satisfied.
(a) South Iceland - Selsund (Iceland, 2000) (b) Montenegro - Bar (Montenegro, 1979)
(c) Montenegro (aftershock) -Petrovac
(Montenegro, 1979)
(d) Montenegro (aftershock) - Budva (Montenegro,
1979)
(e) Erzincan (Turkey, 1992), (f) South Iceland - Hella (Iceland, 2000)
(g) South Iceland (aftershock) - Kaldarholt (Iceland, 2000)
Fig. 1 Earthquake records adopted in the analysis
-5.0
-4.0
-3.0
-2.0
-1.0
0.0
1.0
2.0
3.0
4.0
5.0
0 5 10 15 20 25a/
m/s
2
t / s
amax=3.28 m/s2
South Iceland - Selsund (2000.)
-5.0
-4.0
-3.0
-2.0
-1.0
0.0
1.0
2.0
3.0
4.0
5.0
0 5 10 15 20 25a/
m/s
2
t / s
amax=4.27 m/s2 Montenegro-Bar (1979.)
-4.0
-3.0
-2.0
-1.0
0.0
1.0
2.0
3.0
0 5 10 15 20 25
a/
m/s
2
t / s
amax=3.24 m/s2
Montenegro-Petrovac
(aftershock) (1979.)
-4.0
-3.0
-2.0
-1.0
0.0
1.0
2.0
3.0
0 5 10 15 20 25
a/
m/s
2
t / s
amax=3.15 m/s2
Montenegro-Budva
(aftershock) (1979.)
-5.0
-4.0
-3.0
-2.0
-1.0
0.0
1.0
2.0
3.0
4.0
5.0
6.0
7.0
0 5 10 15 20 25
a/
m/s
2
t / s
amax=6.03 m/s2
Turkey-Erzincan (1992.)
-6.0
-5.0
-4.0
-3.0
-2.0
-1.0
0.0
1.0
2.0
3.0
4.0
5.0
0 5 10 15 20 25
a/
m/s
2
t / s
amax=5.61 m/s2 South Iceland-Hella (2000.)
-4.0
-3.0
-2.0
-1.0
0.0
1.0
2.0
3.0
4.0
5.0
0 5 10 15 20 25
a/
m/s
2
t / s
amax=4.61 m/s2
South Iceland-Kaldarholt(aftershock) (2000.)
180
Page 5
Influence of ductility classes on seismic response of reinforced concrete structures
Fig. 2 Response spectra of the selected records, their average value and elastic spectrum (EC8-Type 1)
Using seven modified records, incremental dynamic analysis (Vamvatsikos and Cornell 2002)
was performed for analysed RC buildings. Each of the seven records was applied with increasing
ground motion intensity up to the failure of the structure.
3. Non-linear analysis of RC building with wall structural system
The non-linear analysis of RC wall structures was performed by finite-discrete element model
(Nikolić et al. 2017b), which accounts for material non-linearities and discrete cracks
representation approach. The accuracy of the model and its performance in modelling the static
and dynamic response of RC plane concrete structures has been extensively validated in previous
studies (Živaljić et al. 2012, Živaljić et al. 2013, Živaljić et al. 2014, Nikolić et al. 2017b).
Therefore, only short description of the model is given in the following sections, in order to
explain its main characteristics.
3.1 Description of numerical model
The applied model considers discrete representation of the cracks. The concrete structure is
discretised on triangular finite elements, whereas the reinforcing bars are modelled with linear 1D
elements. The structure is assumed to behave as a linear elastic continuum until the initiation of the
cracks and discontinuities, which are allowed to propagate through the joint elements of concrete,
leading to the deformation in the reinforcing bar joint elements. The concrete and reinforcing bars
are analysed separately, but they are connected by the relationship between the size of the concrete
crack and the strain of the reinforcing bar. The model of the 2D RC structure with the embedded
reinforcing bar is presented in Fig. 3.
Fig. 3 Discretisation of RC structure
0.0
0.2
0.4
0.6
0.8
1.0
1.2
1.4
1.6
1.8
2.0
0.0 0.5 1.0 1.5 2.0 2.5 3.0 3.5 4.0
T / s
Sa
/g
SelsundBarPetrovacBudvaErzincanHellaKaldarholtaverage0.3g90%_0.3g
181
Page 6
Željana Nikolić, Nikolina Živaljić and Hrvoje Smoljanović
Non-linear numerical model in concrete contact element is used for simulation of crack
initiation and propagation in tension and shear. The cracks are assumed to coincide with the finite
element edges, which are achieved in advance through the topology of adjacent elements described
by different nodes. Separation of these edges induces a bonding stress which is taken to be a
function of the size of separation δ (Fig. 4). Before reaching tensile strength, there is no separation
of element edges, which is enforced through the penalty function method i.e., the edges of two
adjacent elements are held together by normal and shear springs.
Fig. 4 Strain softening curve defined in terms of displacements
After reaching tensile strength ft, stress decreases with an increasing separation , and at =c
bonding stress tends to zero. For separation t<<c, bonding stress is given by
tc fz (1)
where z is a heuristic scaling function representing an approximation of experimental stress-
displacement curves (Hordijk 1992),
231
231 )1()(1
ct
tDct ecDeDcz
(2)
where c1=3, c2=6,93, and the damage parameter Dt is determined according to the following
expression
c
cttcttD
if
if
,1
;),/()( (3)
A similar model for describing shear stress τs and shear displacement ts relation is adopted for
concrete behaviour in shear.
In this numerical model, concrete contact element is extended to capture main characteristics
related to cyclic loading in tension. For this purpose, material model shown in Fig. 4 is adopted
(Reinhardt 1984), where the ratio of k1/kt was obtained experimentally from uniaxial cyclic tests
and equals to 0,73.
The model of reinforcing bar in the joint element is divided into parts before and after the
opening of the crack (Živaljić et al. 2013). Before the opening of the crack in concrete, continuity
between the reinforcing bar finite elements is ensured through the penalty function method. After
the cracking, a path-dependent mechanical model for a deformed reinforcing bar in the joint
element (Soltani and Maekawa 2008) is used to describe the behaviour of the reinforcing bar at
182
Page 7
Influence of ductility classes on seismic response of reinforced concrete structures
crack faces. The model takes into account the bond deterioration in the reinforcement near the
crack plane and can accurately express the behaviour of a reinforcing bar that undergoes a high
plastic deformation under reversed cyclic loading, and shear force carried by the bar.
The axial tension force developing in the reinforcing bar is partly transferred to the concrete
between adjacent cracks through the bonding between the reinforcing bar and concrete.
Consequently, the local stress along the bar differs from that at the interface. It causes no uniform
distribution of strains along the bar which, among other factors, depends on the bar pull out S from
the crack interface (Fig. 5) (Soltani and Maekawa 2008, Nikolić et al. 2017b).
Fig. 5 Discrete crack and steel strain-slip relation under monotonic loading
The monotonic slip-strain relations are defined according to the non-dimensional slip s given
by
3/2
20,
c
fcfc
fKK
D
Ss (4)
where D is the diameter of the bar and fc is the compressive strength of concrete (MPa). Non-
dimensional slip-strain relationship before and after yielding of steel is used according to the
expressions shown in Fig. 5, where εs represents the strain at the reinforcing bar in the crack, εy
refers to the yielding strain of the bar, fu and fy to the tensile strength and yield stress of steel (MPa)
respectively, while εsh to the strain at the onset of hardening. After yielding of the reinforcing bar,
the normalised steel slip s is expressed as the sum of the slip spl in the yield region and se in the
elastic region as
epl sss (5)
Assuming a linear distribution of strain in the yield region, the normalised steel slip spl is
expressed as
)()1(
maxmax
maxy
sh
shspl sss
(6)
where εmax and smax represent steel strain and non-dimensional slip immediately after the transition
from loading to unloading, and β is a factor obtained from experiments and taken as 1.0. By
incorporating equation (5) into (4), the strain in the reinforcing bar at the crack can be obtained
from the known non-dimensional slip s. The influence of adjacent cracks is approximately taken
into account through a reduction factor α (Soltani and Maekawa 2008), which depends on the
183
Page 8
Željana Nikolić, Nikolina Živaljić and Hrvoje Smoljanović
average distance between cracks lcr. The steel slip scr, which considers the influence of adjacent
cracks, is expressed for monotonic loading (Živaljić et al. 2013). The position of the crack is
defined by a finite element edge, so that lcr is adopted as an input parameter, which is equal to h/2
where h is the concrete finite element length (Živaljić et al. 2014).
3.2 Characteristics of the building and numerical modelling
A five-storey RC building with the uncoupled wall system, shown in Fig. 6, was analysed in
order to study the influence of ductility classes on the buildings with wall structural system. The
vertical load of the building consists of the weight of its structural elements, an additional dead
load of 2.5 kN/m2 and imposed load of 4.0 kN/m2 at floor slabs.
Fig. 6 Geometry of RC building with uncoupled wall system
The building was previously designed according to the regulations of EC8 for importance
factor II (I=1), type 1 response spectrum, damping =5%, ground type B, design ground
acceleration ag=0.3 g and ductility classes DCM and DCH. Behaviour factors of q=3.0 for DCM
and q=4.4 for DCH are adopted. The linear response spectrum analysis of the whole building was
applied firstly in order to calculate internal forces and to design the reinforcement in characteristic
cross-sections, considering the design rules of EC8.
The influence of the ductility classes to the behaviour of the structure was analysed by
incremental dynamic analysis for the left boundary wall with geometry and reinforcement obtained
from previous design (see Fig. 7). The wall was exposed to in-plane earthquake action represented
by selected earthquakes and vertical loads consist of the weight of the wall and the load from the
corresponding slab surface. The slab loads (dead load, additional dead load and imposed load)
from a half of distance between the neighbouring walls, i.e., 5 m, was used and applied at the
positions where the wall was connected with the slabs. Material characteristics of concrete and
steel are shown in Table 2.
3.3 Incremental dynamic analysis and discussion of the results
The observed boundary RC wall was exposed to in-plane horizontal ground acceleration of
selected seven earthquakes (Table 1). The amplitudes were gradually increased, starting with low
intensity of acceleration until the collapse of the wall, with an increment a/g=0.02. A large
184
Page 9
Influence of ductility classes on seismic response of reinforced concrete structures
(a) geometry (b) discretisation
(c) DCM wall reinforcement (d) DCH wall reinforcement
Fig. 7 Boundary RC wall
Table 2 Material characteristics of the wall
Concrete
Young’s Modulus
Ec / MPa
Poisson’s ratio
ν
Tensile strength
ft / MPa
Compressive
strength
fc / MPa
Fracture energy
Gf / N/m
Spatial weight
ρ / kN/m3
32800 0.2 3.80 38 150 25
Steel
Young’s Modulus
Es / MPa
Yield stress
fy / MPa
Ultimate stress
fu / MPa
Strain at onset of
hardening
εsh
Ultimate strain
εu
210000 500 600 0.02 0.1
amount of data was obtained from the incremental dynamic analysis hence, for the purpose of
brevity, we will discuss the results which are considered the most important features of the
structures subjected to seismic loading, such as capacity of the wall, crack pattern and inter-storey
185
Page 10
Željana Nikolić, Nikolina Živaljić and Hrvoje Smoljanović
drifts.
Non-linear behaviour of the wall and its seismic capacity for selected earthquakes obtained by
incremental dynamic analysis for both ductility classes is shown in Figs. 8 and 9 considering the
relation between the peak ground acceleration (a/g) and the relative top displacement (u/H), where
H is building height.
Fig. 8 Curves for relative top displacement (u/H), DCM RC wall
Fig. 9 Curves for relative top displacement (u/H), DCH RC wall
Analysis of the average dynamic response of the wall, calculated as a mean value of the
responses obtained for seven selected earthquake records, (Figs. 8 and 9) shows that the behaviour
of the wall designed for DCM class is linear up to the ground acceleration a=0.30 g. Significant
non-linearity starts for a=0.48 g, while the collapse of the wall occurs for a=0.70 g. Wall designed
according to DCH is in linear elastic region up to a=0.40 g. Average collapse acceleration a=0.84 g
was observed for DCH class.
The most destructive earthquake for both ductility classes is Bar, with ultimate collapse
accelerations a=0.40 g and a=0.50 g for DCM and DCH classes respectively. The least destructive
earthquakes, considered through the aspect of collapse accelerations, are Petrovac and Selsund,
which produced the collapse of the wall for a=0.90 g (DCM) and a=1.0 g (DCH).
It can be observed that the wall reinforced according to DCH possesses average seismic
resistance 20% higher with respect to DCM. It is interesting to emphasise that the longitudinal
0.0
0.1
0.2
0.3
0.4
0.5
0.6
0.7
0.8
0.9
1.0
0.0 0.1 0.2 0.3 0.4 0.5 0.6 0.7 0.8 0.9 1.0 1.1 1.2 1.3
a/
g
u / H (%)
Selsund Bar
Petrovac Budva
Erzincan Hella
Kaldarholt average
0.0
0.1
0.2
0.3
0.4
0.5
0.6
0.7
0.8
0.9
1.0
0.0 0.1 0.2 0.3 0.4 0.5 0.6 0.7 0.8 0.9 1.0 1.1 1.2 1.3
a/
g
u / H (%)
Selsund Bar
Petrovac Budva
Erzincan Hella
Kaldarholt average
186
Page 11
Influence of ductility classes on seismic response of reinforced concrete structures
flexural reinforcement in the boundary elements is the same for both ductility classes in order to
meet the requirement of the minimum percentage of reinforcement. The differences pertain to
confining reinforcement in boundary elements and web shear reinforcement which caused higher
seismic resistance of the high ductility wall. Average responses for both ductility classes still
remain linear before the reached design ground acceleration.
Figs. 10 and 11 show crack patterns for DCM and DCH walls exposed to earthquake excitation
of Montenegro (aftershock) - Budva. The reason for choosing Budva earthquake is in a fact that
this earthquake has response which is near to the average value for considering seven earthquakes.
The collapse for this earthquake for DCM and DCH is achieved for accelerations of a=0.60 g and
a=0.80 g respectively.
The first cracks for both ductility classes occur for acceleration of a=0.30 g in the bottom part
of the wall. Initial horizontal cracks are elongated and connected with each another for a=0.50 g
(DCM) and 0.70 g (DCH). The structure is seriously damaged for acceleration a=0.60 g (DCM)
and 0.80g (DCH), with a large number of cracks on the first floor of the wall and horizontal cracks
on the second and third floors. Cracking patterns reveal rougher cracking with a smaller number of
larger cracks in the DCM wall, while fine small crack pattern and crushing of the concrete was
noticed for the DCH wall during the collapse acceleration. This is a consequence of reinforcement
of the DCH wall with greater amount of confining and shear web reinforcement. It can be noted
that a greater amount of embedded confining and shear web reinforcement for DCH contributes
not only to a slower development of the cracks, but also to a higher ultimate acceleration.
(a) a=0.3 g (b) a=0.4 g (c) a=0.5 g (d) a=0.6 g
Fig. 10 Crack pattern for DCM wall, earthquake Montenegro (aftershock) - Budva
(a) a=0.3 g (b) a=0.4 g (c) a=0.7 g (d) a=0.8 g
Fig. 11 Crack pattern for DCH wall, earthquake Montenegro (aftershock) - Budva
187
Page 12
Željana Nikolić, Nikolina Živaljić and Hrvoje Smoljanović
The collapse of the DCM wall occurred due to the fracture of the reinforcing bars, which
results in the reduction in lateral stiffness and strength of the wall under seismic loading. The
reason of the collapse of DCH walls is crushing under diagonal compression, resulting in a sudden
loss of lateral resistance.
Fig. 12 shows the maximum inter-storey drift ratio (Δu/H) as a function of the ground
acceleration, for DCM and DCH walls exposed to seismic excitation with selected earthquakes.
(a1) DCM (a2) DCH
(b1) DCM (b2) DCH
(c1) DCM (c2) DCH
(d1) DCM (d2) DCH
Fig. 12 Maximum inter-storey drifts of DCM and DCH walls for earthquakes: (a) Selsund; (b) Bar; (c)
Petrovac; (d) Budva; (e) Erzincan; (f) Hella; (g) Kaldarholt
1
2
3
4
5
0.0 0.2 0.4 0.6 0.8 1.0 1.2 1.4
store
y l
evel
maximum interstorey drift ratio, Δu / h (%)
0.2g
0.3g
0.4g
0.5g
0.6g
0.7g
0.8g
0.9g1
2
3
4
5
0.0 0.2 0.4 0.6 0.8 1.0 1.2 1.4
store
y l
evel
maximum interstorey drift ratio, Δu / h (%)
0.2g
0.3g
0.4g
0.5g
0.6g
0.7g
0.8g
0.9g
1.0g
1
2
3
4
5
0.0 0.2 0.4 0.6 0.8 1.0 1.2 1.4
store
y l
evel
maximum interstorey drift ratio, Δu / h (%)
0.2g
0.3g
0.4g
1
2
3
4
5
0.0 0.2 0.4 0.6 0.8 1.0 1.2 1.4
store
y l
evel
maximum interstorey drift ratio, Δu / h (%)
0.2g
0.3g
0.4g
0.5g
1
2
3
4
5
0.0 0.2 0.4 0.6 0.8 1.0 1.2 1.4
store
y l
evel
maximum interstorey drift ratio, Δu / h (%)
0.2g
0.3g
0.4g
0.5g
0.6g
0.7g
0.8g
0.9g1
2
3
4
5
0.0 0.2 0.4 0.6 0.8 1.0 1.2 1.4
store
y l
evel
maximum interstorey drift ratio, Δu / h (%)
0.2g
0.3g
0.4g
0.5g
0.6g
0.7g
0.8g
0.9g
1.0g
1
2
3
4
5
0.0 0.2 0.4 0.6 0.8 1.0 1.2 1.4
store
y l
evel
maximum interstorey drift ratio, Δu / h (%)
0.2g
0.3g
0.4g
0.5g
0.6g
1
2
3
4
5
0.0 0.2 0.4 0.6 0.8 1.0 1.2 1.4
store
y l
evel
maximum interstorey drift ratio, Δu / h (%)
0.2g
0.3g
0.4g
0.5g
0.6g
0.7g
0.8g
188
Page 13
Influence of ductility classes on seismic response of reinforced concrete structures
(e1) DCM (e2) DCH
(f1) DCM (f2) DCH
(g1) DCM (g2) DCH
Fig. 12 Continued
Maximum inter-storey drifts present significantly different results with respect to selected
earthquakes. Bar and Budva earthquakes cause small inter-storey drifts (less than 0.2%) up to the
value which is approximately 80% of the ultimate acceleration. All inter-storey drifts suddenly
increase before the wall collapses. Inter-storey drifts for other earthquakes, after small values at the
beginning, gradually increase in non-linear region of the structural behaviour up to the collapse
acceleration. Maximum inter-storey drift for the DCM wall is obtained for Budva earthquake
(1.33%), while Erzincan earthquake causes maximum value for the DCH wall (1.38%).
4. Non-linear analysis of RC frame building
4.1 Description of numerical model
The non-linear time-history analysis of RC frame building was performed by the SeismoStruct
programme. Large displacements and rotations and P- effect are taken into account through the
employment of a total co-rotational formulation. Material inelasticity and the cross-section
1
2
3
4
5
0.0 0.2 0.4 0.6 0.8 1.0 1.2 1.4
store
y l
evel
maximum interstorey drift ratio, Δu / h (%)
0.2g
0.3g
0.4g
0.5g
0.6g
1
2
3
4
5
0.0 0.2 0.4 0.6 0.8 1.0 1.2 1.4
store
y l
evel
maximum interstorey drift ratio, Δu / h (%)
0.2g
0.3g
0.4g
0.5g
0.6g
0.7g
1
2
3
4
5
0.0 0.2 0.4 0.6 0.8 1.0 1.2 1.4
store
y l
evel
maximum interstorey drift ratio, Δu / h (%)
0.2g
0.3g
0.4g
0.5g
0.6g
0.7g
1
2
3
4
5
0.0 0.2 0.4 0.6 0.8 1.0 1.2 1.4
store
y l
evel
maximum interstorey drift ratio, Δu / h (%)
0.2g
0.3g
0.4g
0.5g
0.6g
0.7g
0.8g
0.9g
1
2
3
4
5
0.0 0.2 0.4 0.6 0.8 1.0 1.2 1.4
store
y l
evel
maximum interstorey drift ratio, Δu / h (%)
0.2g
0.3g
0.4g
0.5g
0.6g
0.7g
0.8g1
2
3
4
5
0.0 0.2 0.4 0.6 0.8 1.0 1.2 1.4
sto
rey l
evel
maximum interstorey drift ratio, Δu / h (%)
0.2g
0.3g
0.4g
0.5g
0.6g
0.7g
0.8g
0.9g
1.0g
189
Page 14
Željana Nikolić, Nikolina Živaljić and Hrvoje Smoljanović
behaviour are presented through the fibre approach, where each fibre is associated with a uniaxial
stress-strain relationship. A reinforced concrete section consists of unconfined concrete fibres,
confined concrete fibres and steel fibres. Non-linear behaviour of concrete was adopted through
non-linear constant confinement model, where the confinement effect is provided by the constant
pressure which is caused by lateral transverse reinforcement (Mander et al. 1988). Behaviour of
steel is modelled by bilinear steel model with kinematic strain hardening. Hysteretic response of
both materials is defined by the material constitutive models. The stress-strain relation in the
element cross section (beams, columns) can be obtained as a result of the integration of non-linear
uniaxial response of the fibres. The dynamic time-history analysis is computed by direct
integration of the equations of motion with the Newmark scheme. Modelling of seismic loading is
achieved by introducing acceleration loading curves of selected earthquakes.
4.2 Characteristics of the building and numerical modelling
A five-storey RC frame building, regular in the plan and elevation, shown in Fig. 13, was
analysed in order to study the influence of the ductility classes on the buildings with frame
structural system. The dimensions in the plan are 27x15 m. The bottom storey height equals to 4.0
m, whereas at the other levels it equals to 3.2 m. The cross-section dimensions are 50x50 cm for
all columns, and 30x45 cm for all beams. The spans are 6 m and 3 m. The structure has RC slabs
with thickness equal to 16 cm. The concrete characteristic cubic strength is fck=30 N/mm2, and
steel characteristic yielding strength is fyk=500 N/mm2. The building loads are self-weight,
additional dead load of 2.8 kN/m2 and imposed load of 3.0 kN/m2.
The building was previously designed according to the regulations of EC8 for importance
factor II (I=1), type 1 response spectrum, damping =5%, ground type B, design ground
acceleration ag=0.3 g and ductility classes DCM and DCH. Behaviour factors equal to q=3.9 for
DCM and q=5.85 for DCH are adopted. The linear response spectrum analysis was applied in
order to calculate internal forces and reinforcement in characteristic cross-sections as a result of
earthquake action to the building.
(a) Plan (b) Section
Fig. 13 Geometry of the building
DCM frame was designed with columns reinforced by 2018, 410/10 cm stirrups in critical
region and 8/20 cm stirrups out of critical region, whereas the beams were reinforced by
longitudinal 718 bars in upper and lower section, and 8/15 cm stirrups.
190
Page 15
Influence of ductility classes on seismic response of reinforced concrete structures
DCH frame was designed with the columns reinforced by longitudinal 2416 bars, 410/10 cm
stirrups in critical region, and 8/20 cm stirrups out of critical region. The beams have longitudinal
716 bars in upper and lower section, and 8/15 cm stirrups. Special attention was devoted to the
design of beam-column connections which are very susceptible to damage during the earthquake
event (Domínguez and Pérez-Mota 2014). Therefore, the additional horizontal 10/5 cm bars were
placed in beam-column joints to ensure ductility behaviour.
The influence of the plate to flexural and torsional stiffness was taken by modelling the beams
as T cross-section with effective width of 80 cm.
4.3 Incremental dynamic analysis and discussion of the results
The differences in behaviour for both ductility classes was analysed by incremental dynamic
analysis performed on inner RC plane frame with geometry and reinforcement obtained from
previous seismic design. In this analysis, SeismoStruct programme was used, as already mentioned
in section 4.1. The frame was exposed to earthquake action and vertical loads consist of the weight
of the frame and the load from the corresponding slab surface. The slab loads (dead load,
additional dead load and imposed load) from a half of distance between the neighbouring frames,
i.e., 1.5+3.0=4.5 (m), was used and applied at the beams.
Each of the chosen seven records (Table 1) was applied with increasing ground motion
intensity up to the structural collapse. Figs. 14 and 15 shows response curves of the frame,
designed for DCM and DCH respectively, for selected earthquakes considering the relation
between the peak ground acceleration (a/g) and the relative top displacement (u/H), where H is
building height.
The most destructive earthquake, considering the collapse acceleration for both ductility
classes, is Budva, with ultimate collapse accelerations a=0.29 g and a=0.30 g for DCM and DCH
classes respectively. The least destructive earthquakes are Kaldarholt with collapse acceleration
a=0. 41 g (DCM) and a=0.36 g (DCH) and Selsund which produced the collapse of the frame for
a=0.37 g (DCM) and a=0.35 g (DCH).
The average collapse acceleration of a=0.36 was observed for DCM frame, while DCH frame
achieved a=0.33 g at the failure stage. The frame reinforced according to the DCM possesses
average seismic resistance 11% higher with respect to DCH.
Fig. 14 Curves for relative top displacement (u/H), DCM frame
0
0.05
0.1
0.15
0.2
0.25
0.3
0.35
0.4
0.45
0.00 0.25 0.50 0.75 1.00 1.25 1.50 1.75 2.00
a /g
u / H (%)
Selsund Petrovac
Erzincan Kaldarholt
Bar Budva
Hella average
191
Page 16
Željana Nikolić, Nikolina Živaljić and Hrvoje Smoljanović
Fig. 15 Curves for relative top displacement (u/H), DCH frame
In this example, there was no significant difference between the bearing capacity of DCM and
DCH frames, because the reinforcement embedded in the columns of the DCM frame was slightly
larger than in the DCH frame. In fact, the DCH frame was designed for lower lateral strength, and
it was expected that its seismic resistance is considerably lower, 50% lower on average, due to a
higher behaviour factor. Meeting the requirements to design the primary seismic columns stronger
than the beams, with an overstrength factor of 1.3 on beam design flexural capacities, results in
having the columns in DCH frames with similar flexural capacity as in the DCM frame. Therefore,
seismic resistance of both frames represented through collapse acceleration does not significantly
differ.
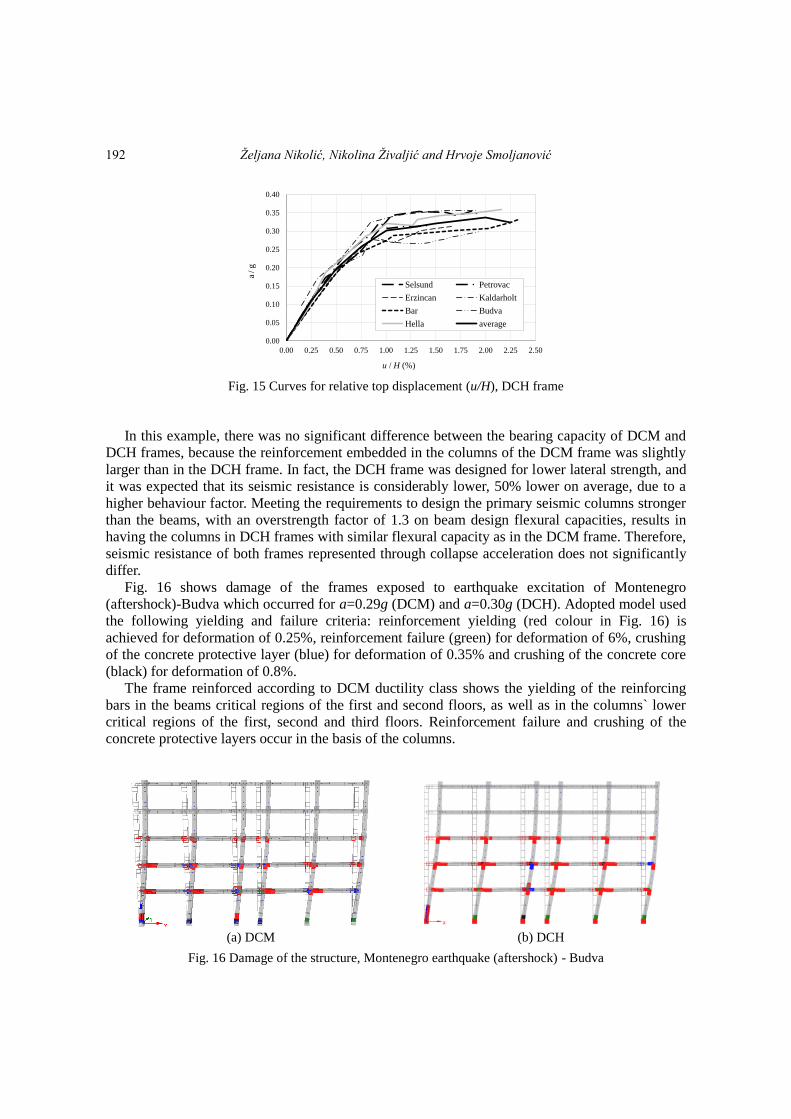
Fig. 16 shows damage of the frames exposed to earthquake excitation of Montenegro
(aftershock)-Budva which occurred for a=0.29g (DCM) and a=0.30g (DCH). Adopted model used
the following yielding and failure criteria: reinforcement yielding (red colour in Fig. 16) is
achieved for deformation of 0.25%, reinforcement failure (green) for deformation of 6%, crushing
of the concrete protective layer (blue) for deformation of 0.35% and crushing of the concrete core
(black) for deformation of 0.8%.
The frame reinforced according to DCM ductility class shows the yielding of the reinforcing
bars in the beams critical regions of the first and second floors, as well as in the columns` lower
critical regions of the first, second and third floors. Reinforcement failure and crushing of the
concrete protective layers occur in the basis of the columns.
(a) DCM (b) DCH
Fig. 16 Damage of the structure, Montenegro earthquake (aftershock) - Budva
0.00
0.05
0.10
0.15
0.20
0.25
0.30
0.35
0.40
0.00 0.25 0.50 0.75 1.00 1.25 1.50 1.75 2.00 2.25 2.50
a/
g
u / H (%)
Selsund Petrovac
Erzincan Kaldarholt
Bar Budva
Hella average
192
Page 17
Influence of ductility classes on seismic response of reinforced concrete structures
Several types of damages occurred for the frame designed according to DCH ductility class,
including the crushing of the concrete protective layer and concrete core in the columns of the first
floor, expansion of plastic zones in the beams and further propagation of plastification in the
columns of the third floor.
5. Conclusions
• In this paper, the behaviour of RC buildings, previously designed for DCM and DCH ductility
class according to the regulations of EC8, was analysed by using incremental dynamic analysis in
order to study the differences in the behaviour of the structure between these ductility classes,
especially the collapse mechanism and collapse loads. The analyses were performed for design
acceleration of 0.30g and seven time-history records of earthquakes, which were chosen to satisfy
the acceleration spectrum assumed in the design.
• RC building with wall structural system was designed for lower lateral strength in the case of
ductility class DCH, so it was expected that its seismic resistance is considerably lower, in
comparison to DCM class, due to a higher behaviour factor. But finally, the walls had the same
longitudinal flexural reinforcement in the boundary elements for both ductility classes by meeting
the requirements of the minimum percentage of reinforcement. The differences pertaining to
confining reinforcement in boundary elements and web shear reinforcement caused higher average
seismic resistance of the DCH wall. The average collapse of DCM and DCH walls occurred for
acceleration of a=0.70g and a=0.84g, respectively. The ultimate collapse acceleration for different
earthquakes varied from 0.4g to 1.0g, and it was mainly significantly higher than the design
acceleration. The cracking patterns reveal rougher cracking with a smaller number of larger cracks
in the DCM wall, whereas fine small crack pattern and crushing of the concrete was noticed for the
DCH wall during the collapse acceleration. The collapse of the DCM wall occurred due to the
fracture of the reinforcing bars which results in the reduction in lateral stiffness and strength of the
wall. The reason of the collapse of DCH walls is crushing under diagonal compression, resulting in
a sudden loss of lateral resistance.
• RC frame building of DCH ductility class was also calculated for lower lateral strength than
DCM building. Similar as in the wall building, significantly lower resistance of the DCH frame
was expected. Finally, the longitudinal reinforcement of the beams in critical region was 27%
higher for ductility class DCM in comparison to DCH, but the longitudinal reinforcement of the
columns is only 6% higher for DCM. The reason for the small difference in the percentage of
reinforcement between two classes is in meeting the requirements to design the primary seismic
columns to be stronger than the beams, with an overstrength factor of 1.3 on beam design flexural
capacities. Therefore, the columns in DCH frames had a slightly lower flexural capacity in
comparison to the DCM frame. The seismic resistance of both frames represented through collapse
acceleration does not significantly differ, i.e. resistance of the frame for DCM is 11% higher in
relation to DCH. The failure mechanisms are very similar for both classes. After the yielding of
the reinforcement in the beam-column joint, the collapse for both ductility classes occurred due to
the crushing of the concrete and reinforcement failure in the basis of the columns. Strong columns
and weak beams produced plastification of the beams in the beam-column joints firstly, as it was
expected when the design and detailing rules of EC8 were strictly applied. The ultimate collapse
accelerations were 20-25% higher than the design acceleration.
• Presented conclusions are derived from an analysis of only two RC wall buildings, one with
193
Page 18
Željana Nikolić, Nikolina Živaljić and Hrvoje Smoljanović
wall and the other with frame structural system. We cannot say that derived conclusions are
generally applicable to all RC structures. Further analysis of a number of structures are necessary
to determine the differences in behaviour between the two ductility classes and the purposefulness
of the design for DCH ductility class, considering that the design effort required for DCH
structures is more demanding, and sometimes the detailing provisions are found hard to achieve in
practice.
Acknowledgments
This work has been fully supported by Croatian Science Foundation under the project
Development of numerical models for reinforced-concrete and stone masonry structures under
seismic loading based on discrete cracks (IP-2014-09-2319).
References
Armero, F. and Garikipati, K. (1996), “An analysis of strong discontinuities in multiplicative finite strain
plasticity and their relation with the numerical simulation of strain localization in solids”, J. Sol. Struct.,
33, 2863-2885.
Armero, F. and Linder, C. (2009), “Numerical simulation of dynamic fracture using finite elements with
embedded discontinuities”, J. Fract., 160, 119-141.
Bažant, Z.P., Caner, F., Adley, M. and Akers, S. (2000), “Fracturing rate effect and creep in microplane
model for dynamics”, J. Eng. Mech., 126(9), 962-970.
Boot, E. (2014), Earthquake Design Practice for Buildings, 3rd Edition, Thomas Telford Limited, London,
U.K.
Cusatis, G., Bažant, Z.P. and Cedolin, L. (2006), “Confinement-shear lattice CSL model for fracture
propagation in concrete”, Comput. Meth. Appl. Mech. Eng., 195(52), 7154-7171.
D’Addetta, G.A., Kuhl, E., Kun, F. and Ramm, E. (1999), “Micromechanical modelling of concrete
cracking”, Proceedings of the European Conference on Computational Mechanics, Munich, Germany.
Domínguez, N. and Pérez-Mota, J. (2014), “Coupling of nonlinear models for steel-concrete interaction in
structural RC joints”, Coupled Syst. Mech., 3(2), 195-211.
Eurocode 8 (2005), Design of Structures for Earthquake Resistance-Part 1: General Rules, Seismic Actions
and Rules for Buildings, EN 1998-1, CEN, Brussels.
European Strong-Motion Database, <http://www.isesd.hi.is>.
Ghaboussi, J. (1997), “Fully deformable discrete element analysis using a finite element approach”, J.
Comput. Geotech., 5,175-195.
Hordijk, D.A. (1992), “Tensile and tensile fatigue behaviour of concrete-experiments, modelling and
analyses”, Heron, 37(1), 3-79.
Ibrahimbegovic, A., Boulkertous, A., Davenne, L. and Brancherie, D. (2010), “Modelling of reinforced-
concrete structures providing crack-spacing based on X-FEM, ED-FEM and novel operator split solution
procedure”, J. Numer. Meth. Eng., 83, 452-481.
Iervolino, I., Maddaloni, G. and Cosenza, E. (2008), “Eurocode 8 compliant real record sets for seismic
analysis of structures”, J. Earthq. Eng., 12, 54-90.
Mander, J.B., Priestley, M.J.N. and Park, R. (1988), “Theoretical stress-strain model for confined concrete”,
J. Struct. Eng., 114(8), 1804-1826.
Moës, N., Dolbow, J. and Belytschko, T. (1999), “A finite element method for crack growth without
remeshing”, J. Numer. Meth. Eng., 46, 131-150.
Munjiza, A. (2004), The Combined Finite-Discrete Element Method, John Wiley & Sons, London, U.K.
Nam Do, X., Ibrahimbegovic, A. and Brancherie, D. (2015a), “Combined hardening and localized failure
194
Page 19
Influence of ductility classes on seismic response of reinforced concrete structures
with softening plasticity in dynamics”, Coupled Syst. Mech., 4(2), 115-136.
Nam Do, X., Ibrahimbegovic, A. and Brancherie, D. (2015b), “Localized failure in damage dynamics”,
Coupled Syst. Mech., 4(3), 211-235.
Nikolic, M. and Ibrahimbegovic, A. (2015), “Rock mechanics model capable of representing initial
heterogeneities and full set of 3D failure mechanisms”, Comput. Meth. Appl. Mech. Eng., 290, 209-227.
Nikolic, M., Ibrahimbegovic, A. and Miscevic, P. (2015), “Brittle and ductile failure of rocks: Embedded
discontinuity approach for representing mode I and mode II failure mechanisms”, J. Numer. Meth. Eng.,
102(8), 1507-1526.
Nikolic, M., Ibrahimbegovic, A. and Miscevic, P. (2016), “Discrete element model for the analysis of fluid-
saturated fractured poro-plastic medium based on sharp crack representation with embedded strong
discontinuities”, Comput. Meth. Appl. Mech. Eng., 298, 407-427.
Nikolic, M., Karavelic, E., Ibrahimbegovic, A. and Miscevic, P. (2017a), “Lattice element models and their
peculiarities”, Archiv. Comput. Meth. Eng.
Nikolić, Ž., Živaljić, N., Smoljanović, H. and Balić, I. (2017b), “Numerical modelling of reinforced-concrete
structures under seismic loading based on the finite element method with discrete inter-element cracks”,
Earthq. Eng. Struct. Dyn., 46(1), 159-178.
Ortiz, M. and Pandolfi, A. (1999), “Finite-deformation irreversible cohesive elements for three-dimensional
crack-propagation analysis”, J. Numer. Meth. Eng., 44, 1267-1282.
Ortiz, M. and Quigley, J.J. (1991), “Adaptive mesh refinement in strain localization problem”, Comput.
Meth. Appl. Mech. Eng., 90, 781-804.
Ožbolt, J., Li, Y. and Kožar, I. (2001), “Microplane model for concrete with relaxed kinematic constraint”, J.
Sol. Struct., 38(16), 2683-2711.
Pearce, C.J., Thavalingam, A., Liao, Z. and Bićanić, N. (2000), “Computational aspects of the discontinuous
deformation analysis framework for modelling concrete fracture”, Eng. Fract. Mech., 65, 283-298.
Pramanik, D., Banerjee, A.K. and Roy, R. (2016), “Implications of bi-directional interaction on seismic
fragilities of structures”, Coupled Syst. Mech., 5(2), 101-126.
Reinhardt, H.V. (1984), “Fracture mechanics of an elastic softening material like concrete”, Heron, 29(2), 3-
41.
Rethore, J., Gravouil, A. and Combescure, A. (2005), “An energy-conserving scheme for dynamic crack
growth using the eXtended finite element method”, J. Numer. Meth. Eng., 63(5), 631-659.
Schlangen, E. and Garboczi, E.J. (1997), “Fracture simulation of concrete using lattice models:
computational aspects”, Eng. Fract. Mech., 57(2/3), 319-332.
SeismoStruct, A Computer Program for Static and Dynamic Nonlinear Analysis of Framed Structures,
<http://www.seismosoft.com>. Simo, J.C., Oliver, J. and Armero, F. (1993), “An analysis of strong discontinuities induced by strain-
softening in rate-independent inelastic solids”, Comput. Mech., 12, 277-296. Soltani, M. and Maekawa, K. (2008), “Path-dependent mechanical model for deformed reinforcing bars at
RC interface under coupled cyclic shear and pullout tension”, Eng. Struct., 30, 1079-1091. Vamvatsikos, D. and Cornell, C.A. (2002), “Incremental dynamic analysis”, Earthq. Eng. Struct. Dyn., 31,
491-514. Wells, G.N., Sluys, L.J. and Borst, R. (2002), “Simulating the propagation of displacement discontinuities in
a regularized strain-softening medium”, J. Numer. Meth. Eng., 53, 1235-1256. Yamamoto, Y., Nakamura, H., Kuroda, I. and Furuya, N. (2014), “Crack propagation analysis of reinforced
concrete wall under cyclic loading using RBSM”, Eur. J. Environ. Civil Eng., 18(7), 780-792. Živaljić, N., Nikolić, Ž. and Smoljanović, H. (2014), “Computational aspects of the combined finite-discrete
element method in modelling of plane reinforced concrete structures”, Eng. Fract. Mech., 131, 669-686. Živaljić, N., Smoljanović, H. and Nikolić, Ž. (2012), “Sensitivity analysis of numerical parameters in
FEM/DEM model for RC structures”, J. Eng. Modell., 25(1-4), 7-17. Živaljić, N., Smoljanović, H. and Nikolić, Ž. (2013), “A combined finite-discrete element model for RC
structures under dynamic loading”, Eng. Comput., 30, 982-1010.
AI
195