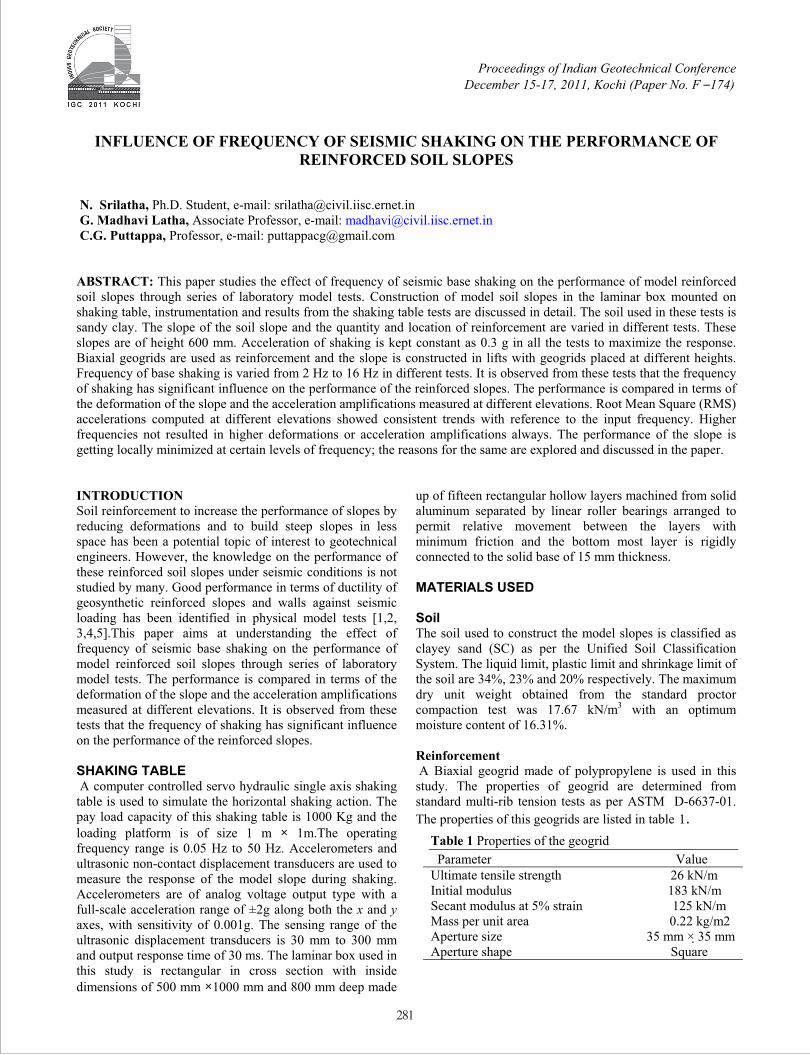
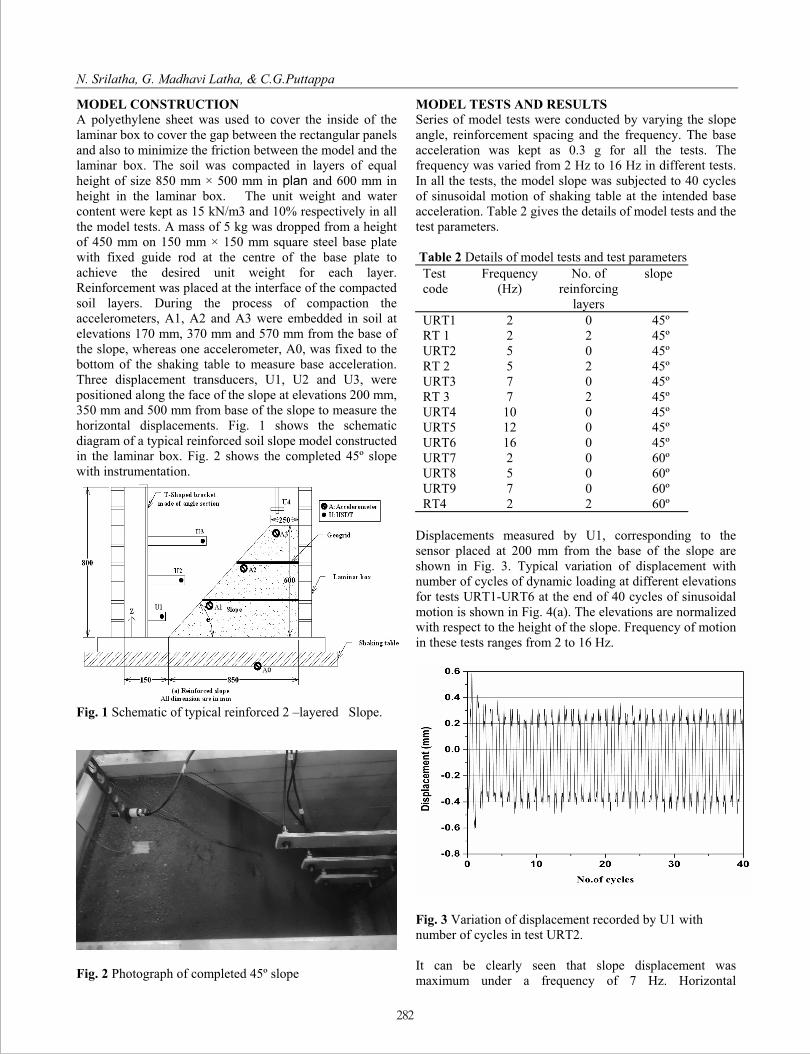
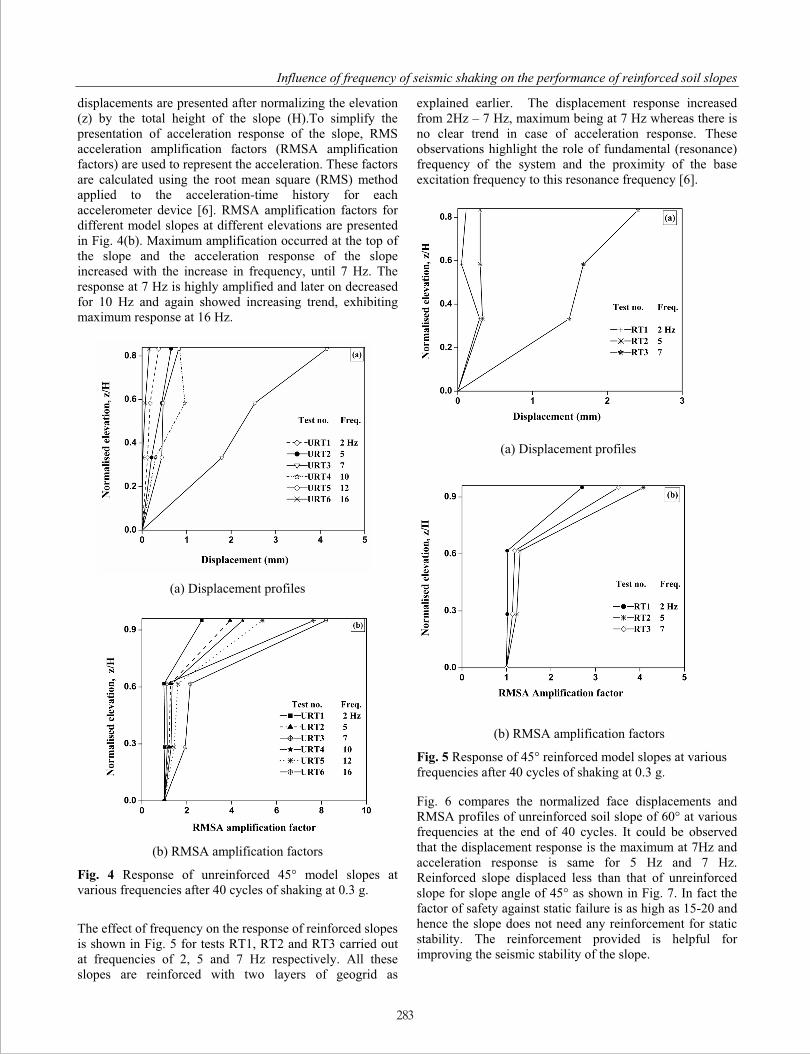
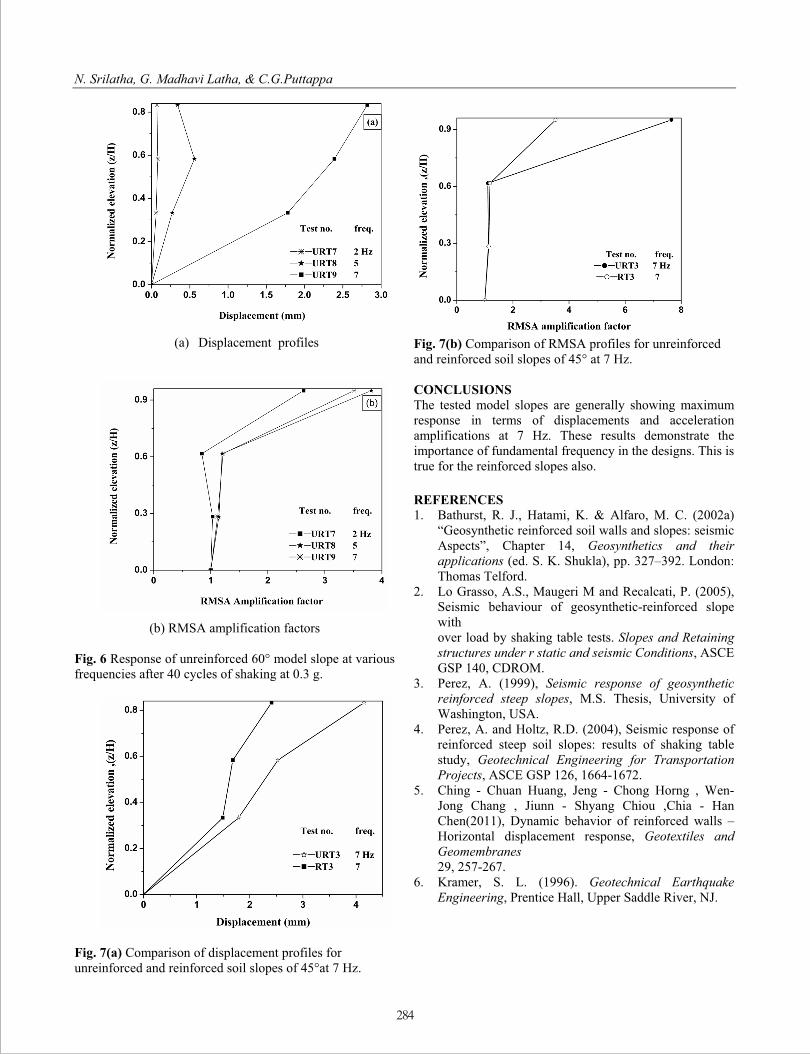
Proceedings of Indian Geotechnical Conference
December 15-17, 2011, Kochi (Paper No. F –174)
INFLUENCE OF FREQUENCY OF SEISMIC SHAKING ON THE PERFORMANCE OF
REINFORCED SOIL SLOPES
N. Srilatha, Ph.D. Student, e-mail: [email protected]
G. Madhavi Latha, Associate Professor, e-mail: [email protected]
C.G. Puttappa, Professor, e-mail: [email protected]
ABSTRACT: This paper studies the effect of frequency of seismic base shaking on the performance of model reinforced
soil slopes through series of laboratory model tests. Construction of model soil slopes in the laminar box mounted on
shaking table, instrumentation and results from the shaking table tests are discussed in detail. The soil used in these tests is
sandy clay. The slope of the soil slope and the quantity and location of reinforcement are varied in different tests. These
slopes are of height 600 mm. Acceleration of shaking is kept constant as 0.3 g in all the tests to maximize the response.
Biaxial geogrids are used as reinforcement and the slope is constructed in lifts with geogrids placed at different heights.
Frequency of base shaking is varied from 2 Hz to 16 Hz in different tests. It is observed from these tests that the frequency
of shaking has significant influence on the performance of the reinforced slopes. The performance is compared in terms of
the deformation of the slope and the acceleration amplifications measured at different elevations. Root Mean Square (RMS)
accelerations computed at different elevations showed consistent trends with reference to the input frequency. Higher
frequencies not resulted in higher deformations or acceleration amplifications always. The performance of the slope is
getting locally minimized at certain levels of frequency; the reasons for the same are explored and discussed in the paper.
INTRODUCTION
Soil reinforcement to increase the performance of slopes by
reducing deformations and to build steep slopes in less
space has been a potential topic of interest to geotechnical
engineers. However, the knowledge on the performance of
these reinforced soil slopes under seismic conditions is not
studied by many. Good performance in terms of ductility of
geosynthetic reinforced slopes and walls against seismic
loading has been identified in physical model tests [1,2,
3,4,5].This paper aims at understanding the effect of
frequency of seismic base shaking on the performance of
model reinforced soil slopes through series of laboratory
model tests. The performance is compared in terms of the
deformation of the slope and the acceleration amplifications
measured at different elevations. It is observed from these
tests that the frequency of shaking has significant influence
on the performance of the reinforced slopes.
SHAKING TABLE
A computer controlled servo hydraulic single axis shaking
table is used to simulate the horizontal shaking action. The
pay load capacity of this shaking table is 1000 Kg and the
loading platform is of size 1 m × 1m.The operating
frequency range is 0.05 Hz to 50 Hz. Accelerometers and
ultrasonic non-contact displacement transducers are used to
measure the response of the model slope during shaking.
Accelerometers are of analog voltage output type with a
full-scale acceleration range of ±2g along both the x and y
axes, with sensitivity of 0.001g. The sensing range of the
ultrasonic displacement transducers is 30 mm to 300 mm
and output response time of 30 ms. The laminar box used in
this study is rectangular in cross section with inside
dimensions of 500 mm ×1000 mm and 800 mm deep made
up of fifteen rectangular hollow layers machined from solid
aluminum separated by linear roller bearings arranged to
permit relative movement between the layers with
minimum friction and the bottom most layer is rigidly
connected to the solid base of 15 mm thickness.
MATERIALS USED
Soil
The soil used to construct the model slopes is classified as
clayey sand (SC) as per the Unified Soil Classification
System. The liquid limit, plastic limit and shrinkage limit of
the soil are 34%, 23% and 20% respectively. The maximum
dry unit weight obtained from the standard proctor
compaction test was 17.67 kN/m3 with an optimum
moisture content of 16.31%.
Reinforcement A Biaxial geogrid made of polypropylene is used in this
study. The properties of geogrid are determined from
standard multi-rib tension tests as per ASTM D-6637-01.
The properties of this geogrids are listed in table 1.
Table 1 Properties of the geogrid
Parameter Value
Ultimate tensile strength 26 kN/m
Initial modulus 183 kN/m
Secant modulus at 5% strain 125 kN/m
Mass per unit area 0.22 kg/m2
Aperture size 35 mm × 35 mm
Aperture shape Square
281
N. Srilatha, G. Madhavi Latha, & C.G.Puttappa
MODEL CONSTRUCTION A polyethylene sheet was used to cover the inside of the
laminar box to cover the gap between the rectangular panels
and also to minimize the friction between the model and the
laminar box. The soil was compacted in layers of equal
height of size 850 mm × 500 mm in plan and 600 mm in
height in the laminar box. The unit weight and water
content were kept as 15 kN/m3 and 10% respectively in all
the model tests. A mass of 5 kg was dropped from a height
of 450 mm on 150 mm × 150 mm square steel base plate
with fixed guide rod at the centre of the base plate to
achieve the desired unit weight for each layer.
Reinforcement was placed at the interface of the compacted
soil layers. During the process of compaction the
accelerometers, A1, A2 and A3 were embedded in soil at
elevations 170 mm, 370 mm and 570 mm from the base of
the slope, whereas one accelerometer, A0, was fixed to the
bottom of the shaking table to measure base acceleration.
Three displacement transducers, U1, U2 and U3, were
positioned along the face of the slope at elevations 200 mm,
350 mm and 500 mm from base of the slope to measure the
horizontal displacements. Fig. 1 shows the schematic
diagram of a typical reinforced soil slope model constructed
in the laminar box. Fig. 2 shows the completed 45º slope
with instrumentation.
Fig. 1 Schematic of typical reinforced 2 –layered Slope.
Fig. 2 Photograph of completed 45º slope
MODEL TESTS AND RESULTS
Series of model tests were conducted by varying the slope
angle, reinforcement spacing and the frequency. The base
acceleration was kept as 0.3 g for all the tests. The
frequency was varied from 2 Hz to 16 Hz in different tests.
In all the tests, the model slope was subjected to 40 cycles
of sinusoidal motion of shaking table at the intended base
acceleration. Table 2 gives the details of model tests and the
test parameters.
Table 2 Details of model tests and test parameters
Test
code
Frequency
(Hz)
No. of
reinforcing
layers
slope
URT1 2 0 45º
RT 1 2 2 45º
URT2 5 0 45º
RT 2 5 2 45º
URT3 7 0 45º
RT 3 7 2 45º
URT4 10 0 45º
URT5 12 0 45º
URT6 16 0 45º
URT7 2 0 60º
URT8 5 0 60º
URT9 7 0 60º
RT4 2 2 60º
Displacements measured by U1, corresponding to the
sensor placed at 200 mm from the base of the slope are
shown in Fig. 3. Typical variation of displacement with
number of cycles of dynamic loading at different elevations
for tests URT1-URT6 at the end of 40 cycles of sinusoidal
motion is shown in Fig. 4(a). The elevations are normalized
with respect to the height of the slope. Frequency of motion
in these tests ranges from 2 to 16 Hz.
Fig. 3 Variation of displacement recorded by U1 with
number of cycles in test URT2.
It can be clearly seen that slope displacement was
maximum under a frequency of 7 Hz. Horizontal
282
Influence of frequency of seismic shaking on the performance of reinforced soil slopes
displacements are presented after normalizing the elevation
(z) by the total height of the slope (H).To simplify the
presentation of acceleration response of the slope, RMS
acceleration amplification factors (RMSA amplification
factors) are used to represent the acceleration. These factors
are calculated using the root mean square (RMS) method
applied to the acceleration-time history for each
accelerometer device [6]. RMSA amplification factors for
different model slopes at different elevations are presented
in Fig. 4(b). Maximum amplification occurred at the top of
the slope and the acceleration response of the slope
increased with the increase in frequency, until 7 Hz. The
response at 7 Hz is highly amplified and later on decreased
for 10 Hz and again showed increasing trend, exhibiting
maximum response at 16 Hz.
(a) Displacement profiles
(b) RMSA amplification factors
Fig. 4 Response of unreinforced 45° model slopes at
various frequencies after 40 cycles of shaking at 0.3 g.
The effect of frequency on the response of reinforced slopes
is shown in Fig. 5 for tests RT1, RT2 and RT3 carried out
at frequencies of 2, 5 and 7 Hz respectively. All these
slopes are reinforced with two layers of geogrid as
explained earlier. The displacement response increased
from 2Hz – 7 Hz, maximum being at 7 Hz whereas there is
no clear trend in case of acceleration response. These
observations highlight the role of fundamental (resonance)
frequency of the system and the proximity of the base
excitation frequency to this resonance frequency [6].
(a) Displacement profiles
(b) RMSA amplification factors
Fig. 5 Response of 45° reinforced model slopes at various
frequencies after 40 cycles of shaking at 0.3 g.
Fig. 6 compares the normalized face displacements and
RMSA profiles of unreinforced soil slope of 60° at various
frequencies at the end of 40 cycles. It could be observed
that the displacement response is the maximum at 7Hz and
acceleration response is same for 5 Hz and 7 Hz.
Reinforced slope displaced less than that of unreinforced
slope for slope angle of 45° as shown in Fig. 7. In fact the
factor of safety against static failure is as high as 15-20 and
hence the slope does not need any reinforcement for static
stability. The reinforcement provided is helpful for
improving the seismic stability of the slope.
283
N. Srilatha, G. Madhavi Latha, & C.G.Puttappa
(a) Displacement profiles
(b) RMSA amplification factors
Fig. 6 Response of unreinforced 60° model slope at various
frequencies after 40 cycles of shaking at 0.3 g.
Fig. 7(a) Comparison of displacement profiles for
unreinforced and reinforced soil slopes of 45°at 7 Hz.
Fig. 7(b) Comparison of RMSA profiles for unreinforced
and reinforced soil slopes of 45° at 7 Hz.
CONCLUSIONS
The tested model slopes are generally showing maximum
response in terms of displacements and acceleration
amplifications at 7 Hz. These results demonstrate the
importance of fundamental frequency in the designs. This is
true for the reinforced slopes also.
REFERENCES
1. Bathurst, R. J., Hatami, K. & Alfaro, M. C. (2002a)
“Geosynthetic reinforced soil walls and slopes: seismic
Aspects”, Chapter 14, Geosynthetics and their applications (ed. S. K. Shukla), pp. 327–392. London:
Thomas Telford.
2. Lo Grasso, A.S., Maugeri M and Recalcati, P. (2005),
Seismic behaviour of geosynthetic-reinforced slope
with
over load by shaking table tests. Slopes and Retaining structures under r static and seismic Conditions, ASCE
GSP 140, CDROM.
3. Perez, A. (1999), Seismic response of geosynthetic reinforced steep slopes, M.S. Thesis, University of
Washington, USA.
4. Perez, A. and Holtz, R.D. (2004), Seismic response of
reinforced steep soil slopes: results of shaking table
study, Geotechnical Engineering for Transportation Projects, ASCE GSP 126, 1664-1672.
5. Ching - Chuan Huang, Jeng - Chong Horng , Wen-
Jong Chang , Jiunn - Shyang Chiou ,Chia - Han
Chen(2011), Dynamic behavior of reinforced walls –
Horizontal displacement response, Geotextiles and
Geomembranes
29, 257-267.
6. Kramer, S. L. (1996). Geotechnical Earthquake
Engineering, Prentice Hall, Upper Saddle River, NJ.
284