1 BBAA VI International Colloquium on: Bluff Bodies Aerodynamics & Applications Milano, Italy, July, 20-24 2008 INFLUENCE OF HIGHER MODES ON THE DYNAMIC RESPONSE OF IRREGULAR AND REGULAR TALL BUILDINGS Seymour M. J. Spence * , Massimiliano Gioffrè † and Vittorio Gusella † * CRIACIV/Department of Civil and Environmental Engineering (DICeA) University of Florence, via S. Marta, 3, 50139 Firenze, Italy e-mail: [email protected](contact author) † CRIACIV/Department of Civil and Environmental Engineering (DICA) University of Perugia, Via G. Duranti 93, 06125 Perugia, Italy e-mails: [email protected], [email protected]Keywords: Tall Buildings, Structural Response, Time Domain Analysis, Modal Analysis. Abstract. In the present paper the effect of higher mode truncation on the response of tall buildings with both regular and irregular geometric shapes in elevation is investigated together with the probabilistic nature of the global response. Wind tunnel tests using Synchronous Multi-Pressure Sensing System (SMPSS) measurements on two tall buildings, one of irregular geometry and another of regular geometry in elevation, are performed. These measurements were carried out for wind directions covering 360° with 10° increments. The importance of considering higher modes and wind direction when estimating the dynamic response of irregular tall buildings possessing complex 3D modes shapes is investigated and compared to the case of tall buildings with a regular geometric profiles and uncoupled mode shapes. The role played by the background response on the probabilistic nature of global response is also investigated.
Transcript
1
BBAA VI International Colloquium on: Bluff Bodies Aerodynamics & Applications
Milano, Italy, July, 20-24 2008
INFLUENCE OF HIGHER MODES ON THE DYNAMIC RESPONSE OF IRREGULAR AND REGULAR TALL BUILDINGS
Seymour M. J. Spence∗, Massimiliano Gioffrè† and Vittorio Gusella†
∗ CRIACIV/Department of Civil and Environmental Engineering (DICeA) University of Florence, via S. Marta, 3, 50139 Firenze, Italy
Keywords: Tall Buildings, Structural Response, Time Domain Analysis, Modal Analysis.
Abstract. In the present paper the effect of higher mode truncation on the response of tall buildings with both regular and irregular geometric shapes in elevation is investigated together with the probabilistic nature of the global response. Wind tunnel tests using Synchronous Multi-Pressure Sensing System (SMPSS) measurements on two tall buildings, one of irregular geometry and another of regular geometry in elevation, are performed. These measurements were carried out for wind directions covering 360° with 10° increments. The importance of considering higher modes and wind direction when estimating the dynamic response of irregular tall buildings possessing complex 3D modes shapes is investigated and compared to the case of tall buildings with a regular geometric profiles and uncoupled mode shapes. The role played by the background response on the probabilistic nature of global response is also investigated.
1 INTRODUCTION Recent trends in tall building design have seen an ever increasing number of proposals for
buildings with geometrically irregular shapes. However the methods adopted for estimating their response are generally based on theories that where developed considering buildings with regular geometric profiles and uncoupled fundamental mode shapes. In particular, in estimating the dynamic response it is generally deemed sufficient to consider only the first three modes of vibration and a global response characterized by being Gaussian in nature. These hypotheses are particularly useful when the High Frequency Force Balance (HFFB) technique [1,2] is adopted in conjunction with frequency domain dynamic analysis to ascertain the global loads that act on the structure. Indeed the estimate of the generalized forces associated with higher modes involves the use of complex mode corrections [3] which require the knowledge of the effective wind load distribution over the structure which is not available through HFFB measurements. Over the years studies have been carried out with the aim of quantifying the errors committed through mode truncation [4,5,6]. However these investigations are all concerned with alongwind and acrosswind response of regular tall buildings. In the case of irregular geometry, the presence of non-coincident centers of mass and stiffness lead to complex 3D mode shapes, which combined with an irregular geometric profile, can lead to a far greater sensitivity to wind direction.
Furthermore, by working in the frequency domain no knowledge of the probabilistic nature associated with the global response can be obtained. Therefore the peak factors used to estimate the maximum response are calculated considering a parent distribution given a priori.
In this paper SMPSS wind tunnel measurements are carried out on rigid models of both the Bank of China Building, located in Hong Kong, and a regular tall building of the same roof height and square footprint, Fig. (1). For both buildings direct integration of the equations of motion of an equivalent dynamical system is performed [7]. In particular the equivalent dynamical system of the Bank of China Building is calibrated in order to achieve the first three non linear coupled mode shapes and frequencies as determined experimentally for the actual building [8]. The regular building is modeled with the same vertical floor locations and densities as the irregular building. It is also calibrated so as to achieve the same frequencies, with however, quasi linear uncoupled mode shapes due to coincident and vertically aligned centers of mass and stiffness. Higher mode contributions together with the probabilistic nature of various response quantities such as top displacements, shear forces, bending moments, torque and top accelerations are investigated for a full range of wind directions revealing the high sensitivity of the results to the particular wind direction and the strongly non-Gaussian nature of the global response. The relative importance of the background and resonant dynamic responses for dictating the probabilistic features of the global response and their sensitivity to higher mode contributions is also evaluated.
2 ANALYSIS FRAMEWORK 2.1 Dynamic models of the buildings
The global behavior of tall buildings can be modeled by an equivalent dynamical system considering each floor to have three degrees of freedom (i.e. two orthogonal displacements relative to the ground and θ-rotation about a vertical axis). If the centers of mass and stiffness for each floor are coincident and lay on a vertical axis then the building will experience uncoupled vibration modes in three principal directions, two orthogonal translational directions and a rotational direction. However if the centers of mass and stiffness do not comply to the above mentioned conditions the building will, in general, experience 3D coupled modes. By hypothesizing that the principal directions of each floor do not vary over
S. M. J. Spence, M. Gioffrè and V. Gusella
3
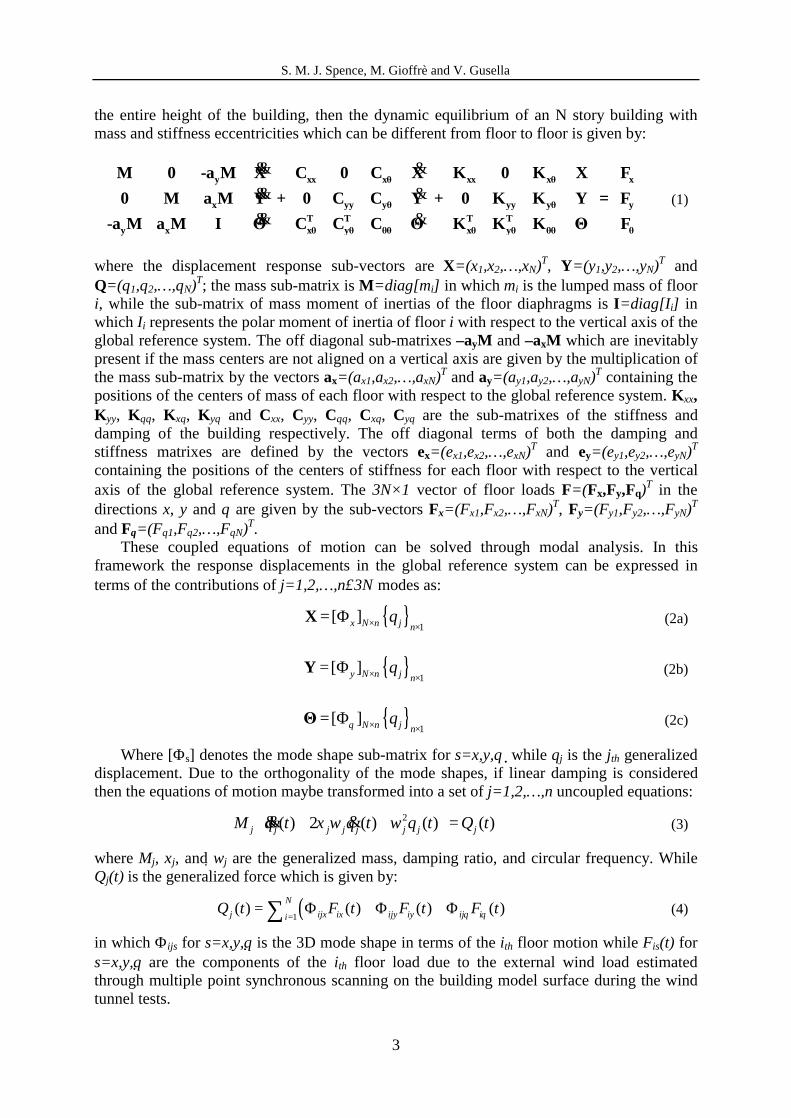
the entire height of the building, then the dynamic equilibrium of an N story building with mass and stiffness eccentricities which can be different from floor to floor is given by:
y xx xθ xx xθ x
x yy yθ yy yθ yT T T T
y x xθ yθ θθ xθ yθ θθ θ
M 0 -a M X C 0 C X K 0 K X F0 M a M Y + 0 C C Y + 0 K K Y = F
-a M a M I Θ C C C Θ K K K Θ F
&& &&& &&& &
(1)
where the displacement response sub-vectors are X=(x1,x2,…,xN)T, Y=(y1,y2,…,yN)T and Θ=(θ1,θ2,…,θN)T; the mass sub-matrix is M=diag[mi] in which mi is the lumped mass of floor i, while the sub-matrix of mass moment of inertias of the floor diaphragms is I=diag[Ii] in which Ii represents the polar moment of inertia of floor i with respect to the vertical axis of the global reference system. The off diagonal sub-matrixes –ayM and –axM which are inevitably present if the mass centers are not aligned on a vertical axis are given by the multiplication of the mass sub-matrix by the vectors ax=(ax1,ax2,…,axN)T and ay=(ay1,ay2,…,ayN)T containing the positions of the centers of mass of each floor with respect to the global reference system. Kxx, Kyy, Kθθ, Kxθ, Kyθ and Cxx, Cyy, Cθθ, Cxθ, Cyθ are the sub-matrixes of the stiffness and damping of the building respectively. The off diagonal terms of both the damping and stiffness matrixes are defined by the vectors ex=(ex1,ex2,…,exN)T and ey=(ey1,ey2,…,eyN)T containing the positions of the centers of stiffness for each floor with respect to the vertical axis of the global reference system. The 3N×1 vector of floor loads F=(Fx,Fy,Fθ)T in the directions x, y and θ are given by the sub-vectors Fx=(Fx1,Fx2,…,FxN)T, Fy=(Fy1,Fy2,…,FyN)T and Fθ=(Fθ1,Fθ2,…,FθN)T.
These coupled equations of motion can be solved through modal analysis. In this framework the response displacements in the global reference system can be expressed in terms of the contributions of j=1,2,…,n≤3Ν modes as:
{ }1
[ ]x N n j nq× ×
= ΦX
(2a)
{ }
1[ ]y N n j n
q× ×= ΦY
(2b)
{ }
1[ ]N n j n
qθ × ×= ΦΘ
(2c)
Where [Φs] denotes the mode shape sub-matrix for s=x,y,θ while qj is the jth generalized displacement. Due to the orthogonality of the mode shapes, if linear damping is considered then the equations of motion maybe transformed into a set of j=1,2,…,n uncoupled equations:
2( ) 2 ( ) ( ) ( )j j j j j j j jM q t q t q t Q tξ ω ω + + = && &
(3)
where Mj, ξj, and ωj are the generalized mass, damping ratio, and circular frequency. While Qj(t) is the generalized force which is given by:
( )1( ) ( ) ( ) ( )N
j ijx ix ijy iy ij iiQ t F t F t F tθ θ=
= Φ + Φ + Φ∑ (4)
in which Φijs for s=x,y,θ is the 3D mode shape in terms of the ith floor motion while Fis(t) for s=x,y,θ are the components of the ith floor load due to the external wind load estimated through multiple point synchronous scanning on the building model surface during the wind tunnel tests.
S. M. J. Spence, M. Gioffrè and V. Gusella
4
Figure 1: Reference systems used for the regular and irregular buildings.
In this study the Bank of China building is considered because of its irregular external geometry and 3D coupled mode shapes. Care was taken to model the equivalent dynamic system in Eq. (1) so as to obtain the same first three natural frequencies of vibration and associate mode shapes as reported in [8]. This was achieved considering the effective number and position of the floors with a building density which varies from 200 kg/m3 at the base to 170 kg/m3 at the top. The mode shapes and associated frequencies are shown in Fig. (2) referred to the global reference system fixed at the geometric centre of the building’s base and shown in Fig. (1). The centers of mass and stiffness of each floor are modeled as coincident which, due to the buildings irregular geometry, do not lay on a vertical axis so causing 3D coupled mode shapes. The regular building assumes the same floor locations and relative densities as the irregular building. However, due to the regular nature, it possesses coincident centers of mass and stiffness, aligned on a vertical axis, resulting in uncoupled fundamental mode shapes as shown in Fig. (3) with respect to the global reference system of Fig. (1). The stiffness matrix was calibrated in order to achieve the same natural frequencies as the irregular building.
2.2 Wind tunnel tests Wind tunnel tests on two 1:500 scale rigid models, one of the Bank of China building and
another of the regular prismatic building, where carried out at the Boundary layer wind tunnel of CRIACIV (Inter-university Research Centre on Buildings Aerodynamics and Wind Engineering) in Prato, Italy, Fig. (1).
The experiments where carried out for a suburban terrain where the power law exponent of the mean wind profile was 2/9. SMPSS measurements were taken using 126 carefully positioned pressure taps located over the models various surfaces. The sampling frequency adopted for the acquisition was 250 Hz for a total of 30s of recoded data. The average wind speed at the top of the model Vm in the wind tunnel during the tests was 20 m/s. These meas-
S. M. J. Spence, M. Gioffrè and V. Gusella
5
-2 -1 00
10
20
30
40
50
60
70Fl
oor N
umbe
r
Mode 1 f=0.3141Hz
XYRot
-2 0 2
0
10
20
30
40
50
60
70
Floo
r Num
ber
Mode 2 f=0.3178Hz
XYRot
-4 -2 0 2
0
10
20
30
40
50
60
70
Floo
r Num
ber
Mode 3 f=0.5049Hz
XYRot
Figure 2: First three mode shapes of the bank of China building and relative frequencies.
0 1 20
10
20
30
40
50
60
70
Floo
r Num
ber
Mode 1 f=0.3141Hz
XYRot
0 1 20
10
20
30
40
50
60
70
Floo
r Num
ber
Mode 2 f=0.3178Hz
XYRot
0 0.5 10
10
20
30
40
50
60
70
Floo
r Num
ber
Mode 3 f=0.5049Hz
XYRot
Figure 3: First three mode shapes of the regular building and relative frequencies.
S. M. J. Spence, M. Gioffrè and V. Gusella
6
urements were repeated with 10° increments from 0° , wind blowing in the global x-direction as shown in Fig. (1), to 360° for a total of 36 wind directions in the case of the Bank of China building while, for the regular building, only increments from 0 to 90° were considered due to the buildings’ symmetry.
The average wind speed at the top of the building at prototype scale Vp was also chosen to be 40 m/s. The prototype sampling frequency was calculated by respecting the similitude on the reduced frequency:
p p pm m m
m p m m p p
n D Dn D DV V t V t V
= ⇒ =∆ ∆
(5)
where n=1/∆t is the sampling frequency and D is a representative geometric dimension. This condition gives a prototype sampling frequency of 1Hz. The translational forces and torques at each floor level are determined by integrating wind pressures within their tributary area. The forces at which there is no pressure tap located are determined by interpolating the story forces acting on two adjacent stories.
2.3 Numerical analysis The response analysis carried out in this study was performed in the time domain, therefore
allowing for the proper evaluation of the complex 3D response given by the 3D coupled mode shapes due to the irregular geometry of the Bank of China building. Indeed, opposed to the frequency domain approach, the time domain approach does not have the need to define correlation coefficients between the various modal responses which, in the case of tall buildings having complex 3D response, are extremely important for its proper prediction [9,10]. Also any probabilistic parameter of interest such as the Root Mean Square (RMS), Skewness, Kurtosis, of the response can be directly determined considering the contribution of any number of modes. Therefore in light of the fact that the focus of this study is on accurately quantifying the effects of mode truncation, and not other approximations, the time domain approach was adopted.
The response time histories are evaluated using the Newmark integration scheme with a time step of 0.025s. This was chosen in order to accurately describe the contribution of the first 15 modes of vibrations. In particular, the 15th vibrational mode has a natural frequency of 2.24Hz which is grater than 2Hz which is generally accepted as the upper limit after which the energy content of wind storms practically vanishes. Therefore adopting a time step of 0.025s ensures a satisfactory representation up to and including the 15th mode. The prototype sampling frequency of the experimental data is however 1Hz. Therefore extra points had to be added in order to perform the integration. This was done by linearly interpolating between the measured values.
3 RESPONSE ANALYSIS
3.1 Effects of mode truncation on the RMS response In order to investigate the effects of mode truncation on the RMS response the following
parameter was considered:
3 15( ) ( )R Rσ θ σ θ (6)
where 3( )σ θR is the RMS of a particular response component R considering only the contribution of the first three modes for a wind direction θ,while 15 ( )σ θR is its counterpart
S. M. J. Spence, M. Gioffrè and V. Gusella
7
considering the contribution of 15 modes. The results are derived from 10 minutes of prototype scale time history.
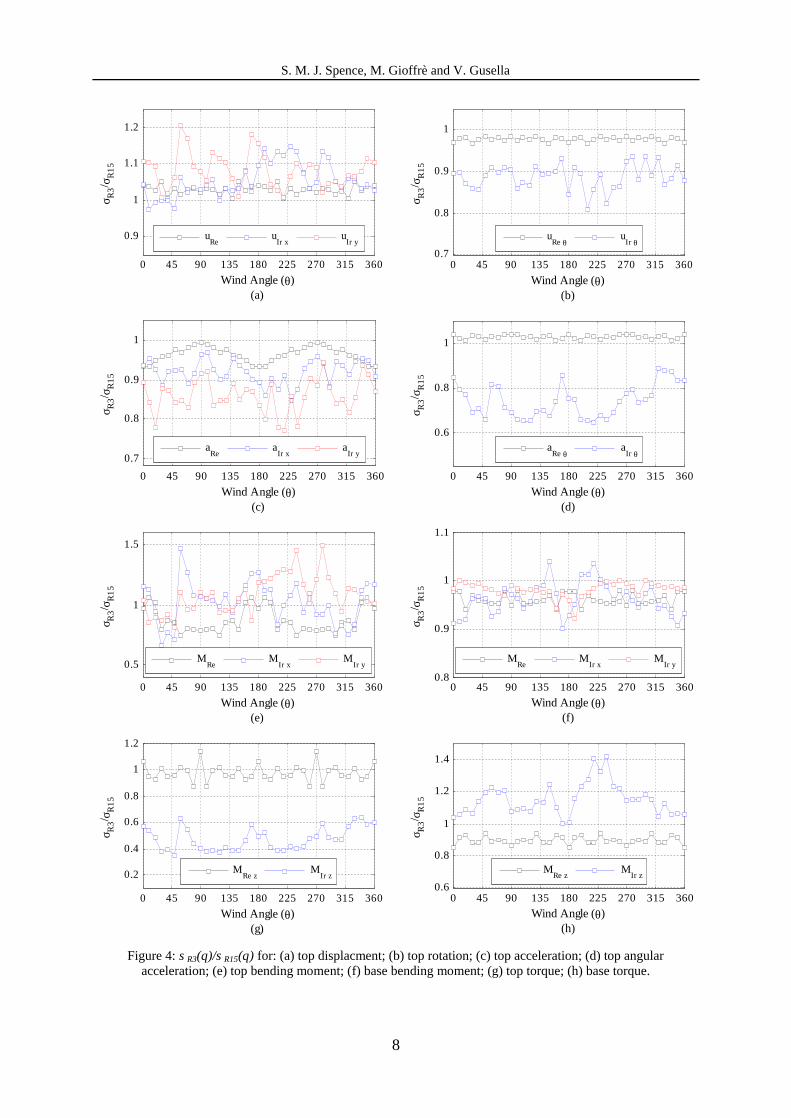
In Figs. (4a–h) the variation of 3 15( ) ( )σ θ σ θR R for the top floor acceleration, top floor displacement, top and base bending moments and torque are shown and compared for both the regular (Re) and irregular (Ir) buildings. The results of this study clearly show the importance of considering the contribution of higher modes to the dynamic response of tall buildings with an irregular geometric profile. Indeed, as can be seen in Fig. (4) the effects of mode truncation for all the response components is far greater in the case of an irregular geometric profile (Ir) if compared to a regular profile (Re).
In the particular case of the top floor acceleration in Fig. (4c), errors of up to 23% can be seen which is over three times what is observed for the regular building. Similar results can be seen for all the other response components. The variable nature of the irregular building response components demonstrates the sensitivity of the effects of mode truncation to wind direction. It is worth noting that for a regular tall building the response is more uniform with the wind direction and that the acrosswind and alongwind responses are the most considerable, Fig. (4c).
It is observed that the higher mode contributions have different effects on different response components. Indeed considering only the first three fundamental modes does not necessarily mean that a response of interest is underestimated as can be clearly seen for the base torque of the irregular building, Fig. (4h), which is overestimated by 42% for a wind direction 240°. This difference in behavior is due to the various modal correlations that exits between the response components and points out the importance of properly describing the modal correlation for tall buildings with complex 3D mode shapes. The particular sensitivity of the torsional response to mode truncation of the irregular building is noteworthy and is summarized in Tab. (1). Indeed the overestimates in the base torque are combined with severe underestimates of up to 65% for the top floor torque. This is far greater than that seen for the regular building. These results show the importance of considering higher mode contributions for properly describing the torsional response of irregular tall buildings. The adequacy of considering only the first three vibration modes in the case of regular geometry is clear and confirms what can be found in literature.
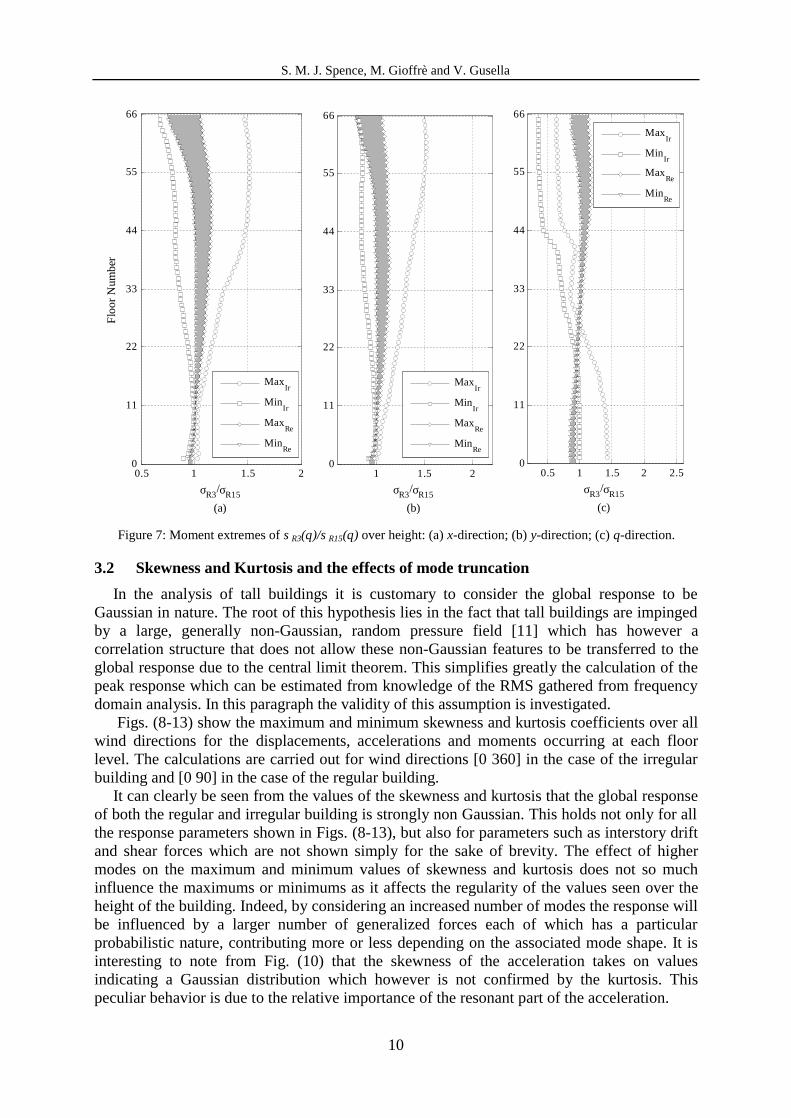
Figs. (5-7) show the variation with height of the maximum and minimum of 3 15( ) ( )σ θ σ θR R for all wind directions. In general, the difference between the responses of
the two buildings tends to decrease towards the base of the structures. However, this is not seen for the torque and rotational response where far greater errors can be observed for all floors Fig. (6c) and Fig. (7c). The bending moments display a tendency to be insensitive to higher mode contributions towards the base of the structure. This is true for both the regular building and the irregular building and highlights the adequacy of the base bending moments in describing the dynamic response of tall buildings. The shear forces display a behavior similar to that seen for the displacements with however greater errors.
Table 1: Influence of higher mode truncation on the torsional response
Top rotation Top angular acceleration Top Torque Base Torque
σR3/σR15 θ° σR3/σR15 θ° σR3/σR15 θ° σR3/σR15 θ°
Max 0.89 320 0.94 310 0.64 340 1.42 240
Min 0.65 220 0.81 210 0.35 50 1.01 170
S. M. J. Spence, M. Gioffrè and V. Gusella
8
0 45 90 135 180 225 270 315 360
0.9
1
1.1
1.2
σ R3/ σ
R15
Wind Angle (θ)(a)
uRe
uIr x
uIr y
0 45 90 135 180 225 270 315 3600.7
0.8
0.9
1
σ R3/ σ
R15
Wind Angle (θ)(b)
uRe θ
uIr θ
0 45 90 135 180 225 270 315 3600.7
0.8
0.9
1
σ R3/ σ
R15
Wind Angle (θ)(c)
aRe
aIr x
aIr y
0 45 90 135 180 225 270 315 360
0.6
0.8
1
σ R3/ σ
R15
Wind Angle (θ)(d)
aRe θ
aIr θ
0 45 90 135 180 225 270 315 360
0.5
1
1.5
σ R3/ σ
R15
Wind Angle (θ)(e)
MRe
MIr x
MIr y
0 45 90 135 180 225 270 315 3600.8
0.9
1
1.1
σ R3/ σ
R15
Wind Angle (θ)(f)
MRe
MIr x
MIr y
0 45 90 135 180 225 270 315 360
0.2
0.4
0.6
0.8
1
1.2
σ R3/ σ
R15
Wind Angle (θ)(g)
MRe z
MIr z
0 45 90 135 180 225 270 315 3600.6
0.8
1
1.2
1.4
σ R3/ σ
R15
Wind Angle (θ)(h)
MRe z
MIr z
Figure 4: σR3(θ)/σR15(θ) for: (a) top displacment; (b) top rotation; (c) top acceleration; (d) top angular
acceleration; (e) top bending moment; (f) base bending moment; (g) top torque; (h) base torque.
S. M. J. Spence, M. Gioffrè and V. Gusella
9
0.5 1 1.50
11
22
33
44
55
66
σR3/σR15(a)
Floo
r Num
ber
MaxIr
MinIr
MaxRe
MinRe
0.6 0.8 1 1.2 1.40
11
22
33
44
55
66
σR3/σR15(b)
MaxIr
MinIr
MaxRe
MinRe
0.8 1 1.2 1.4 1.60
11
22
33
44
55
66
σR3/σR15(c)
MaxIr
MinIr
MaxRe
MinRe
Figure 5: Acceleration extremes of σR3(θ)/σR15(θ) over height: (a) x-direction; (b) y-direction; (c) θ-direction.
0.6 0.8 1 1.2 1.40
11
22
33
44
55
66
σR3/σR15(a)
Floo
r Num
ber
MaxIr
MinIr
MaxRe
MinRe
0.6 0.8 1 1.2 1.4 1.60
11
22
33
44
55
66
σR3/σR15(b)
MaxIr
MinIr
MaxRe
MinRe
0.5 1 1.5 20
11
22
33
44
55
66
σR3/σR15(c)
MaxIr
MinIr
MaxRe
MinRe
Figure 6: Displacement extremes of σR3(θ)/σR15(θ) over height: (a) x-direction; (b) y-direction; (c) θ-direction.
S. M. J. Spence, M. Gioffrè and V. Gusella
10
0.5 1 1.5 20
11
22
33
44
55
66
σR3/σR15(a)
Floo
r Num
ber
MaxIr
MinIr
MaxRe
MinRe
1 1.5 20
11
22
33
44
55
66
σR3/σR15(b)
MaxIr
MinIr
MaxRe
MinRe
0.5 1 1.5 2 2.50
11
22
33
44
55
66
σR3/σR15(c)
MaxIr
MinIr
MaxRe
MinRe
Figure 7: Moment extremes of σR3(θ)/σR15(θ) over height: (a) x-direction; (b) y-direction; (c) θ-direction.
3.2 Skewness and Kurtosis and the effects of mode truncation In the analysis of tall buildings it is customary to consider the global response to be
Gaussian in nature. The root of this hypothesis lies in the fact that tall buildings are impinged by a large, generally non-Gaussian, random pressure field [11] which has however a correlation structure that does not allow these non-Gaussian features to be transferred to the global response due to the central limit theorem. This simplifies greatly the calculation of the peak response which can be estimated from knowledge of the RMS gathered from frequency domain analysis. In this paragraph the validity of this assumption is investigated.
Figs. (8-13) show the maximum and minimum skewness and kurtosis coefficients over all wind directions for the displacements, accelerations and moments occurring at each floor level. The calculations are carried out for wind directions [0 360] in the case of the irregular building and [0 90] in the case of the regular building.
It can clearly be seen from the values of the skewness and kurtosis that the global response of both the regular and irregular building is strongly non Gaussian. This holds not only for all the response parameters shown in Figs. (8-13), but also for parameters such as interstory drift and shear forces which are not shown simply for the sake of brevity. The effect of higher modes on the maximum and minimum values of skewness and kurtosis does not so much influence the maximums or minimums as it affects the regularity of the values seen over the height of the building. Indeed, by considering an increased number of modes the response will be influenced by a larger number of generalized forces each of which has a particular probabilistic nature, contributing more or less depending on the associated mode shape. It is interesting to note from Fig. (10) that the skewness of the acceleration takes on values indicating a Gaussian distribution which however is not confirmed by the kurtosis. This peculiar behavior is due to the relative importance of the resonant part of the acceleration.
S. M. J. Spence, M. Gioffrè and V. Gusella
11
-1 -0.8 -0.6 -0.4 -0.2 0 0.2 0.4 0.6 0.8 1
10
20
30
40
50
60
Floo
r num
ber
(a)
-1 -0.8 -0.6 -0.4 -0.2 0 0.2 0.4 0.6 0.8 1
1020
30
40
50
60
Floo
r num
ber
(b)
-1 -0.8 -0.6 -0.4 -0.2 0 0.2 0.4 0.6 0.8 1
1020
30
40
50
60
Floo
r num
ber
(c)
Figure 8: Maximum and minimum skewness of the displacements (a) x-direction; (b) y-direction (c) θ-direction.
2 2.5 3 3.5 4 4.5 5 5.5 6
1020
30
40
50
60
Floo
r num
ber
(a)
2 2.5 3 3.5 4 4.5 5 5.5 6
1020
30
40
50
60
Floo
r num
ber
(b)
2 2.5 3 3.5 4 4.5 5 5.5 6
10
20
30
40
50
60
Floo
r num
ber
minR15maxR15minI15maxI15minR3maxR3minI3maxI3
(c)
Figure 9: Maximum and minimum kurtosis of the displacements (a) x-direction; (b) y-direction (c) θ-direction.
S. M. J. Spence, M. Gioffrè and V. Gusella
12
-1 -0.8 -0.6 -0.4 -0.2 0 0.2 0.4 0.6 0.8 1
10
20
30
40
50
60
Floo
r num
ber
(a)
-1 -0.8 -0.6 -0.4 -0.2 0 0.2 0.4 0.6 0.8 1
10
20
30
40
50
60
Floo
r num
ber
(b)
-1 -0.8 -0.6 -0.4 -0.2 0 0.2 0.4 0.6 0.8 1
1020
30
40
50
60
Floo
r num
ber
(c)
Figure 10: Maximum and minimum skewness of the accelerations (a) x-direction; (b) y-direction (c) θ-direction.
2 2.5 3 3.5 4 4.5 5 5.5 6
10
20
30
40
50
60
Floo
r num
ber
(a)
2 2.5 3 3.5 4 4.5 5 5.5 6
10
20
30
40
50
60
Floo
r num
ber
(b)
2 2.5 3 3.5 4 4.5 5 5.5 6
10
20
30
40
50
60
Floo
r num
ber
minR15maxR15minI15maxI15minR3maxR3minI3maxI3
(c)
Figure 11: Maximum and minimum kurtosis of the accelerations (a) x-direction; (b) y-direction (c) θ-direction.
S. M. J. Spence, M. Gioffrè and V. Gusella
13
-1 -0.8 -0.6 -0.4 -0.2 0 0.2 0.4 0.6 0.8 1
10
20
30
40
50
60
Floo
r num
ber
(a)
-1 -0.8 -0.6 -0.4 -0.2 0 0.2 0.4 0.6 0.8 1
10
20
30
40
50
60
Floo
r num
ber
(b)
-1 -0.8 -0.6 -0.4 -0.2 0 0.2 0.4 0.6 0.8 1
10
20
30
40
50
60
Floo
r num
ber
(c)
Figure 12: Maximum and minimum skewness of the moments (a) x-direction; (b) y-direction (c) θ-direction.
2 2.5 3 3.5 4 4.5 5 5.5 6
10
20
30
40
50
60
Floo
r num
ber
(a)
2 2.5 3 3.5 4 4.5 5 5.5 6
10
20
30
40
50
60
Floo
r num
ber
minR15maxR15minI15maxI15minR3maxR3minI3maxI3
(b)
2 2.5 3 3.5 4 4.5 5 5.5 6
10
20
30
40
50
60
Floo
r num
ber
(c)
Figure 13: Maximum and minimum kurtosis of the moments (a) x-direction; (b) y-direction (c) θ-direction.
S. M. J. Spence, M. Gioffrè and V. Gusella
14
4 INFLUENCE OF THE BACKGROUND RESPONSE 4.1 Contribution to the RMS of the background response
To study the importance of the background dynamic response the following parameter was considered:
2 23 15 15( ) ( ) ( )Rr Rb Rσ θ σ θ σ θ+ (7)
where σRr3(θ ) is the RMS of a particular response component R considering only the resonant response of the first three modes for a wind direction θ while σRb15(θ) is the background response considering the contribution of the first 15 modes of vibration. The obtained results show that the influence of the background response is significant. Indeed, by considering a full background representation, the errors in the estimation of the dynamic response are dramatically decreased for all response components except the acceleration which has a negligible background contribution. Examples of this behavior are shown in Fig. (14) for the top floor and base torque, top floor displacements and top floor and base shear forces. Similar results are seen for the bending moments. As can be seen the errors are generally reduced to within 10% of the full response considering all 15 modes of vibration in the background response.
4.2 Statistics of the background, resonant and total response Fig (15) shows the skewness and kurtosis estimated on the background, resonant and
totalbase bending moment response (about x) of the irregular building for all wind directions.
0 45 90 135 180 225 270 315 3600.92
0.94
0.96
0.98
1
√(σ R
r32
+ σR
b15
2)/ σ
R15
Wind Angle (θ)(a)
Base Mz
T op Mz
0 45 90 135 180 225 270 315 3600.95
0.96
0.97
0.98
0.99
1
√(σ R
r32
+ σR
b15
2)/ σ
R15
Wind Angle (θ)(b)
ux
uy
uω
0 45 90 135 180 225 270 315 3600.8
0.85
0.9
0.95
1
√(σ R
r32
+ σR
b15
2)/ σ
R15
Wind Angle (θ)(c)
T op Fx
T op Fy
0 45 90 135 180 225 270 315 3600.95
0.96
0.97
0.98
0.99
1
√(σ R
r32
+ σR
b15
2)/ σ
R15
Wind Angle (θ)(d)
Base Fx
Base Fy
Figure 14: Dependency of √(σ2
Rr3(θ)+σ2Rb15(θ))/σR15(θ) on wind direction: (a) top floor and base torque; (b) top
floor displcaements and rotation; (c) top floor shear forces; (d) base shear forces.
S. M. J. Spence, M. Gioffrè and V. Gusella
15
0 50 100 150 200 250 300 350
-1
-0.5
0
0.5
1
angle
γ 3
(a)
0 50 100 150 200 250 300 3502
3
4
5
6
angle
γ 4
TotalBackgroundResonant
(b)
Figure 15: Statistics of the background, resonant, and total response (a) skewness; (b) kurtosis.
What can clearly be seen is that the skewness of the resonant contribution to the base bending moment tends strongly towards values associated with a Gaussian distribution. However this is not the case for the kurtosis of the resonant response which indicates for certain wind directions a significant non-Gaussian nature. This behavior of the resonant response can be seen for other global response components such as the inter-story drift, displacements and shear forces. Indeed it is for this reason that the acceleration, which is dominated by the resonant response, is seen to have a skewness that indicates a Gaussian distribution but a kurtosis that indicates otherwise Figs (10-11). The background response on the other hand shows non-Gaussian features for both the skewness and kurtosis. Similar results as described here for the irregular building can be seen in the case of the regular building.
5 CONCLUSIONS In this paper it was shown that the global response of both regular tall buildings with
uncoupled dynamic systems and irregular tall buildings with coupled dynamic systems are non-Gaussian in nature. This behavior was observed for all important response components including the top floor acceleration, top floor displacements, interstory drift, bending moments, torque and shear forces. Values of the skewness were seen to vary between -1.2 and 1.2 while values of over 5.5 where seen in the case of the kurtosis. It was seen that these results are not affected by higher modes which tend simply to increases the variability of the maximum and minimum skewness and kurtosis experienced over the height of the structure. The skewness of the resonant part of the global response components was seen to tend towards values associated with the Gaussian model. This was not seen however for the kurtosis of the resonant response or for the skewness and kurtosis of the background response.
This study also demonstrated the susceptibility of irregular tall buildings to the influence of higher modes on their response. In particular the top floor acceleration was seen to be very sensitive where errors were tripled if compared to the regular building. Also the importance of
S. M. J. Spence, M. Gioffrè and V. Gusella
16
wind directionality on the errors committed by mode truncation was seen for all response components with the possible exception of the base bending moments. The important role played by the correlation of the modal response was observed by the presence of both over and underestimates sometimes accruing for the same response component by simply varying the incident wind direction or the floor at which the response was being calculated. The particular sensitivity of the torsional response to higher modes was significant with errors of up to 70% in the estimation of the top floor torque. The contribution of the higher modes seems to affect mainly the background response for all components, except the acceleration. In these cases, the error associated with resonant response truncation is found to be confined to within about 10% of the full response.
REFERENCES [1] T. Tschanz, A.G. Davenport. The Base Balance Technique for the Determination of
Dynamic Wind Loads. Journal of Wind Engineering and Industrial Aerodynamics, 13, 1983.
[2] D.W. Boggs, J.A. Peterka. Aerodynamic Model Tests of Tall Buildings, ASCE Journal of Engineering Mechanics, 115, 618–635 2005.
[3] VICKERY P.J., STECKLEY A.C., ISYUMOV N., VICKERY B.J., “The effect of mode shape on the wind induced response of tall buildings”, Proceedings of the 5th United States National Conference on wind engineering, Lubbock, Texas, 1B-41-1B-48, 1985.
[4] E. Simiu. Equivalent static wind loads for tall building design. ASCE Journal of Structural Division, 104, 719-737, 1976.
[5] A. Kareem. Wind-excited response of buildings in higher modes. ASCE Journal of Structural Division, 107, 701-706, 1981.
[6] G. Huang, X. Chen. Wind loads effects and equivalent static wind loads of tall buildings based on synchronous pressure measurements. Engineering Structures, 29, 2641-2653, 2007.
[7] W. Fritz, E. Simiu. (2005). Probabilistic description of tall building response to wind: Database-assisted design, dynamics, and wind directionality effects. Proceedings of ICOSSAR 05, Rome.
[8] Q.S. Li, K. Yang, C.K. Wong, A.P. Jeary. The effect of amplitude-dependent damping on wind-induced vibrations of a super tall building. Journal of Wind Engineering and Industrial Aerodynamics, 91, 1175-1198, 2003.
[9] X. Chen, A. Kareem. Dynamic Wind Effects on Buildings with 3D Coupled Modes: Application of High Frequency Force Balance Measurements. ASCE Journal of Engineering Mechanics, 131, 1115–1125, 2005.
[10] M.F. Huang, C.M. Chan, K.C.S. Kwok, P.A. Hitchcock. Dynamic analysis of wind-induced lateral-torsioanl response of tall buildings with coupled modes. Proceedings of the ICWE12, Cairns, Australia 2007.
[11] M. Gioffrè, V. Gusella, M. Grigoriu. Non-Gaussian Wind Pressure on Prismatic Buildings I: Stochastic Field, Journal of Structural Engineering, ASCE, 127, 981-989, 2001.