A rectangular fluidized bed setup was developed to study the evolution of inlet gas jets located at thedistributor. Experiments were conducted with varying distributor types and bed media to understand themotion of particles and jets in the grid-zone region of a fluidized bed. Particle Image Velocimetry and DigitalImage Analysis were used to quantify the parameters that characterize these jets. A grid-zone phenomeno-logical model was developed to compare these parameters with those available in the literature. It wasdetermined from this study that jet penetration length behavior is consistently different for fluidizationvelocities below and above the minimum fluidization. For velocities above minimum fluidization, jet lengthswere found to increase more rapidly with increase in orifice velocity than for operating conditions belowminimum fluidization.
), Department of Mechanical, USA. Tel.: +1 540 3301760;
Jets contribute considerably to the overall performance of fluidizedbeds by having a significant impact on the rates of heat transfer, masstransfer and reaction processes. The effect of jets on these parametershas been attributed to the promotion of gas–solid contact by particleentrainment inside jets, thereby leading to faster chemical reactions.The region above the distributor base and below the jet penetrationheight is known as the grid-zone. The grid-zone is of particular impor-tance because it is where the oxygen rich jet mixes with the bedmedia. Control of the jet length would enable fluidized bed designersto enhance particle mixing in the grid-zone and prevent gas bypassthrough solids in shallow beds, while knowledge of the jet diameterwould help in predicting the initial bubble size [1]. Hence, jets areused as a reacting medium to control processes such as combustion,gasification, flame reactions, granulation, coating and devolatization,in which the quality of products depends largely on the contactmechanism at the feed [2,3]. Jet shapes are affected by variety ofparameters including particle type, fluidizing medium and distrib-utor characteristics making it a very complex problem to study.
Various mathematical and phenomenological jet models havebeen suggested in the fluidized bed literature. One of the earlieststudies in this area was done by Markhevka et al. [4], which discussesgas flow inside fluidized bed. Donsi et al. [5] developed a mathemat-ical model based on the turbulent jet theory to describe the observed
jet characteristics in a two-dimensional bed. This was furtherextended by Massimilla [6] to a more detailed model which includedmode of discharge, jetting regions, penetration depths, expansionangle, entrainment, bubble size and transport models. Rees et al. [7]developed a phenomenological model based on results frommagneticresonance imaging. Recently, CFD studies on a single jet fluidized bedwere done by Luo et al. [8] and Zhang et al. [9]. A binary jet systemwascomputationally and experimentally studied by Hong et al. [1,10].
Thesemodelswere developed using experimental data fromvariousstudies. Through these studies, experimental correlations have beenreported for jet penetration length [11], jet diameter [7,12], jet angles[12,13] and dead zone shapes [14–16]. However, there were discrep-ancies between the proposed correlations and the experimental data.This may be attributed in part to different measurement techniquesused to quantify parameters as well as a limited range of experimentalvariables and conditions. Grid-zone parameters have beenmeasured byresearchers through techniques such as photographs and visual analysis[9,12,17], pitot tubes [1,5], thermistor probes [14], optical sensors[11,18,19], tracer method [15], X-ray radiography [20] and magneticresonance imaging [7,21]. Due to the differences in measurement tech-niques, definition of the obtained parameters ceases to be consistent.
It has been observed that designers apply results derived frommultiple techniques to understand the dynamics of grid-zone [8,22–24]. Also, the interdependencies of different regions within the grid-zone are seldom studied in a single model. Hence, the motivation forthis study was to develop a comprehensive data set that quantifies theconditions throughout the entire grid-zone for a range of experimen-tal conditions.
Particle Image Velocimetry (PIV) and Digital Image Analysis (DIA)were applied on a two-dimensional fluidized bed to quantify the
123G. Agarwal et al. / Powder Technology 214 (2011) 122–134
effect of fluidization parameters onto three different regions withinthe grid-zone. Both PIV and DIA have been previously applied onfluidized bed systems for multiple applications [25–36], but thesetechniques have not been used to study the grid-zone region withmultiple jets. The grid-zone phenomenological model developed usingthis data was compared, both qualitatively and quantitatively, with themodels present in the literature.
2. Experimental
2.1. Experimental setup
Fig. 1 contains a schematic of the two-dimensional fluidized bedsetup used to investigate the grid-zone dynamics. The bed was 0.76 mhigh and 0.25 m wide with a depth of 12.7 mm. This depth ensuredthe ratio of the bed thickness to particle diameter exceeded ten toavoid particle bridging effects [37]. The bed walls were made of highoptical clarity glass, and a light absorbing black sheet was located onthe back side. The bed was illuminated homogeneously using twohalogen lamps of 500 W each, which were located approximately at45° angle from bed axis. A Flowsense MKII (4 Megapixel) PIV camerawas used to take double frame digital images of the bed. The camerawas controlled through a timer box, and images were stored andprocessed in a computer using Dynamic Studio 3.0 software. The setupwas surrounded by black barriers and curtains to avoid reflections incaptured images.
Air supply was controlled through a 500 SLPM ALICAT (Model #MCR-500SLPM-D/10M) mass flow controller (±(0.4% Reading+0.2%FS)). The air was channeled through a humidifier in order to avoidelectrostatic effects in the bed. Air was then fed into the plenumchamber and injected into the bed through a perforated plate dis-
Table 1Physical properties of tested fluidized bed media.
Particle dp (μm) ρp (kg/m3) Umf (m/s) Geldart group
tributor. A Setra (Model # 264) differential pressure transducer (0–25,000 Pa, ±0.25% FS) was used to measure pressure drop betweenplenum and freeboard. Differential pressure, inlet pressure, inlettemperature and air flow rate data were recorded using a NationalInstruments data acquisition system.
2.2. Test cases
The focus of the testing was to explore the effect of changing theparticle size, particle density, fluidization velocity, orifice diameterand orifice pitch on the grid-zone behavior. Three types of particleswere selected to provide a diameter range of 550 μm to 750 μm anddensity range of 1079 kg/m3 to 2500 kg/m3. As listed in Table 1, thisresulted in particles with Geldart B and D classifications. Ceramic550 μm and glass 550 μm particles have the same diameter, differentdensity, and the same Geldart B classification. Glass 550 μm and glass750 μm particles differ in diameter and Geldart classification but havesame density. Each type of particle was examined using five differenttypes of perforated distributor plates. As listed in Table 2, effects oforifice diameter and orifice pitch were evaluated in this study. Thus,distributor Types A1, A2 and A3 (and similarly Types B1 and B2) havesame orifice diameter but different orifice pitch. Distributor Types Aand B differ in orifice diameter. Distributor Types A1 and B1 weredesigned to have the same total orifice flow area. At same superficialvelocity for Types A1 and B1 distributors, the effect of orifice diametercan be compared at same orifice velocity. The periphery of the orificesis shown in Fig. 2 to be located 1.59 mm from the bed wall aiding inthe optical assessment of jet. Similar orifice arrangements have beenused for optical assessment of jet characteristics in two-dimensionaland semi-cylindrical beds with a flat front wall [1,5,9,10,15,17,38–41].
Table 2Description of perforated distributor plates.
Distributor type do (mm) N (Number of holes) P (m)
124 G. Agarwal et al. / Powder Technology 214 (2011) 122–134
2.3. Measurement techniques
PIV-DIA and differential pressure drop experiments were con-ducted simultaneously to analyze 15 test cases of varying particle anddistributor types. Experimental data was taken starting with the bedat the maximum flow rate, which was approximately two times theminimum fluidization velocity. The flow rate was decreased by 5SLPM and then held constant for 300 s before data acquisition. Dif-ferential pressure drop was analyzed to calculate minimum fluidiza-tion velocity (Umf,2D) for each combination of particle type anddistributor type in the two-dimensional bed. These velocities are listedin Table 3 and compared with minimum fluidization velocities (Umf,3D)calculated for respective particles in a cylindrical fluidized bed setup[42].
2.3.1. Particle Image Velocimetry (PIV)PIV is a non-intrusive optical technique used to quantify velocity
field information of seeding particles suspended in a fluid throughmeasurement of particle displacement over a known time interval.Due to dense media prohibiting laser passage in the bed, a conven-tional PIV technique cannot be used to obtain gas or particle velocities.
Table 3Comparison of experimental minimum fluidization velocities measured for cylindricaland two-dimensional bed test runs. Term in bracket indicates Umf, 2D/Umf, 3D for thecorresponding particle type.
However, PIV can be used to quantify particle velocities near the frontwall. Hence, the bed was homogenously illuminated using halogenlights and bed media was used as seeding particles to quantify itsvelocity field. The camera was located at a distance of 1.0 m from thefront wall which enabled a field-of-view covering the full width andexpanded height of the bed. Magnification factor of this setup ensuresthat each particle occupies approximately 3–4 pixels on a CCD frameof the 4 Mpx PIV camera.
Measurement at each flow rate included 25 double frame imagestaken at a trigger rate of 7.4 Hz. This resulted in measuring theflow field over 3.38 s. Time delay between each pair of double frameimageswas 1 ms. An adaptive correlation techniquewas appliedwherethe interrogation area (IA) for each readingwas iteratively reduced from128×128 pixels to 32×32 pixels in 2 steps. The relative overlap of 25%and the peak validation of 1.2 were applied for PIV analysis.
2.3.2. Digital image processing (DIA)A digital image can be defined as a finite two-dimensional function
(intensity) of discrete spatial coordinates (pixels). 12 bit images werecaptured in these experiments, ranging the pixel intensity levelfrom 0 (for dark regions) to 4095 (for bright regions) for a windowof 2048×2048 pixels.
The main purpose for using DIA in this research was to detect theedges of different regions within the grid-zone. A Prewitt high passfilter was applied to the image mean for edge identification. Prewittfilter excels in estimating horizontal and vertical gradients and ingeneral responded better than other high pass filters like Roberts andSobel.
3. Grid-zone model
3.1. Model description
A phenomenological model was developed for the grid-zone basedon the flow observations from this study and following previous workreported in the literature [7,12,14–16,18,19]. As shown in Fig. 3, the
Fig. 3. Phenomenological model for jets in two-dimensional beds. The grid-zone is divided into three regions: particle moving zone, dead zone and jetting zone.
125G. Agarwal et al. / Powder Technology 214 (2011) 122–134
grid-zone model consists of three sub zones: namely, particle movingzone, dead zone and jetting zone.
The moving zone contains slow moving emulsion particles entrain-ing into the jets. Identification ofmoving zones is pivotal in determiningthe particle circulation volumewithin the grid-zone. As shown in Fig. 3,moving zones are bounded by triangular shaped adjacent dead zones.Estimation of the dead zone size is important to the design andoperation of the fluidized bed gasifiers. While these can pose seriousproblems in highly exothermic reactors, it also affects the fluidizationperformance due to its contribution toward maldistribution [16]. Thejetting zone is the region where the gas issues from the inlet hole andrises up through the bed. Geometrical shape of jets would indicate theamount of oxygen/air percolating from the jets into the emulsion and isa required quantity to study kinetics and dynamics of the bed.
The model proposed in this work assumes the gas coming out ofthe orifice to be linearly expanding until the jet reaches its maximumdiameter. Above this, the jet diameter remains constant until thebubble generates at jet tip. Themodel geometry shown in Fig. 3 demon-strates a reasonable amount of similarity to the phenomenologicalmodel presented by Patrose et al. [18], especially the jetting zonewherethe jets expand linearly from the orifice to a constant diameter.
Jet profiles found in this study can be classified into three systems:namely, isolated, transitional, and interacting. This is similar to thefindings of Hong et al. [1]. However, in the current study this nomen-clature is based on whether the respective moving zones of jets areinteracting with adjacent moving zones. Fig. 4(a)–(c) contains timeaveraged PIV and Prewitt filtered images for the fluidized bed at asuperficial velocity of 0.28 m/s with three different particle types andA2 Type distributor plate. Jet systemswere defined to be isolated if themoving zone of adjacent jets did not mix with each other, as seen inFig. 4(b). In a similar way, interacting jet systemswere observedwhenall the jets in the system have moving zones that intermix withadjacent ones, as seen in Fig. 4(a) and (c). In transitional jet systems,some jets behaved as isolated while others had moving zones that
intermix with adjacent ones. The occurrence of these three systemswas dependent on fluidization velocity, pitch of orifice and particleproperties.
3.2. Description and extraction of geometric parameters
This section discusses the extraction of grid-zone parametersfrom the PIV and Prewitt filtered images. Fig. 5(a) and (b) containsthe PIV and Prewitt filtered image for a close-up of the grid-zoneregion with glass 550 μmparticles. In Fig. 5(b), the intensity of pixelsin the Prewitt filtered image is proportional to solid fraction of thebed in the region. The darkest region in the Prewitt filtered image isthe jetting zone with highest void fraction. Just outside the jettingregion is the particle moving zone, which is seen in Fig. 5(b) as thegrayish/mid intensity area. Between adjacent jets, the highest inten-sity region is occupied by a particle stagnant dead-zone regionwherevelocity vectors from PIV analysis were zero, as seen in Fig. 5(a).
A qualitative description is given below on the techniques to ex-tract parameters from each zone. All parameters from this study wereaverage values based on the 3.38 s time period of image acquisition.
3.2.1. Moving zoneThis zone was observed to have an annular shape in the X–Y cross-
section around the jet, and can be geometrically described by twoparameters defining the minimum and maximum diameter of themoving zone. The minimum moving zone diameter, dm, as defined byHorio et al. [15] is measured along the distributor base in the vicinityof the orifice, as demonstrated in Fig. 5(b) using a Prewitt filteredimage. Themaximummoving zone diameter,Dm, is measured in sameimage as the maximum width of moving zone along the x-axis ofthe bed. In the case of interacting jet system, Dm is simply the pitchbetween distributor orifices, as shown in Fig. 5(b). Another parameterthat may be derived using the above two parameters is the moving
Fig. 4. PIV data superimposed onmean image of acquired images, and Prewitt filter applied on mean image. Test-case of distributor A2 at same fluidization velocity Uf=0.28 m/s forthree particle types exhibiting differing jet systems (a) glass 550 μm, interacting system (b) glass 750 μm, isolated system and (c) ceramic 550 μm, interacting system. Field of view is250 mm wide by 200 mm high.
126 G. Agarwal et al. / Powder Technology 214 (2011) 122–134
zone angle, ω. This represents the half-angle formed between dm andDm, and indicates the expansion of the moving zone annulus.
3.2.2. Dead zoneAs shown in Fig. 5(a), triangular dead zone areas were represented
by near zero velocity regions located in PIV vector images. The deadzone structures were identified by using two parameters: namely, thedead-zone height, Ld, and dead-zone angle, ϕ. The dead zone heightwas determined using the mean PIV image while measuring thedistance from the distributor base to the peak of the dead-zonetriangle where velocity vectors become non-zero. To measure ϕ, a linewas sketched from the edge of dm, along the edge of the moving zonevelocity vectors to intersect with the peak of dead zone. With this, anon-dimensional correlation was derived for dead zone parameters,as shown in Eq. (1)
LdP
=P−dmð Þ2P
tanϕ: ð1Þ
In this model, theminimummoving zone diameter dm, contributesin correlating the dead zone parameters. This was not taken intoaccount in most dead zone studies [7,14,16]. Contribution of dm wasincluded by Horio et al. [15], but the dead zone geometry was sug-gested to be different than the geometry of this model.
3.2.3. Jetting zoneIn this model, three parameters were required to define the
geometry of jetting zone: jet initial angle (θ), jet diameter (Dj) and jetpenetration length (Lj). Jet initial angle is a measure of the rate atwhich the jet expands to its maximum diameter and dictates theparticle entrainment near the orifice. Jet diameter defines the diam-eter of bubble detaching from bed surface [2], and hence is an impor-tant parameter that governs the bubble dynamics above the grid-zoneof fluidized bed. Both of these quantities were measured using aPrewitt filtered image by drawing lines from jet orifice to the max-imum jet diameter locations, as shown in Fig. 5(b).
Jet length is the most widely studied grid-zone parameter in theliteraturewith varying definitions employed to justify itsmeasurement.
Fig. 5. Jets at bottom of A2 distributor plate for test-case with glass 550 μm particles:(a) PIV mean superimposed on mean image of acquired images, (b) application ofPrewitt filter onto mean image.
Fig. 6. Particle entrainment angle versus height above distributor for glass 550 μmparticles in Type A2 distributor at Uf=0.28 m/s for orifices 1, 3 and 5 (counting fromleft). Vertical dashed lines represent jet penetration length of individual orifices andmaximum jet length represents grid-zone length.
127G. Agarwal et al. / Powder Technology 214 (2011) 122–134
The most popular definition is the height at which the initial bubbledetaches from the jet [7,12,19,21]. Raghunathan et al. [43] usedmomen-tum dissipation location as their choice for jet penetration length, andused a periodic jet lengthdefinition to take theunstable upper jet regioninto account. Hong et al. [1] defined jet length asmaximum length fromthe highest point in the jet to the bed bottom.
Entrainment angle values, α, were used to identify the location ofthe jet penetration length. Hereαwas calculated asα = j tan−1 →v=→u
� �j ,
where→v and→u are vertical and horizontal particle velocity vectors in thejet boundaryvicinityobtained frommeanPIVanalysis. Valuesof this angleweremeasuredat thePIV interrogation areas (IA) located at theperipheryof the jets. As shown in Fig. 5(a), the highest point of the jet was locatedat the IA where α reached its minimum value. This IA is representativeof the location at which the particles cease to entrain inside the jet, andthe particle velocity vectors change their direction due to the bubbleformation just above this IA. Height of this IA location above thedistributor base was defined as jet penetration length in this model.Hence, this criterion provides the jet height definition at the locationwhere the bubble detaches from the jet.
Fig. 6 provides the angle of attack variation as a function of heightabove the distributor for the test case with glass 550 μmparticles witha Type A2 distributor plate andUf=0.28 m/s. As evident from the plot,the entrainment angle remains fairly constant along the jet height.This complies with the results of model by Patrose et al. [18].
4. Results and analysis
4.1. General bed fluidization characteristics
Bed fluidization characteristics were largely dependent on particleproperties, fluidization velocity and distributor characteristics. Asexpected, Geldart B particles were observed to be easier to fluidizethan Geldart D 750 μm glass particles. This is evident from the com-parison of the jet penetration for the cases in Fig. 4. For some glass750 μm test cases, uneven jet penetration heights were observed forthe distributor orifices at velocities close to minimum fluidization.Contrary to this, Geldart B particles generated even jet heights forvelocities below and above minimum fluidization.
Jets structures were present at superficial velocities much lowerthan the minimum fluidization velocity of the tested particles. Forexample, the limiting ratio of Uf/Umf at which jets cease to exist wasfound to be 0.35 for all three particles with the B2 distributor plate. Forother distributor plates, jets diminished at superficial velocities higherthan 0.35 Umf.
A permanent jet shapewas found in all test cases. This is consistentwith the criteria proposed by Grace and Lim [44] where permanent jetformation is expected when do/dp≤25.4. Rowe et al. [20] attributedthis finding to the presence of wall structures in two-dimensional bedin comparison to his study done on cylindrical bed where they found astream of bubbles instead.
Gas jets were found to be vertical for Uf/Umfb1.4 ratio. As this ratiowas increased to higher values, some jets were increasingly found tolose their vertical shape and bend toward adjacent jets. For example,jets on either side of the central jet in Fig. 4(c) bend toward the centraljet and lose shape in the upper half. As seen in Fig. 4(c), this distortionin the vertical shape occurred when the height of the central jetbecame much higher than the dead-zone height. This in turn resultedin the moving zone of the central jet influencing the moving zone ofits adjacent smaller jets.
Fig. 8. Maximum moving zone diameter vs. orifice velocity for all distributor test casesof ceramic 550 μm particles. Dotted lines represent the change from an isolated jetsystem to the transitional jet system. Dashed lines represent start of an interacting jetsystem. Experimental uncertainty is ±0.38 mm.
128 G. Agarwal et al. / Powder Technology 214 (2011) 122–134
4.2. Experimental results of grid-zone parameters
4.2.1. Moving zone (dm, Dm and ω)Fig. 7 contains experimental values of the minimum moving zone
diameter, dm, versus orifice velocity, Uo, for all three particle typestested with distributor Types B1 and B2. The value of dm is initially theorifice diameter (do=3mm) and then increases monotonically withUo. Experimental values of dm were not affected by particle density orparticle diameter. A similar trend was observed for distributor TypesA1, A2 and A3 with all three types of bed media. However, the valuesof dm were smaller compared to the Type B test cases. This coincideswith the findings of Horio et al. [15], where the ratio of dm/do wasfound to depend solely on orifice velocity. This is evident from theircorrelation for this ratio.
dmdo
= 4:4 × 10⁻³U1:5o + 1:75 ð2Þ
Eq. (2) correlation is plotted in Fig. 7 along with the confidencelevel of ±35% proposed by Horio et al. [15]. The majority of theexperimental data falls within the range of these limits, except thedata at very low orifice velocities. As seen from Eq. (2), dm convergesto the constant value of 1.75 do in comparison to do observed from thedata for experiments at low orifice velocities.
A plot of the maximum moving zone diameter, Dm, with orificevelocity is shown in Fig. 8 for all test cases with ceramic 550 μmparticles. The value of Dm increases with an increase in Uo until the jetsystems translate from an isolated system to an interacting system. Inthe region of the interacting system, the Dm value becomes equal tothe pitch of the applied distributor plate. Dotted lines represent theend of an isolated jet system and dashed lines represent the start of aninteracting jet system. Regions between the dotted and dashed linesrepresent the transitional jet system.
In an isolated jet system at lower orifice velocities, the Dm increaseswith increase indo (i.e.Dm for a Type Bdistributor is higher thana TypeAdistributor at same orifice velocity). Also in an isolated jet system, for aparticular do (distributor Types A or B), change in orifice pitch (P) doesnot affect Dm. Data in Fig. 8 also indicates that for distributors withhigher orifice pitch, the transitional state begins at higher orificevelocities. In addition, the rangeof orificevelocitieswhere the jet systemremained transitional increases for distributorswithhigher orificepitch.
Fig. 7. Minimum moving zone diameter versus orifice velocity for all three bed mediatested on distributor Type B (do=3 mm). Solid line curve represents correlation ofHorio et al. [15] ‘Eq. (2)’ and dashed line curves show its confidence level. Experimentaluncertainty is ±4%.
Similar to the behavior of dm, theDmwas determined to be independenton particle diameter and particle density.
Fig. 9 provides data on the variation of moving zone angle, ω, withUo for the three media types using distributor Type B. With ω derivedfrom dm and Dm, no effect of particle density or diameter was observedfor the isolated jet systems. The value of ω remains constant for theisolated system with this value being on average 11.5° for distributorType B and 15° for distributor Type A. Hence for a lower orificediameter, the moving zone tends to spread out wider in isolated jetsystems. For transitional and interacting system, the moving zoneangle is the complement of the dead zone angle, ϕ. Thus, ω increaseswith an increase in orifice velocity while ϕ decreases with an increasein orifice velocity. This is further discussed in Section 4.2.2.
4.2.2. Dead zone (Ld and ϕ)A decreasing trend for the dead zone height, Ld, and dead zone angle,
ϕ, was observed with increasing orifice velocities and decreasing orificepitch. The relationship between Ld, P, dm, and ϕ, based on Eq. (1) is
Fig. 9.Moving zone angle,ω versus orifice velocity, Uo for all three bed media on Type Bdistributor plates. Experimental uncertainty is ±0.5°.
129G. Agarwal et al. / Powder Technology 214 (2011) 122–134
plotted inFig. 10. Thedata in Fig. 10 represents tan ϕ for the test cases.Asobserved from the plot, there was no impact of particle density andparticle diameter. Hence thedeadzone shapeswere dependent on P anddm parameters, where dm is dependent on do and Uo (Section 4.2.1).
Ld/P values were found to exist between 0.2 and 1.2 in this study,which compares well with findings of Thorpe et al. [16] predicting itbetween 0.25 and 2 for cylindrical beds. Rees et al. [7] found Ld/Pvalues ranging from 0.5 to 0.9 for cylindrical beds, but in their study dowas used instead of dm in Eq. (1). This might have contributed todecreasing the value of estimated Ld/P parameter. Horio et al. [15]found Ld/P values to be extremely low (0–0.7) because their proposeddead zone shape was flatter than the one observed in this study withthe tip of the triangular structure missing.
Fig. 11. Jetting zone experimental results for glass 550 μm test-case (a) jet initial angle,θ, versus orifice velocity (Experimental uncertainty is ±0.5°) (b) jet diameter versusorifice velocity (Experimental uncertainty is ±0.25 mm).
4.2.3. Jetting zone (θ, Dj and Lj)Fig. 11(a) and (b) contains the trend for jet initial angle, θ, and jet
diameter, Dj, against orifice velocity for glass 550 μm test cases. Thevalue of parameters θ and Dj increased with increase in Uo and do. Theθ values leveled off at higher orifice velocities and reached a constantvalue, whichwas approximately calculated to be 14° for glass particlesand 12° for ceramic particles. No significant influence of changes in P,dp or ρp was observed for jet diameter values. This is consistent withthe findings of Merry et al. [12] and Rees et al. [7], where Dj was foundto be dependent on only Uo and do.
A plot of the jet penetration length, Lj, for glass 750 μm particles isprovided in Fig. 12 for all distributor plates. From this plot, the fol-lowing trends were observed for Lj:
a) Jet length increased with an increase in jet orifice velocity. Thisrate of increase in jet length increased at higher orifice velocities.
b) Comparing results from distributor Types A1 and B1, which havethe exactly same orifice velocities, revealed an increase in jetlength for increased orifice diameter.
c) Increase in orifice pitch among the experiments with the samedistributor Types (A or B) showed a decrease in jet length only athigh orifice velocities. At lower orifice velocities, this differencewas not significant.
d) An increase in media diameter, dp, from 550 μm to 750 μm for testcases with glass particles resulted in a decrease of jet length.However, this also changed the particle classification from GeldartB to D.
e) Decreasing ρp from the test case of glass 550 μm to ceramic 550 μmresulted into an increase in jet length.
Fig. 10. Ratio of dead zone parameters for three bed media and all distributor test cases.
An important point taken from these observations was the changein the jet length behavior at high orifice velocities. After a certainincrease in orifice velocity, the rate of increase in jet length increasesand the dependence on the orifice pitch becomes apparent. Muller etal. [21] also observed a similar behavior for the jets in a cylindrical bedand proposed that this change occurs at a superficial velocity of0.8×Umf flowing through the bed. To confirm this observation, theminimum fluidization velocity (Umf,2D) was calculated for eachcombination of particle type and distributor type in the two-dimensional bed. The orifice velocities corresponding to this Umf,2D
were termed as Uo,mf,2D and are plotted as dashed lines in Fig. 12. Thepresence of these lines corresponds to the location where the jetlength changes its behavior. It was therefore concluded that the jetschange their behavior at the minimum fluidization velocity of theparticles calculated with a particular distributor plate. Thus for veloc-ities above minimum fluidization, the ratio of volume of air per-colating from the jet to the volume of air injected into the fluidizedbed system would be lower than the same ratio calculated at veloc-ities below minimum fluidization.
The Umf,2D calculated for each combination of particle type anddistributor type is listed in Table 3. These are compared with
Fig. 12. Experimental jet penetration length versus orifice velocity for glass 750 μmparticles. Dashed vertical lines represent Uo,mf,2D for respective distributor plate.Experimental uncertainty is ±1.7 mm.
Fig. 13. Experimental minimum moving zone diameter and orifice size ratio (dm/do)versus jet velocity. Correlation of Horio et al. [15] compared with Eq. (3) andexperimental data. Dashed lines represent an estimated confidence level of ±35% forEq. (3).
130 G. Agarwal et al. / Powder Technology 214 (2011) 122–134
minimum fluidization velocities (Umf,3D) calculated for respectiveparticles in a cylindrical fluidized bed setup [42]. The ratio ofUmf,2D/Umf,3D for each test-case of corresponding particle type islisted brackets within Table 3. As observed from the data in Table 3,the value of this ratio decreases with an increase in the orifice pitchand lies within the range of 0.7–0.9. This is similar to the ratioreported by Muller et al. [21] for the change in the jet lengthbehavior in their experimental data. A similar observation wasnoted in an experimental and computational study conducted byDong et al. [45] on the perforated distributors. Thus, it is concludedthat in order to estimate the change in the jet length behavior, theminimum fluidization velocity of the particle must be calculated forthe experimented distributor plate (Umf,2D).
4.3. Correlation development and comparison with published literature
The following section presents the correlations developed for thegrid-zone parameters using the data from this study. As discussed inSection 3.1, due to differences in experimental techniques and setupconfigurations, a direct comparison of these correlations with itscounterparts in literature is bound to produce discrepancies. However,these comparisons are essential to highlight the quantitative depen-dency of grid-zone parameters on the operating conditions of theexperiments.
4.3.1. Minimum moving zone diameter (dm)The correlation developed by Horio et al. [15] in Eq. (2) for dm was
seen in Fig. 7 to not match with the current experimental data at loworifice velocities. This was attributed to the convergence of the dm inthe Horio et al. correlation to 1.75 do instead of do as observed in thecurrent data for low orifice velocities. This convergence criterion wascorrected, and the data was further analyzed using the least-squaremethod to provide the following modified correlation.
dmdo
= 5:737 × 10−3U1:5o + 1: ð3Þ
A comparison of the dm/do experimental data with the correlationslisted in Eqs. (2) and (3) is plotted in Fig. 13. As evident from Fig. 13,the experimental data is well contained within the confidence level ofthe new correlation developed for dm. It is also observed that Eq. (2)over predicts the dm at low orifice velocities. The dependency of the
dm/do parameter on Uo was found to be same for correlations inEqs. (2) and (3) with dm/do∝Uo
1.5. It is also noted that the correlationdeveloped by Horio et al. was based on the experimental data taken atthewall of their fluidized bed setup, and the orifices were located nearthe wall.
4.3.2. Maximum jet diameter (Dj)Themaximum jet diameter was found to depend only on do andUo,
similar to the studies of Merry et al. [12] and Rees et al. [7]. In thestudy by Merry et al., the correlation for their maximum jet diameterwas based on the volume of bubble formed at the tip of an orificeusing the theory of Davidson and Harrison [2]. This correlation is listedin Eq. (4).
Dj = 1:346d0:80 U0:4o g−0:2
: ð4Þ
Rees et al. found this correlation to overestimate their experi-mental jet diameters and proposed a correction factor of 0.45 to bemultiplied to Eq. (4). However, the correlations proposed byMerry etal. and Rees et al. over predicted the jet diameters found in thecurrent study. The reason for this over-prediction can be explainedon the basis of differences in experimental setup configurations. Merryet al. measured jet diameters on a two-dimensional homogenouslyfluidized bedwith a central nozzle, which has different dynamics than aperforated plate based bed. Rees et al. measured jet diameters on acylindrical bed consisting of perforated plate distributor with smallerorifice pitch values than used in this study. This might have caused theinteraction between the jets to follow with an increase in the jetdiameter.
In order to compare the dependency of the experimental Dj onoperating conditions, a correlation was developed and compared withthe correlations of Merry et al. and Rees et al. Assuming that thecontribution from gravitational constant, g, remains the same, thecorrelation developed from the method of least-squares is
Dj = 0:283d0:710 U0:31o g−0:2
: ð5Þ
95% of data lies within ±20% of the estimated correlation value.Rees et al. experimentally determined that Dj∝do
n1 and Dj∝Uon2,
where 0.28≤n1≤1.4 and 0.36≤n2≤0.48. The power of do in Eq. (5)
Fig. 14. Comparison of jet penetration length, Lj correlations for fluidization with glass550 μm particles on Type A distributors (A1, A2 and A3).
131G. Agarwal et al. / Powder Technology 214 (2011) 122–134
is within the range recommended by Rees et al. For the power of Uo,the value in Eq. (5) was found to be slightly lower than the valuesproposed in correlations of Merry et al. and Rees et al. The overallmultiplication factor of 0.283 in Eq. (5) is lower than similar factorslisted in correlations of Merry et al. and Rees et al.
4.3.3. Jet penetration length (Lj)
4.3.3.1. Correlation comparison with data. Table 4 summarizes some ofthe popular and recent correlations for jet length in the literature.These correlations will be compared with the current experimentalresults. Some other correlations for jet length are listed elsewhere[1,11]. Out of the mentioned correlations in Table 4, the Merry (1975)[12] correlation was developed using the experimental results on atwo-dimensional bed with a single nozzle and secondary homoge-nous fluidization. Wen (1982)a [19] and Rees (2006) [7] correlationswere developed based on multiple orifice distributor plates in cylin-drical beds. The Wen (1982)b [19] correlation was developed in asemi-cylindrical bed with a single orifice. The Muller (2009) [21]correlation is based on experimental results using a perforated platewith a single orifice in a cylindrical bed. TheMuller (2009) correlationis valid for Ufb0.7×Umf. The Blake (1990) [46] correlation was devel-oped from statistical analysis of published studies on multiple andsingle orifice distributor plates, using either cylindrical beds or semi-cylindrical beds with a flat front wall.
Blake (1990) and Rees (2006) correlations accounted for depen-dency of the orifice pitch on jet penetration length. Basov (1969) [47]correlationdoesnot account for changes influidization gasproperty andparticle density. Wen et al. [19] developed two correlations dependingon the experimental conditions of atmospheric or high pressure mea-surements, and these are referredwith suffixes a and b respectively. TheWen (1982)a correlation did not account for existence of jet shapesbelow the minimum fluidization velocity. This is contradictory to theresults seen in current study and hence Wen (1982)a correlation wasnot included in this analysis.
Fig. 14 contains a comparison of jet length correlations for fluid-ization cases with glass 550 μm particles using distributor plates withdo=2 mm(i.e., Type A). All correlations show an increase in jet lengthfor increasing orifice velocity. Fig. 14 contains three trends for theRees (2006) correlation for the three distributor plates (A1, A2 andA3) used in this study, showing the effect of decreasing jet lengthwithincrease in pitch from A1 to A3. This confirms with the trends of thecurrent experimental data for velocity aboveminimum fluidization, as
Table 4List of published correlations for jet penetration length (Lj).
Correlation reference Bed type
Basov (1969) [47] 3Da, single jet
Merry (1975) [12] 2Db, single jet
Wen et al. (1982)a [19] 3Da, multiple jets
Wen et al. (1982)b [19] SCc, single jet
Blake et al. (1990) [46] SCc/3Da, single/multiple jets
Rees et al. (2006) [7] 3Da, multiple jets
Muller et al. (2009) [21] 3Da, multiple jets
a Cylindrical bed.b Two-dimensional rectangular bed.c Semi-cylindrical bed with flat front wall.
shown in Fig. 12. As observed in Fig. 14, the Muller (2009) correlationpredicts the minimum length out of all correlations. This correlationwas developed based on data for a single jet with no secondaryfluidization. The presence of a single orifice results in higher orificepitch values, which can be the reason for low predicted jet lengths.The correlations of Blake (1990) and Basov (1969) predict the largestjet lengths.
As seen in Fig. 14, the Wen (1982)b correlation has the largestincrease in jet length with increase in Uo. All other correlations have asimilar and smaller rate of increase in jet length with Uo. This can beattributed to high pressure conditions in Wen (1982)b correlationexperiments. Interestingly, a similar difference was observed in thejet length behavior in the current experimental study both belowand above minimum fluidization velocity criteria, as discussed inSection 4.2.3 and shown in Fig. 15. The minimum fluidization orificevelocity ‘Uo,mf,2D’ corresponding to a particular distributor plate andparticle combination is shown as a dashed vertical line in Fig. 15. Asobserved from the plot, the experimental jet length results followthe Rees (2006), Merry (1975) and Blake (1990) jet length increase
Fig. 15. Comparison of experimental jet penetration length, Lj and publishedcorrelations for fluidization with glass 550 μm particles on Type A distributors (A1,A2 and A3). Vertical dashed lines indicate respective Uo,mf,2D of three test cases.
Fig. 16. Comparison of jet length correlations in Eqs. (6) and (7) with experimental datafor glass 550 μm particles. Vertical dashed lines indicate Uo,mf,2D for Type A distributors(A1, A2 and A3). Eqs. (6) and (7) have standard deviations of 10% and 20% respectively.
Fig. 17. Comparison of jet length correlation in Eq. (6) with correlations published inthe literature for glass 550 μm test cases.
132 G. Agarwal et al. / Powder Technology 214 (2011) 122–134
rate for increase in orifice velocities below Uo,mf,2D but follow the jetlength increase rate of Wen (1982)b correlation for velocities higherthan Uo,mf,2D.
4.3.3.2. Correlation development. Results in the previous sectionsindicate that the jet length increase is dependent on the fluidizationregime. As a result, the fluidization regime for the jet length wasdivided into two orifice velocity ranges:
Range A: (Uo≤Uo,mf,2D) Range where the jet length increases withorifice velocity at a lower rate than Range B and is unaffected bychange in orifice pitch.Range B: (Uo>Uo,mf,2D) Range where the jet length increases withUo at a higher rate than Range A and an increase in orifice pitchdecreases jet length.
Hence, Lj= f(Uo, do,dp, ρp, ρf,μf) in Range A and Lj= f(Uo, do,dp, ρp, ρf,μf, P) in Range B. Instead of parameter P, the parameterAo=Ad/N was chosen to represent the change in orifice pitch [7]. Ahigher value of Ao would correspond to a higher orifice pitch. Insuf-ficient experimental data were measured to quantify the dependen-cy of ρf and μf. As a result, the parameters dp, ρp, ρf and μf werereplaced by Umf=Umf, 3D to represent combined properties of fluid-izing gas and bed media. Following the work of Blake et al. [46] andRees et al. [7], the non dimensional Froude numbers were developedusing the g, do, Uo and Umf quantities. Using these parameters, thefollowing correlations were developed:
Range A :Uo ≤Uo;mf ;2DLjdo
= 0:68U2o
gdo
!0:28 U2mf
gdo
!−0:54
ð6Þ
Range B :Uo >Uo;mf ;2DLjdo
= 0:44U2o
gdo
!0:43 U2mf
gdo
!−0:54d2oAo
!0:20: ð7Þ
The correlation given by Eq. (6) has a standard deviation of 10%while the standard deviation is 20% for Eq. (7) due to the scatter in thedata in Range B.
These correlations indicate that Lj is directly proportional to do andUo but is inversely proportional to Umf. Furthermore, consistent withthe data, the power dependence of Uo is higher for Range B (Lj∝Uo
0.86)than Range A (Lj∝Uo
0.56). Effect of particle type is included in the
correlations through the values of Umf. With Lj∝Umf−1.08 for both
Eqs. (6) and (7), the effect of particle type remains constant for thetwo correlations as expected. Inverse dependencies on Umf account forlower jet lengths in those systems which are difficult to fluidize.Eq. (7) gives Lj∝Ao
−0.20 suggesting that Lj decreases for higher orificepitch for Range B.
Fig. 16 contains a plot of correlations given by Eqs. (6) and (7) withthe experimental data of glass 550 μm and distributor Types A1, A2and A3. Vertical dashed lines represent corresponding Uo,mf,2D. Theplot contains three predictions of jet length using Eq. (7) for eachdistributor plate due to the Ao parameter, which shows the effect oforifice pitch. The plot indicates a favorable trend for Eq. (6) with all ofthe experimental data points where the orifice velocity is smaller thanUo,mf,2D. The Eq. (7) correlation was able to capture the trend for TypesA1 and A2 distributor plates, but there was a significant deviationwith the comparison of Type A3. Due to a lack of data points and highscatter of data for distributor Type A3, there was ±40% deviation
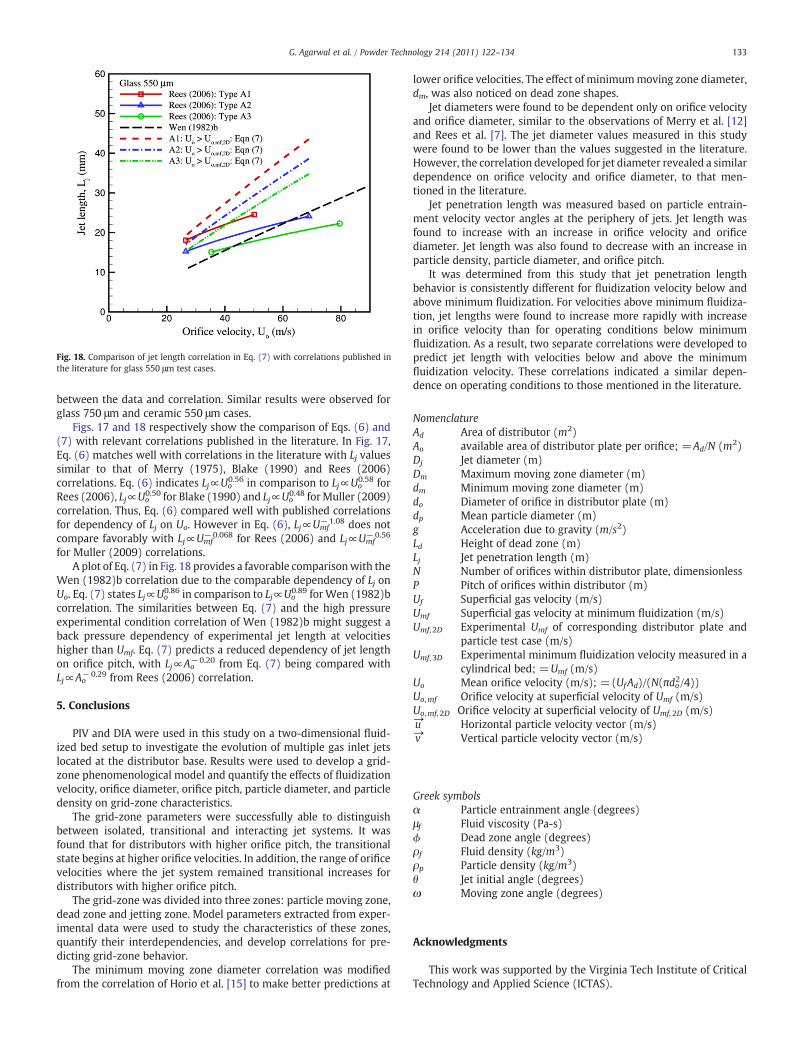
Fig. 18. Comparison of jet length correlation in Eq. (7) with correlations published inthe literature for glass 550 μm test cases.
133G. Agarwal et al. / Powder Technology 214 (2011) 122–134
between the data and correlation. Similar results were observed forglass 750 μm and ceramic 550 μm cases.
Figs. 17 and 18 respectively show the comparison of Eqs. (6) and(7) with relevant correlations published in the literature. In Fig. 17,Eq. (6) matches well with correlations in the literature with Lj valuessimilar to that of Merry (1975), Blake (1990) and Rees (2006)correlations. Eq. (6) indicates Lj∝Uo
0.56 in comparison to Lj∝Uo0.58 for
Rees (2006), Lj∝Uo0.50 for Blake (1990) and Lj∝Uo
0.48 forMuller (2009)correlation. Thus, Eq. (6) compared well with published correlationsfor dependency of Lj on Uo. However in Eq. (6), Lj∝Umf
−1.08 does notcompare favorably with Lj∝Umf
−0.068 for Rees (2006) and Lj∝Umf−0.56
for Muller (2009) correlations.A plot of Eq. (7) in Fig. 18 provides a favorable comparisonwith the
Wen (1982)b correlation due to the comparable dependency of Lj onUo. Eq. (7) states Lj∝Uo
0.86 in comparison to Lj∝Uo0.89 for Wen (1982)b
correlation. The similarities between Eq. (7) and the high pressureexperimental condition correlation of Wen (1982)b might suggest aback pressure dependency of experimental jet length at velocitieshigher than Umf. Eq. (7) predicts a reduced dependency of jet lengthon orifice pitch, with Lj∝Ao
−0.20 from Eq. (7) being compared withLj∝Ao
−0.29 from Rees (2006) correlation.
5. Conclusions
PIV and DIA were used in this study on a two-dimensional fluid-ized bed setup to investigate the evolution of multiple gas inlet jetslocated at the distributor base. Results were used to develop a grid-zone phenomenological model and quantify the effects of fluidizationvelocity, orifice diameter, orifice pitch, particle diameter, and particledensity on grid-zone characteristics.
The grid-zone parameters were successfully able to distinguishbetween isolated, transitional and interacting jet systems. It wasfound that for distributors with higher orifice pitch, the transitionalstate begins at higher orifice velocities. In addition, the range of orificevelocities where the jet system remained transitional increases fordistributors with higher orifice pitch.
The grid-zone was divided into three zones: particle moving zone,dead zone and jetting zone. Model parameters extracted from exper-imental data were used to study the characteristics of these zones,quantify their interdependencies, and develop correlations for pre-dicting grid-zone behavior.
The minimum moving zone diameter correlation was modifiedfrom the correlation of Horio et al. [15] to make better predictions at
lower orifice velocities. The effect of minimummoving zone diameter,dm, was also noticed on dead zone shapes.
Jet diameters were found to be dependent only on orifice velocityand orifice diameter, similar to the observations of Merry et al. [12]and Rees et al. [7]. The jet diameter values measured in this studywere found to be lower than the values suggested in the literature.However, the correlation developed for jet diameter revealed a similardependence on orifice velocity and orifice diameter, to that men-tioned in the literature.
Jet penetration length was measured based on particle entrain-ment velocity vector angles at the periphery of jets. Jet length wasfound to increase with an increase in orifice velocity and orificediameter. Jet length was also found to decrease with an increase inparticle density, particle diameter, and orifice pitch.
It was determined from this study that jet penetration lengthbehavior is consistently different for fluidization velocity below andabove minimum fluidization. For velocities above minimum fluidiza-tion, jet lengths were found to increase more rapidly with increasein orifice velocity than for operating conditions below minimumfluidization. As a result, two separate correlations were developed topredict jet length with velocities below and above the minimumfluidization velocity. These correlations indicated a similar depen-dence on operating conditions to those mentioned in the literature.
NomenclatureAd Area of distributor (m2)Ao available area of distributor plate per orifice; =Ad/N (m2)Dj Jet diameter (m)Dm Maximum moving zone diameter (m)dm Minimum moving zone diameter (m)do Diameter of orifice in distributor plate (m)dp Mean particle diameter (m)g Acceleration due to gravity (m/s2)Ld Height of dead zone (m)Lj Jet penetration length (m)N Number of orifices within distributor plate, dimensionlessP Pitch of orifices within distributor (m)Uf Superficial gas velocity (m/s)Umf Superficial gas velocity at minimum fluidization (m/s)Umf, 2D Experimental Umf of corresponding distributor plate and
particle test case (m/s)Umf, 3D Experimental minimum fluidization velocity measured in a
cylindrical bed; =Umf (m/s)Uo Mean orifice velocity (m/s); =(UfAd)/(N(πdo2/4))Uo,mf Orifice velocity at superficial velocity of Umf (m/s)Uo,mf, 2D Orifice velocity at superficial velocity of Umf, 2D (m/s)→u Horizontal particle velocity vector (m/s)→v Vertical particle velocity vector (m/s)
Greek symbolsα Particle entrainment angle (degrees)μf Fluid viscosity (Pa-s)ϕ Dead zone angle (degrees)ρf Fluid density (kg/m3)ρp Particle density (kg/m3)θ Jet initial angle (degrees)ω Moving zone angle (degrees)
Acknowledgments
This work was supported by the Virginia Tech Institute of CriticalTechnology and Applied Science (ICTAS).
134 G. Agarwal et al. / Powder Technology 214 (2011) 122–134
References
[1] R.Y. Hong, Q.J. Guo, G.H. Luo, J.Y. Zhang, J. Ding, On the jet penetration height influidized beds with two vertical jets, Powder Technology 133 (2003) 216–227.
[2] J.F. Davidson, R. Clift, D. Harrison, Fluidization, Academic Press, London; Orlando,1985.
[3] D. Kunii, O. Levenspiel, Fluidization Engineering, Butterworth-Heinemann,Boston, 1991.
[4] V.I. Markhevka, V.A. Basov, T.Kh. Melik-Akbnazarov, D.I. Orochko, The flow of a gasjet into a fluidized Bed, Theoretical Foundations of Chemical Engineering 5 (1971)80–85.
[5] G. Donsi, L. Massimilla, L. Colantuoni, The dispersion of axi-symmetric gas jets influidized bed, in: J.R. Grace, J.M. Matsen (Eds.), Fluidization, Plenum Press, NewYork, 1980, pp. 297–304.
[6] L. Massimilla, Gas jets in fluidized beds, in: J.F. Davidson, R. Clift, D. Harrison(Eds.), Fluidization, Academic Press, London; Orlando, 1985, p. 133.
[7] A.C. Rees, J.F. Davidson, J.S. Dennis, P.S. Fennell, L.F. Gladden, A.N. Hayhurst, et al.,The nature of the flow just above the perforated plate distributor of a gas-fluidisedbed, as imaged using magnetic resonance, Chemical Engineering Science 61(2006) 6002–6015.
[8] C.H. Luo, K. Aoki, S. Uemiya, T. Kojima, Numerical modeling of a jetting fluidizedbed gasifier and the comparison with the experimental data, Fuel ProcessingTechnology 55 (1998) 193–218.
[9] K. Zhang, H. Zhang, J. Lovick, J.Y. Zhang, B.J. Zhang, Numerical computation andexperimental verification of the jet region in a fluidized bed, Industrial andEngineering Chemistry Research 41 (2002) 3696–3704.
[10] H. Ruoyo, L. Hongzhong, C. Maoyu, Z. Jiyu, Numerical simulation and verificationof a gas–solid jet fluidized bed, Powder Technology 87 (1996) 73–81.
[11] T. Kimura, K. Horiuchi, T. Watanabe, M. Matsukata, T. Kojima, Experimental-studyof gas and particle behavior in the grid zone of a jetting fluidized-bed cold model,Powder Technology 82 (1995) 135–143.
[12] J.M.D. Merry, Penetration of vertical jets into fluidized-beds, AICHE Journal 21(1975) 507–510.
[14] C.Y. Wen, R. Krishnan, R. Khosravi, S. Dutta, Dead zone heights near the grid offluidised beds, in: J.F. Davidson, D.L. Keairns (Eds.), Fluidization: Proceedings ofthe Second Engineering Foundation Conference, Cambridge University Press,Cambridge; New York, 1978, pp. 32–37.
[15] M. Horio, H. Kiyota, I. Muchi, Particle movement on a perforated plate distributorof fluidized-bed, Journal of Chemical Engineering of Japan 13 (1980) 137–142.
[16] R.B. Thorpe, J.F. Davidson, M. Pollitt, J. Smith, Maldistribution in fluidized beds,Industrial and Engineering Chemistry Research 41 (2002) 5878–5889.
[17] Q.J. Guo, G.X. Yue, Z.Y. Liu, Gas discharge patterns in a large jetting fluidized bedwith a vertical nozzle, Industrial and Engineering Chemistry Research 40 (2001)3689–3696.
[18] B. Patrose, H.S. Caram, The mechanics of particle motion in a grid jet, in: G.E.Klinzing (Ed.), AIChE Symposium Series; No. 241, American Institute of ChemicalEngineers, San Francisco: New York, N.Y., 1984, pp. 48–56.
[19] C.Y. Wen, N.R. Deole, L.H. Chen, A study of jets in a 3-dimensional gas-fluidizedbed, Powder Technology 31 (1982) 175–184.
[20] P.N. Rowe, H.J. Macgillivray, D.J. Cheesman, Gas-discharge from an orifice into agas-fluidized bed, Transactions of the Institution of Chemical Engineers 57 (1979)194–199.
[21] C.R. Müller, D.J. Holland, J.F. Davidson, J.S. Dennis, L.F. Gladden, A.N. Hayhurst,et al., Geometrical and hydrodynamical study of gas jets in packed and fluidizedbeds using magnetic resonance, Canadian Journal of Chemical Engineering 87(2009) 517–525.
[22] T. Kimura, T. Kojima, Numerical model for reactions in a jetting fluidized bed coalgasifier, Chemical Engineering Science 47 (1992) 2529–2534.
[23] J. Bi, C. Luo, K.-i. Aoki, S. Uemiya, T. Kojima, A numerical simulation of a jettingfluidized bed coal gasifier, Fuel 76 (1997) 285–301.
[24] F. Okasha, M. Miccio, Modeling of wet jet in fluidized bed, Chemical EngineeringScience 61 (2006) 3079–3090.
[25] K.S. Lim, P.K. Agarwal, B.K. Oneill, Measurement and modeling of bubbleparameters in a 2-dimensional gas-fluidized bed using image-analysis, PowderTechnology 60 (1990) 159–171.
[26] S.J.L. Rix, D.H. Glass, C.A. Greated, Preliminary studies of elutriation from gas-fluidised beds using particle image velocimetry, Chemical Engineering Science 51(1996) 3479–3489.
[27] G.R. Duursma, D.H. Glass, S.J.L. Rix, M.I. Yorquez-Ramirez, PIV investigations offlow structures in the fluidised bed freeboard region, Powder Technology 120(2001) 2–11.
[28] M.J.V. Goldschmidt, J.M. Link, S. Mellema, J.A.M. Kuipers, Digital image analysismeasurements of bed expansion and segregation dynamics in dense gas-fluidisedbeds, Powder Technology 138 (2003) 135–159.
[29] G.A. Bokkers, M.V.S. Annaland, J.A.M. Kuipers, Mixing and segregation in abidisperse gas–solid fluidised bed: a numerical and experimental study, PowderTechnology 140 (2004) 176–186.
[30] L.H. Shen, F. Johnsson, B. Leckner, Digital image analysis of hydrodynamics two-dimensional bubbling fluidized beds, Chemical Engineering Science 59 (2004)2607–2617.
[31] D. Santana, S. Nauri, A. Acosta, N. Garcia, A. Macias-Machin, Initial particle velocityspatial distribution from 2-D erupting bubbles in fluidized beds, PowderTechnology 150 (2005) 1–8.
[32] C.N. Lim, M.A. Gilbertson, A.J.L. Harrison, Bubble distribution and behaviour inbubbling fluidised beds, Chemical Engineering Science 62 (2007) 56–69.
[33] W. Dijkhuizen, G.A. Bokkers, N.G. Deen, M.V. Annaland, J.A.M. Kuipers, Extensionof PIV for measuring granular temperature field in dense fluidized beds, AICHEJournal 53 (2007) 108–118.
[34] C.R. Muller, J.F. Davidson, J.S. Dennis, A.N. Hayhurst, A study of the motion anderuption of a bubble at the surface of a two-dimensional fluidized bed usingparticle image velocimetry (PIV), Industrial and Engineering Chemistry Research46 (2007) 1642–1652.
[35] J.A. Laverman, I. Roghair, M.V. Annaland, H. Kuipers, Investigation into thehydrodynamics of gas–solid fluidized beds using particle image velocimetrycoupled with digital image analysis, Canadian Journal of Chemical Engineering 86(2008) 523–535.
[36] C.R. Muller, G. Hartung, J. Hult, J.S. Dennis, C.F. Kaminski, Laser diagnosticinvestigation of the bubble eruption patterns in the freeboard of fluidized beds:simultaneous acetone PLIF and stereoscopic PIV measurements, AICHE Journal 55(2009) 1369–1382.
[37] J.R. Grace, Agricola aground: characterization and interpretation of fluidizationphenomena, in: A.W. Weimer (Ed.), AIChE Symposium Series; No. 289, AmericanInstitute of Chemical Engineers, Los Angeles: New York, N.Y., 1992, pp. 1–16.
[38] T.M. Knowlton, I. Hirsan, Fluidization, in: J.R. Grace, J.M. Matsen (Eds.),International Fluidization, Conference, Plenum Press, New York, 1980, p. 315.
[39] W.-C. Yang, D.L. Keairns, Solid entrainment rate into gas and gas–solid, two-phasejets in a fluidized bed, Powder Technology 33 (2010) 89–94.
[40] Q. Guo, G. Yue, J. Zhang, Z. Liu, Hydrodynamic characteristics of a two-dimensionaljetting fluidized bed with binary mixtures, Chemical Engineering Science 56(2001) 4685–4694.
[41] M. Tsukada, M. Horio, Gas motion and bubble formation at the distributor of afluidized bed, Powder Technology 63 (1990) 69–74.
[42] J. Chodak, Pyrolysis and hydrodynamics of fluidized bed media, University Libraries,Virginia Polytechnic Institute and State University, Blacksburg, Va, 2010, Availablefrom: http://scholar.lib.vt.edu/theses/available/etd-05172010-091509/.
[43] K. Raghunathan, H. Mori, W.B. Whiting, A technique for measurement of jetpenetration in hot fluidized beds with a modified pitot-tube probe, Industrial andEngineering Chemistry Research 27 (1988) 1011–1016.
[44] J.R. Grace, C.J. Lim, Permanent jet formation in beds of particulate solids, CanadianJournal of Chemical Engineering 65 (1987) 160–162.
[45] S. Dong, C. Cao, C. Si, Q. Guo, Effect of perforated ratios of distributor on thefluidization characteristics in a gas–solid fluidized bed, Industrial and EngineeringChemistry Research 48 (2008) 517–527.
[46] T.R. Blake, H. Webb, P.B. Sunderland, The nondimensionalization of equationsdescribing fluidization with application to the correlation of jet penetrationheight, Chemical Engineering Science 45 (1990) 365–371.
[47] V.A. Basov, V.I. Markhevka, T.K. Melik-Akhnazarov, Investigation of the structureof nonuniform fluidized bed, International Chemical Engineering 9 (1969)263–266.