*Author to whom all correspondence and reprint requests should be addressed.
Influence of Operating Conditionsand Vessel Size on Oxygen Transfer
During Cellulase Production
DANIEL J. SCHELL,* JODY FARMER, JENNY HAMILTON,BOB LYONS, JAMES D. MCMILLAN, JUAN C. SÁEZ,
AND ARUN THOLUDUR
National Renewable Energy Laboratory, 1617 Cole Boulevard,Golden, CO 80401, E-mail: [email protected]
AbstractThe production of low-cost cellulase enzyme is a key step in the develop-
ment of an enzymatic-based process for conversion of lignocellulosic bio-mass to ethanol. Although abundant information is available on cellulaseproduction, little of this work has examined oxygen transfer. We investi-gated oxygen transfer during the growth of Trichoderma reesei, a cellulase-producing microorganism, on soluble and insoluble substrates in vessel sizesfrom 7 to 9000 L. Oxygen uptake rates and volumetric mass transfer coeffi-cients (kLa) were determined using mass spectroscopy to measure off gascomposition. Experimentally measured kLa values were found to comparefavorably with a kLa correlation available in the literature for a non-Newtonian fermentation broth during the period of heavy cell growth.
Index Entries: Oxygen transfer; mass transfer coefficient; cellulase; cellu-lose; ethanol.
Introduction
A key step in the production of ethanol from lignocellulosic biomassis converting cellulose to sugars prior to fermentation of these sugars toethanol. One promising technology being considered for this process isbased on using cellulase. Cellulase is a multicomponent enzyme systemthat can effectively hydrolyze cellulose to glucose. Cellulase is typicallyproduced by submerged cultivation using the fungus Trichoderma reesei.This aerobic microorganism requires good oxygen transfer to achieve goodgrowth and subsequent production of cellulase. Although some informa-tion is available on the influence of operating conditions (e.g., agitation and
628 Schell et al.
Applied Biochemistry and Biotechnology Vol. 91–93, 2001
aeration rates) on cellulase production (1–3), little of this work has specifi-cally examined oxygen transfer rates (OTRs). The usual approach is tomaintain the dissolved oxygen (DO) concentration above 20% air satura-tion by manipulating agitation and aeration rates or by increasing the oxy-gen concentration in the sparge air.
Cellulase cultivations are non-Newtonian because of the hyphal-fun-gal morphology and the high concentrations of solid substrates sometimesused in these cultivations. Researchers have investigated oxygen transferin non-Newtonian fungal cultivations (4–6), during production of highlyviscous polysaccharides (e.g., xanthan gum) (7,8) or in the presence of sol-ids (9). Schugerl (10) reviewed the many mechanisms by which high viscos-ity unfavorably influences mixing and oxygen transfer. With increasingviscosity higher power inputs are required to achieve similar levels ofmixing, gas/liquid interfacial area is reduced because of increasing bubblesize, gas/liquid interfacial area is reduced by bubble coalescence, stirringefficiency is reduced because the impeller is more easily flooded, the resi-dence time of large bubbles decreases, and the mass transfer coefficient k
Ldecreases.
OTRs or oxygen uptake rates (OURs) have been measured andreported by many researchers. OTRs are determined by vessel-operatingconditions (e.g., agitation and aeration rates, viscosity), and OURs are ameasure of the oxygen utilization rate of the microorganisms. OTR equalsOUR at steady state. Atkinson and Mavituna (11) summarized OTR dataobtained in both small and large vessels using a variety of different meth-ods (e.g., sulfite oxidation, oxygen balance, or biologic outgassing). In gen-eral, values reported using the sulfite method are higher than valuesreported by other methods (11); that is, the sulfite method overpredictsOTR for biologic systems. In small bioreactors (<100 L), the reported sulfitevalues range from 50 to 500 mol/(L·h). For measurements performed insmall bioreactors on active biologic systems (i.e., using oxygen balancetechnique or biologic outgassing), OURs as high as 140 mmol/(L·h) arereported. OURs up to 22 mmol/(L·h) are reported for 20,000- to 42,000-Lbioreactors, also determined using biologic systems.
In more recent studies, an OUR of 30–35 mmol/(L·h) was measured ina 2-L vessel (1.3-L working volume, 730 rpm, 0.31 vessel volumes/min[vvm]) for a bacterial fermentation (12). In a vessel configuration very simi-lar to the 1500-L fermentor used in the present study (see Materials andMethods), Junker et al. (13) measured OURs of 28–50 mmol/(L·h) depend-ing on impeller type in an 800-L vessel (600-L working volume, 200 and275 rpm, 0.37–0.83 vvm) during a Streptomyces cultivation. The best perfor-mance (50 mmol/[L·h]) was obtained with downward-pumping, LightninA315 impellers (tank diameter to impeller diameter ratio [T/D] of 2.0), andthe worst performance (28 mmol/[L·h]) was obtained with the ProchemMaxflo T impellers (T/D = 2.3). Rushton impellers (T/D = 2.7) achieved41 mmol/(L·h) and Prochem Maxflo T impellers (T/D = 2.0) achieved40 mmol/(L·h). Amanullah et al. (14) studied oxygen transfer during a
Influence of Operating Conditions 629
Applied Biochemistry and Biotechnology Vol. 91–93, 2001
xanthan gum fermentation in a 6-L bioreactor equipped with three Rushtonimpellers (T/D = 2.0). Agitation and aeration rates were held at 1000 rpmand 0.5 vvm, respectively, and DO concentration was maintained at 20%of air saturation by supplementation with oxygen. Typical OURs rangedfrom 5 to 14 mmol/(L·h). In another study, Amanullah et al. (15) used a150-L bioreactor to investigate the effect of impeller type on oxygen trans-fer during a xanthan gum fermentation. Aeration rate was fixed at 0.5 vvmand agitation speed was varied to maintain DO above 15% of air saturation.OUR values up to approx 10 mmol/(L·h) were measured and the best per-formance was obtained using a Prochem Maxflo T impeller.
In a fungal cultivation to produce xylanase from 2% birch wood xylan(similar to cellulase production using a solid substrate), Hog et al. (16)measured OURs up to 25 mmol/(L·h) in a 15-L vessel (10-L working vol-ume, 200 rpm, 1.0 vvm). Lejeune and Baron (2) performed cellulase produc-tion using T. reesei QM 9414 in a 20-L vessel (15-L working volume,130–400 rpm, 0.2 vvm) on a 1% (w/v) Avicel medium. Although OURswere not directly measured, carbon dioxide evolution rates (CERs) weremeasured and should be nearly equal to OURs during aerobic metabolism.A maximum CER of 8 mmol/(L·h) was measured at an agitation rate of300 rpm. Marten et al. (3) performed cellulase production using T. reeseiRUT-C30 grown on 5% (w/v) Solka-Floc in a 16-L vessel (10-L workingvolume, 250 rpm). They measured volumetric mass transfer coefficients(kLa) of 500–600 h–1 at the beginning of the cultivation, and then kLa decreasedto near 300 h–1 by 24 h and remained at this value for the rest of the cultivation.
While conducting numerous studies to investigate cellulase produc-tion using cellulosic substrates, we had the opportunity to measure OURsat a variety of vessel sizes. In particular, we conducted runs in 7-L bench-scale vessels and in pilot-scale vessels ranging from 160 to 9000 L using bothsoluble (glucose) and insoluble (Solka-Floc) substrates. Our objectives wereto determine whether existing kLa correlations could be used to predictOURs during cellulase production and to examine how oxygen transfer isaffected by vessel size. This information can ultimately be used to estimatecapital and operating costs for the cellulase production section of a bio-mass-to-ethanol conversion facility.
Materials and MethodsMicroorganism
The microorganism used was T. reesei L27 (17) grown on potato dex-trose agar plates until sporulation occurred. Spores were suspended in15% (w/v) glycerol and stored in vials at –70°C.
Vessels
Bench-scale cultivations were performed using New Brunswick Bioflo3000 fermentation systems (Edison, NJ) in 7-L vessels. Airflow to the ves-sels was controlled using external MKS Instruments (Andover, MA) type
630 Schell et al.
Applied Biochemistry and Biotechnology Vol. 91–93, 2001
1159B mass flow controllers. Data for all cultivations in the bench- or pilot-scale vessels were collected and logged by computers at 5-min intervals.
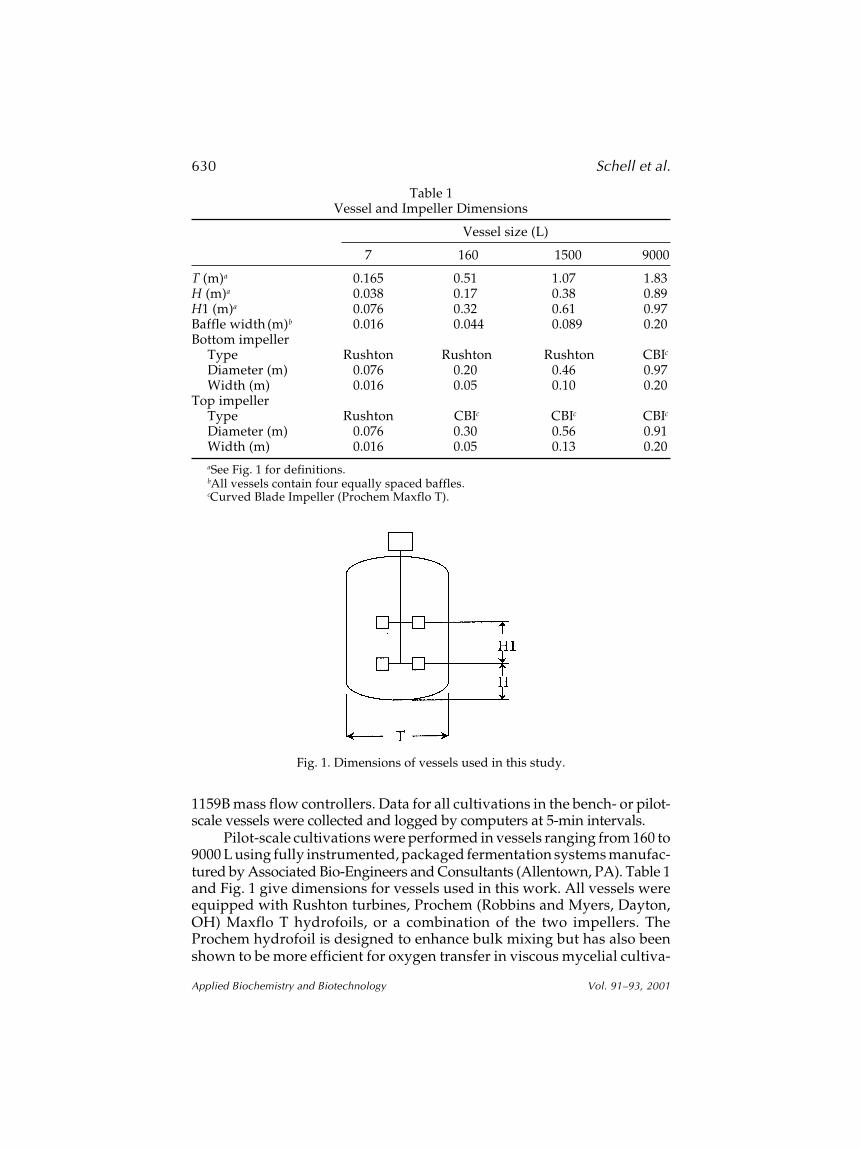
Pilot-scale cultivations were performed in vessels ranging from 160 to9000 L using fully instrumented, packaged fermentation systems manufac-tured by Associated Bio-Engineers and Consultants (Allentown, PA). Table 1and Fig. 1 give dimensions for vessels used in this work. All vessels wereequipped with Rushton turbines, Prochem (Robbins and Myers, Dayton,OH) Maxflo T hydrofoils, or a combination of the two impellers. TheProchem hydrofoil is designed to enhance bulk mixing but has also beenshown to be more efficient for oxygen transfer in viscous mycelial cultiva-
aSee Fig. 1 for definitions.bAll vessels contain four equally spaced baffles.cCurved Blade Impeller (Prochem Maxflo T).
Fig. 1. Dimensions of vessels used in this study.
Influence of Operating Conditions 631
Applied Biochemistry and Biotechnology Vol. 91–93, 2001
tions (18). Seed growth for pilot-scale cultivations was performed in a NewBrunwick Bioflo IV 20-L fermentation system.
Bench-Scale Cultivations
The medium for inoculum growth and cellulase production was amodified Mandel medium as previously reported (19), but sodium citratewas only used for shake-flask cultivation and not in the larger vessels.A first-stage seed culture was grown by inoculating a 250-mL shake flask(50-mL working volume) containing 2% (w/v) glucose (only the concentra-tion of the carbon source is reported from now on because the other mediumcomponents remained constant) with a single vial of frozen stock culture.The flask was incubated at 28°C in a temperature-controlled shaking incu-bator operating at 200 rpm for 36 h.
A second stage of seed growth is required to condition the micro-organism to enzyme production. Fifteen milliliters of first-stage culture(5% [v/v] inoculum) was transferred to a 1-L shake flask (300-mL workingvolume) containing 1% (w/v) Solka-Floc (a purified cellulose from FiberSales and Development, Urbana, OH) and incubated at 28°C and 200 rpmfor 48 h. The 7-L vessel (4-L working volume) containing 5% (w/v) Solka-Floc was inoculated with 200 mL of second-stage culture (5% [v/v] inocu-lum). When more than one vessel was used during a run (up to four vesselscould be operated simultaneously), second-stage culture from separateshake flasks was combined before inoculation of the multiple vessels. Thetemperature in the 7-L vessels was controlled at 28°C and pH was main-tained at 4.8 by the addition of either 4 N NH
4OH or 2 N H
3PO
4. The airflow
rate was set at 5 L/min (1.25 vvm), and agitation was allowed to varybetween 450 and 600 rpm to maintain the DO concentration above 30% ofair saturation. Sterile diluted (1:10) antifoam (Ucon Lubricant LB-625; UnionCarbide, Danbury, CT) was added manually as needed to control foaming.These runs lasted 7 d.
There was a slight modification to the aforementioned proceduresduring one experiment (consisting of two vessels) when glucose was usedas the carbon source instead of Solka-Floc. In this case, the second-stageculture was inoculated with a 10% (v/v) first-stage culture, the medium forsecond-stage seed growth contained 3% (w/v) glucose, and the secondstage was incubated for only 24 h. The medium for the 7-L vessels contained5% (w/v) glucose. All other conditions were as reported except that the runwas terminated at 70 h after all the glucose was consumed.
Pilot-Scale Cultivations
Two experiments were conducted in the pilot-scale equipment usingconditions listed in Table 2. The pilot-scale cultivations used most of theprocedures described for the bench-scale cultivations, except that morestages for seed production were required. In the first experiment, T. reeseiL27 was grown in the 1500-L vessel on 5% (w/w) Solka-Floc. Four stages
632 Schell et al.
Applied Biochemistry and Biotechnology Vol. 91–93, 2001
of seed production were necessary to produce the required volume ofinoculum. Two stages were done in shake flasks using procedures dis-cussed above for bench-scale cultivations, followed by growth in the 20and 160-L vessels at conditions summarized in Table 2.
In the second experiment, T. reesei L27 was grown on 5% (w/w) glu-cose in the 9000-L vessel. Again, four stages of seed production were used,but in this case only the first stage was done in shake flasks. Two 1000-mLshake flasks (300-mL working volume) were inoculated with spores froma frozen vial. This culture was grown for 48 h and then used to inoculate the20-L vessel that was subsequently used to inoculate the 1500-L vessel. Theconditions listed in Table 2 were used.
Measurement of OUR
OURs (mmol/[L·h]) were calculated from measurements of inlet andoutlet gas flow rate and gas composition using a VG Prima 600 mass spec-trometer (Fisons, Middlewich, UK), according to Eq. 1:
Table 2Operating Conditions for Pilot-Scale Cultivations
aAgitation and aeration were adjusted to maintain target dissolved oxygen level.bFlow at standard conditions of 21°C and 1.0 atm pressure.
Influence of Operating Conditions 633
Applied Biochemistry and Biotechnology Vol. 91–93, 2001
OUR = 1
V (qiYi
02 – qoYo02) (1)
in which V is the fermentor working volume (L), qi is the inlet airflow rate(mmol/h), q
o is the outlet flow rate (mmol/h), Y
iO2 is the oxygen concentra-
tion in the inlet air (mol%), and YoO2 is the oxygen concentration in the outlet
gas (mol%). The outlet flow rate is not measured but can be readily calcu-lated from a nitrogen mass balance. Since nitrogen is not consumed, a massbalance reduces to the following simple expression:
qo = qi Yi
N2
YoN2
(2)
in which YiN2 and Yo
N2 are the nitrogen concentration in the inlet air andoutlet gas (mol%), respectively. Substituting Eq. 2 into Eq. 1 yields thefollowing final expression for OUR:
OUR = qi
V Yi
02 – Yo02
YiN2
YoN2
(3)
The airflow rate qi is calculated from the volumetric airflow rate Fi(L/min) measured at standard conditions using the ideal gas law:
qi = (PsFi/RTs) (4)
in which Ps (1.0 atm) and T (21°C for the pilot-scale fermentor systems and0°C for the MKS mass flow controllers) are standard pressure and tempera-ture, respectively, for the particular mass flowmeter used; and R is the idealgas constant (0.08203 [atm·L]/[mol·K]).
Estimation of OTR for Pilot-Scale Vessels
The kLa (h–1) and the driving force for oxygen transfer (c* – c) govern the
rate of oxygen transfer according to Eq. 5:
OTR = kLa (c* – c) (5)
in which c* is the saturated oxygen concentration or solubility (mmol/L)determined from Henry’s Law:
pi = Hc* (6)
and c is the actual DO concentration (mmol/L), pi is the partial pressure ofoxygen in the sparge gas (atm), and H is Henry’s coefficient (1.0 atm/[mmol·L]) (20). The kLa is usually given by a correlation of the following form:
kLa ∝ Pg
V
n
usm (7)
634 Schell et al.
Applied Biochemistry and Biotechnology Vol. 91–93, 2001
in which (Pg/V) is gassed power input per unit volume and (us) is the gassuperficial velocity. The exponents n and m and a proportionality constantare determined by fitting experimental data.
Power Input
McCabe and Smith (21) give an ungassed power correlation for a non-Newtonian (pseudoplastic) liquid in a vessel equipped with a single six-bladed turbine (Rushton) and four baffles. The correlation relates the powernumber (Np) to the modified Reynolds number (Rem). These terms aredefined as follows:
Rem = ND2ρ
µ a
(8)
in which N is the agitation rate (s–1), D is the impeller diameter (m), ρ is thefluid density (kg/m3, assumed to be 1.02 g/cm3 in all calculations), andµa is the apparent viscosity (kg/[m·s]). The power number is
Np = Pogc
N3D5ρ(9)
in which Po is the ungassed power for a single impeller (W); and gc is theNewton’s Law proportionality factor, which is 32.174 lb-ft/s2-lb
f in English
units and is unity and dimensionless in SI units. Since power correlationsdepend on impeller type, tank and impeller dimensions, and impeller place-ment, any correlation will only give approximate results. The total ungassedpower input (PT) is approximated as the single impeller power times thenumber of impellers.
On aeration, the power drawn by an impeller decreases because of aneffective decrease in fluid density caused by the holdup of air under highlyaerated conditions. This effect can reduce the gassed power input to aslittle as 35% of the ungassed power input. Gassed power input was esti-mated from published experimental data for a non-Newtonian fermenta-tion broth (22).
kLa Correlations
Correlations for kLa are available for both Newtonian liquids and anon-Newtonian fermentation broth.
Bailey and Ollis (23) give the following correlation for coalescingwater, a highly Newtonian liquid:
kLa (s–1) = 0.0026 Pg
V
0.4
us0.5 (10)
in which the power input per unit volume is expressed in W/m3 and us
is the superficial velocity (m/s). This equation is valid for V <2600 L and500 < Pg/V < 10,000 W/m3 (~5–10 hp/1000 gal).
Influence of Operating Conditions 635
Applied Biochemistry and Biotechnology Vol. 91–93, 2001
Wang et al. (22) present the following kLa correlation for a non-Newtonian fermentation broth for vessel sizes from 20 to 30,000 L duringa fungal cultivation:
kLa (h–1) = 8.42 Pg
V
0.33
us0.56 (11)
in which power input per unit volume is expressed in hp/1000 L and thesuperficial gas velocity in cm/min.
Results
Bench-Scale Results
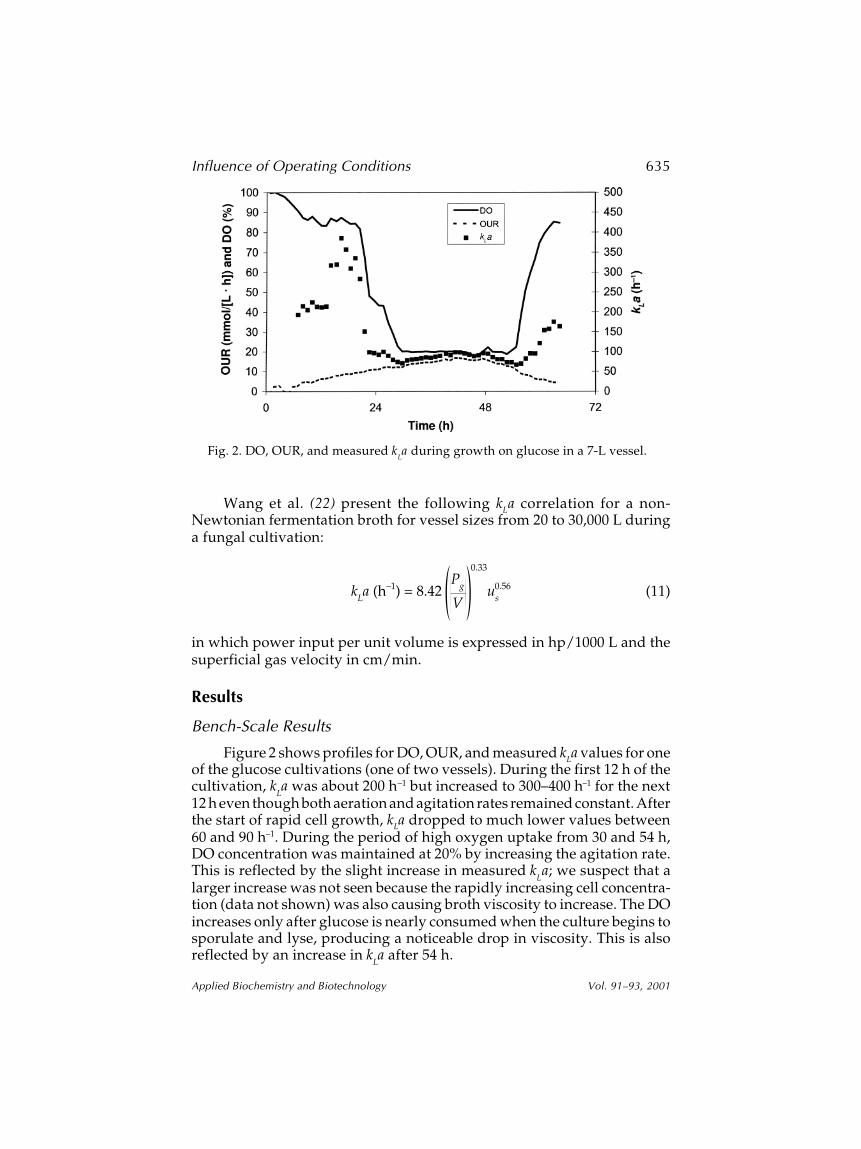
Figure 2 shows profiles for DO, OUR, and measured kLa values for oneof the glucose cultivations (one of two vessels). During the first 12 h of thecultivation, k
La was about 200 h–1 but increased to 300–400 h–1 for the next
12 h even though both aeration and agitation rates remained constant. Afterthe start of rapid cell growth, kLa dropped to much lower values between60 and 90 h–1. During the period of high oxygen uptake from 30 and 54 h,DO concentration was maintained at 20% by increasing the agitation rate.This is reflected by the slight increase in measured k
La; we suspect that a
larger increase was not seen because the rapidly increasing cell concentra-tion (data not shown) was also causing broth viscosity to increase. The DOincreases only after glucose is nearly consumed when the culture begins tosporulate and lyse, producing a noticeable drop in viscosity. This is alsoreflected by an increase in k
La after 54 h.
Fig. 2. DO, OUR, and measured kLa during growth on glucose in a 7-L vessel.
636 Schell et al.
Applied Biochemistry and Biotechnology Vol. 91–93, 2001
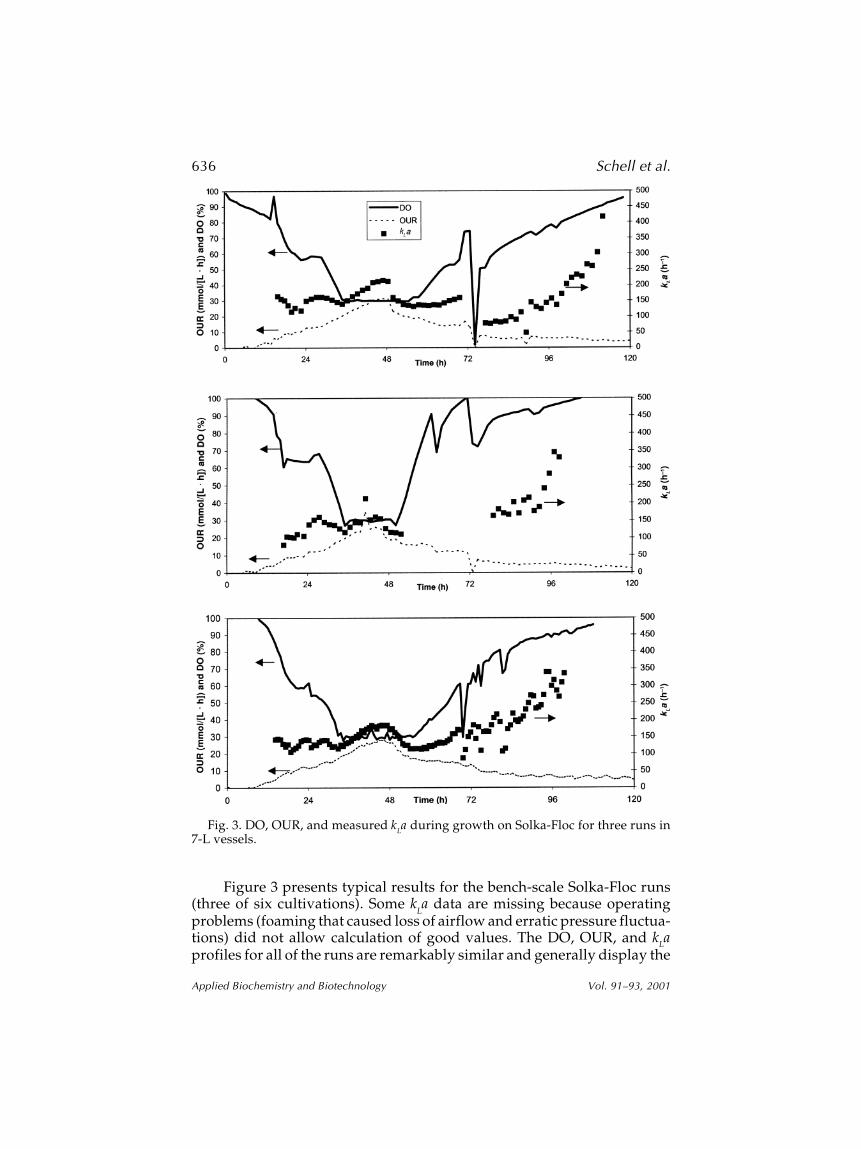
Figure 3 presents typical results for the bench-scale Solka-Floc runs(three of six cultivations). Some k
La data are missing because operating
problems (foaming that caused loss of airflow and erratic pressure fluctua-tions) did not allow calculation of good values. The DO, OUR, and kLaprofiles for all of the runs are remarkably similar and generally display the
Fig. 3. DO, OUR, and measured kLa during growth on Solka-Floc for three runs in7-L vessels.
Influence of Operating Conditions 637
Applied Biochemistry and Biotechnology Vol. 91–93, 2001
same trends seen during glucose cultivations. However, during the periodwhen agitation rate was increased to control DO concentration at 30% (typi-cally between 36 and 54 h), there was a noticeable increase in kLa values.As expected, because the thick Solka-Floc slurry hinders mass transfer, thekLa values during the initial stages of these cultivations were lower thanvalues measured for the glucose cultivation. The kLa values were between100 and 200 h–1 during the first 3 d of cultivation and, similar to what wasobserved in the glucose cultivations, began to rise after the carbon sourcewas consumed and cell lysis began to thin the broth. The maximum OURfor these cultivations ranged from 30 to 35 mmol/(L·h), which is quitesimilar to OURs reported by other researchers for these vessel sizes.
Pilot-Scale Results
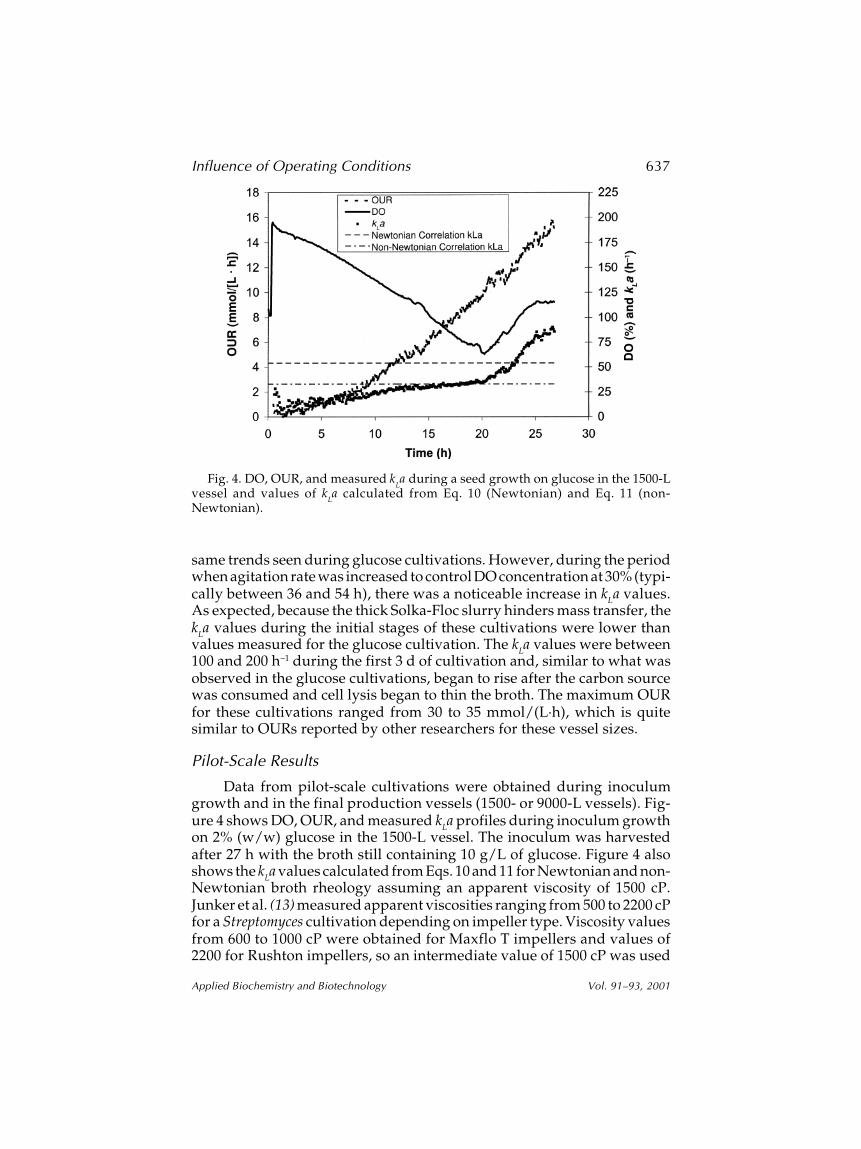
Data from pilot-scale cultivations were obtained during inoculumgrowth and in the final production vessels (1500- or 9000-L vessels). Fig-ure 4 shows DO, OUR, and measured kLa profiles during inoculum growthon 2% (w/w) glucose in the 1500-L vessel. The inoculum was harvestedafter 27 h with the broth still containing 10 g/L of glucose. Figure 4 alsoshows the kLa values calculated from Eqs. 10 and 11 for Newtonian and non-Newtonian broth rheology assuming an apparent viscosity of 1500 cP.Junker et al. (13) measured apparent viscosities ranging from 500 to 2200 cPfor a Streptomyces cultivation depending on impeller type. Viscosity valuesfrom 600 to 1000 cP were obtained for Maxflo T impellers and values of2200 for Rushton impellers, so an intermediate value of 1500 cP was used
Fig. 4. DO, OUR, and measured kLa during a seed growth on glucose in the 1500-L
vessel and values of kLa calculated from Eq. 10 (Newtonian) and Eq. 11 (non-
Newtonian).
638 Schell et al.
Applied Biochemistry and Biotechnology Vol. 91–93, 2001
in our calculations; but as shown later (see Fig. 5), calculated kLa values arenot extremely sensitive to viscosity.
Since both agitation rate (100 rpm) and aeration rate (300 L/min atstandard conditions) were held constant for the entire 27-h seed cultiva-tion, Eqs. 10 and 11 predict constant kLa. The trend of increasing kLa valuesduring this run suggests that during the early stages of this cultivation, thebroth rheology is changing to enhance mass transfer. Although unex-plained, there are indications of this same type of behavior during the earlystages of the bench-scale glucose cultivation (Fig. 2). The trend appears toreverse after approx 25 h, but the cultivation was not run long enough toconfirm this trend. Although the non-Newtonian correlation gives lowervalues for k
La, neither correlation does well at predicting the experimental
results during the early part of the cultivation. The kLa correlations were notused to model bench-scale data because the agitation power correlationsare based on data obtained from larger vessels.
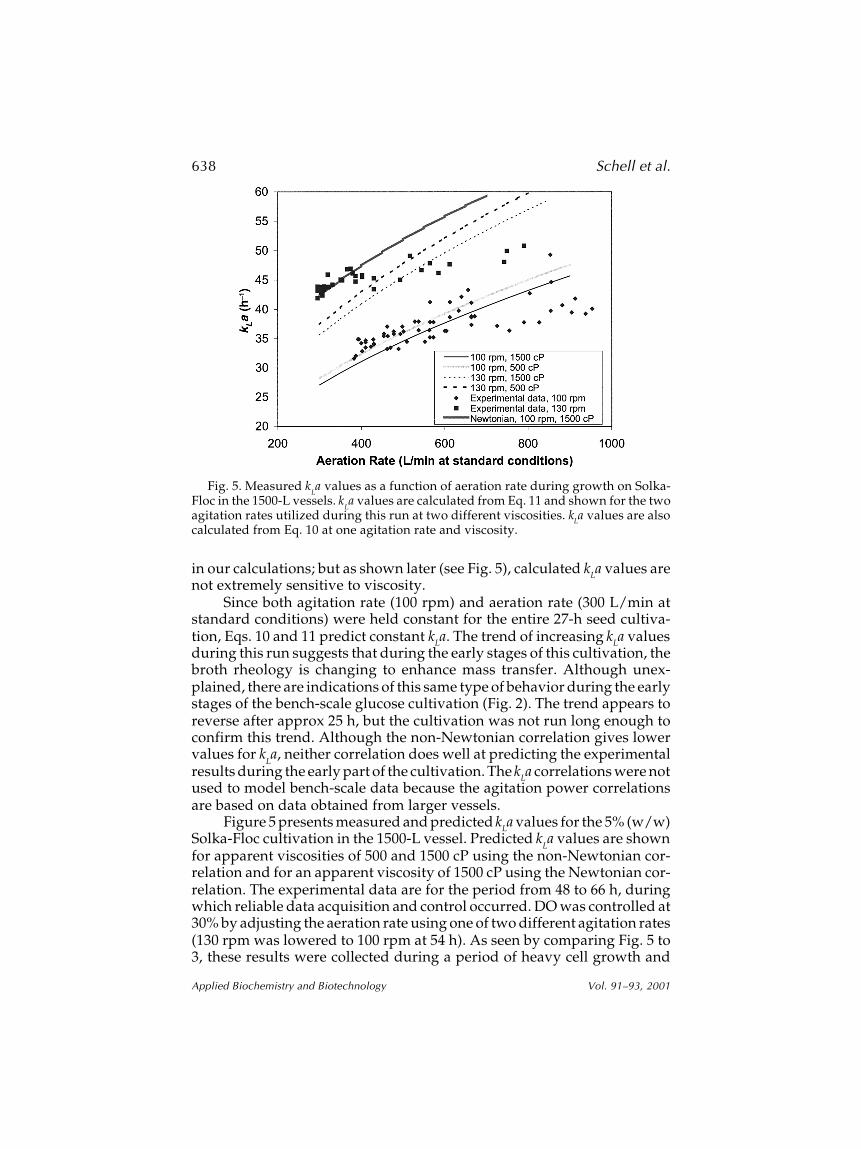
Figure 5 presents measured and predicted kLa values for the 5% (w/w)Solka-Floc cultivation in the 1500-L vessel. Predicted k
La values are shown
for apparent viscosities of 500 and 1500 cP using the non-Newtonian cor-relation and for an apparent viscosity of 1500 cP using the Newtonian cor-relation. The experimental data are for the period from 48 to 66 h, duringwhich reliable data acquisition and control occurred. DO was controlled at30% by adjusting the aeration rate using one of two different agitation rates(130 rpm was lowered to 100 rpm at 54 h). As seen by comparing Fig. 5 to3, these results were collected during a period of heavy cell growth and
Fig. 5. Measured kLa values as a function of aeration rate during growth on Solka-
Floc in the 1500-L vessels. kLa values are calculated from Eq. 11 and shown for the two
agitation rates utilized during this run at two different viscosities. kLa values are alsocalculated from Eq. 10 at one agitation rate and viscosity.
Influence of Operating Conditions 639
Applied Biochemistry and Biotechnology Vol. 91–93, 2001
substrate utilization, before substrate depletion and cell lysis significantlydecrease broth viscosity.
Although the trend of measured kLa values is not well predicted by thecorrelations, the measured values, even at the extremes are within ±25% ofthe predicted values from the non-Newtonian correlation at 1500 cP overa broad range of aeration rates. This is certainly within the expected accu-
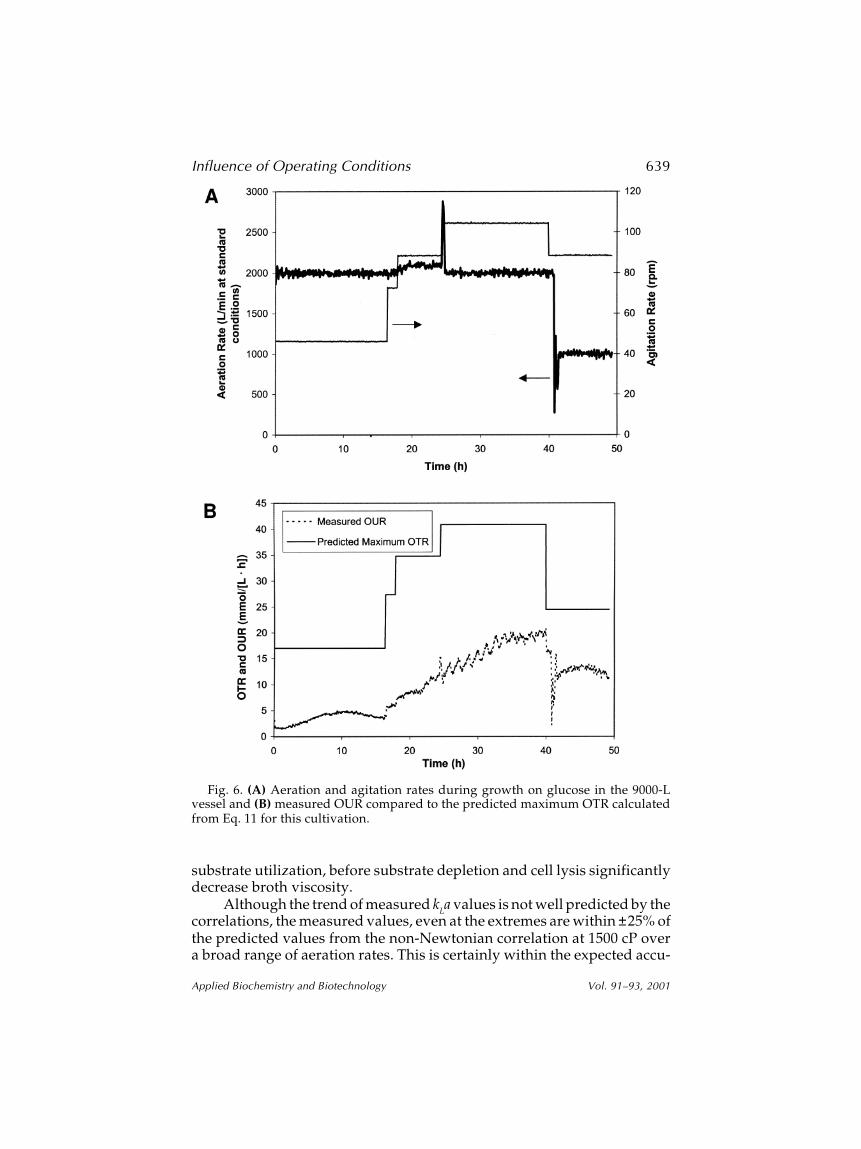
Fig. 6. (A) Aeration and agitation rates during growth on glucose in the 9000-Lvessel and (B) measured OUR compared to the predicted maximum OTR calculatedfrom Eq. 11 for this cultivation.
640 Schell et al.
Applied Biochemistry and Biotechnology Vol. 91–93, 2001
racy of these types of correlations. However, as seen from previous results,this correlation only appears to work reasonably well during the period ofheaviest cell growth and oxygen utilization and not as well during the earlyand late stages of cultivation. As expected, the Newtonian correlation didnot fit the data. Significant changes in apparent viscosity have little effecton the predicted kLa values because changes in viscosity have only a minoreffect in the power calculation. However, the equations do not account forthe other ways in which viscosity can significantly influence oxygen trans-fer, as previously discussed, e.g., by influencing both the mass transfercoefficient (k
L) and interfacial area (a).
Because of mechanical failure of a DO probe during the 5% (w/w)glucose cultivation in the 9000-L vessel, the k
La values were not measured
during this run. However, Fig. 6A presents the agitation and aeration rateprofiles during this run. Using this information, the maximum OTRs werecalculated using the non-Newtonian correlation assuming a DO concentra-tion of 0. The maximum OTRs are compared to measured OURs in Fig. 6B.We believe that the DO was actually never near 0. Thus, we expected thatmeasured OUR would be lower than calculated OTR if the correlation pre-dicted reasonable OTR. Since the measured OURs are less than the pre-dicted maximum OTR, we have some confidence that the correlation iseffective and will work for even larger vessels.
Discussion
This study shows that a non-Newtonian correlation for kLa can be usedto estimate OTR in cellulase production runs during the period of heavycell growth and oxygen utilization for the vessel sizes used (160–9000 L).For an ethanol production facility, the cellulase production tanks are likelyto be at least 500,000 L. It is unlikely that the correlation will work at thislarge scale, since it has been suggested that the exponents in kLa correlationsare functions of scale (24). Nevertheless, the non-Newtonian kLa correlationwas utilized to explore the effect of vessel size on oxygen transfer using twocommonly used scale-up criteria: constant shear or impeller tip speed(4.04 m/s) and constant power (gassed) input per unit volume (500 W/m3).Figure 7 presents the results of these calculations for 9000-, 100,000-, and500,000-L vessels. These calculations assume a DO concentration of 0, anaverage pressure of 2.0 atm, and a working volume of 75% of the total vesselvolume. These calculations also assume that the vessels have similar geom-etries (i.e., vessel height/vessel diameter = 2.0, vessel diameter/impellerdiameter = 1.9).
The results show that regardless of the scale-up criteria used, it ispossible to achieve better oxygen transfer in the larger vessels. Oxygentransfer is enhanced at larger scales because higher superficial velocitiesare achieved when the dimensional ratios of the vessels are held constant.As size increases, however, it may be impractical to construct a vessel witha 2:1 height-to-diameter ratio. In addition, the agitation rates required to
Influence of Operating Conditions 641
Applied Biochemistry and Biotechnology Vol. 91–93, 2001
achieved these power inputs may not be practical at very large scale or mayproduce shear rates that are too high. Oxygen transfer is lower in largervessels when using shear rate as the scale-up criteria because less powerinput per unit volume is needed in larger vessels to achieve the sameimpeller tip speed. Scale-up based on shear rate may be more appropriatefor cellulase production because of the reported shear sensitivity ofcellulase (25).
Unfortunately, it is probably not possible to simplify scale-up of cel-lulase production using the correlation presented herein. Accurate predic-tions of oxygen transfer at large scales are difficult because of the largechanges that occur in broth rheology as well as the mounting problemswith bulk mixing, efficient bubble breakup, and gas distribution. Oneresearcher has suggested a modification to kLa correlations to include aviscosity term (26). Additionally, impeller flooding is known to occur atmuch lower aeration rates in larger vessels, particularly in viscous cultiva-tions (24). In practice, it is probably not possible to achieve higher OTRs inlarger vessels than can be achieved in smaller vessels. Our study neverthe-less provides some useful oxygen transfer rate data and insight into someof the scale-up issues for cellulase production. This information supportsefforts to improve economic analysis of enzyme-based ethanol productionprocesses.
Acknowledgments
This work was funded by the Biochemical Conversion Element of theDepartment of Energy’s Office of Fuels Development.
Fig. 7. OUR as a function of vessel size using either constant shear or constant poweras the scale-up criterion.
642 Schell et al.
Applied Biochemistry and Biotechnology Vol. 91–93, 2001
References
1. Mukataka, S., Kobayashi, N., Sato S., and Takahashi, J. (1988), Biotechnol. Bioeng. 32,760–763.
2. Lejeune, R. and Baron, G. (1995), Appl. Microbiol. Biotechnol. 43, 249–258.3. Marten, M., Velkovska, S., Khan, S., and Ollis, D. (1996), Biotechnol. Prog. 12, 602–611.4. Steel, R. and Maxon, W. (1966), Biotechnol. Bioeng. 8, 97–108.5. Manfredini, R., Cavallera, V., Marini, L., and Donite, G. (1983), Biotechnol. Bioeng. 25,
3115–3131.6. Konig, B., Schugerl, K., and Seewald, C. (1982), Biotechnol. Bioeng. 23, 259–280.7. Li, G., Qiu, H., Zheng, Z., Cai, Z., and Yang, S. (1995), J. Chem. Tech. Biotechnol. 62,
385–391.8. Amanullah, A., Tuttiett, B., and Nienow, A. (1998), Biotechnol. Bioeng. 57, 198–210.9. Roman, R. and Tudose, R. (1997), Bioproc. Eng. 17, 361–365.
10. Schugerl, K. (1981), Adv. Biochem. Eng. 19, 71–174.11. Atkinson, B. and Mavituna, F. (1991), Biochemical Engineering and Biotechnology Hand-
book, 2nd ed., Stockton Press, New York.12. Ferreira, B., van Keulen, F., and da Fonseca, M. (1998), Bioproc. Eng. 19, 289–296.13. Junker, B., Stanik, M., Barna, C., Salmon, P., and Buckland, B. (1998), Bioproc. Eng. 19,
403–413.14. Amanullah, A., Tuttiet, B., and Nienow, A. (1998), Biotechnol. Bioeng. 57, 198–210.15. Amanullah, A., Serrano-Carreon, L., Castro, B., Galindo, E., and Nienow, A. (1998),
Biotechnol. Bioeng. 57, 95–108.16. Hoq, M., Hempel, C., and Deckwer, W. (1994), J. Biotechnol. 37, 49–58.17. Shoemaker, S., Watt, K., Tsitovsky, G., and Cox, R. (1983), Bio/Technology 1, 687–690.18. Buckland, B., Gbewonyo, K., DiMasi, D., Hunt, G., Westerfield, G., and Nienow, A.
(1988), Biotechnol. Bioeng. 31, 737–742.19. Hayward, T., Hamilton, J., Templeton, D., Jennings, E., Ruth, M., Tholudur, A.,
McMillan, J., Tucker, M., and Mohagheghi, A. (1999), Appl. Biochem. Biotechnol. 77–79,293–309.
20. Wooley, B., Ruth, M., Sheehan, J., Ibsen, K., Majdeski, H., and Galvez, A. (1999),NREL/TP-580-26157, National Renewable Energy Laboratory, Golden, CO.
21. McCabe, W. and Smith, J. (1976), Unit Operations of Chemical Engineering, 3rd ed.,McGraw-Hill, New York.
22. Wang, D., Cooney, C., Demain, A., Dunnill, P., Humphrey, A., and Lilly, M. (1979),Fermentation and Enzyme Technology, John Wiley & Sons, New York.
23. Bailey, J. and Ollis, D. (1986), Biochemical Engineering Fundamentals, 2nd ed., McGraw-Hill, New York.
24. Humphrey, A. (1998), Biotechnol. Prog. 14, 3–7.25. Ganesh, K., Joshi, J., and Sawant, S. (2000), Biochem. Eng. J. 4, 137–141.26. Ryu, D. and Humphrey, A. (1972), J. Ferment. Technol. 50, 424.