Institutionen för pedagogik, didaktik och utbildningsstudier Department of Education Influence of Parental Income and Educational Attainment on Children’s Years of Schooling: Case of Ghana Dinah Ani-Asamoah Marbuah Master’s thesis in Sociology of Education Nr 1. 2016
Transcript
Institutionen för pedagogik, didaktik och utbildningsstudier Department of Education
Influence of Parental Income and Educational Attainment on Children’s Years of Schooling:
Chapter One: Background of Study ______________________________________________________________ 1 Introduction ____________________________________________________________________________ 1 Problem Statement _______________________________________________________________________ 2 Objectives and Hypotheses _________________________________________________________________ 2 Methodology and Data ____________________________________________________________________ 3 Scope and Limitations ____________________________________________________________________ 3 Organization of Study _____________________________________________________________________ 3
Chapter Two: Literature Review _________________________________________________________________ 5 Relevance of Education ___________________________________________________________________ 5 Family, Gender and Education ______________________________________________________________ 5 Parental Educational Attainment, Income and Children’s Education __________________________________ 6 Investment Theory _______________________________________________________________________ 7 Cultural Capital __________________________________________________________________________ 8
Chapter Three: Context: Ghana’s Profile _________________________________________________________ 11 Geography ____________________________________________________________________________ 11 Demography___________________________________________________________________________ 11 Ghanaian Education – Reforms and Policies ___________________________________________________ 12 Current Overview of Ghanaian Education System ______________________________________________ 13
Provision of Schools ______________________________________________________________ 14 Educational Attainment ____________________________________________________________ 14 School attendance ________________________________________________________________ 15 Literacy ________________________________________________________________________ 16
Chapter Four: Research Methodology and Data ___________________________________________________ 19 Introduction ___________________________________________________________________________ 19 Data Source and Description ______________________________________________________________ 19 Data Analysis __________________________________________________________________________ 20 Descriptive Analysis of Data _______________________________________________________________ 21 Higher Education _______________________________________________________________________ 25
Distribution of Tertiary Institutions ___________________________________________________ 26
Dinah Ani-Asamoah Marbuah: Influence of Parental Income and Educational Attainment on Children’s Years of Schooling: Case of Ghana
4
List of tables Table 1. Number of Schools (2012/2013). ............................................................................ Error! Bookmark not defined.
Table 2. Population aged 15 years and older, by educational attainment and sex (per cent).Error! Bookmark not
defined.
Table 3. School attendance rate by age and sex (percentage)............................................. Error! Bookmark not defined.
Table 4. Adult literacy rates, by gender and location (read and write in English). ......... Error! Bookmark not defined.
Table 5. Variable Description ................................................................................................... Error! Bookmark not defined.
Table 6. Descriptive statistics. .................................................................................................. Error! Bookmark not defined.
Table 7. Household Income groups. ....................................................................................... Error! Bookmark not defined.
Table 8. Parents’ educational attainment across income groups. ...................................... Error! Bookmark not defined.
Table 9. Correlation among parents’ education, income, child’s years of schooling, household size and locality. Error!
Bookmark not defined.
Table 10. Regression Results for Children years of schooling (5<years<28). .................. Error! Bookmark not defined.
Table 11. Regression Results for Children years of schooling (5<years<15). .................. Error! Bookmark not defined.
Table 12. Regression Results for Children years of schooling (15 years<28). .............. Error! Bookmark not defined.
Table 13. Regression Results for Children years of schooling (ages 15-16 years, 18-91 years and 23-24 years)....... Error!
Bookmark not defined.
List of figures Figure 1. Map of Ghana showing population share and poverty rates across regions. ........................................................ 12
Figure 2. Map of Ghana showing school attendance rate across regions. .............................................................................. 16
Figure 3. Years of schooling for children at the age of 15years. ............................................................................................... 23
Figure 4. Years of schooling for children at the age of 8years. ................................................................................................. 24
Figure 5. Years of schooling for children at the age of 23 years. .............................................................................................. 24
Figure 6. Distribution of parental education for children between 5 and 28 years. .............................................................. 25
Figure 7. Distribution of educational attainment of children between 17 and 28 years with higher education and
parents. 25
Figure 8. Distribution of educational attainment of children between 17 and 28 years and parents without higher
education. 26
Figure 9. Map of Ghana showing regional distribution of tertiary institutions. .................................................................... 27
Figure 10. Preferred Tertiary Institutions for children between 17 and 28 years. .................................................... 27
Chapter One: Background of Study
Introduction
Education is expected to provide one with capital such as qualification, knowledge and skillsets relevant to improve health conditions, secure stable employment, increase one’s income, allocate resources efficiently to maximise output, contribute in terms of taxes to the nation and improve the quality of life of the individual.
The acquisition of this educational capital enables one to transform it into other forms of capital such as economic, cultural and social. However, to enjoy these benefits requires significant investment. Nations and individuals who have invested in human capital, of which education is a major determinant in its acquisition, have experienced rapid development compared to those who have invested in non-human capital (Schultz, 1961). Today’s global market has evolved from one that required manual power (use of the muscle) to one that requires intellectual capacity in its operations. In view of this, sub-Saharan African countries have over the past two decades strived in building their human capital base by putting in place different policies and strategies to ensure that their citizens possess such valuable resources for the development of their nations as a way of positioning themselves to compete for jobs and investment in an increasingly globalized world (Majgaard and Mingat, 2012). Ghana, like all other sub-Saharan African countries, has instituted policies including free compulsory basic education, capitation grant, school feeding, public private partnerships to ensure the education sector achieves high enrolment, attendance and retention rates. This is to enhance national development and attainment of critical international development goals. Enrolment of children in school are more now than at any time in the history of Ghana, and learning outcomes and literacy have started to gradually improve (Darvas and Balwanz, 2014). According to the Ghana Statistical Service (GSS) survey on living standards in 2014, the country had attained a 56 per cent literacy rate1 in 2013, a sign of progress toward achieving a literate society. However, the higher proportion of literacy is at the basic level with only 15 per cent of the population above 15 years possessing senior secondary and higher education qualifications (Ghana Statistical Service, 2014a). This could be attributed to the introduction of the 1996 Free Compulsory Universal Basic Education programme (fCUBE), a policy directive with full constitutional backing to bind all successive governments (Ghana Education Service, 2004).
The social structure of the Ghanaian society according to the latest round2 of the Ghana Living Standards Survey (Ghana Statistical Service, 2014a) reveals that the nation has a youthful population with 39 per cent below 15 years, 5 per cent are 65 years and above, while the remaining 56 per cent covers ages from 15 to 64 years. The gender composition is 48 per cent male and 52 per cent female with higher proportion of households headed by males (70 per cent) than females (30 per cent). A similar trend is seen in educational attainment in terms of gender as they progress to the higher levels with 67 per cent of males being literate and 47 per cent females. In order to promote gender equity, several initiatives have been implemented within the last few decades. Such initiatives include girl child education programs, review of textbooks and syllabuses which was hitherto skewed towards the empowerment of the male child, establishment of Girls Education Unit to champion the
1 Literacy was defined as ability to read and write simple sentences in English and any Ghanaian language with understanding. 2 Wave 6.
Dinah Ani-Asamoah Marbuah: Influence of Parental Income and Educational Attainment on Children’s Years of Schooling: Case of Ghana
2
study of science and technology related subjects, scholarship packages and a convenient school schedule designed for girls to enable them execute their domestic chores where needed (Basic Education Division Service of Ghana Education Service, 2004; Aheto-Tsegah, 2011). The campaign for girl child education is expected to have positive impact on child and maternal mortality, life expectancy, health care, the labour force attendance, gender disparity, income disparity and inequality gap in location.
Problem Statement
Human capital is globally perceived to be the most important resource for the socio-economic development of a nation. Education is a major determinant of the acquisition of this capital and requires great investment of resources. It is however important to understand that for citizens to acquire human capital, through mass education, there has to be interplay of both the state and other actors in the educational field (Eklof, 1984; Soysal et al., 1992; Green, 2010; Evertsson, 2015). Governments provide the infrastructure, policies and human resources to ensure that children obtain the best of education. Despite various policies put in place by the government of Ghana, it is still faced with a relatively low educational attainment especially in the secondary and higher level as well as gender disparity in terms of progression on the educational ladder.
There is thus a need to research why a country with a 56% of its population of approximately 26 million between the ages of 14 years and 64 years have 15 per cent secondary and higher educational attainment. Actors such as the family have been identified by researchers as playing an important role in the education of children. The primary decision to educate a child is taken by the family since they provide the resources. If parents understand the benefits of investing in their children’s education, then why are we challenged with such low attainment rates? Researchers have associated the level of parents’ socio-economic status (income, education and occupation) to children’s educational attainment. According to Willingham (2012), income of parents’ contribution to children’s educational attainment is not very explicit but influences education in the long-term through: the provision of an excellent pre-school which offers the child a stronger foundation to start on, well-resourced school, educational stationary, library, and extra tuition for children. Inference can be made from here as the reason for not attaining 100 per cent basic education even with free Compulsory Universal Basic Education program in place. Human and social capital are other resources that Willingham (2012) indicates affords educational avenues for children. He explains human capital as that ‘education and experience’ acquired by parents which is transferred to their children in knowledge form and social capital as the opportunities parents obtain through their social position or interaction. Parents who have more of these three capitals are able to create opportunities for their children in the advancement of their education than those who have less of it. It is therefore justified to shed light on the factors that explain educational attainment of children in an effort to build a high quality human capital to support the country’s development and attainment of international targets.
Objectives and Hypotheses
There a number of researches which argues for a direct relationship between the socio-economic status of family and their children’s educational attainment. Hoover-Dempsey and Sandler (1995) explain that parents’ priority is providing their children with the basic necessities of life which are food, clothing and shelter; so if their resources are not sufficient to cover these basic needs, education becomes secondary. Becker (1988) also argues similarly that constraint in terms of parents’ income, other limited resources as well as opportunities
Dinah Ani-Asamoah Marbuah: Influence of Parental Income and Educational Attainment on Children’s Years of Schooling: Case of Ghana
3
in an economy or elsewhere influences decision of parents, hence impact on their investment level required to develop their children’s human capital. It is in this regard that this paper seeks to examine the influence of parental income and education on their children’s educational attainment within the Ghanaian context.
In considering the effect of parents’ income, educational background and their demographic position on their children’s educational attainment and gender disparity we seek to find out if:
1. Parental income and educational level have effect on children’s years of schooling. 2. Parental income and educational level have differential effect on the educational
attainment of the male and female child. 3. Mothers and fathers’ educational level may influence the educational attainment of
child and how different is this effect for boys and girls.
Thus we hypothesize that socio-economic status of parents (particularly income level and educational status) has a (positive) influence on the years of schooling of their children. We also test if there is a positive relationship between father’s educational attainment and son’s years of schooling as well as mother’s educational attainment and daughter’s years of schooling.
Methodology and Data
In achieving the objectives of the proposed study, data would be sourced from mainly but not limited to the Ghana Living Standards Survey (GLSS 6) 2012/2013 nation-wide survey. The data set provides information on the living conditions and well-being of 16,772 Ghanaian households in 1,200 enumeration areas on their “demographic characteristics of households, education, health, employment, migration and tourism, housing conditions, household agriculture, household expenditure, income and their components as well as access to financial services, credit and assets”( Ghana Statistical Service, 2014a; p. xvi). The household structure used in the survey reflects that of the nation.
In the analysis of the data, we will employ descriptive analysis to discuss trends in educational patterns with graphical aids. Correlation and regression analyses will also be used to estimate the factors that influence children’s educational outcomes with particular focus on the parental income and educational attainment.
Scope and Limitations
A national analysis, covering all the ten administrative regions, will be covered by the study based on educational and household characteristics data from the GLSS 6. Since the data used for the study is from a secondary source, the researcher does not have any direct influence on questions asked and information elicited, thus any errors in the data collection process may affect the outcome of this study. Secondly, the current study is limited to only a single wave of survey which may not allow for comparison with earlier surveys.
Organization of Study
This thesis is structured into five chapters. Chapter one is dedicated to introduction, problem statement, objectives and hypothesis, methodology, significance of the research, scope and limitation and layout of the project. Chapter two reviews and discusses relevant empirical literature. It also discusses the various theories and concept development to understand
Dinah Ani-Asamoah Marbuah: Influence of Parental Income and Educational Attainment on Children’s Years of Schooling: Case of Ghana
4
children’s educational outcomes and their limitations. Chapter three offers the background studies of Ghana, educational reforms, policies and overview of the current educational system. Chapter four will present the data used in the analysis, defining scope and measurement used as well as the analytical tools employed in arriving at the findings. Chapter five presents, analyses and discusses the key findings of the study. Chapter six concludes the paper with a summary of findings and concluding remarks.
Chapter Two: Literature Review
Relevance of Education
According to the Education for all global report (2011)3, education equips one with knowledge, skillsets and right attitude for the transformation of life. With these attributes one is able to secure a job, earn income, stay healthy, have access to credit, increase productivity, reduce poverty and participate fully in societal activities. An educated mother knows and understands the essence of anti-natal care, childhood vaccinations, family planning and the provision of a balanced diet for children, hence a decrease in fertility rate, malnutrition rate, maternal and child mortality (ibid). Kenya’s maternal mortality ratio declined by 34 per cent as a result of an increase of 1.8 years of schooling among young women (Education for All, 2013)4. There is also an increase in life expectancy for the literate because they are knowledgeable on how to stay healthy. Education also leads to a decline in child marriage and improves unity in society. Education Indicators in Focus (2013)5 on “What are the social benefits of education?” reports that available data shows a strong correlation between life expectancy and education. They also illustrate that educated persons are more likely to exercise their civic rights, such as voting, compared to those with lower or no education (ibid). Healthy persons are not a cost to the nation’s health sector and their employability makes them an asset through their contribution to production and taxes (ibid). Education for all global monitoring report published by UNESCO (2011)6 indicated that there is an increase of 0.37 per cent in average annual domestic product for any additional year of schooling. It also argued that education makes one protective of the environment, and focuses on the rapid and sustainable growth of the country (ibid).
Family, Gender and Education
Culture has generally been associated with the way a group of people live. Family is the first learning place for children when they are born. They learn their customs, norms, values, language, acquire taste and fashion which influences their behaviour and thoughts. They become embodied with the culture of the family which accord them the required characteristics for societal interaction and acquiring a position in the “social space”. Gender role is also learnt by children from the home. In West Africa, the dominance of the patriarch system has resulted in gender inequality and discrimination (Tuwor and Sossou, 2008). In this system, males play the dominant role of being visible, earning livelihood and taking care of the finances of the home. Females, on the other hand, are expected to be submissive, responsible for the diverse domestic work, play the accustomed role of the motherhood and work to support the family as well, which affects their education (ibid). In a research done in Ghana with 524 junior secondary school children from 12 to 15 and their parents or guardian, it was noticed that children were empowered differently; hence young adults viewed the roles of the female and male inversely, with females assuming domestic roles and males a sense of entitlement7. The raising of children at the early ages are assigned to the females; however, as the children attain puberty, men assume the responsibility of training
Dinah Ani-Asamoah Marbuah: Influence of Parental Income and Educational Attainment on Children’s Years of Schooling: Case of Ghana
6
the boys and women the girls (ibid). Glick and Sahn (2000) explains further that the structuring of the household may hamper the girl’s educational attainment than the boys where mother imposes diverse domestic work on the girl child in the light of training. The boy on the other hand may have ample time to concentrate on his education. Raising children thus involves the transfer of cultural capital by parents whether consciously or unconsciously to their children. The process can take the form of observation, relationship building, teaching and others. The extended family system, neighbours and the school typically also have a role to play in this regard. Overall, the process of transmitting cultural capital may differ across families depending on the social class or background of the family.
Caring for the children also involves the provision of education for them. From the above mentioned benefits, we realise that education benefits both the individual and the society hence parents strive to invest in their children. There are several factors that influence children’s educational success of which some are parental educational level, their involvement in children’s education, their available income, occupation, area of residence, access to quality education, children’s IQ and their interest in schooling. Researchers have observed strong association of the family environment to the educational attainment as well as intergenerational transmission of capital (Coleman, 1988; Eccles and Davis-Kean, 2005; Sackey, 2007; Donkor, 2010). However, the most discussed are parents’ income level, educational attainment, occupation and their involvement in their children’s education. Researchers have pointed out that wealth is the basic necessity of life and for one to get involved in their children’s education, there should not be any socioeconomic hindrances. When the issue of socioeconomic obstruction is raised, parents turn to focus on food, clothing and shelter as children’s primary needs and all others become secondary which may influence children’s educational attainment (Hoover-Dempsey and Sandler 1995).
Parental Educational Attainment, Income and Children’s Education
The intergenerational transmission of capital which has been strongly associated with parent’s investment in their children’s human capital is seen in the children’s final educational outcome and where they are positioned in society afterwards. The level of investment by parents despite the numerous advantages of education varies among children. Findings from several researches in both developing and developed countries have associated the level of investment and influence in children’s education with parents’ income level, educational attainment and occupational status.
In New Zealand, Canada and United State of America (USA), Mayer (2002) a sociologist explains that the effect of parental income on children’s outcome can be viewed in three ways: the correlation between parental income and children’s outcome, the causal effect of parental income on children’s outcome and the effect of particular policies implemented to raise the income of poor families. Despite the limitations associated with them, Mayer recommends that they are useful in highlighting changes overtime and across countries in relation to parental income and children’s outcome and assess the effect of specific policy changes. She discusses the investment theory which relates children’s outcome as a result of the transfer of parent’s cultural capital and their level of investment (health, education, good environment) to children. The good parent theory associates children’s outcomes with their parent’s ability to provide good parenting which is usually influenced by the level of income available. In this theory she reviews the “parents stress and the role model versions”. In her analysis, she concludes that parental income has a positive relationship on children’s outcomes which is in line with both theories. In USA, the effect of parental income on the educational attainment of children is due to credit constraint (Mayer 2002, p.40). Low income earning parents are unable to afford their children’s college
Dinah Ani-Asamoah Marbuah: Influence of Parental Income and Educational Attainment on Children’s Years of Schooling: Case of Ghana
7
education expenditure which is averagely on the high side. Increase in education expenditure influences parents’ decision on the quality of school, which affects the grade of the children and their ability to progress to a higher level (Mayer 2002, p. 41). Her analysis further shows that an increase in parental income influences more of the male child than the female and also family income is more important at adolescence compared to childhood.
Writing on gender differences in educational attainment and the influence of the family environment, Mensah and Kierman (2010) found that primary school children in England between 2005 and 2006 in families experiencing low socioeconomic status had lower development in communication, language, literacy and mathematics. Educational disadvantages were skewed to the boys than girls with families characterised by mother’s age (young), educational qualification (low) and neighbourhood (poor). In affirmation with other research, the analysis illustrated that poor family environment indicates poorer educational outcome of children. Using a linear regression and Pearson chi-square analysis to assess the correlation between parents’ academic achievement, emerging adult’s8 perception of their parents’ socio-economic status in the United States, Young-Clark’s (2014) study revealed a positive correlation. A strong association was observed between parents’ educational attainment and adult children’s educational outcome with emphasis on the father’s academic achievement which showed a stronger magnitude which was in line with the family investment model employed (Young-Clark, 2014).
In Conakry, Guinea, the effect of parental education, income and household on schooling of boys and girls were analysed by Glick and Sahn (2000) employing the household production model from economics. By utilizing a probit model with household random effect, they observe that increase in household income has a greater correlation on investment in girl child education than in boys. They also observe that the level of father’s education raises the educational outcome of both boys and girls while that of the mother, when improved, impact significantly on the girl child. The findings also illustrate that gender, parental education and household income and composition affects schooling decision depending on the gender of the child (Glick and Sahn, 2000).
Similarly, Sackey (2007) employs the use of household production model in economics to identify the determinants of school attendance and attainment in Ghana from a gender perspective. His findings affirm the notion that parental education and financial resources influence children’s educational outcome through investment in schooling. High parental education has an inverse relationship with low schooling level. He reveals that there was a decline on girls schooling in relation to father’s schooling in the years under review (1992 and 1999) while that of the mother did not exert any significant change in the girl’s schooling but a decline in the boy’s.
Theories such as family investment, social and cultural capital theory have been used in understanding educational attainment of children in relation to their parents’ resources. A few are discussed in the next sections.
Investment Theory
This theory explains the transfer of parents’ biological endowment and human capital to their children for their development (Becker and Tomes, 1986). Parents care about their consumption and their children’s as well and hence invest their time and money in their children’s education to ensure the development of their skills and knowledge (human capital) in addition to the biologically transmitted endowment in order to have competitive
8 Young-Clark classification age for emerging adults was 25 -29 years.
Dinah Ani-Asamoah Marbuah: Influence of Parental Income and Educational Attainment on Children’s Years of Schooling: Case of Ghana
8
advantage over their peers (Meyar, 2002; Guner, 2014). However, since resources are limited and parents are constrained, decisions on investment contributions to their children’s development are influenced by income, preference and fertility of parents (Becker and Tomes, 1986). When families have high income, they can afford to buy textbooks, stationery, provide extra tutoring to improve children’s academic performance and hence attain higher levels of education (Willingham, 2012). On the contrary, a low income resourced family may be constrained in even meeting the basic necessities in life, hence cannot support children with extra resources in their education (Donkor, 2010). According to Becker and Tomes (1986), parents of high socioeconomic status (SES) may have access to credit facilities while that of the low SES parents may not thereby limiting their ability to provide basic or supplementary resource for their children’s education.
Additionally, the extent to which parents transfer their resource has a negative relationship with the family size (Becker and Tomes, 1986). In other words, the wealth of the family is constrained by the number of children in the family hence influencing the allocation of investment per child. According to Haveman and Wolfe (1995), the investment theory shows that children are bound to attain higher education on the average compared to their parents in accordance with the weight of resources invested in them. He goes on to explain that “the ability of parents and their educational choices jointly determine the level of family income and the quantity and quality of both time and goods input that parents devote to their children” ( Haveman and Wolfe 1995, p.1834).
Cultural Capital
Culture is generally described as a way a group of people live. This way of life influences ones’ thoughts, emotions and behaviour in every decision made. Cultural capital is described as the intellect, cultural knowledge or credentials of a person (Bourdieu, 2000; Crompton, 2008). According to Bourdieu (1979, 1984) “habits, skills, attitudes, knowledge and taste” are the creation of culture that are acquired from our family and educational system which does not only directly influence a person’s position in the social space but indirectly as well. He indicates that cultural capital can be ranked in terms of time “early or late”, mode of acquisition “domestic or scholastic”, titles and the social group of the individual (Bourdieu, 1984, p. 2). In every society, high value is accorded the dominant cultural practices which the educational system employs in structuring its pedagogies, thereby offering power or comparative advantage to families from these backgrounds. Bourdieu in his “Distinction: A social critique of the judgement of taste” (1984, p. 1), explains that “all cultural practices (museum visits, concert-going, reading etc.), and preferences in literature, painting or music, are closely linked to educational level (measured by qualifications or length of schooling) and secondarily to social origin”. He further makes clear that cultural inequalities are most visible in areas where there is no structured learning. An example could be a child from a bourgeois origin may have experience from their intensive travel, summer jobs, hobbies such as reading, painting, playing musical instruments, constant interaction with their parents which makes them vocal, confident, easily adaptable to change and know their plan for their life trajectory compared to a child from the working class family who do not have such experiences. Cultural capital empowers one to strategize in life and delineates opportunities, living and working conditions as well. In other words, the recognition of cultural capital by society gives it value which is “capable of giving meaning to life and to death itself” (Bourdieu, 2000, p. 240). Today, the global world seeks people with talents to offer them jobs. Persons with these talents are required to possess educational credentials such as a bachelor’s degree, master’s degree, PhD or a diploma, experience and knowledge in a particular field. Parents with high cultural capital transmit consciously or unconsciously to
Dinah Ani-Asamoah Marbuah: Influence of Parental Income and Educational Attainment on Children’s Years of Schooling: Case of Ghana
9
their children through observation, relationship building, networking, right neighbourhood and quality education to their children compared to working class families. When children of these bourgeois families receive this cultural capital, they participate actively in society and take up positions in the social space according to the weight of the culture possessed which deepen social stratification (Calarco, 2014).
Diverse disciplines have acknowledged the importance of family in the transmission of intergenerational resources and their influences on the children’s outcomes from the reviewed literature. Family resources have been observed to be tangible or intangible but once they are transferred to the children, they are able to convert it into other forms of capital with the help of established institutions to their benefit. In the next chapters, we will examine how parental income and education influences their children’s years of schooling in Ghana. We will also consider other factors such as family size, area of residence and ethnicity’s influence on children’s years of schooling.
Chapter Three: Context: Ghana’s Profile
Geography
Ghana9 is a sub-Saharan country in West Africa located north of the equator. It covers an area of 239,460 square km and is bounded by Burkina Faso, the Gulf of Guinea, Togo and Côte d’Ivoire in the north, south, east and west, respectively (ibid). Ghana has English as its official language whilst all of its neighbouring countries are French speaking. It was the first country in sub-Saharan Africa to gain independence from its colonial masters (the British) on 6th of March, 1957 and then on the 1st of July, 1960 it became a republic. Prior to Ghana gaining its independence, it was known as the Gold Coast. In 1957, Gold Coast and Togoland trust territories merged to form the country Ghana (ibid).
Ghana has ten administrative regions with the Northern, Upper East and Upper West region constituting the northern sector and Brong Ahafo, Ashanti, Volta, Greater Accra (the capital city), Central, Eastern and Western regions constituting the southern sector. There are 49 ethnic groups dominated by 4 groups with 85.4 per cent. They are the Akans (48 per cent), Mole Dagbani (17 per cent), Ewe (14 per cent) and Ga-Dangme (7 per cent) (Ghana Statistical Service, 2014a).
Demography
According to the 2010 demographic and housing census conducted by the Ghana Statistical Service, the country has a population of approximately 25 million with an annual average growth rate of approximately 3 per cent. Ashanti region is the most populous (19 per cent) followed by Greater Accra region with 16 per cent. On the contrary, Upper East and Upper West regions are sparsely populated with 4 and 3 per cent, respectively (see Figure 1). Western, Eastern, Central, Northern, Volta and Brong Ahafo range between close to 9 per cent and 11 per cent of the national population. In terms of population density, the census report reveals that Greater Accra is the most densely populated with approximately 1,236 persons per square km while the sparsely populated area is the Northern region with a population density of 35 persons per square km (Ghana Statistical Service, 2014a).
The country is divided into urban and rural locations with highest number of residents located in the rural area. Greater Accra constitutes approximately 91 per cent urban population followed by the Ashanti region with 61 per cent while the Upper East holds the lowest of 16 per cent (Ghana Statistical Service, 2014a). The national household size has reduced to 4.4 (as at 2010) compared with 5.1 in 2000 (ibid). However, the three northern regions (Upper West, Northern and Upper East) exceeded the national household size with 5.5, 5.4 and 4.5, respectively (ibid).
The population structure of Ghana in terms of gender is female dominated with close to 52 per cent and 48 per cent males, a feature that is seen in all localities (Ghana Statistical Service, 2014a). The country shows a youthful population with 39 per cent of the population under 15 years and 5 per cent above 65 years (ibid) which is influenced by high fertility and decreasing mortality. The life expectancy of the country over the years has seen significant improvement from 46 years in 1960 to 61 years in 2013 and exceeded the sub-Saharan Africa average of nearly 57 years (UNDP, 2014).
Dinah Ani-Asamoah Marbuah: Influence of Parental Income and Educational Attainment on Children’s Years of Schooling: Case of Ghana
12
Figure 1. Map of Ghana showing population share and poverty rates across regions.
Source: Author’s own construction using data from 2010 Population and Housing Census: Summary report of final Results and Ghana Poverty Mapping Report 2015.
In order to achieve the Millennium Development Goal of halving poverty by 2015, the state had established institutions and programs to reduce extreme poverty. The progress in this campaign is reflected in the improvement of the country’s poverty income level and human development. According to the UNDP (2014) report on “sustaining human progress: reducing vulnerabilities and building resilience”, Ghana positioned 138 out of 187 in the human development index (HDI) making it a medium human development country. Ghana has an index of 0.573 which is slightly above that of the sub-Sahara African average of 0.502 (ibid). In addition, the income poverty level of people earning less than $2 constitutes 44 per cent of the population and that of income earners less than $1.25 constitute 29 per cent, an improvement over the years (UNDP 2014; 2015). Figure 3.2 provides an overview of the poverty level in the various regions in Ghana. The three northern regions (Upper West, Upper East and Northern) remain the poorest in the country with poverty rates of 69, 46 and 44 per cent, respectively. However, higher inequality prevails in Upper West and Upper East as compared to the Northern region (Ghana Statistical Service, 2015). Greater Accra remains the richest region followed by the Ashanti region with poverty levels of about 7 and 14 per cent, respectively (ibid).
Ghanaian Education – Reforms and Policies
The evolution of Ghana’s formal Education today commenced in then Gold Cost in the 16th
century with Christian missionaries playing a key role in its expansion (Aheto-Tsegah, 2011). The education which was gender bias with only males being educated and only saw the
N o r t h e r nN o r t h e r n
V o l t aV o l t a
A s h a n t iA s h a n t i
B r o n g A h a f oB r o n g A h a f o
W e s t e r nW e s t e r n
E a s t e r nE a s t e r n
U p p e r W e s tU p p e r W e s t
C e n t r a lC e n t r a l
U p p e r E a s tU p p e r E a s t
G r e a t e r A c c r aG r e a t e r A c c r a
¬
Legend: Population share (%)
Ghana
Population
2,800 - 6,120
6,121 - 9,440
9,441 - 12,760
12,761 - 16,080
16,081 - 19,400
0 30 60 90 12015Kilometers
N o r t h e r nN o r t h e r n
V o l t aV o l t a
A s h a n t iA s h a n t i
B r o n g A h a f oB r o n g A h a f o
W e s t e r nW e s t e r n
E a s t e r nE a s t e r n
U p p e r W e s tU p p e r W e s t
C e n t r a lC e n t r a l
U p p e r E a s tU p p e r E a s t
G r e a t e r A c c r aG r e a t e r A c c r a
¬
Legend: Poverty headcount rate (%)
Ghana
Poverty he
6,600 - 19,160
19,161 - 31,720
31,721 - 44,280
44,281 - 56,840
56,841 - 69,400
0 30 60 90 12015Kilometers
Dinah Ani-Asamoah Marbuah: Influence of Parental Income and Educational Attainment on Children’s Years of Schooling: Case of Ghana
13
introduction of equal gender opportunity under the “sixteen guiding principles in education” which was introduced by Governor Sir Gordon Guggisberg in 1925 (Martin, 1976). Education during this period came at a cost and therefore was not compulsory until 1951 when the fee-free compulsory primary and middle school education was proposed under the Accelerated Development Plan (ADP) (Akyeampong, 2010, Little, 2010). The education structure under the ADP was changed to 6-year primary, 4-year middle school, five-year secondary (ordinary level) and 2-year sixth form (advanced level) education to meet the goal of developing the full potential of the population to increase the country’s productivity (ibid).
During the 1987 educational reform, the educational structure was revised from “6-4-5-2-3/4” to the “6-3-3-3/4” structure (Poku et al., 2013) reducing the total years of pre-university education from 17 years to 12 years with 10-years elementary school (primary and middle school) replaced by 9-years basic school (primary and junior secondary school) and 7-years secondary school replaced by a 3-year senior secondary school (Akyeampong, 2010; EP-Nuffic, 2015). The “Senior Secondary School (SSS), Technical and Vocational Education and Training (TVET)” formed the post basic education (Poku et al., 2013). The “Middle School Leaving Certificate (MSLC)” which was awarded upon successful completion of the middle school and General Certificate of Education “ordinary level” and “advanced level” at the end of the 5-year secondary and 2-year sixth form respectively were also replaced with the “Basic Education Certificate Examination (BECE)” and “Senior Secondary Certificate Examination (SSCE)” after the completion of the final year junior and senior secondary school examinations respectively (ibid). Admission to senior secondary school was based on grades from the BECE while that of the tertiary institutions was based on grades from SSCE. The curriculum was diversified to include technical and vocational training at the junior secondary school level to enable students to acquire entrepreneurial skills (ibid). The Senior Secondary courses are based on specialization and individual choices with English, mathematics, integrated science and social studies as mandatory courses.
In 1996, a ten-year program of “free compulsory basic universal education” (fCUBE) was introduced to ensure that children from age six 6 had 9 years had formal basic education (Basic Education Division Service of Ghana Education Service, 2004). Basic educational infrastructure was mainly provided by the state to help promote equal and balanced access to pre-university education by all citizens. However, the inability of government to meet the high demand for education increased private participation.
In October 2002, a President’s committee for review on education reforms advocated for a two-year pre-school education, four-year senior secondary/vocational/technical schools to improve the quality of education (Ghana Education Service, 2004). This meant that pre-university schooling years had been increased from 12 to 15 years. This proposal commenced but the secondary four-year education was reverted to the formal.
Current Overview of Ghanaian Education System
Ghana’s educational history has been greatly influenced by the political world. Today, the educational structure is 2-6-3-3-3/4 with 2 years pre-education which commences at the age of 4, 6 years primary and 3 years Junior High school (JHS) constituting the basic education where one is expected to commence at the age of 6 and complete by 15 years, 3years Senior high school (SHS) and 3 to 4 years tertiary education (Ministry of Education, 2013).
Basic education has a standard curriculum which includes mathematics, English language, Integrated science, citizenship education, religious and moral education, creative arts, Ghanaian language, information and communication technology at the primary level. At
Dinah Ani-Asamoah Marbuah: Influence of Parental Income and Educational Attainment on Children’s Years of Schooling: Case of Ghana
14
the Junior High level, social studies and basic design technology is offered in place of citizenship and creative art. The learning of French is however optional. An examination is taken to obtain the Basic Education Certificate upon completion. SHS offers 8 subjects of which mathematics, integrated science, social studies and English language are mandatory and the other 4 based on individual choice of specialization (EP-Nuffic, 2015). The West African Senior Secondary Certification Examination (WASSCE) is obtained after sitting for the SHS examination. Based on the grade obtain, one is able to advance to the tertiary institution which includes the universities, polytechnics, nursing colleges, colleges of education and agricultural colleges (ibid).
Provision of Schools
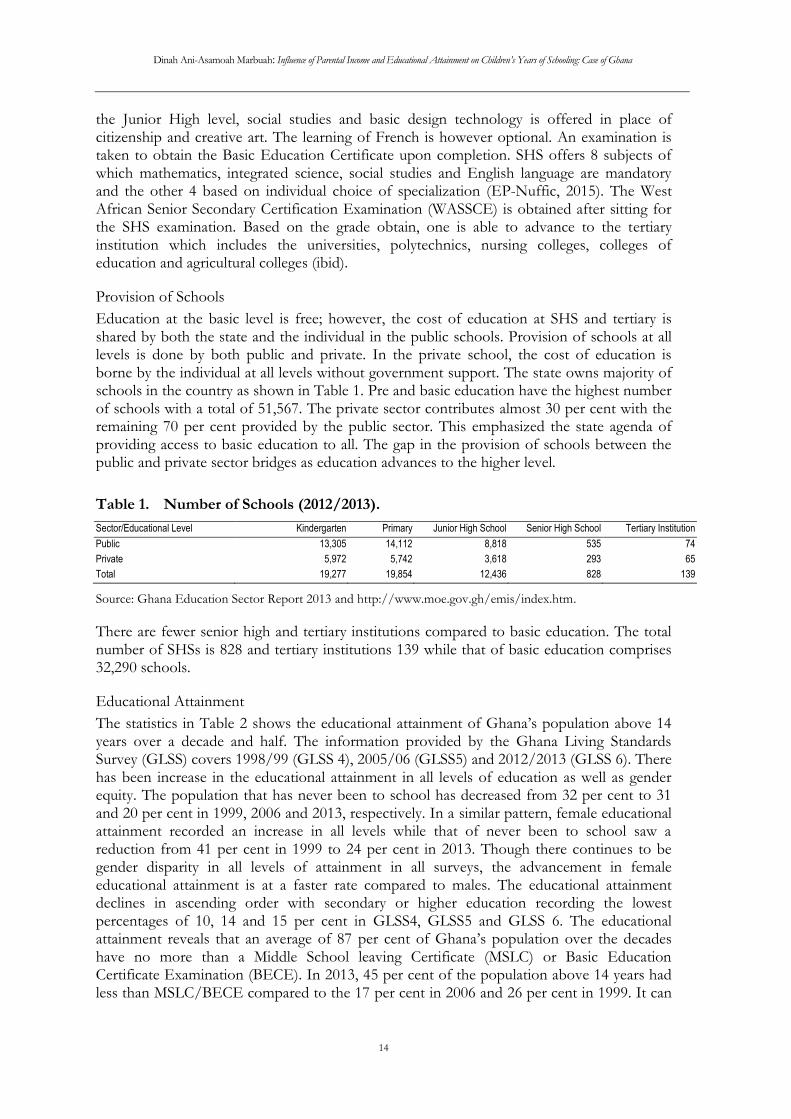
Education at the basic level is free; however, the cost of education at SHS and tertiary is shared by both the state and the individual in the public schools. Provision of schools at all levels is done by both public and private. In the private school, the cost of education is borne by the individual at all levels without government support. The state owns majority of schools in the country as shown in Table 1. Pre and basic education have the highest number of schools with a total of 51,567. The private sector contributes almost 30 per cent with the remaining 70 per cent provided by the public sector. This emphasized the state agenda of providing access to basic education to all. The gap in the provision of schools between the public and private sector bridges as education advances to the higher level.
Table 1. Number of Schools (2012/2013).
Sector/Educational Level Kindergarten Primary Junior High School Senior High School Tertiary Institution
Public 13,305 14,112 8,818 535 74
Private 5,972 5,742 3,618 293 65
Total 19,277 19,854 12,436 828 139
Source: Ghana Education Sector Report 2013 and http://www.moe.gov.gh/emis/index.htm.
There are fewer senior high and tertiary institutions compared to basic education. The total number of SHSs is 828 and tertiary institutions 139 while that of basic education comprises 32,290 schools.
Educational Attainment
The statistics in Table 2 shows the educational attainment of Ghana’s population above 14 years over a decade and half. The information provided by the Ghana Living Standards Survey (GLSS) covers 1998/99 (GLSS 4), 2005/06 (GLSS5) and 2012/2013 (GLSS 6). There has been increase in the educational attainment in all levels of education as well as gender equity. The population that has never been to school has decreased from 32 per cent to 31 and 20 per cent in 1999, 2006 and 2013, respectively. In a similar pattern, female educational attainment recorded an increase in all levels while that of never been to school saw a reduction from 41 per cent in 1999 to 24 per cent in 2013. Though there continues to be gender disparity in all levels of attainment in all surveys, the advancement in female educational attainment is at a faster rate compared to males. The educational attainment declines in ascending order with secondary or higher education recording the lowest percentages of 10, 14 and 15 per cent in GLSS4, GLSS5 and GLSS 6. The educational attainment reveals that an average of 87 per cent of Ghana’s population over the decades have no more than a Middle School leaving Certificate (MSLC) or Basic Education Certificate Examination (BECE). In 2013, 45 per cent of the population above 14 years had less than MSLC/BECE compared to the 17 per cent in 2006 and 26 per cent in 1999. It can
Dinah Ani-Asamoah Marbuah: Influence of Parental Income and Educational Attainment on Children’s Years of Schooling: Case of Ghana
15
be inferred that though there has been an improvement never been to school majority end up with less than MSLC/BECE.
Table 2. Population aged 15 years and older, by educational attainment and sex (per cent).
GLSS 4 GLSS 5 GLSS 6
Highest level attained Male Female Both Sexes
Male Female Both Sexes
Male Female Both Sexes
Never been to school 21.1 41.0 31.8 22.3 38.3 30.8 14.6 24.3 19.7
Less than MSLC/BECE 24.6 25.6 25.1 16.2 17.9 17.1 44.5 44.7 44.6
Source: Ghana Living Standard Survey round 4, 5 and 6 report.
School attendance
Overall pattern in Table 3 suggests that school attendance rate has increased over the last one and half decades for all age groups with the 12–15 years age group dominating in 2006 and 2013 for both male and female. However, the attendance rate decreased for both sexes as they aged which can be seen in age group 16–18 and 19–25. In 1999, 2006 and 2013 age group 19-25 recorded the least attendance rate. Female attendance rate is relatively low compared to males and become very conspicuous as they advance in age.
The distribution of school attendance on regional level in Figure 2 (i.e. map) shows that Greater Accra, Ashanti and Western and Eastern regions recorded the highest levels of attendance rate with approximately 92, 88, 87, and 87 per cent respectively. The three Northern regions recorded the lowest school attendance rate with the least being Northern region (50 per cent), Upper East (63 per cent) and Upper West (64 per cent) respectively. The Central region recorded 84 per cent, Brong Ahafo 79 per cent and 77 per cent school attendance rate in the Volta region. This illustrates that the school attendance rate in the Northern sector is lower than those in the southern sector of the country.
Table 3. School attendance rate by age and sex (percentage).
Age Group GLSS 4 GLSS 5 GLSS 6
Male Female Male Female Male Female
6–11 84.4 81.6 86.1 86.2 93.3 92.6
12–15 83.8 76.8 90.4 88.5 95.1 94.7
16–18 51.9 41.8 87.6 87.3 94.2 92.1
19–25 19.0 8.5 87.8 77.3 91.4 84.1
Source: Ghana Living Standards Survey round 4, 5 and 6 report.
Dinah Ani-Asamoah Marbuah: Influence of Parental Income and Educational Attainment on Children’s Years of Schooling: Case of Ghana
16
Figure 2. Map of Ghana showing school attendance rate across regions.
Source: Author’s own construction using data from Ghana Living Standards Survey round 6.
Literacy
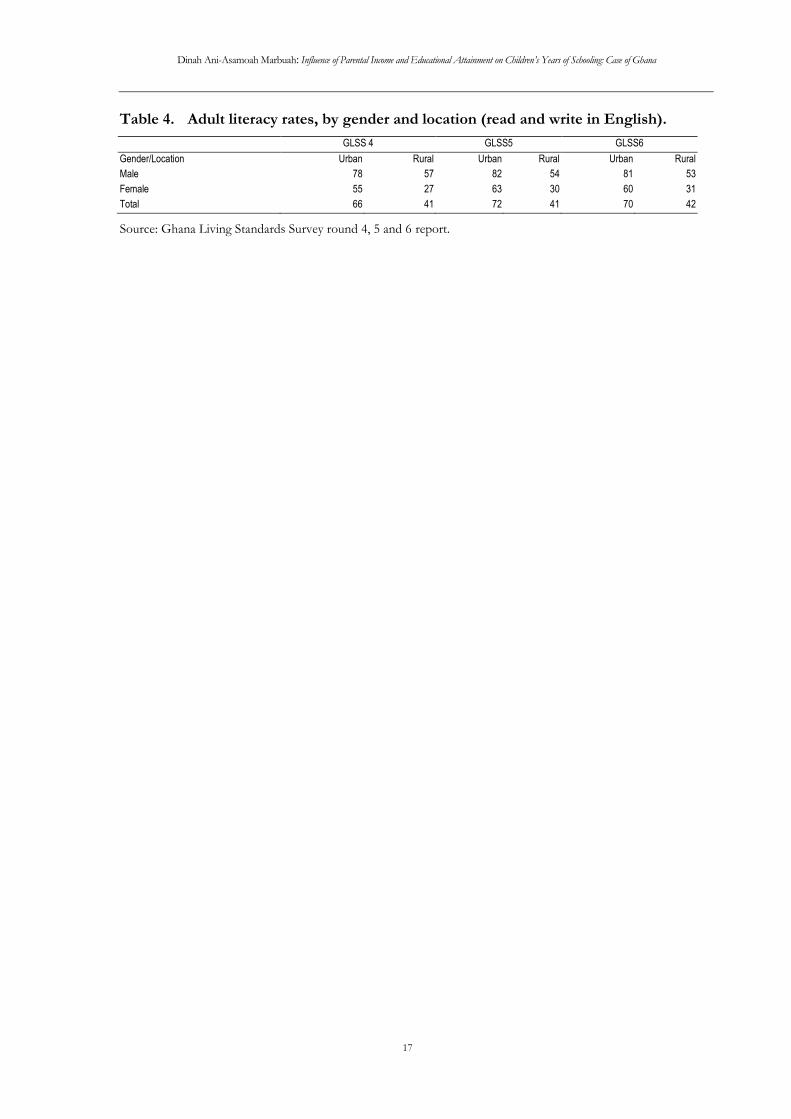
Ghana’s literacy rate in 2013 rose to 56 per cent from 51 per cent in 2006 and 50 per cent in 1999 (GLSS 4, GLSS 5 and GLSS6). Table 4 shows literacy rates by gender and location. The urban area recorded the highest literacy compared to rural with 72 per cent and 41 per cent in 2006. Male adult literacy dominates female adult literacy rate both in the urban and rural areas in all three surveys with 82 per cent being the highest recorded for urban areas and 57 per cent in the rural area. However, male adult literacy rate in urban areas is higher than that of the males in the rural area. In a similar vein, the urban female adult literacy rate compared with the rural female literacy is higher 55, 63, 60 per cent against 27, 30 and 31 per cent. Urban female literacy was higher than rural male literacy with 63 per cent as the highest recorded for females and 57 per cent for males.
N o r t h e r nN o r t h e r n
V o l t aV o l t a
A s h a n t iA s h a n t i
B r o n g A h a f oB r o n g A h a f o
W e s t e r nW e s t e r n
E a s t e r nE a s t e r n
U p p e r W e s tU p p e r W e s t
C e n t r a lC e n t r a l
U p p e r E a s tU p p e r E a s t
G r e a t e r A c c r aG r e a t e r A c c r a
¬
Legend: School attendance rate (%)
Ghana
School att
50,400 - 58,720
58,721 - 67,040
67,041 - 75,360
75,361 - 83,680
83,681 - 92,000
0 30 60 90 12015Kilometers
Dinah Ani-Asamoah Marbuah: Influence of Parental Income and Educational Attainment on Children’s Years of Schooling: Case of Ghana
17
Table 4. Adult literacy rates, by gender and location (read and write in English).
Source: Ghana Living Standards Survey round 4, 5 and 6 report.
Chapter Four: Research Methodology and Data
Introduction
This chapter discusses methods and procedures used in examining the influence of parental income and educational attainment on children’s years of schooling. It expounds on the issuance of the questionnaire, delineating of the sample size and how the data is analysed. The chapter also provides a descriptive analysis of the data employed.
Data Source and Description
The study drew its data from the Ghana Living Standards Survey (GLSS 6) 2012/2013 nation-wide survey which was designed based on the Living Standard Management Study (LSMS) introduced by the World Bank’s policy research unit aimed at monitoring and accessing the impact of policies on the living conditions of Ghanaians (Ghana Statistical Service, 2014a). A two-stage stratified sampling was employed to proportionately allocate 18,000 households nation-wide out of which 16,772 were successfully interviewed (ibid). The survey issued questionnaires covering household, non-farm household, community, governance, peace and security and prices of food and non-food items employing the services of well trained personnel with a minimum of Higher National Diploma to conduct the interviews who were also supervised by top management (ibid).
The sample size employed in this study covers children between the ages of 5 and 28 years. The age range covers the total years of schooling in Ghana and circumstances that may bring about delay in one’s commencement or completion of school (higher education). Using the years of schooling enables us to account for all children who have ever been to school, the level of investment made by parents in a child, it also indicates a child’s progression and captures the various level of completion (Glick and Sahn, 2000). It was obtained using the answers to the questions, has (name) ever attended school? and What is the highest grade completed? The grade was then converted to years of schooling one would have done. The counting commenced with 0 years of schooling representing no formal education (those who answered no to the question Has (name) ever attended school? 0.5 year representing kindergarten since this level is not obligatory, 1 year of schooling representing primary (grade) 1 in ascending order to tertiary education (first degree) which constitute 14 to 17 years of schooling. 0.5 years to 17 years of schooling was derived from those who responded yes to the first question and provided their grades. The years of schooling is the dependent variable which is influenced by factors such as father’s and mother’s educational attainment, parental income and other controlled variables such as household size, locality, ethnicity and others factors which were not accounted for. Hence we refer to these factors influencing the child’s years of schooling as the independent or explanatory variables.
The income of the parents represents the household income and it is continuous in nature. In order to normalize or find symmetry in the wide distribution in income, we found the logarithm of the income. Parent’s income was further divided into five quintiles to illustrate the various income groups from very poor, poor, average, rich to very rich, their percentage contribution to the sample size and income variation in each group. Parents’ educational attainment represents the highest level of education attained. It was categorized into Basic, Secondary and Tertiary education. The locality showed whether the person is resident in the urban or rural area. The 49 ethnic groups in the country were re-grouped into five main categories considering their dominant size (Akan, Ga-Adage, Ewe, Northern tribes and all other tribes).
Dinah Ani-Asamoah Marbuah: Influence of Parental Income and Educational Attainment on Children’s Years of Schooling: Case of Ghana
20
Data Analysis
In analysing the data, we discussed the description statistics of our variables; household size, income, child’s years of schooling, father’s and mother’s educational attainment, location and the ethnicity. We use cross tabulation in illustrating the various parental income groups and their level of education, graphical representation of years of schooling at the ages expected to have attained certain number of years of schooling, distribution of the various tertiary institutions in the various regions and their percentage. These graphical presentations are further explained in writing.
Before proceeding to estimate the regression equation, the extent (or strength) of linear dependence among the outcome variable (child’s years of education) and selected explanatory variables were conducted. Bivariate correlation between variables such as child’s education, income, father’s and mother’ education as well as urban residence of respondents are computed and shown in matrix form. The rationale for this preliminary analysis is to gauge whether there is a very strong, fair or weak linear relationship between these variables, including the direction and significance of the estimated link. The Pearson correlation analysis (Pearson, 1896) is utilized for this purpose. The estimate of the correlation coefficient, , for two variables x and y is calculated using the following formula:
1
2 2
1 1
( )( )
ˆ
( ) ( )
n
i i i
i
n n
i i i i
i i
w x x y y
w x x w y y
(1)
where iw are weights, if specified, or 1iw of weights are not specified. The number of
observations is given by n The mean values of x and y are represented by
i ix w x n and i iy w y n , respectively. The statistical significance level
of the above pairwise correlation is calculated as follows:
2ˆ ˆ2*ttail( 2, 2 1 )p n n (2)
The Pearson correlation coefficient, ̂ , takes the values ranging from +1 to -1. A positive value (i.e. greater than 0) implies a positive correlation or association whereas a negative value implies the opposite. For positive correlation, an increase in the value of variables implies an increase in the value of the other variable and vice versa for a negative correlation. Correlation value of zero (0) suggests no association between the two variables.
In analysing the impact of parents’ social status on children’s education with particular focus on the extent to which parents’ educational attainment and income level influences a child’s education, multiple regression analyses is utilized to shed light on these relationships. Equation (3) shows the functional relationship between the dependent or outcome variable (i.e. child’s years of schooling) and a set of potential explanatory variables, including parents’ educational attainment and income level.
0 1 2 3
4 5 6 7
' '
i i i i
i i i i i
y Father s education Mother s education Householdsize
Income Locality Ethnicity Male
(3)
where y denote child’s years of schooling and t is the regression error (residual) term
which captures the combined effect of omitted variables (i.e. other drivers of child’s years of
Dinah Ani-Asamoah Marbuah: Influence of Parental Income and Educational Attainment on Children’s Years of Schooling: Case of Ghana
21
schooling not explicitly captured in equation 3 perhaps due to data unavailability among other reasons) in the model assuming the effect of these variables unaccounted for are not
correlated with those included in equation (3). The parameters 0 6,..., are standard
regression coefficients to be estimated with data based on the ordinary least squares (OLS) estimator. In equation (3), the natural logarithm of income is taken in order to normalize the distribution of household income in evaluating its effect on education of the child. Table 4.1 shows the description of the variables in equation 3 and their expected relationship. From equation 3, parental education and household income represent cultural and economic capital of the parent respectively (Bourdieu, 1979, 1984; Becker and Tomes, 1986; Haveman and Wolfe, 1995).
Household size Number of people living in the houses negative (-)
Income Natural Log of income of the household in Ghana cedis (GH) positive (+)
Locality Dummy variable with 1 - Rural area and 0 - Urban area negative (-)
Ethnicity Categorical variable capturing the ethnic group of the individual
0 - All other tribes Reference point
1 – Akan positive/ negative (-\+)
2 - Ga – Adangbe positive/ negative (-\+)
3 – Ewe positive/ negative (-\+)
4 - Northern Tribes positive/ negative (-\+)
Male Dummy variable with 1 - male child and 0 – female positive/ negative (-\+)
Descriptive Analysis of Data
The total sample size 35,703 individuals comprising children and young adults from 6 years old to 27 years constituted the study (see Table 6). Children aged 6 to 14 years are expected to be in basic school while those from 15 to 27 are expected to have secondary and tertiary education. The average household size is approximately 7 persons with a minimum of 1 person and a maximum of 29 persons. Children between the ages of 5 and 15 years have families with average size of 7 while that of children between 14 and 28 years have an average size of 6. The average income held by each household annually is GH¢18,316 ($8,727), with some families not earning any income while others earn as high as GH¢2,184,472 ($1,040,224) annually. The difference between the average household income of the children between 5 and 15 and that of children between 14 and 28 years is GH¢185 ($88). The average years of schooling for children is 5 years implying that every Ghanaian child have an average educational attainment of class 5 (grade). The children could have no education or 18 years of education, for children under 15 years, the maximum years of schooling is 16 years. Children below 15 years have mean years of schooling of 2 years and
Dinah Ani-Asamoah Marbuah: Influence of Parental Income and Educational Attainment on Children’s Years of Schooling: Case of Ghana
22
those above age 14 have on average 9 years of schooling. This means that children above 14 years on the average have basic school education.
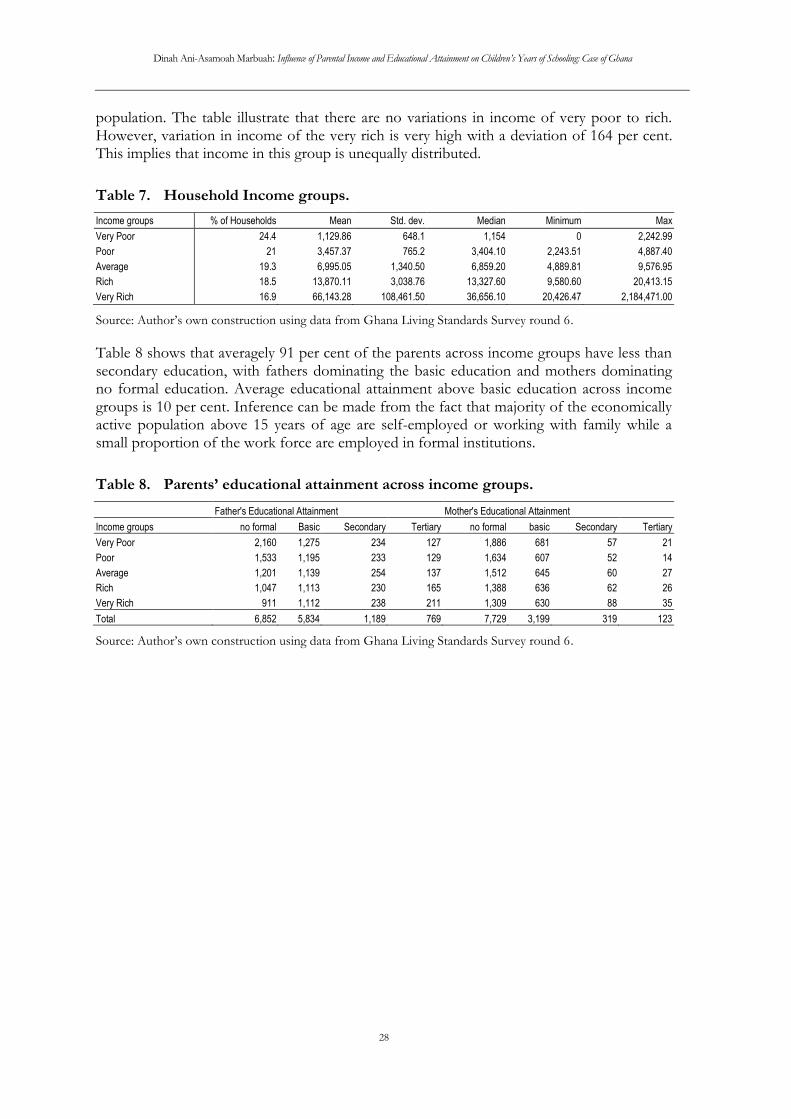
Parents’ educational background was categorized into no education, basic, secondary and tertiary education. It was observed that the majority of parents have no education with the mothers recording 68 per cent and the fathers 47 per cent. At the basic level of education, fathers recorded 40 per cent while mothers recorded 28 per cent for all children between 5 and 28 years of age. Fathers with secondary and tertiary education were 8 per cent and 5 per cent respectively with mothers also forming 3 per cent and 1 per cent. This reflects the gender disparity in the Ghanaian education setup with the males dominating at all levels of education. The proportion of parents with education reduces as the educational level progresses. There is a very small percentage of parents with tertiary education, while parents with no education and basic level education form more than 80 per cent of each gender, thus 96 per cent of mothers and 87 per cent of fathers have basic to no education. The parents of children of the two age group categories follow the same characteristics as combining all the children. However, parents of children between 5 and 15 years have mean education higher than the overall mean education of parents. On the contrary, the education proportion of parents of children between ages 14 and 28 are lower than that of the overall mean education with higher levels of illiteracy for both fathers and mothers.
When we divide Ghana into urban and rural area, we observe that 62 per cent of the children reside in the rural area with 37 per cent resident in urban localities. The proportion of children above 14 years found in the urban area (41 per cent) is more than children 14 years and below (35 per cent). In rural areas, it is the opposite with children 14 years and below contributing 66 per cent while those above form 59 per cent.
Ghana has 49 ethnic groups and in considering these groups the dominating ones were used and all others classified as others. The northern tribes have one ethnic group among the top 4 dominating ethnic groups in Ghana. However, due to difficulty in identifying this ethnic group (Mole Dagbani) the tribes in the northern sector were consolidated as one. The other top three ethnic groups (Akan, Ga-Adangbe and Ewe) are located in the southern part of the country while the category - all other tribes – are dispersed across the country. The Northern tribes recorded the highest number of children (43 per cent) followed by the Akans (36 per cent), the Ewes (13 per cent), the Ga-Adangbes (5 per cent) and all other tribes (3 per cent) being the least. Akans and Ewes recorded a higher percentage of children above 14 years while the Northern tribes and all other tribes have majority of the children below 14 years. The Ga-Adangbes however broke even with 5 per cent of children below and above 14 years of age.
Figure 3 below shows the distribution of years of school for children at age 15 who are expected to have received 9 years of schooling. The distribution shows that 20 per cent of the children at age 15 have 6 years of schooling, 46 per cent have less than 6 years of schooling and 33 per cent have more than six years of schooling. It means that children are more likely to complete their primary education (6 years of schooling) after which the years of schooling reduces. Only 5 per cent of the population have achieved the expected 9 years of schooling. Despite the free compulsory universal basic education at this level, there are other costs involved in schooling that hinders years of schooling. The Child labour 2014 report gave reasons such as no access or long distance to school (19 per cent), inability to afford educational cost (15 per cent), dispassion about schooling (12 per cent) and family prohibiting schooling (11 per cent) for children from 5 to 17 years not attending school.
Dinah Ani-Asamoah Marbuah: Influence of Parental Income and Educational Attainment on Children’s Years of Schooling: Case of Ghana
All other tribes 35,436 0.02 0.16 0 1 18,620 0.03 0.16 0 1 16,816 0.02 0.15 0 1
Source: Author’s own construction using data from Ghana Living Standards Survey round 6.
Figure 3. Years of schooling for children at the age of 15years.
Source: Author’s own construction using data from Ghana Living Standards Survey round 6.
The schooling years of children at age 18 follows a similar normal distribution pattern as those of age 14. As illustrated in Figure 4, about 21 per cent of the population at 18 years have completed basic education, 26 per cent have more than basic education, the remaining 53 per cent did not complete the basic school education and there is approximately no one who has no formal education. This confirms Oduro (2003)’s findings on Ghana. The decline of years of schooling can also be attributed to child labour as the child labour report 2014 indicates that 44 per cent of the 15-17years age group are engaged in economic activities out of which 46 per cent were not schooling (Ghana Statistical Service, 2014b).
0,38 0,85 1,69
4,45
8,64
12,68
17,78 20,29
17,63
9,74
4,92
0,56 0,28 0,09 0,03 0
5
10
15
20
25
0 0,5 1 2 3 4 5 6 7 8 9 10 11 12 18
Pe
rce
nta
ge (
%)
Years of schooling
Dinah Ani-Asamoah Marbuah: Influence of Parental Income and Educational Attainment on Children’s Years of Schooling: Case of Ghana
24
Figure 4. Years of schooling for children at the age of 8years.
Source: Author’s own construction using data from Ghana Living Standards Survey round 6.
In analysing the years of schooling for 23 years olds (figure 5), we observe spikes in 6, 9, 12 and 13 years of schooling with 9 years of schooling recording the highest per centile followed by 12 years, 13 years and 6 years. The highest per centile which is 27 reflects the proportion of children at age 23 who have completed basic education or secondary/ vocational/technical education attainment, 10 per cent which represent 13 years of schooling is influenced by those who had 4 years of secondary education which was introduced in from 2007- 2009 and the few private schools who still employ the old six form schooling structure. Completion of primary education also contributes to 7 per cent and tertiary education forms 6 per cent. There are very few children with tertiary education followed by secondary and basic education forming the largest proportion.
Figure 5. Years of schooling for children at the age of 23 years.
Source: Author’s own construction using data from Ghana Living Standards Survey round 6.
Parental education is also considered in examining years of schooling for children between 5 and 28 years of age (see Figure 6). It was evident that the majority of parents had no formal education with mothers recording the highest of 68 per cent against the fathers (47 per cent). Parents with tertiary education recorded the least percentage of 5 for fathers and 1 for mothers. Even though the level of education in children has improved, it was evident that that most children, like their parents, have only up to the basic level of education. This Oduro (2003) attributes to policy efforts over the years.
0,4 0,2 1,0 1,2 2,6
3,7
6,7
10,4
14,6 12,3
21,1
9,4
6,1 7,2
2,9
0,1 0,1 0,1 0,0
5,0
10,0
15,0
20,0
25,0
0 0,5 1 2 3 4 5 6 7 8 9 10 11 12 13 15 16 18
Pe
r ce
nta
ge (
%)
Years of schooling
0,2 0,3 1,9 2,0 2,9 2,9
6,9 4,0 4,6
27,3
2,2 2,3
27,0
9,6
0,1 2,9 2,7
0,2 0,0
5,0
10,0
15,0
20,0
25,0
30,0
0 1 2 3 4 5 6 7 8 9 10 11 12 13 14 15 16 18
Pe
r ce
nta
ge (
%)
Years of schooling
Dinah Ani-Asamoah Marbuah: Influence of Parental Income and Educational Attainment on Children’s Years of Schooling: Case of Ghana
25
Figure 6. Distribution of parental education for children between 5 and 28 years.
Source: Author’s own construction using data from Ghana Living Standards Survey round 6
Higher Education
In considering the educational background of children with higher education, it was observed that majority of the parents had no formal education with father’s recording 69 per cent and 81 per cent (figure 7). This is followed by parents with basic, secondary and tertiary education. However, the percentage of fathers with tertiary education (9) is more than fathers with secondary education. The higher per cent of parents of lower level of education with their children in tertiary institution can be associated with the expansion of tertiary education in all the regions, which has made it more accessible. Additionally, these parents may have the resources to pay for the education of their children, as about 89 per cent were found to be rich and very rich. Parent with higher education would expect the same for their children so will invest in their education.
Figure 7. Distribution of educational attainment of children between 17 and 28 years with higher education and parents.
Source: Author’s own construction using data from Ghana Living Standards Survey round 6.
For children between 17 years and 28 years who are expected to be in tertiary institution or have completed but are not, a majority of their parents have no or basic education, and conversely parents with secondary and tertiary education are in the minority.
46,79 39,84
8,12 5,25
67,98
28,14
2,81 1,08 0
10
20
30
40
50
60
70
80
no formal basic secondary tertiary
Per
cen
tage
(%
)
Father Mother
69,14
19,83 5,2 5,83
80,64
15,32 2,33 1,71 0
20
40
60
80
100
no formal basic secondary tertiary
Per
cen
tage
(%)
Educational Attainment
Father Mother
Dinah Ani-Asamoah Marbuah: Influence of Parental Income and Educational Attainment on Children’s Years of Schooling: Case of Ghana
26
Figure 8. Distribution of educational attainment of children between 17 and 28 years and parents without higher education.
Source: Author’s own construction using data from Ghana Living Standards Survey round 6.
The children with no tertiary education may be out of school because they are working in the family business or are self-employed. Those with tertiary educated parents could be out of school due to lack of interest in education and parents’ inability to pay for cost of education as the completion of tertiary education does not guarantee that parents are employed.
Distribution of Tertiary Institutions
Figure 9 shows the distribution of tertiary institutions in Ghana with the number of universities forming 50 per cent, followed by college of education 27 per cent, nursing training 7.9 per cent, polytechnic 7 per cent, public specialised institution 6 per cent and agricultural colleges 2 per cent. The public institutions form approximately 53 per cent of the tertiary institutions and are evenly spread across the country. Conversely, about 68 per cent of the private institutions are concentrated in the Greater Accra region, 8 per cent each in the Ashanti and Eastern region. The remaining 17 per cent is spread across the other 7 regions. The location of the private institution can be attributed to its profit making orientation, i.e. private institution’s will position themselves where the demand for tertiary education is high and majority of people can afford paying the full cost of tuition. Greater Accra has the most tertiary institution, followed by the Ashanti regions, Eastern, Volta, Central, Brong Ahafo, Western and Northern (both have equal number of tertiary institution). The regions with the least number of tertiary institutions are the Upper West and Upper East.
44,2 43,33
7,25 5,22
66,04
30,94
2,18 0,83 0
10
20
30
40
50
60
70
no formal basic secondary tertiary
Pe
r ce
nta
ge (
%)
Educational Attainment
Father Mother
Dinah Ani-Asamoah Marbuah: Influence of Parental Income and Educational Attainment on Children’s Years of Schooling: Case of Ghana
27
Figure 9. Map of Ghana showing regional distribution of tertiary institutions.
Source: Author’s own construction using data from Ministry of Education, Ghana website
We observe from the survey that the public tertiary institutions (77 per cent) are the most patronised and could be attributed to its availability in all regions, cost sharing of fees, longer years of existence which has valued cultural capital and international prestige. Private non-religious is the second most participated tertiary institution, followed by the private religious and the quasi-government controlled (Figure 10).
Figure 10. Preferred Tertiary Institutions for children between 17 and 28 years.
Source: Author’s own construction using data from Ghana Living Standards Survey round 6.
Annual gross household income, considering the minimum to the maximum, was divided into quintiles (Table 7). We find that more than half (65 per cent) of the household income ranges from average to very poor , with rich to very rich forming 35 per cent of the
76,76
6,26
16,53
0,45 0
10
20
30
40
50
60
70
80
90
Public Private religious Private non-religious Quasi gov't
PER
CEN
TAG
E (%
)
N o r t h e r nN o r t h e r n
V o l t aV o l t a
A s h a n t iA s h a n t i
B r o n g A h a f oB r o n g A h a f o
W e s t e r nW e s t e r n
E a s t e r nE a s t e r n
U p p e r W e s tU p p e r W e s t
C e n t r a lC e n t r a l
U p p e r E a s tU p p e r E a s t
G r e a t e r A c c r aG r e a t e r A c c r a
Legend: Regional Distribution of Tertiary Institutions
GHA_adm1
Sum of Fields
21
Agric College
College of Education
Nursing Training College
Polytechnic
Public Specialized Institutions
University
®
0 30 60 90 12015
Kilometers
N o r t h e r nN o r t h e r n
V o l t aV o l t a
A s h a n t iA s h a n t i
B r o n g A h a f oB r o n g A h a f o
W e s t e r nW e s t e r n
E a s t e r nE a s t e r n
U p p e r W e s tU p p e r W e s t
C e n t r a lC e n t r a l
U p p e r E a s tU p p e r E a s t
G r e a t e r A c c r aG r e a t e r A c c r a
Legend: Percentage Share of Tertiary Institutions
GHA_adm1
Tertiary Institutions as Percent of Total
2,158273%
2,158274% - 5,035971%
5,035972% - 8,633094%
8,633095% - 12,230216%
12,230217% - 46,043165%
®
0 30 60 90 12015
Kilometers
Dinah Ani-Asamoah Marbuah: Influence of Parental Income and Educational Attainment on Children’s Years of Schooling: Case of Ghana
28
population. The table illustrate that there are no variations in income of very poor to rich. However, variation in income of the very rich is very high with a deviation of 164 per cent. This implies that income in this group is unequally distributed.
Table 7. Household Income groups.
Income groups % of Households Mean Std. dev. Median Minimum Max
Very Poor 24.4 1,129.86 648.1 1,154 0 2,242.99
Poor 21 3,457.37 765.2 3,404.10 2,243.51 4,887.40
Average 19.3 6,995.05 1,340.50 6,859.20 4,889.81 9,576.95
Very Rich 16.9 66,143.28 108,461.50 36,656.10 20,426.47 2,184,471.00
Source: Author’s own construction using data from Ghana Living Standards Survey round 6.
Table 8 shows that averagely 91 per cent of the parents across income groups have less than secondary education, with fathers dominating the basic education and mothers dominating no formal education. Average educational attainment above basic education across income groups is 10 per cent. Inference can be made from the fact that majority of the economically active population above 15 years of age are self-employed or working with family while a small proportion of the work force are employed in formal institutions.
Table 8. Parents’ educational attainment across income groups.
Income groups no formal Basic Secondary Tertiary no formal basic Secondary Tertiary
Very Poor 2,160 1,275 234 127 1,886 681 57 21
Poor 1,533 1,195 233 129 1,634 607 52 14
Average 1,201 1,139 254 137 1,512 645 60 27
Rich 1,047 1,113 230 165 1,388 636 62 26
Very Rich 911 1,112 238 211 1,309 630 88 35
Total 6,852 5,834 1,189 769 7,729 3,199 319 123
Source: Author’s own construction using data from Ghana Living Standards Survey round 6.
Chapter Five: Findings and Discussion
Introduction
In this chapter the results of the findings using correlation and regression analyses are discussed. The correlation test shows the association between the variables and the existence of multi-collinearity in order to justify the independent variables in the regression analysis. A robust standard error is employed in the estimation to control for heteroscedasticity.
Correlation Analysis
Table 9 shows the correlation between the dependent variable (child’s years of schooling) and the independent variables (income, father’s education, mother’s education, locality). The results of the correlation show a positive relationship between a child’s years of schooling and income, father’s education, mother’s education and living in an urban area which confirms our hypothesis that parent’s income and educational status have a positive influence on child’s years of schooling. On the contrary, living in a rural area and household size had a negative correlation on the child’s years of schooling. This means that children living in the rural areas are more likely to have shorter years of schooling than those in urban areas and children found in families with large household size are likely to have shorter years of schooling compared to those from smaller household. Parents with higher education are likely to have smaller household sizes compared with those with lower education. The correlation also showed that urban families have smaller family sizes than rural dwellers. Parents’ educational level influences the place of location. Parents with high education are most likely to reside in urban areas whereas those with lower education reside in the rural area.
This means that parents with high educational level provide their children with an environment that has easy access to good infrastructure and social amenities. We found out from the analyses that parents’ education is positively correlated, which means that parents are likely to marry people of the same educational background. The highest correlation between the dependent and independent variable is observed in father’s education (0.18), followed by mother’s education (0.15) and income (0.04). This implies that, the higher the parents’ educational attainment the more years of schooling the child obtains. When families earn more income they tends to invest more in the child’s education than low income earning families. Families with low income concentrate on providing the basic necessity (food, clothing and shelter) with all others being of secondary importance (Hoover- Dempsey and Sanlder ,1995).
Table 9. Correlation among parents’ education, income, child’s years of schooling, household size and locality.
Household size Income Father's education Mother's education Child's years of sch. Urban Rural
Household size 1 Income 0.11* 1
Father's education -0.13** 0.04** 1
Mother's education -0.15** 0.02** 0.52** 1 Child's years of sch. -0.16** 0.04** 0.18** 0.15** 1
** p<0.05. Source: Author’s own construction using data from Ghana Living Standards Survey round 6.
Dinah Ani-Asamoah Marbuah: Influence of Parental Income and Educational Attainment on Children’s Years of Schooling: Case of Ghana
30
Regression Analysis
The regression analysis results of the relationship between father’s education, mother’s education, income on child’s years of schooling with household size, gender, locality and ethnicity as controlled variables are shown in Tables 10, 11, and 12, respectively. From Tables 10 to 12, the F-statistic is high and significant indicating that at least one of the explanatory variables is different from zero. In Table 10, the regression covers children between 5 and 28 years of age. Table 11 narrows down the analysis to children between 5 and 15years with the last Table (12) analysing the results of children between the ages of 14 and 28 years. The results of all the analyses affirmed our correlation analysis with parent’s educational attainment and income having a positive relationship with child’s years of schooling, the reference point being parents with no education. In table 10, we observe that a child whose father has basic education has higher years of schooling (0.48) than a child whose father has no education. The years of schooling for a child is higher with father’s attainment of secondary and tertiary education by 0.53 and 1.92 years on average relative to fathers with no education. Similarly, the years of schooling for children are higher (0.30, 0.51, 2.07) as mother’s educational attainment advances from the basic to the tertiary education relative to mothers with no formal education. However, when we merge both parent’s educational attainment we observe that child’s years of schooling is strongly predicted by father’s educational attainment at all levels with a beta coefficient of 0.48 for basic, 0.64 for secondary and 2.11 for tertiary education whereas mothers basic (0.19) and tertiary (1.01) education predicts the years of schooling of the child. Male child’s years of schooling is highly influenced by the father’s educational attainment contrary to mothers educational attainment while female years of schooling is predicted by both parent’s educational attainment. This positive relationship confirms the research studies on children educational attainment by Glick and Sahn (2000), Sackey (2007) and Young-Clark (2014).
Analysis on children between 5 and 15 years in Table 11 reveals that fathers with tertiary education predicts (1.09) child’s years of schooling. Male child’s years of schooling is predicted by fathers’ secondary and tertiary educational attainment. For the girl’s years of schooling we observe that fathers with both basic and tertiary education have positive significant effect when considering only father’s educational attainment. Mothers with secondary education influence years of schooling for females. The free compulsory universal basic education covers children within this age group and could be the reason for parents not having so much influence. Additionally, the cost involved at the basic education level is not expensive; hence education of the child is in the hands of the fathers who form the majority of the heads of households in Ghana.
In Table 12, we see the regression results of years of schooling for children between 14 years and 28 years. The children within this range are expected to be in or completed senior secondary or tertiary education where the cost of education is shared by both the state and the individual. In this category we observe that both parents have significant prediction on the years of schooling of the children. The highest predictor of children’s years of schooling is mothers with tertiary education (3.45 years) when considering only mother’s educational attainment. However, when considering both parents, the fathers with tertiary education (2.39) have relatively higher effect than mothers. There is higher influence on the child’s years of schooling as parental educational advances. Fathers of all levels of education have higher influence on their male child’s years of schooling compared to those with no education. This is higher than the effect of mothers’ educational attainment. Conversely, mothers of all levels of education have greater influence on their female child’s years of schooling than the fathers. This confirms the Ghanaian tradition that the man of the home trains the male children while the training of the female child is left to the mothers. However, when educational attainment of father and mother are observed individually, we
Dinah Ani-Asamoah Marbuah: Influence of Parental Income and Educational Attainment on Children’s Years of Schooling: Case of Ghana
31
noticed that mothers with secondary and tertiary education have greater influence on years of schooling of their children than the fathers.
We also observe that income has a direct relationship with years of schooling for all age groups in all three tables (Tables 10, 11 and 12). Expectedly, a child from a home with more income would have longer years of schooling compared to a child from a less privileged home. Income of parents for the entire sample has a beta coefficient of 0.24 (Table 10), for children at below 15 years is 0.12 (Table 11) and 0.14 for children between 14 years and 28 years (Table 12). This shows that income’s influence on children’s years of schooling at secondary and tertiary level is relatively higher than the basic for all gender. Income also has more influence on the male child’s years of schooling (0.27, 0.15) than the female child (0.22, 0.09) as shown in Table 10 and Table 11. However, in Table 12, we observed that income is a higher predicator of female years of schooling (0.16) to that of male (0.11).
The male child has higher years of schooling than the female child at all levels of education as observed in the regression analysis. In considering the entire sample (Table 10), the male child has 0.33 years of schooling higher than the female child; the same is seen in the basic education (0.17) as well as the secondary and higher education (0.26). This implies that as the children climb up the education ladder the male child has an advantage acquiring higher or more years of schooling compared to the female child.
There is an inverse relationship between size of the household and child’s years of schooling. This means that as the household size increases the years of schooling reduces since parents may not have enough to cater for the child to continue schooling when income is shared for the family. However, a smaller household may have enough for the child to continue schooling. We observe this in the northern part of the country where poverty is predominant, household size is larger than the national average size and school attendance is lower. In Tables 11 and 12, we also observe that household size has a higher predictability of years of schooling of children above 14 years (0.14) than those 14 years and below (0.04).
Additionally, one’s residential location also influences their years of schooling. The results as shown in Table 10 predict that residing in the rural area lowers a child’s years of schooling (1.32) relative to those residing in urban area. This is as a result of unequal distribution of social infrastructure where we find majority of the urban area with access to electricity, potable water, educational infrastructure and close proximity to these amenities. Those in the rural areas may be distant in proximity or not existent at all. This finding is not surprising since about 38 per cent of children in the rural areas were economically engaged out of which 42 per cent were not schooling (Ghana Statistical Service, 2014b).
Finally, we find that generally ethnic groups have greater influence on their male children’s years of schooling compared to their female children. Children from Akan ethnic group have relatively higher years of schooling.
Dinah Ani-Asamoah Marbuah: Influence of Parental Income and Educational Attainment on Children’s Years of Schooling: Case of Ghana
32
Table 10. Regression Results for Children years of schooling (5<years<28).
ALL Males Females
(1) (2) (3) (4) (5) (6) (7) (8) (9)
VARIABLES Father Mother Both Father Mother Both Father Mother Both
Robust standard errors in parentheses*** p<0.01, ** p<0.05, * p<0.1.
In table 13, we advance the analysis to ascertain the predictors of child’s years of schooling for expected ages for the completion of basic, secondary and tertiary education thus 15-16 years, 17-18 years and 23-24 years respectively. We observe that father’s level of education influences the years of schooling for both male and female children across all age groups (level of education). Children’s years of schooling increases as the father’s education advances with tertiary education being the highest predictor. Father’s educational influence on children’s years of schooling is highest at age 18-19 years (after completion of secondary education). At ages 23-24, father’s level of education (basic and secondary) tends to have more influence on the females than the males. However, the predication of father with tertiary level attainment on male’s education is greater than that of the female. Mother’s education has significant influence on children aged 23-24 year with a magnitude greater than that of the father’s. They however turn to focus on the female child’s years of schooling. Father’s significant influence at the pre-tertiary education compared with mothers may be associated with the lower cost of education at that level and the fact that most of the households are headed by men who are expected to be the bread winners of the family. Conversely, the tertiary education is very costly which may require the support of the mother financially, hence the mother’s involvement resulting to a significant impact on the years of
Dinah Ani-Asamoah Marbuah: Influence of Parental Income and Educational Attainment on Children’s Years of Schooling: Case of Ghana
35
schooling. Income of parents has a direct relationship with child’s years of schooling at the basic
level and tertiary education. This suggest that as the income of parents increases the child’s years of schooling increases and as income declines, the years of schooling also does. This may be alluded to the fact that parents have more responsibility at the basic and tertiary level in terms of transportation to school, feeding, clothing and shelter compared to secondary schools where boarding schools receives subsidies from the government in feeding and housing students.
Table 13. Regression Results for Children years of schooling (ages 15-16 years, 18-91 years and 23-24 years).
15 – 16 18 – 19 23 – 24
(1) (2) (3) (4) (5) (6) (7) (8) (9)
VARIABLES All Male Female All Male Female All Male Female
F stat 8.209 5.072 4.118 12.30 6.176 7.255 16.71 8.207 11.49
Robust standard errors in parentheses *** p<0.01, ** p<0.05, * p<0.1.
Dinah Ani-Asamoah Marbuah: Influence of Parental Income and Educational Attainment on Children’s Years of Schooling: Case of Ghana
36
It was observed that the gender of the child also influences the years of schooling. The male gender has a higher influence on the years of schooling of the child compared to the female child. As the male child advances in his education, his years of schooling increase. The regression analysis in Table 5.5 shows that male child of ages 23 and 24 have higher years of schooling (1.14) compared to the female child. This means that males would generally be more educated than the females especially at higher levels of education.
The size of the household also determines if the children will be able to advance in their education. Children aged 15-16 years and 23-24 years from a family with a large household size experience lower years of schooling since resource allocation per child for education reduces. Inversely, a smaller household will be able to invest more in the years of schooling for their children.
Chapter Six: Summary of Findings and Conclusions
Summary of Findings
The study examined the impact of parental educational attainment and income level on children’s years of schooling in Ghana. In the study, we enquired if parental income and educational level have an effect on children’s years of schooling and if this is influenced by gender. We also sought to understand if the level of education of the paternal and maternal parent has influence on the years of schooling and if this is also influenced by gender. Based on these, we hypothesised that the socio-economic status of parents (particularly income level and educational status) has a (positive) influence on the years of schooling of their children. We also tested that there is a positive relationship between father’s educational attainment and son’s years of schooling as well as mother’s educational attainment and daughter’s years of schooling. We observed a positive correlation among parental income, educational attainment and years of schooling of their children. We observe from regression analyses that mother’s and father’s educational attainment predicts their children’s years of schooling. However, father’s educational attainment has a stronger influence on children’s years of schooling at the basic level compared to mothers. At the secondary and higher level, both parents’ educational attainment is significant with father’s being a stronger predictor of the male child’s years of schooling while the mother’s influences that of the female. By narrowing down to specific age groups: 15-16 years, 18-19 years and 23-24 years at which time persons would have attained basic, secondary and tertiary education, respectively, we observe the same with regard to the fact that father’s educational attainment significantly influences children at all levels of education with stronger relationship for the males than the females. Conversely, mother’s educational attainment was significant at the tertiary level with stronger relationship for the female-child. Even though there is a change in years of schooling for females as parents’ educational attainment progresses, there are still more males in school compared to females.
Household income also influences the educational outcome of children. Children from high income earning households are expected to acquire more years of schooling than children from low income households. Rural areas in Ghana which are associated with large household sizes have negative influence on children’s years of schooling, while their urban counterparts generally have smaller household sizes and with a positive influence established. This reflects the Becker and Tomes’ (1986) accession from the investment theory that parent’s resources have an inverse relationship with the number of children in the family. The income of the parent is constrained by the number of children in the family hence influencing the allocation of investment per child which directly or indirectly impact on the years of schooling. We also observed that income is a stronger predictor of years of schooling at the higher levels of education (secondary and tertiary) compared to the basic level. A result in line with Mayer (2002) analysis which drew conclusion that income is of higher importance at adolescence than childhood.
Basic education is the dominant educational attainment among children between 5 and 28 years, followed by secondary with tertiary education being the least. There has been a decline in children with no formal education when compared with their parents’ educational attainment. This can be linked to implementation of the free compulsory universal basic education policy at the basic level, while the cost of education at higher levels may influence the decline in participation. There is high concentration of tertiary institutions in the urban areas with private institutions being the majority in this area. This is because private educational institutions are profit oriented and position themselves where there is high
Dinah Ani-Asamoah Marbuah: Influence of Parental Income and Educational Attainment on Children’s Years of Schooling: Case of Ghana
38
demand for education; however, state tertiary institutions are spread across the country. Children in tertiary education have parents with various educational attainments. This has become possible due to the easy access to tertiary institutions through its expansion in all the regions with the involvement of both the government and private sector. Additionally, parents understand the relevance of investing in higher education for their children, hence those with financial resources are willing to invest in their children’s education.
The study confirms our hypotheses as it reveals an intergenerational transmission of capital which is in line with the investment theory that parent’s resources and their decision on number to invest in their children, reside either in the rural or urban area and number of children influences the children’s educational outcome. It also confirms Sackey’s (2007) analysis which supports the significant impact of mothers and fathers’ education and household resources on children’s life.
Conclusion
In summary, the study shows that the use of the increased educational offer is socially and gender skewed. Additionally, the families mediate the ambition of the state. Our finding that mothers, irrespective of their educational attainment do not have significant influence on their children’s basic education is striking. However, at the tertiary level they have significant influence over their girls’ education than boys. Conversely, fathers have significant influence at all levels of children’s education with greater influence over the boys than the girls. These findings are unique to the Ghanaian case as it may likely be linked to the peculiar cultural setting of Ghanaian families and how education decisions are made and implemented. Going forward, it will be interesting to investigate further to find out how cultural practices of Ghana influence decisions in investing in the girl or boy child’s education. How investment decisions of parents influences gender equity in the country will shed more light in enhancing our understanding of this dynamic.
The study contributes to varied literature which supports the fact that the higher the parent’s cultural and economic capital, the higher the child’s educational attainment and vice versa. In particular, this study makes a modest contribution to the relatively limited literature on understanding the key drivers of educational attainment within the Ghanaian context.
References Aheto-Tsegah, C. (2011). Education in Ghana–status and challenges. Commonwealth Education Partnerships, 27-29. Akyeampong, K. (2010). 50 years of educational progress and challenge in Ghana. Becker, G. S. (1993). Nobel lecture: The economic way of looking at behavior. Journal of political economy, 101(3), 385-
409. Becker, G. S., & Tomes, N. (1986). Human capital and the rise and fall of families. Journal of labor economics, 4(3, Part 2),
S1-S39. Blaskó, Z. (2003). Cultural Reproduction or Cultural Mobility? Review of Sociology, 9(1), 5-26. Boateng, J. and Ampofo, A.A. (2016). How parenting in Ghana shapes sexist stereotypes. The Conversation. Available
at http://theconversation.com/how-parenting-in-ghana-shapes-sexist-stereotypes-51823 Bourdieu, P. (1984). Distinction: A Social Critique of the Judgement of Taste, Harvard University Press. Bourdieu, P. (2000). Pascalian Meditations. Stanford University Press. Bourdieu, P., Castel, R., Schnapper, D., Boltanski, L., Lagneau, G., & Chamboredon, J. C. (1965). Un art moyen: essai sur
les usages sociaux de la photographie. Les éditions de Minuit. Bourdieu, P., Darbel, A., & Schnapper, D. (1966). L’amour de l’art, les musées d’art et leur public. Paris, Éditions de Minuit. Bourdieu, P., & Passeron, J. C. (1979). The inheritors: French students and their relation to culture. Univ of Chicago Pr. Calarco, J. M. (2014). Coached for the classroom: Parents’ cultural transmission and children’s reproduction of
educational inequalities. American Sociological Review, 79(5), 1015-1037. Coleman, J. S. (1988). Social capital in the creation of human capital. American journal of sociology, 94, S95-S120. Conger, R. D., & Donnellan, M. B. (2007). An interactionist perspective on the socioeconomic context of human
development. Annu. Rev. Psychol., 58, 175-199. Crompton, R. (2008). Class and Stratification. Polity. Darvas, P., & Balwanz, D. (2013). Basic education beyond the Millennium Development Goals in Ghana: How equity in service
delivery affects educational and learning outcomes. World Bank Publications. Davis-Kean, P. E. (2005). The influence of parent education and family income on child achievement: the indirect role
of parental expectations and the home environment. Journal of family psychology, 19(2), 294. Donkor A.K. (2010) Parental Involvement in Education in Ghana: The case of a private elementary school,
International Journal about Parents in Education, 4(1), 23–38. Eccles, J. S. (2005). Influences of parents' education on their children's educational attainments: The role of parent and
child perceptions. London review of education, 3(3), 191-204. Education for All (2013): Education for all global monitoring report: Education Transforms lives. Paris, UNSESCO.
Available at http://unesdoc.unesco.org/images/0022/002231/223115E.pdf Education for All (2010): Education for all global monitoring report: Education counts towards the Millennium Development
Goals. Paris, UNESCO. Available at http://unesdoc.unesco.org/images/0019/001902/190214e.pdf. Education Indicators in Focus (2013). What are the social benefits of education? OCED. Available at
EP-Nuffic (2015). The Ghanaian educational system described and compared with the Dutch system. Available at https://www.epnuffic.nl/en/publications/find-a-publication/education-system-ghana.pdf.
Evertsson, J. (2015). History, nation and school inspections: the introduction of citizenship education in elementary schools in late nineteenth-century Sweden. History of Education, 44(3), 259-273.
Ghana Statistical Service. (2000). Ghana Living Standards Survey Report of the Fourth Round (GLSS 4). Accra, Ghana Statistical Service.
Ghana Statistical Service (2008). Ghana Living Standards Survey Report of the Fifth Round (GLSS 5). Accra, Ghana Statistical Service.
Ghana Statistical Service (2012): 2010 Population and Housing Census summary report of final results. Accra, Ghana Statistical Service.
Ghana Statistical Service (2014a). Ghana Living Standards Survey Round 6 (GLSS 6). Accra, Ghana Statistical Service. Ghana Statistical Service (2014b). Ghana Living Standards Survey Round 6 (GLSS 6): Child labour Report. Accra, Ghana
Statistical Service. Ghana Statistical Service (2015). Ghana Poverty Mapping Report. Accra, Ghana Statistical Service. Ghana Statistical Service (GSS), Ghana Health Service (GHS), and ICF International (2015): Ghana Demographic and
Health Survey 2014. Rockville, Maryland, USA: GSS, GHS, and ICF International. Glick, P., & Sahn, D. E. (2000). Schooling of girls and boys in a West African country: the effects of parental
education, income, and household structure. Economics of education review, 19(1), 63-87. Green, A. (2000): “Education and State Formation Revisited”, in History of Education: Major Themes. Vol 2, Education in Its
Social Context ed. Roy Lowe, London: Routledge, pp. 303- 321. Haveman, R., & Wolfe, B. (1995). The determinants of children's attainments: A review of methods and findings.
Journal of economic literature, 33(4), 1829-1878.
Dinah Ani-Asamoah Marbuah: Influence of Parental Income and Educational Attainment on Children’s Years of Schooling: Case of Ghana
40
Hayford, B. K. (1988). Social studies for JSS. Accra: Curriculum Research and Development Division (CRDD). Hoover-Dempsey, K. V., & Sandler, H. M. (1995). Parental involvement in children's education: Why does it make a
difference?. Teachers college record. International Bureau of Education (2010). World Data on Education. 7th edition, 2010/11, UNESCO-IBE . Available
at http://www.ibe.unesco.org/. Kim, Y. (2010). Impacts of parental resources on child educational outcomes: Assets and mediating pathways. Kosack, S. (2012). The education of nations: How the political organization of the poor, not democracy, led governments to invest in mass
education. Oxford University Press on Demand. Little, A. W. (2010): Access to Basic Education in Ghana: politics, policies and progress. Majgaard, K., & Mingat, A. (2012). Education in sub-Saharan Africa: A comparative analysis. World Bank Publications. Maps of World. Available at http://www.mapsofworld.com/lat_long/ghana-lat-long.html Martin, C. A. (1976). Significant trends in the development of Ghanaian education. The Journal of Negro Education, 45(1),
46-60. Mayer, S. E. (2002). The influence of parental income on children's outcomes. Wellington, New Zealand: Knowledge
Management Group, Ministry of Social Development. Mensah, F. K., & Kiernan, K. E. (2010). Gender differences in educational attainment: influences of the family
environment. British Educational Research Journal, 36(2), 239-260. Meyer, J. W., Ramirez, F. O., & Soysal, Y. N. (1992). World expansion of mass education, 1870-1980. Sociology of
education, 128-149. Ministry of Education (MoE) Ghana (2013). Education Sector Performance Report. Accra, Ghana: MoE National Council for Tertiary Education (2014). Basic Statistics on Tertiary Education Institution 2012/2013. Accra,
National Council for Tertiary Education National Education Forum (1999). Towards Sustaining an Effective National Education System. Accra: Ministry of Education Oduro, A. (2008). An investigation into poverty, educational attainment and outcomes in Ghana. Ghana
Working Paper (Meta Analysis) Series, p.28, Cambridge. Available at http://nbn-resolving.de/urn:nbn:de:0168-ssoar-69343
Pearson, K. (1896). Mathematical contributions to the theory of evolution. III. Regression, heredity, and panmixia. Philosophical Transactions of the Royal Society of London. Series A, containing papers of a mathematical or physical character, 187, 253-318.
Poku, J., Aawaar, G. M., & Worae, A. T. (2013). Educational sector reforms in Ghana: A review. Global Research Journal of Education, 3 (2), 20, 31.
Sackey, H. A. (2007). The determinants of school attendance and attainment in Ghana: a gender perspective (Vol. 173). Nairobi: African Economic Research Consortium.
Schultz, T. W. (1961). Investment in human capital. The American economic review, 1-17. The Basic Education Division of Ghana Education Service (2004). The Development of Education National Report of Ghana.
Presentation at the forty-seventh session of the International Conference on Education (ICE) Geneva. Tuwor, T., & Sossou, M. A. (2008). Gender discrimination and education in West Africa: strategies for maintaining
girls in school. International Journal of Inclusive Education, 12(4), 363-379. United Nations Development Programmes (2015). Human Development Report 2015: Work for Human Development. New
York, UNDP. United Nations Development Programmes (2014). Human Development Report 2014, Sustaining Human Progress: Reducing
Vulnerabilities and Building Resilience. New York, UNDP. Willingham, D. T. (2012). Ask the Cognitive Scientist: Why Does Family Wealth Affect Learning?. American
Educator, 36(1), 33-39. World Bank (2004). Books, Buildings, and Learning Outcomes: An Impact Evaluation of World Bank Support to Education in
Ghana. Washington DC, World Bank. Young-Clark, I. M. (2014). Correlations between parents’ academic achievements, emerging adult children's perception
of their parents’ socio-economic status and the educational attainment of the emerging adult children. Graduate Theses and Dissertations. Paper 13795.