The influence of shear on the rotation capacity of one-way slabswithout shear reinforcement is investigated in this paper by meansof an experimental study. The experimental program consisted of11 slab strips 8400 mm (331 in.) long and 450 mm (17.7 in.) thickwith a flexural reinforcement ratio of 0.79%. The rotation capacitywas investigated for various values of the shear span and for twotypes of flexural reinforcement (hot-rolled and cold-worked bars).The specimens developed shear failures with and without yieldingof the flexural reinforcement and one specimen failed in flexurewith rupture of the tensile reinforcement. The results clearly showthat the rotation capacity at failure is governed by shear. Based onthe test results, and considering the principles of the criticalshear-crack theory (CSCT), an analytical expression is proposed toestimate the rotation capacity of one-way members without trans-verse reinforcement accounting for shear.
INTRODUCTIONTraditionally, the rotation capacity of one-way slabs
without shear reinforcement is expressed as a function of thedepth of the compression zone and the ductility of the flexuralreinforcing steel for most theoretical models1-3 and codes ofpractice.4,5 This is justified because failure develops inflexure by crushing of the concrete in compression or byrupture of the tensile reinforcement.1 Failures in flexuretypically lead (provided that the minimum and maximumamounts of flexural reinforcement are respected) to a veryductile behavior, with a large capacity to redistribute innerforces within a structural system. A similar behavior is alsoobserved for members with sufficient transverse reinforcement.6
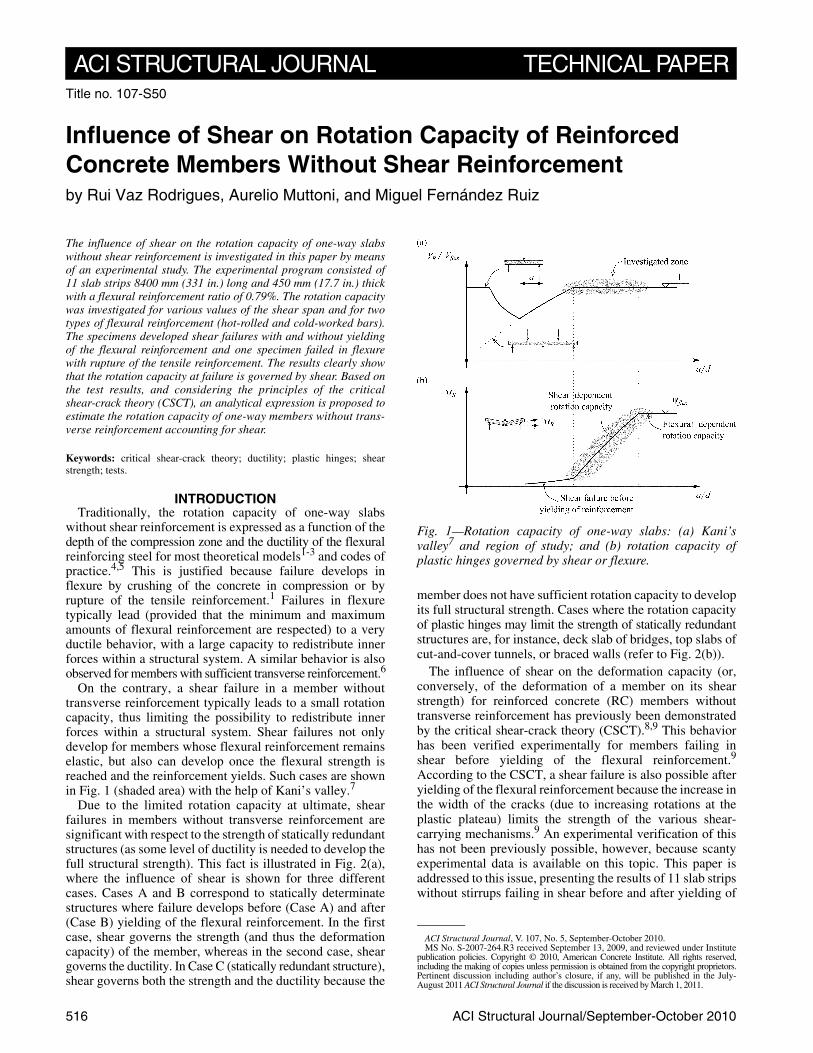
On the contrary, a shear failure in a member withouttransverse reinforcement typically leads to a small rotationcapacity, thus limiting the possibility to redistribute innerforces within a structural system. Shear failures not onlydevelop for members whose flexural reinforcement remainselastic, but also can develop once the flexural strength isreached and the reinforcement yields. Such cases are shownin Fig. 1 (shaded area) with the help of Kani’s valley.7
Due to the limited rotation capacity at ultimate, shearfailures in members without transverse reinforcement aresignificant with respect to the strength of statically redundantstructures (as some level of ductility is needed to develop thefull structural strength). This fact is illustrated in Fig. 2(a),where the influence of shear is shown for three differentcases. Cases A and B correspond to statically determinatestructures where failure develops before (Case A) and after(Case B) yielding of the flexural reinforcement. In the firstcase, shear governs the strength (and thus the deformationcapacity) of the member, whereas in the second case, sheargoverns the ductility. In Case C (statically redundant structure),shear governs both the strength and the ductility because the
member does not have sufficient rotation capacity to developits full structural strength. Cases where the rotation capacityof plastic hinges may limit the strength of statically redundantstructures are, for instance, deck slab of bridges, top slabs ofcut-and-cover tunnels, or braced walls (refer to Fig. 2(b)).
The influence of shear on the deformation capacity (or,conversely, of the deformation of a member on its shearstrength) for reinforced concrete (RC) members withouttransverse reinforcement has previously been demonstratedby the critical shear-crack theory (CSCT).8,9 This behaviorhas been verified experimentally for members failing inshear before yielding of the flexural reinforcement.9
According to the CSCT, a shear failure is also possible afteryielding of the flexural reinforcement because the increase inthe width of the cracks (due to increasing rotations at theplastic plateau) limits the strength of the various shear-carrying mechanisms.9 An experimental verification of thishas not been previously possible, however, because scantyexperimental data is available on this topic. This paper isaddressed to this issue, presenting the results of 11 slab stripswithout stirrups failing in shear before and after yielding of
Title no. 107-S50
Influence of Shear on Rotation Capacity of Reinforced Concrete Members Without Shear Reinforcementby Rui Vaz Rodrigues, Aurelio Muttoni, and Miguel Fernández Ruiz
Fig. 1—Rotation capacity of one-way slabs: (a) Kani’svalley7 and region of study; and (b) rotation capacity ofplastic hinges governed by shear or flexure.
517ACI Structural Journal/September-October 2010
the flexural reinforcement. Based on these results, and usingthe CSCT principles, an analytical expression to estimate therotation capacity of one-way members accounting for shearis proposed.
RESEARCH SIGNIFICANCECurrently, the design of one-way slabs without transverse
reinforcement does not consider the influence of shear on theductility of the member. As a consequence, unsafe estimatesof the strength for statically redundant structures may result.This paper introduces the results of an experimental studyinvestigating the influence of shear on the rotation capacityof plastic hinges. Based on these results, and according to theprinciples of the CSCT, a rational approach for estimatingthe rotation capacity of such members is proposed.
EXPERIMENTAL PROGRAMSpecimens
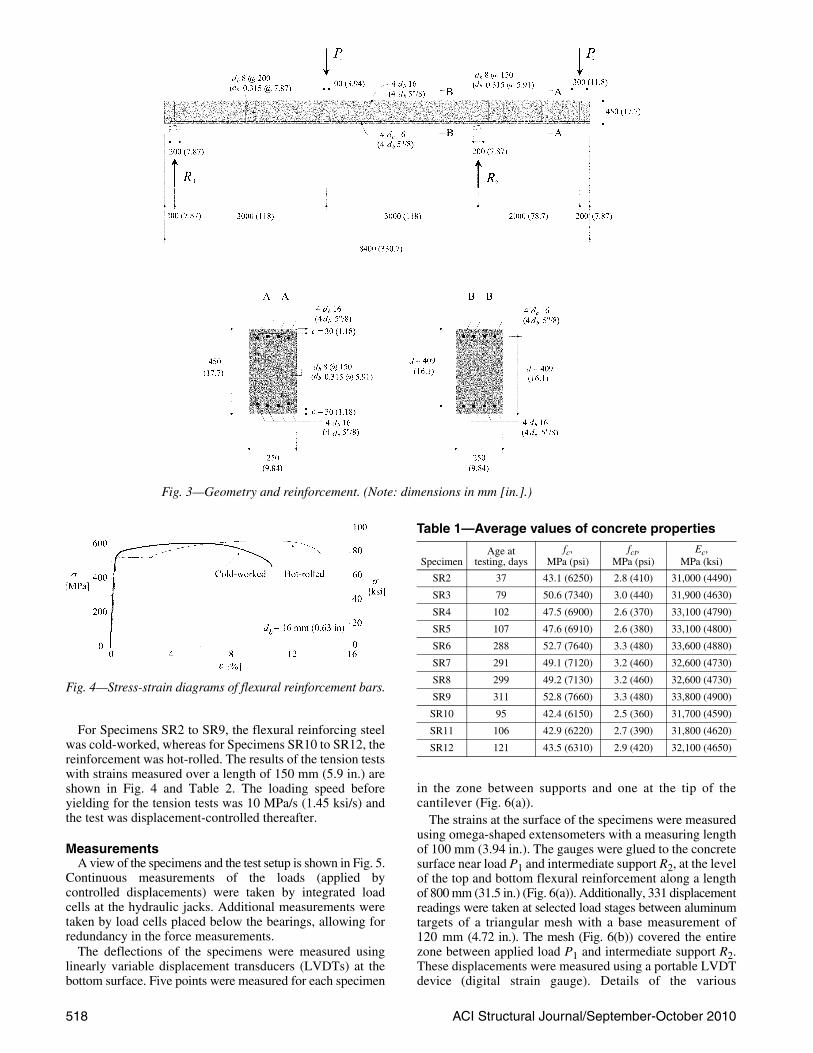
The tested specimens were slab strips (beams) with aconstant rectangular section 450 x 250 mm (17.7 x 9.84 in.)and a total length of 8400 mm (331 in.), as shown in Fig. 3.The top and bottom longitudinal reinforcement for allspecimens consisted of four bars 16 mm (5/8 in.) in diameter,which were placed in a single layer to reproduce the usualreinforcement layout of one-way slabs. The flexural rein-forcement ratio of the specimens was thus ρ = 0.79%. Theeffective depth (distance from the extreme compression fiberto the centroid of the longitudinal tensile reinforcement) was409 mm (16.1 in.) for all of the specimens. The beams weresimply supported, with a main span of 6000 mm (236 in.)and a cantilever length of 2000 mm (78.7 in.).
Two loads were applied by means of two independenthydraulic jacks: P1 at midspan, and P2 at the tip of the canti-lever (Fig. 3). The load was introduced at midspan through asteel plate 100 x 250 x 30 mm (3.94 x 9.84 x 1.18 in.). At thetip of the cantilever, the load was introduced using a systemcomposed of two steel plates of 300 x 450 x 50 mm (11.8 x17.7 x 1.97 in.), allowing both to push and pull at thatpoint. The bearings of the specimens were composed oftwo rollers allowing horizontal displacements. The beamswere horizontally restrained at the tip of the cantilever. Theywere thus statically determinate (Fig. 3), but the staticsystem allowed for introducing a hogging or saggingmoment at the intermediate support.
No shear reinforcement was placed between the appliedload P1 and the intermediate support; but outside this region,stirrups were provided to prevent shear failure (Fig. 3). The
ratio between the two applied loads was different for the 11beams, which allowed varying the shear span of the specimens(this will be discussed in a following section). The ratio waskept approximately constant during each test. For somespecimens in which two shear failures developed (SpecimensSR6, SR7, and SR9), however, the ratio had to be modifiedbetween the first and second shear failures.
Material propertiesNormal-strength concrete was used in all of the specimens.
The compressive strength, modulus of elasticity, and tensilestrength of concrete are detailed in Table 1, together with theage of each specimen at the time of testing. The properties ofconcrete were measured on 320 mm (12.6 in.) high concretecylinders with a diameter equal to 160 mm (6.30 in.). Theconcrete compressive strength at the time of testing rangedfrom 42.4 to 52.8 MPa (6150 to 7660 psi). The values of themodulus of elasticity, given in Table 1, correspond to thesecant stiffness between compressive stresses 1 to 10 MPa(145 to 1450 psi). The tensile strength was obtained frompure tension tests.
The composition of 1 m3 (1.308 yd3) of concrete was 929 kg(2050 lb) of sand, 408 kg (900 lb) of gravel ranging from4 to 8 mm (0.158 to 0.315 in.) in diameter, 521 kg (1150 lb)of gravel ranging from 8 to 16 mm (0.315 to 0.630 in.) indiameter, 440 kg (970 lb) of portland cement, and 190 kg(418 lb) of water. The maximum size of the aggregate was16 mm (0.63 in.).
Rui Vaz Rodrigues is a Lecturer and Research Scientist at the Instituto SuperiorTécnico (IST), Technical University of Lisbon, Lisbon, Portugal. He received hisdiploma in civil engineering from IST in 2002 and his PhD from the École PolytechniqueFédérale de Lausanne (EPFL), Lausanne, Switzerland, in 2007. His research interestsinclude shear, punching shear, and the structural assessment of reinforced concretebridge deck slabs.
ACI member Aurelio Muttoni is Professor and Head of the Structural ConcreteLaboratory, École Polytechnique Fédérale de Lausanne. He received his diploma andPhD in civil engineering from the Swiss Federal Institute of Technology, Zurich,Switzerland, in 1982 and 1989, respectively. His research interests include thetheoretical bases of the design of reinforced concrete structures, shear and punchingshear, fiber-reinforced high-strength concrete, soil-structure interaction, and theconceptual design of bridges.
Miguel Fernández Ruiz is Lecturer and Research Scientist at the École PolytechniqueFédérale de Lausanne. He received his diploma in civil engineering from thePolytechnic University of Madrid, Madrid, Spain, in 2001 and his PhD from the sameuniversity in 2004. His research interests include the serviceability behavior ofstructures, bond, shear and punching shear, and the modeling of structural concreteusing stress fields.
Fig. 2—Behavior of slabs without shear reinforcement: (a)shear failure before and after yielding of flexural reinforcement;and (b) examples of statically redundant structures withoutshear reinforcement.
518 ACI Structural Journal/September-October 2010
For Specimens SR2 to SR9, the flexural reinforcing steelwas cold-worked, whereas for Specimens SR10 to SR12, thereinforcement was hot-rolled. The results of the tension testswith strains measured over a length of 150 mm (5.9 in.) areshown in Fig. 4 and Table 2. The loading speed beforeyielding for the tension tests was 10 MPa/s (1.45 ksi/s) andthe test was displacement-controlled thereafter.
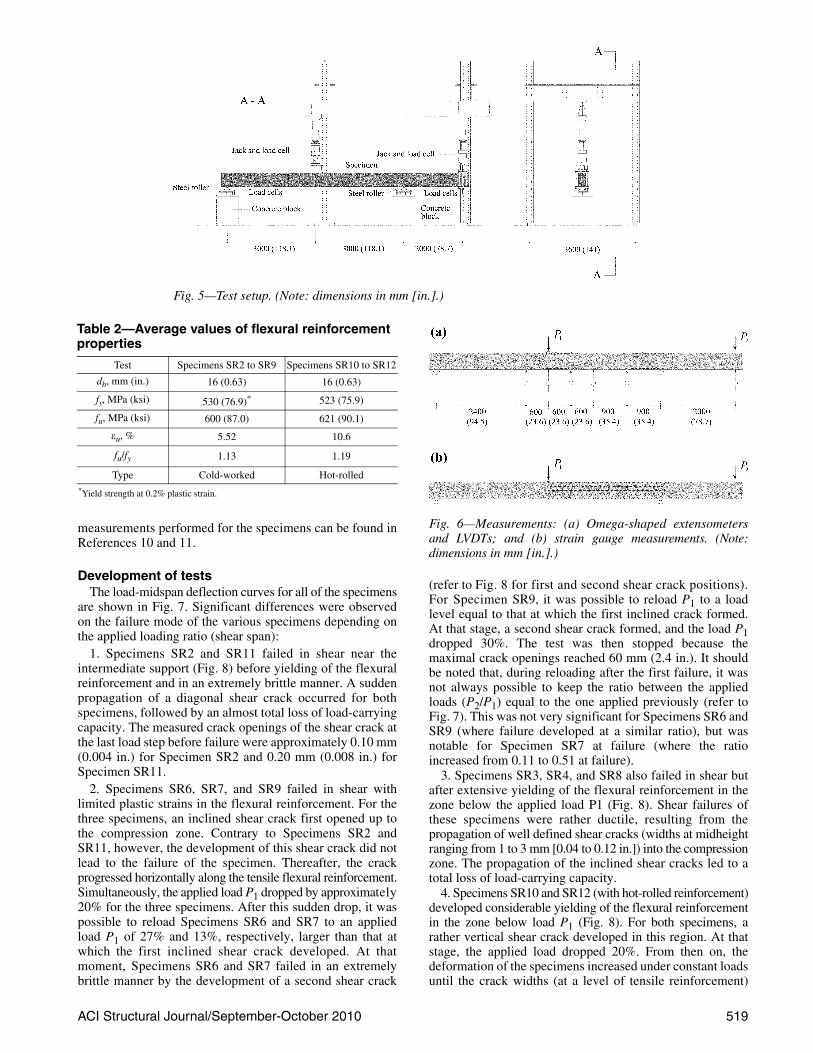
MeasurementsA view of the specimens and the test setup is shown in Fig. 5.
Continuous measurements of the loads (applied bycontrolled displacements) were taken by integrated loadcells at the hydraulic jacks. Additional measurements weretaken by load cells placed below the bearings, allowing forredundancy in the force measurements.
The deflections of the specimens were measured usinglinearly variable displacement transducers (LVDTs) at thebottom surface. Five points were measured for each specimen
in the zone between supports and one at the tip of thecantilever (Fig. 6(a)).
The strains at the surface of the specimens were measuredusing omega-shaped extensometers with a measuring lengthof 100 mm (3.94 in.). The gauges were glued to the concretesurface near load P1 and intermediate support R2, at the levelof the top and bottom flexural reinforcement along a lengthof 800 mm (31.5 in.) (Fig. 6(a)). Additionally, 331 displacementreadings were taken at selected load stages between aluminumtargets of a triangular mesh with a base measurement of120 mm (4.72 in.). The mesh (Fig. 6(b)) covered the entirezone between applied load P1 and intermediate support R2.These displacements were measured using a portable LVDTdevice (digital strain gauge). Details of the various
Fig. 3—Geometry and reinforcement. (Note: dimensions in mm [in.].)
Table 1—Average values of concrete properties
SpecimenAge at
testing, daysfc,
MPa (psi)fct,
MPa (psi)Ec,
MPa (ksi)
SR2 37 43.1 (6250) 2.8 (410) 31,000 (4490)
SR3 79 50.6 (7340) 3.0 (440) 31,900 (4630)
SR4 102 47.5 (6900) 2.6 (370) 33,100 (4790)
SR5 107 47.6 (6910) 2.6 (380) 33,100 (4800)
SR6 288 52.7 (7640) 3.3 (480) 33,600 (4880)
SR7 291 49.1 (7120) 3.2 (460) 32,600 (4730)
SR8 299 49.2 (7130) 3.2 (460) 32,600 (4730)
SR9 311 52.8 (7660) 3.3 (480) 33,800 (4900)
SR10 95 42.4 (6150) 2.5 (360) 31,700 (4590)
SR11 106 42.9 (6220) 2.7 (390) 31,800 (4620)
SR12 121 43.5 (6310) 2.9 (420) 32,100 (4650)
Fig. 4—Stress-strain diagrams of flexural reinforcement bars.
ACI Structural Journal/September-October 2010 519
measurements performed for the specimens can be found inReferences 10 and 11.
Development of testsThe load-midspan deflection curves for all of the specimens
are shown in Fig. 7. Significant differences were observedon the failure mode of the various specimens depending onthe applied loading ratio (shear span):
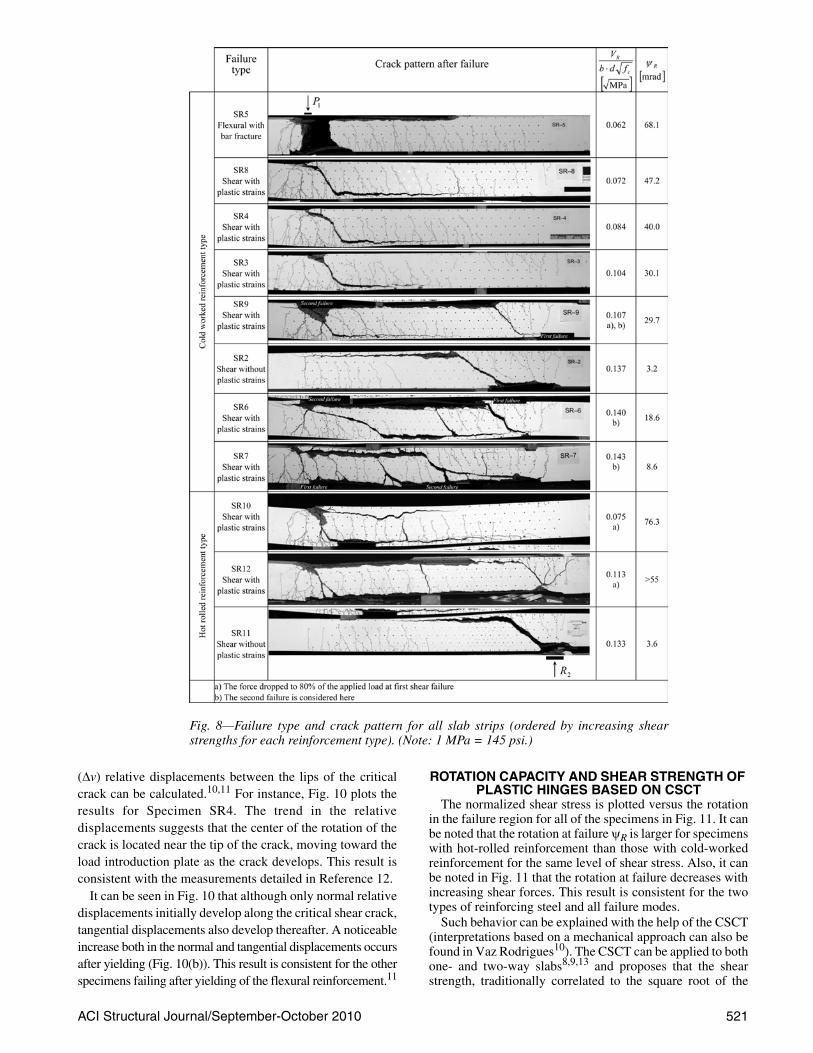
1. Specimens SR2 and SR11 failed in shear near theintermediate support (Fig. 8) before yielding of the flexuralreinforcement and in an extremely brittle manner. A suddenpropagation of a diagonal shear crack occurred for bothspecimens, followed by an almost total loss of load-carryingcapacity. The measured crack openings of the shear crack atthe last load step before failure were approximately 0.10 mm(0.004 in.) for Specimen SR2 and 0.20 mm (0.008 in.) forSpecimen SR11.
2. Specimens SR6, SR7, and SR9 failed in shear withlimited plastic strains in the flexural reinforcement. For thethree specimens, an inclined shear crack first opened up tothe compression zone. Contrary to Specimens SR2 andSR11, however, the development of this shear crack did notlead to the failure of the specimen. Thereafter, the crackprogressed horizontally along the tensile flexural reinforcement.Simultaneously, the applied load P1 dropped by approximately20% for the three specimens. After this sudden drop, it waspossible to reload Specimens SR6 and SR7 to an appliedload P1 of 27% and 13%, respectively, larger than that atwhich the first inclined shear crack developed. At thatmoment, Specimens SR6 and SR7 failed in an extremelybrittle manner by the development of a second shear crack
(refer to Fig. 8 for first and second shear crack positions).For Specimen SR9, it was possible to reload P1 to a loadlevel equal to that at which the first inclined crack formed.At that stage, a second shear crack formed, and the load P1dropped 30%. The test was then stopped because themaximal crack openings reached 60 mm (2.4 in.). It shouldbe noted that, during reloading after the first failure, it wasnot always possible to keep the ratio between the appliedloads (P2/P1) equal to the one applied previously (refer toFig. 7). This was not very significant for Specimens SR6 andSR9 (where failure developed at a similar ratio), but wasnotable for Specimen SR7 at failure (where the ratioincreased from 0.11 to 0.51 at failure).
3. Specimens SR3, SR4, and SR8 also failed in shear butafter extensive yielding of the flexural reinforcement in thezone below the applied load P1 (Fig. 8). Shear failures ofthese specimens were rather ductile, resulting from thepropagation of well defined shear cracks (widths at midheightranging from 1 to 3 mm [0.04 to 0.12 in.]) into the compressionzone. The propagation of the inclined shear cracks led to atotal loss of load-carrying capacity.
4. Specimens SR10 and SR12 (with hot-rolled reinforcement)developed considerable yielding of the flexural reinforcementin the zone below load P1 (Fig. 8). For both specimens, arather vertical shear crack developed in this region. At thatstage, the applied load dropped 20%. From then on, thedeformation of the specimens increased under constant loadsuntil the crack widths (at a level of tensile reinforcement)
Fig. 5—Test setup. (Note: dimensions in mm [in.].)
Fig. 6—Measurements: (a) Omega-shaped extensometersand LVDTs; and (b) strain gauge measurements. (Note:dimensions in mm [in.].)
Table 2—Average values of flexural reinforcement properties
Test Specimens SR2 to SR9 Specimens SR10 to SR12
db, mm (in.) 16 (0.63) 16 (0.63)
fy, MPa (ksi) 530 (76.9)* 523 (75.9)
fu, MPa (ksi) 600 (87.0) 621 (90.1)
εu, % 5.52 10.6
fu/fy 1.13 1.19
Type Cold-worked Hot-rolled*Yield strength at 0.2% plastic strain.
520 ACI Structural Journal/September-October 2010
reached up to 30 mm (1.2 in.) and part of the concrete coverbelow the tensile reinforcement split. The tests were then stopped.
5. Specimen SR5 failed in bending with rupture of theflexural reinforcement in tension. The width of the flexuralcrack, measured at the last load step before failure, was 6 mm(0.24 in.) at the level of flexural reinforcement.
A view of the specimens after testing, together with somedetails, are shown in Fig. 8. More information on themeasurements can be found in References 10 and 11.
A summary of the main results is given in Table 3. Theshear force and bending moment at failure, including self-weight (VR and MR, respectively), are given at a cross sectionplaced at d/2 away from the axis of the applied load P1 or ofthe intermediate support R2, depending on the position of thefailure zone. The rotations at failure (ψR, comprising bothelastic and plastic rotations) are estimated by integrating thecontinuous measurements of the strains in the top and
bottom fibers, as indicated in Fig. 9. The length of the beamwhere the rotation is calculated (equal to 1.96d, refer toFig. 9) corresponds approximately for all specimens to thedistance between the applied load and the flexural crackfrom which the critical shear crack (shear crack leading tofailure) developed (Fig. 8). A comparison of the rotationscalculated using this criterion and those obtained from thedeflections of the beam shows good agreement.11 It shouldbe noted that both the rotation at failure and the shearspan (a) depend on the position of the failure zone. ForSpecimens SR3 to SR6, SR8 to SR10, and SR12, they areobtained according to Fig. 9(a), whereas Fig. 9(b) applies toSpecimens SR2, SR7, and SR11.
Kinematics of critical shear crackTaking advantage of the measurements performed on the
triangular mesh (Fig. 6(b)), the normal (Δu) and tangential
Fig. 7—Load-midspan deflection curves for all specimens and ratios P2/P1 during tests.
521ACI Structural Journal/September-October 2010
(Δv) relative displacements between the lips of the criticalcrack can be calculated.10,11 For instance, Fig. 10 plots theresults for Specimen SR4. The trend in the relativedisplacements suggests that the center of the rotation of thecrack is located near the tip of the crack, moving toward theload introduction plate as the crack develops. This result isconsistent with the measurements detailed in Reference 12.
It can be seen in Fig. 10 that although only normal relativedisplacements initially develop along the critical shear crack,tangential displacements also develop thereafter. A noticeableincrease both in the normal and tangential displacements occursafter yielding (Fig. 10(b)). This result is consistent for the otherspecimens failing after yielding of the flexural reinforcement.11
ROTATION CAPACITY AND SHEAR STRENGTH OF PLASTIC HINGES BASED ON CSCT
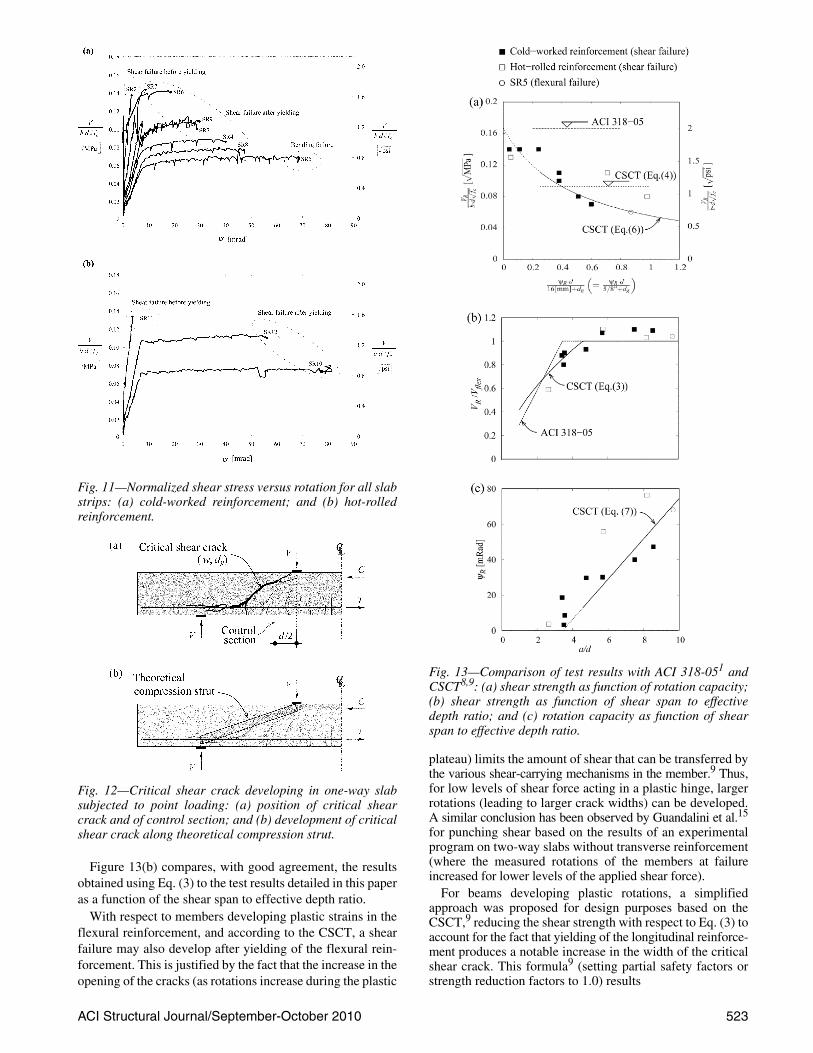
The normalized shear stress is plotted versus the rotationin the failure region for all of the specimens in Fig. 11. It canbe noted that the rotation at failure ψR is larger for specimenswith hot-rolled reinforcement than those with cold-workedreinforcement for the same level of shear stress. Also, it canbe noted in Fig. 11 that the rotation at failure decreases withincreasing shear forces. This result is consistent for the twotypes of reinforcing steel and all failure modes.
Such behavior can be explained with the help of the CSCT(interpretations based on a mechanical approach can also befound in Vaz Rodrigues10). The CSCT can be applied to bothone- and two-way slabs8,9,13 and proposes that the shearstrength, traditionally correlated to the square root of the
Fig. 8—Failure type and crack pattern for all slab strips (ordered by increasing shearstrengths for each reinforcement type). (Note: 1 MPa = 145 psi.)
522 ACI Structural Journal/September-October 2010
compressive strength of concrete,4,14 depends on the roughnessand on the width of a critical shear crack (shear crack leadingto failure). According to the CSCT, the critical shear crackdevelops partly along the inclined theoretical compressionstrut carrying shear (refer to Fig. 12) and limits the strengthof the member with respect to the flexural capacity (as thestrength of the inclined compression strut is reduced due tothe presence of the crack).
The hypothesis of the dependence of the shear strength onthe width (w) and roughness (characterized by the maximumaggregate size, dg) of the critical shear crack can be written as9
(1)
where b is the width of a slab strip, d is the effective depth,and fc is the compressive strength of concrete measured in acylinder. For beams failing in shear without development ofplastic strains in the flexural reinforcement, the crack width(w) can be estimated as9
(2)
VR
b d fc⋅ ⋅---------------------- f w dg,( )=
w ε d⋅∝
where ε is a reference strain in the beam (a longitudinal straincalculated at a control section8 [refer to Fig. 12]). Aformulation of the failure criterion (Eq. (1)) accounting forthis hypothesis (Eq. (2)) can be found in9
(3)
VR
b d fc⋅------------------ 1
6--- 2
1 120 ε d⋅16 dg+-----------------+
------------------------------------⋅= SI units (MPa, mm) or
VR
b d fc⋅------------------ 2 2
1 120 ε d⋅58---″
dg+----------------+
-----------------------------------⋅= U.S. customary units (psi, in.)
Table 3—Tested slab strips: main results at failure and calculated values
Note: VR, MR is shear force and bending moment at section at d/2 away from axis of applied load; δ1R is midspan (below load P1) deflection at failure; ψR is rotation in failure region, integrated along length of 1.96·d; a is equivalent shear span (= MR/VR + d/2); Location is failure location (R2 is near intermediate support, P1 is near applied load at midspan); and NA is not available.
Fig. 9—Definition of shear span a and measured rotation ψaccording to location of shear failure: (a) critical shear crackat midspan; and (b) critical shear crack at intermediate support.
Fig. 10—Measurements of relative displacement betweenlips of critical shear crack for Specimen SR4: (a) evolutionalong critical shear crack; and (b) normal (Δu) and tangential(Δv) relative displacements.
ACI Structural Journal/September-October 2010 523
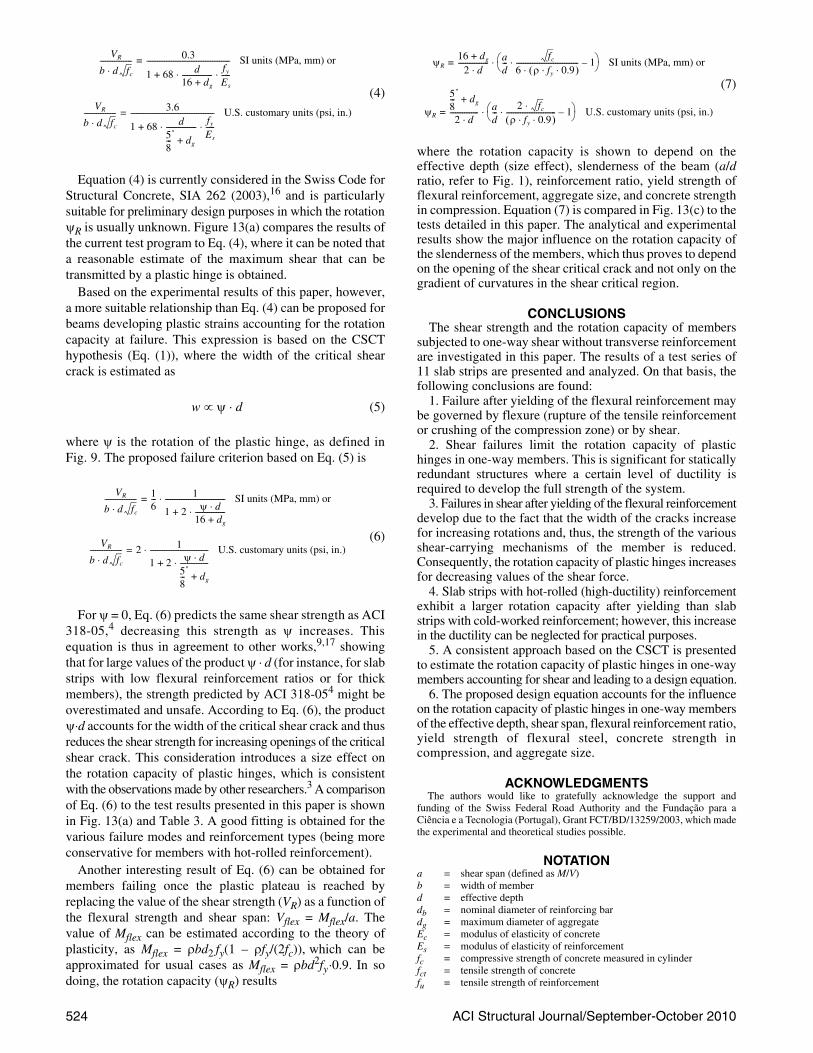
Figure 13(b) compares, with good agreement, the resultsobtained using Eq. (3) to the test results detailed in this paperas a function of the shear span to effective depth ratio.
With respect to members developing plastic strains in theflexural reinforcement, and according to the CSCT, a shearfailure may also develop after yielding of the flexural rein-forcement. This is justified by the fact that the increase in theopening of the cracks (as rotations increase during the plastic
plateau) limits the amount of shear that can be transferred bythe various shear-carrying mechanisms in the member.9 Thus,for low levels of shear force acting in a plastic hinge, largerrotations (leading to larger crack widths) can be developed.A similar conclusion has been observed by Guandalini et al.15
for punching shear based on the results of an experimentalprogram on two-way slabs without transverse reinforcement(where the measured rotations of the members at failureincreased for lower levels of the applied shear force).
For beams developing plastic rotations, a simplifiedapproach was proposed for design purposes based on theCSCT,9 reducing the shear strength with respect to Eq. (3) toaccount for the fact that yielding of the longitudinal reinforce-ment produces a notable increase in the width of the criticalshear crack. This formula9 (setting partial safety factors orstrength reduction factors to 1.0) results
Fig. 11—Normalized shear stress versus rotation for all slabstrips: (a) cold-worked reinforcement; and (b) hot-rolledreinforcement.
Fig. 12—Critical shear crack developing in one-way slabsubjected to point loading: (a) position of critical shearcrack and of control section; and (b) development of criticalshear crack along theoretical compression strut.
Fig. 13—Comparison of test results with ACI 318-051 andCSCT8,9: (a) shear strength as function of rotation capacity;(b) shear strength as function of shear span to effectivedepth ratio; and (c) rotation capacity as function of shearspan to effective depth ratio.
524 ACI Structural Journal/September-October 2010
(4)
Equation (4) is currently considered in the Swiss Code forStructural Concrete, SIA 262 (2003),16 and is particularlysuitable for preliminary design purposes in which the rotationψR is usually unknown. Figure 13(a) compares the results ofthe current test program to Eq. (4), where it can be noted thata reasonable estimate of the maximum shear that can betransmitted by a plastic hinge is obtained.
Based on the experimental results of this paper, however,a more suitable relationship than Eq. (4) can be proposed forbeams developing plastic strains accounting for the rotationcapacity at failure. This expression is based on the CSCThypothesis (Eq. (1)), where the width of the critical shearcrack is estimated as
(5)
where ψ is the rotation of the plastic hinge, as defined inFig. 9. The proposed failure criterion based on Eq. (5) is
(6)
For ψ = 0, Eq. (6) predicts the same shear strength as ACI318-05,4 decreasing this strength as ψ increases. Thisequation is thus in agreement to other works,9,17 showingthat for large values of the product ψ ⋅ d (for instance, for slabstrips with low flexural reinforcement ratios or for thickmembers), the strength predicted by ACI 318-054 might beoverestimated and unsafe. According to Eq. (6), the productψ⋅d accounts for the width of the critical shear crack and thusreduces the shear strength for increasing openings of the criticalshear crack. This consideration introduces a size effect onthe rotation capacity of plastic hinges, which is consistentwith the observations made by other researchers.3 A comparisonof Eq. (6) to the test results presented in this paper is shownin Fig. 13(a) and Table 3. A good fitting is obtained for thevarious failure modes and reinforcement types (being moreconservative for members with hot-rolled reinforcement).
Another interesting result of Eq. (6) can be obtained formembers failing once the plastic plateau is reached byreplacing the value of the shear strength (VR) as a function ofthe flexural strength and shear span: Vflex = Mflex/a. Thevalue of Mflex can be estimated according to the theory ofplasticity, as Mflex = ρbd2 fy(1 – ρfy/(2fc)), which can beapproximated for usual cases as Mflex = ρbd2fy⋅0.9. In sodoing, the rotation capacity (ψR) results
(7)
where the rotation capacity is shown to depend on theeffective depth (size effect), slenderness of the beam (a/dratio, refer to Fig. 1), reinforcement ratio, yield strength offlexural reinforcement, aggregate size, and concrete strengthin compression. Equation (7) is compared in Fig. 13(c) to thetests detailed in this paper. The analytical and experimentalresults show the major influence on the rotation capacity ofthe slenderness of the members, which thus proves to dependon the opening of the shear critical crack and not only on thegradient of curvatures in the shear critical region.
CONCLUSIONSThe shear strength and the rotation capacity of members
subjected to one-way shear without transverse reinforcementare investigated in this paper. The results of a test series of11 slab strips are presented and analyzed. On that basis, thefollowing conclusions are found:
1. Failure after yielding of the flexural reinforcement maybe governed by flexure (rupture of the tensile reinforcementor crushing of the compression zone) or by shear.
2. Shear failures limit the rotation capacity of plastichinges in one-way members. This is significant for staticallyredundant structures where a certain level of ductility isrequired to develop the full strength of the system.
3. Failures in shear after yielding of the flexural reinforcementdevelop due to the fact that the width of the cracks increasefor increasing rotations and, thus, the strength of the variousshear-carrying mechanisms of the member is reduced.Consequently, the rotation capacity of plastic hinges increasesfor decreasing values of the shear force.
4. Slab strips with hot-rolled (high-ductility) reinforcementexhibit a larger rotation capacity after yielding than slabstrips with cold-worked reinforcement; however, this increasein the ductility can be neglected for practical purposes.
5. A consistent approach based on the CSCT is presentedto estimate the rotation capacity of plastic hinges in one-waymembers accounting for shear and leading to a design equation.
6. The proposed design equation accounts for the influenceon the rotation capacity of plastic hinges in one-way membersof the effective depth, shear span, flexural reinforcement ratio,yield strength of flexural steel, concrete strength incompression, and aggregate size.
ACKNOWLEDGMENTSThe authors would like to gratefully acknowledge the support and
funding of the Swiss Federal Road Authority and the Fundação para aCiência e a Tecnologia (Portugal), Grant FCT/BD/13259/2003, which madethe experimental and theoretical studies possible.
NOTATIONa = shear span (defined as M/V)b = width of memberd = effective depthdb = nominal diameter of reinforcing bardg = maximum diameter of aggregateEc = modulus of elasticity of concreteEs = modulus of elasticity of reinforcementfc = compressive strength of concrete measured in cylinderfct = tensile strength of concretefu = tensile strength of reinforcement
VR
b d fc⋅------------------ 0.3
1 68 d16 dg+-----------------
fy
Es
-----⋅ ⋅+-----------------------------------------------= SI units (MPa, mm) or
VR
b d fc⋅------------------ 3.6
1 68 d58---″
dg+
-----------------fy
Es
-----⋅ ⋅+-----------------------------------------------= U.S. customary units (psi, in.)
w ψ d⋅∝
VR
b d fc⋅------------------ 1
6--- 1
1 2 ψ d⋅16 dg+-----------------⋅+
----------------------------------⋅= SI units (MPa, mm) or
VR
b d fc⋅------------------ 2 1
1 2+ ψ d⋅58---″
dg+----------------⋅
---------------------------------⋅= U.S. customary units (psi, in.)
---------------------------- 1–⋅⎝ ⎠⎛ ⎞⋅= U.S. customary units (psi, in.)
525ACI Structural Journal/September-October 2010
fy = yield strength of reinforcementM = bending momentMflex = bending strengthMR = bending moment at failurePi = applied load (i = 1; 2)PiR = applied load (i = 1; 2) at failureRi = reactions (i = 1; 2)u = perpendicular relative displacement between lips of crack V = shear forceVflex = flexural failure loadVR = shear strengthv = parallel relative displacement between lips of crackδ1 = vertical displacement below load P1ε = reference strainεu = reinforcement strain at maximum loadρ = longitudinal reinforcement ratioσ = reinforcement stressψ = rotation of slab stripψR = rotation of slab strip at failure
REFERENCES1. Alvarez, M.; Köppel, S.; and Marti, P., “Rotation Capacity of
Reinforced Concrete Slabs,” ACI Structural Journal, V. 97, No. 2, Mar.-Apr. 2000, pp. 235-242.
2. Bigaj, A. J., “Structural Dependence of Rotation Capacity of PlasticHinges in RC Beams and Slabs,” thesis, Delft University of Technology,the Netherlands, 1999, 229 pp.
3. CEB, “Ductility of Reinforced Concrete Structures—Synthesis Reportand Individual Contributions,” Bulletin 242, Comité Euro-international duBéton, Lausanne, Switzerland, 1998, 332 pp.
4. ACI Committee 318, “Building Code Requirements for StructuralConcrete (ACI 318-05) and Commentary (318R-05),” American ConcreteInstitute, Farmington Hills, MI, 2005, 430 pp.
5. Eurocode 2, “Design of Concrete Structures,” Part 1-1, General Rulesand Rules for Buildings, prEN 1992-1-1, 2004, 222 pp.
6. Lee, J.-Y., and Kim, U.-Y., “Effect of Longitudinal Tensile ReinforcementRatio and Shear Span-Depth Ratio on Minimum Shear Reinforcement inBeams,” ACI Structural Journal, V. 105, No. 2, Mar.-Apr. 2008, pp. 134-144.
7. Kani, M. W.; Huggins, M. W.; and Wittkopp, R. R., “Kani on Shear inReinforced Concrete,” Department of Civil Engineering, University ofToronto, Toronto, ON, Canada, 1979, 97 pp.
8. Muttoni, A., “Shear and Punching Strength of Slabs without ShearReinforcement,” (“Schubfestigkeit und Durchstanzen von Platten ohneQuerkarftbewehrung”), Beton-und Stahlbetonbau, V. 98, No. 2, 2003,pp. 74-84. (in German)
9. Muttoni, A., and Fernández Ruiz, M., “Shear Strength of Memberswithout Transverse Reinforcement as a Function of the Critical ShearCrack Width,” ACI Structural Journal, V. 105, No. 2, Mar.-Apr. 2008,pp. 163-172.
10. Vaz Rodrigues, R., “Shear Strength of Reinforced Concrete BridgeDeck Slabs,” PhD thesis, Nr. 3739, École Polytechnique Fédérale de Lausanne,Lausanne, Switzerland, 2007, 289 pp.
11. Vaz Rodrigues, R., and Muttoni, A., “Shear Strength without Stirrupsafter Yielding of RC Slab Strips—Test Report,” (Influence des déformationsplastiques de l'armature de flexion sur la résistance à l'effort tranchant despoutres sans étriers. Rapport d'essai), École Polytechnique Fédérale deLausanne, Lausanne, Switzerland, 2007, 77 pp. (in French)
12. Muttoni, A., and Thürlimann, B., “Shear Tests on Beams and Slabswithout Shear Reinforcement” (“Schubversuche an Balken und Flachdeckenohne Schubbewerung”), Institut für Baustatik und Konstruktion, ETHZürich, 1986, 12 pp. http://is-beton.epfl.ch/Publications/198x/Muttoni86.pdf
13. Muttoni, A., “Punching Shear Strength of Reinforced Concrete Slabswithout Transverse Reinforcement,” ACI Structural Journal, V. 105, No. 4,July-Aug. 2008, pp. 440-450.
14. Moody, K. G.; Viest, M.; Elstner, R. C.; and Hognestad, E., “ShearStrength of Reinforced Concrete Beams—Part 1: Tests of Simple Beams,”ACI JOURNAL, Proceedings V. 51, No. 4, Apr. 1954, pp. 317-332.
15. Guandalini, S.; Burdet, O. L.; Muttoni, A., “Punching Tests of Slabswith Low Reinforcement Ratios,” ACI Structural Journal, V. 106, No. 1,Jan.-Feb. 2009, pp. 87-95.
16. SIA, Code 262 for Concrete Structures, Swiss Society of Engineersand Architects, Zürich, Switzerland, 2003, 94 pp.
17. Collins, M. P., and Kuchma, D., “How Safe Are Our Large, LightlyReinforced Concrete Beams, Slabs, and Footings?” ACI StructuralJournal, V. 96, No. 4, July-Aug. 1999, pp. 482-490.