RR288 Rascarch Rtport 288 INFLUENCE OF SOIL ON DETECTION OF BURIED EXPLOSIVES AND TUNNELS BY TRACE GAS ANALYSIS R.F. Murrmonn.Y. Nokano, TJ. Simpson,D.C. Ugqttt and D.M. AncUrson Juntl971 Roproducod by NATIONAL TECHNICAL INFORMATION SERVICE Spnnqtiold, Va i7151 D D C Ml« « W EÜU CORPS OF ENGINEERS. U.S. ARMY COLD REGIONS RESEARCH AND ENGINEERING LABORATORY HANOVER, NEW HAMPSHIRE APPROVED FOR PUBLIC RELEASE! DISTRIBUTION UNLIMITED. 43
Transcript
RR288
Rascarch Rtport 288
INFLUENCE OF SOIL ON DETECTION OF BURIED EXPLOSIVES AND TUNNELS
BY TRACE GAS ANALYSIS
R.F. Murrmonn.Y. Nokano, TJ. Simpson,D.C. Ugqttt and D.M. AncUrson
Juntl971
Roproducod by
NATIONAL TECHNICAL INFORMATION SERVICE
Spnnqtiold, Va i7151
D D C
Ml« « W EÜU
CORPS OF ENGINEERS. U.S. ARMY
COLD REGIONS RESEARCH AND ENGINEERING LABORATORY HANOVER, NEW HAMPSHIRE
APPROVED FOR PUBLIC RELEASE! DISTRIBUTION UNLIMITED.
43
Unclassified 37 Sfcuntv flitsvifir.fion
DOCUMENT CONTROL DATA R&D li . In* ■ ill- nti'ifi at lllle. Imtli of ahtffm f «m/ injeuing mnnvlmlifn niu*l br trtrrrd *hrri Hie overtill rrfmrl It tlmtlWmdj
\ig. RC F'OR T SECURITV C L A SSI f I C A T IOK
Unclassified U.S. Army Cold Regions Research and Engineering Laboratory
Hanover, New Hampshire 03755 26 CHOUP
INFLUENCE OF SOIL ON DETECTION OF BURIED EXPLOSIVES AND TUNNELS BY TRACE GAS ANALYSIS
•i iu TMOR($l (^"ifil <i»m», middlm Inllltl, Imtlnam»)
R.P. Murrmann; Y. Nakano; T.J. Simpson; D.C. Lcggett and D.M. Anderson
« REPORT DATE
June 1971 7«. TOTAL NO OF PACES
42 7b. NO Of REFS
25 M CONTRACT ON GRANT NO
b. PROJEC T NO.
M. ORIGINATOR'! REPORT NUMBCRIII
Research Report 288
DA Project 1J662708A462 t*. OTHER REPORT noitl (Any olhtr numfrt thmfmybtflffl thl» npofl)
10 DISTRIBUTION tTATCMCNT
Approved for public release; distribution unlimited.
II (UPPLEMENTARV NOTES 12. SPONSORING MILI TARV ACTIVITY
U.G. Army Mobility Equipment Reiieurch and Deveio])ment Center
Ft. Belvoir, Va. IS. ABSTRACT
Detection of mines, explosives, and tunnels may be accomplished by sensing associated volatile effluvia. This investigation was undertaken to provide a basis for predicting the diffusion of volatile compounds from underground sources into the atmosphere. Diffusion of a volatile compound was studied for a range of soil conditions utilizing soils from the mine detection sites in Puerto Rico, A new mathematical analysis based on the Monte Carlo method was developed for predicting vapor diffusion through soil into the atmosphere. It was determined that diffusion in soil can be reliably predicted if soil porosity, moisture content, and affinity for the compound are known. Appear- ance in the atmosphere is also dependent on accumulation of the compound in air at the soil/atmosphere interface. Diffusion of volatile compounds through soil into the atmosphere is not likely to be an important factor in tunnel detection due to depth of overburden. However, adsorption of compounds at tunnel walls is likely to significantly reduce the amount of vapor appearing in the atmosphere through entrances and vents. Detection in the atmosphere of TNT vapor from mines and explosives buried in moist, porous soil should be possible under ideal sample collection conditions.
14. Key Words: Adsorption Diffusion Effluvia
Explosives Gas detectors Land mine detection
Mines (ordnance) Tunnels Soil Vapor Trace gas
^M f9tm 4 4 ^<3 atrkACisoo ro«w I«TS • J AN M, «MICM It Unclassified ■«curity tlaasincaUon
INFLUENCE OF SOIL ON DETECTION OF BURIED EXPLOSIVES AND TUNNELS
BY TRACE GAS ANALYSIS
R.P. Murrmann.Y. Nakano.
T.J. Simpson.D.C. Leggett and D.M. Anderson
Junel971
DA PROJECT 1J662708A462
CORPS OF ENGINEERS. U.S. ARMY
COLD REGIONS RESEARCH AND ENGINEERING LABORATORY MANÖVER, NEW HAMPSHIRE
APPROVtD FOR PUBLIC RELEASE; DISTRIBUTION UNLIMITED.
CONTENTS
in
\>W. Preface List of symbols Introduction Adsorption of volatile chemicals by soil
Introduction Experimental procedure Results and discussion
Diffusion of volatile chemicals in soil Introduction Experimental procedure Calculations Results and discussion
Prediction of vapor diffusion in soil Introduction Construction of model Compu'-vtions Result« and discussion
A statistical method for analysis of diffusion through soil Introduction Theory Application
Literature cited Abstract
it
v
S II) Hi i;i i:{ li) 'M 29 29 30 $2 35 37
ILLUSTRATIONS
Figure 1. 2. 3.
4. 5,
6,
7.
8.
9. 10. 11.
Adsorption of acetone by soil from Laguna Joyuda, Puerto Rico 3 Partition of acetone in water 5 Comparison of adsorption of acetone by field-moist, air-dry, and oven-dry
soil from Laguna Joyuda, Puerto Rico .r) Diffusion-cell 8 Plot of Cj/Cy vs distance from source for diffusion of acetone in Laguna
Joyuda soil 11 Schematic diagram of model for predicting vapor diffusion from the surface
of a buried mine or a tunnel 13 Relative concentration in soil vapor with respect to concentration at source
as a function of distance from the source at various times 23 Relative concentration in soil vapor with respect to steady state concentra-
tion as a function of distance from source at various tin es 23 Concentration gradient at soil/atmosphere interface as a function of time . 21 Model of soil profile indicating position of line source of acetone 33 Distribution of acetone after 2 days 35
PREFACE
Has report was prepared by Dr. R.P. Mumuann (Research Chemist), Dr. Y. Nakano (Research Chemical Engineer), CPT T.J. Simpson (Soil Scientist), Mr. D.C. Le^ett (Analytical Chemist) and Dr. D.M. Anderson (Chief, Earth Sciences Branch). The authors are memh«rs of the Research Division, U.S. Army Cold Regions Research and Engineering Laboratory (USA CRREL).
Sections of the report have been reviewed by Dr. A.W. Wairick and Dr. D.D. Evans, University of Arizona; Dr. J. Lamperti, Dartmouth College; and Mr. D. Nevel. USA CRREL.
This work was supported by the U.S. Army Mobility Equipment Research and Develop- meni Center (USAMERDC). Ft. Belvoir, Vu.. under DA Project lJ(3ü2708A462t üarrier/ CdHnlerbarricr Kvseurcb.
The contents of tins report are not to be used for advertising, publication, or pro- motional purposes. Citation of trade names does not constitute an official endorsement or approval of the use of such commercial products.
Manuscripl received 6' Jam/ary 1971.
IV
CONTENTS (Cont'd)
TABLES
Table I, Description of soils collected from detection sites in Puerto Rico for
investigation of acetone diffusion II. Conriparison of experimental and theoretical values for diffusion of acetone
in moist Laguna Joyuda soil III. Diffusion coefficient of acetone in water-saturated soils IV. Values of C^x1, t + ) and Cr(xf, f4) predicted for extreme (low) values of <.
S*, litidK V. Values of C| (xf. t*) and Cr(x*. I') predicted for extreme (high) values of..
<5*, and/C VI, Relative effluent concentration at the soil/atmosphere interlace as predicted
for mine and tunnel installations VII. Effluent concentration and flux at the soil/atmosphere interface, and mini-
mum sampling time as predicted for mine and tunnel installations VIII. Concentration of acetone in atmosphere above soil containing acetone
emplaced at various depths at Laguna Joyuda IX. Relative amounts of possible decomposition products of acetone emplaced
at various depths in soil at Laguna Joyuda
Pag«'
V4
21
2H
28
29
29
r
LIST OF SYMBOLS
A Vapor siunple collection area, cinJ
C Concentration of compound in soil, g in soil per cm1 soil
C j Concentration of compound in soil, g in soil air per cm1 soil
C„ Concentration of compound in boundary layer air, g om"s
D* Reference diffusion coefficient, cm1 sec'1
D,. Diffusion coefficient in soil water, cm1 sec'1
Ds Diffusion coefficient in soil without adsorption, cm2 sec"1
Dl Diffusion coefficient in soil with adsorption, cm1 sec'1
D2 Diffusion coefficient in air, cmJ sec'1
F Flux, g cm"2 sec'1
k Adsorption coefficient of compound, g adsorbed per cm5 soil/g in soil air per cms soil
K Adsorption coefficient of compound, g per cm' soil air/g adsorbed per cm' nonvapor phase
L Distance from source to soil/atmosphere interface, cm
S Concentration of adsorbed compound, g per cm5 soil
I Time, sec
X Distance, cm
Z Vapor sample collection time, sec
fi Thickness of boundary layer air, cm
( Volume function of soil air
(o - Minimum detectable amount of compound, g.
INFLUENCE OF SOIL ON DETECTION OF BURIED EXPLOSIVES AND TUNNELS BY TRACE GAS ANALYSIS
by
R.P. Murrmann; Y. Nakano; T.J. Simpson; D.C. Leggett and D.M. Anderson
INTRODUCTION
Detection of volatile effluvia has been proposed41 as the basis of a method for locating personnel. The same principle can be applied to detecting underground discontinuities such as explosives or mines.1 The applicability of this approach to tunnel detection has been demonstrated."' Although the chemicals or combinations of chemicals upon which to base such detection schemes are still undetermined, vapors originating from explosives or explosive containers could provide the key to detection of mines.
Volatile chemicals unique to a tunnel may originate as a result of perturbation of biological activity near tunnel walls; chemical effluvia associated with human activities may appear in the atmosphere over occupied tunnels. In any case, volatile compounds originating from underground sources can migrate into the atmosphere by diffusion upward through the soil profile. In tunnels they may also move through entrances and vents. However, the presence of soil between source and detection device complicates detection. This is because chemicals originating underground interact with the soil constituents, thus delaying their appearance in the atmosphere and decreasing the amounts available for detection at the surface. Also, the relative amounts of chemical com- ponents which appear in the atmosphere may differ from those at the undergiound source.
This report is concerned with predicting the extent to which the presence of soil will interfere with detection of buried explosives and tunnels by trace gas analysis. The effect of soil texture, porosity, and moisture content on vapor diffusion in soils collected from the mine/tunnel detection research sites in Puerto Rico" " is evaluated in the laboratory. The extent of interaction of vapor with mineral surfaces in soil collected from the Laguna Joyuda tunnel site is determined. A mathematical model to describe diffusion of volatile chemicals through earth media is formulated which employs assumptions believed to be reasonable for application of the model to the problem of detection. Another theoretical approach based upon the Monte Carlo method is developed for analysis of diffusion under different environmental conditions. Calculations are made of the time/concentra- tion relationships for diffusion of vapor through soil at the Laguna Joyuda site. Parameters are ider-ified which are most important in influencing diffusion of a volatile component through soil into the atmosphere so that favorable environmental conditions for detection by trace gas analysis can be anticipated. Detection in the atmosphere of a volatile chemical placed in the soil at the Laguna Joyuda site is accomplished.
♦References 3, 4, 5, 7. 12, 13, 14, 19, 25.
DETECTION OF BURIED EXPLOSIVES AND TUNNELS
ADSORPTION OF VOLATILE CHEMICALS BY SOIL
Introduction
The movement of volatile chemicals from subsurface sources through soil into the atmosphere is influenced by the interaction of a given chemical with soil minerals and water. In order to assess the degree of interaction of volatile chemicals with soil, a simple method for determining adsorption isotherms lias been developed. The adsorption of acetone, a volatile human effluvium, was deter- mined on soil collected from the Laguna Joyuda detection site in Puerto Rico. The data obtained were later used in other experimental and theoretical studies on predicting the effect of soil on detection by trace gas analysis.
Experimental procedure
Soil for tliis experiment was collected from the Laguna Joyuda site in Puerto Rico. A description of the site and the chemical properties of the soil has been published elsewhere." " Some of the soil properties are given in Table I. Samples of the soil were prepared with field- moisture, air-dry and oven-dry water contents corresponding to about 0.2, 0.02 and less than 0.001 gram of water per gram of dry soil, respectively. About 8 g of soil at field moisture was weighed into each of six 500-ml Erlenmeyer Uasks fitted with rubber stoppers containing short pieces of glass tubing flared at one end to accomim date a silicone rubber septum. The actual volumes of the flasks ranged from MS cm' to 555 cms. Acetone vapor, obtained from a similarly fitted flask containing liquid acetone in equilibrium with acetone vapor at 250C, was introduced through the septum into each flask by means of a gas syringe.
Table I. Description of soils collected from detection sites in Puerto Rico for investigation of acetone diffusion." "
Measured volumes of acetone vapor ranging from 100 to 1600 /J were injected into the sample flasks. A reference bottle was prepared by injecting 1000 /J of acetone vapor into a flask containing no soil. An equilibration period of 24 hours at 250C was allowed to pass before the vapor over each sample was analyzed for acetone by gas chromatography. Preliminary work showed that 95% of the acetone eventually adsorbed by the soil was taken up during the first 2.5 hours.
Following injection into the Chromatograph of 100 fA of vapor from each of the flasks, including the reference flask, the area under the acetone peak was determined using a disk integrator. The amount of acetone present in each sample was determined by referring the integrated areas for each sample to a curve prepared from acetone in water standards. This resulted in values for the quantity of acetone vapor in equilibrium with the soil samples. The amount of acetone adsorbed by the soil
DETECTION OF BURIED EXPLOSIVES AND TUNNELS 3
was then calculated as the difference between the total amount of acetone added to each flask and that remaining in the vapor phase. The same procedure was followed using samples at air-dry and oven-dry moisture contents except that smaller quantities of oven-dry soil (0.5 g) were used per sample because of greatly enhanced acetone adsorption upon removal of the soil water. The operating conditions for the Chromatographie analysis were as follows;
Instrument: Perkin-Elmer Model 900
Column: 6 ft * ', in. OD, SS, 5% polyethylene glycol (1300-1600) on 40-60 mesh chromosorb T
Carrier gas: N„ 10 cm5 min"'
Temperature: 60oC
Detector: Flame ionization
The retention time of acetone in the Chromatographie column under these conditions was about 3 minutes. Although several peaks in addition to that due to acetone in soil air were observed in the chromatogram at high sensitivity none of these peaks interfered with the acetone determination.
Results and discussion
Adsorption isotherms for acetone adsorption at 250C by the field-moist, air-dry and oven-dry soil samples are shown in Figure 1, in which the weight of acetone adsorbed per unit weight of dry soil is plotted against the weight of acetone per unit volume in the vapor phase at equilibrium. In Figure 2, data are shown which were obtained using a set of samples composed of 2 g of water but no soil. Sectors of the experimental isotherms obtained for the four types of samples are drawn in Figure 3 for comparison purposes.
5xlO"
gacetone/qdrysoj|
—r r r Field Moisture
(22 8% Wafer)
6x10
tone/^( g acetone/t air
Figure 1. Adsorption of acetone by soil from Laguna Joyuda, Puerto Rico.
DETECTION OF BURIED EXPLOSIVES AND TUNNELS
IOIIO
(joc»tone/qdrySoi|
2 -
T I
Air-dried
' ' I I
(l6%Wotef)
j
■
/ \
• / \
- / • \
- / \
• / / • A
1 i 1 1 1 i
g acttont/f oir
12 «10'
I6>I0
12 -
g acetone/q dry S0l|
8
4 -
g acetone// oir
C.
Figure 1 (Cont'd). Adsorption of acetone by soil from Laguna Joyuda, Puerto Rico.
DETECTION OF BURIED EXPLOSIVES ASD TUNNELS
8«I0
q acetone/0 ?q „aIe
g acetone/'' aif
Figure 2. Partition ot acetone in water.
5«ia'
, ocetone/g dry 50i|
i r
Oven-dried (00%H20)
T r
Air-dried /(I6%H?0)
20q H^O Equivalent to
?n nt soil moisture
Field Moisture (228% HpO)
J i
0 4 8 12« 10
g acetone/' oir
Figure 3. Comparison ot adsorption ot acetone by field-moist, air-dry, and oven-dry soil trom Laguna Joyuda, Puerto Rico.
6 DETECTION OF BURIED EXPLOSIVES AND TUNNELS
As shown in Figure 3, ttie isotherms obtained for the adsorption of acetone by the soil at field moistur« mid tor the partition of acetone in water, plotted on a comparable basis, virtually coincide, showing that sorption of acetone by the soil at this moisture content can be accounted for by the partition of acetone in soil water rattier than by adsorption on mineral surfaces in the soil. Re- moval of water from the soil by oven-drying enhanced the adsorption of acetone enormously in com- parison with tlit" other samples. As illustrated by the results obtained with air-dry samples, the presence of trace amounts of water in the soil significantly reduced the amount of acetone adsorbed even though considerably more acetone was adsorbed by the air-dry than by the field-moist samples. The effect of moisture content on acetone adsorption seems more apparent when the values of the slope taken from the linear portion of the isotherms at low acetone contents (Fig. 1) are compared. The numerical values are about 0.11, (3.5 and 56 for the field-moist, air-dry and oven-dry conditions, respectively. Thus it can be seen that oven-drying of the field-moist soil increased acetone adsorption by a factor of more than 500.
These results are in general agreement with those of Parfitt and Mortland" who also found that acetone is less strongly adsorbed by clay minerals in the presence of adsorbed water. Using infrared spectroscopic techniques, these investigators obtained evidence which suggests that in the absence of water, acetone is coordinated directly to the exchangeable cations associated with the clay mineral surfaces, but that in the presence of adsorbed water, acetone is weakly bound by Imdging through water molecules coordinated to the cations. The results of the present experiment indicate that at higher moisture content, the exchangeable cations in soils are completely shielded from acetone by water molecules and that the interaction can be accounted for by simple partition of the acetone between vapor and liquid.
in order to judge the effect that adsorption of volatile chemicals by soil might have on attempts to locate a tunnel at Laguna Joyuda by trace gas detection, consider the following examples. First, adsorption by soil at the tunnel walls will decrease the vapor concentration of compound in the tunnel air and, consequently, the amount of compound which initially appears in the atmosphere tlirough ports and vents. Suppose that acetone vapor in a tunnel 1 meter in diameter is in equilib- rium with adsorbed acetone in a layer of soil 1 cm thick at the tunnel wall. It is assumed that diffusion of acetone through air to the tunnel wall is fast in comparison with both the diffusion of acetone up through the soil profile and mass movement of acetone through ports and vents. Even though the total amount of acetone is unknown, the distribution of acetone between the soil and air phases can be estimated. The result of this calculation, assuming that the soil at the tunnel wall is at the field-moisture content, is that only 12% of the acetone initially present would remain in the tunnel air. At the air-dry moisture content only 0.2% of the acetone produced in the tunnel would remain in the air. Thus, the amount of acetone appearing in the atmosphere could depend greatly on soil parameters such as moisture content which influence adsorption of acetone by soil.
Another consideration is the effect of adsorption on the appearance of volatile chemicals in the atmosphere by diffusion up through the soil profile. A detailed analysis of the extent to which adsorption will influence the rate of diffusion through soil appears later in this report. However, an estimate of effect of adsorption on diffusion can be made using available data. An approximate relationship between the diffusion coefficient and the adsorption coefficient is given by (see eq 71-75)
Ü.6Ü.D,, Di —/T" -\ (1)
DETECTION OF BURIED EXPLOSIVES AND TUNNELS 7
where Dj is the diffusion coefficient in cm'' sec*' of the compound in soil with adsorption, D„ is the diffusion coefficient in cm2 sec'1 of the compound in air, < is the volume fraction of air in tlit; soil, and K is the adsorption coefficient expressed as
K compound/cm3 soil air
K compound adsorbed/Ccm3 soil t soil water)
Expressed in these units, the numerical values of the adsorption coefficient of acetone for the field-moist, air-dry and oven-dry samples are about 5.4 x 10"s, 5,5 ■ 10'', and ti • 10"', respec- tively. Since K is less than 10'J eq 1 can be approximated by
Thus, interaction of acetone with the dry soil could decrease the diffusion coefficient from that in air by a factor higher than 6 > 10*. The effect of air-drying the field-moist soil is to decrease the diffusion coefficient of acetone in soil by about 10J. However, the moisture content also influences the value of (. Although the value of Dj tends to increase with increasing moisture content due to less adsorption, the rate of increase in Dj decreases with moisture content since the value of e is decreasing as water enters the soil pores. In any event, it seems clear that partition of compounds in soil water or adsorption by soil can significantly reduce the rate of move- ment upward through the soil profile.
DIFFUSION OF VOLATILE CHEMICALS IN SOIL
Introduction
The diffusion coefficient of a volatile chemical in soil depends upon soil wafer content, void porosity and the degree of interaction between the compound and mineral constituents. The experi- ments described in this section were conducted to evaluate the relative importance of the above factors in determining the magnitude of the diffusion coefficient. Acetone was selected for use in the study because it is a volatile, moderately polar compound which is of practical importance for personnel detection. In addition, experimental data are available on adsorption of acetone by soil at different moisture contents. Soils from the detection sites in Puerto Rico were utilized to provide background information applicable for future work in the field. The soils selected represented a range in soil texture and mineralogy. Moist and water-saturated samples were studied since these two situations represent practical extremes for the effect of water content on trace gas diffusion.
Experimental procedure
A few of the pertinent properties of the six soils used in this study are summarized in Table 1. The primary consideration in the selection of the soils was texture which ranged (torn sand to clay. More detailed descriptions are available of both the profile characteristics11 and chemical properties" of the soils.
Diffusion of acetone through the soils was investigated using the type of diffusion cell illustra- ted in Figure 4. The diffusion system consisted of a half-cell containing an acetone source, separated by a perforated plate from another half-cell filled with soil. Each half-cell was constructed of Tygon tubing with an inner diameter of 5 cm and a height of 10 cm. An air-tight seal was formed when the two half-cells were coupled together.
DETECTION OF BURIED EXPLOSIVES AND TUNNELS
( ) <: >
/
/ -i
r
lr
■ Septum
Per forated Plote
*< Septum
( i
(' < C < O f '
Figure 4. Diltusion-cell.
To determine the diffusion of acetone vapor in moist soil, soil was packed in a cell to a density of about 1.0 g cm''. The moisture content of the soil was 15% of the dry weight. The acetone source consisted of a solution of 2% by volume acetone in water. The perforated plate supporting the soil was separated from the acetone solution by about 3 cm so that the solution did not come in contact with the soil. The source solution was constantly stirred to make certain that there was no concentration gradient between the soil and the source solution. Acetone in the soil atmosphere was determined by gas Chromatographie analysis (described earlier) of vapor samples withdrawn from the cell through the septums depicted in Figure 4. Samples were taken as a function of both time and distance from source.
In experiments where the diffusion of acetone through water-saturated soil was investigated, the cells were packed with soil at a density of about 1.8 g cm*'. The soil in the cell was water-saturated by upward percolation of water. The water content of these samples ranged from 15 to 23 g of water per 100 g of soil depending upon the texture and bulk density. The same acetone source as described above was utilized. Diffusion was allowed to proceed into the samples for about 24 hours. The soil was then microtomed into segments 3 to 5 mm thick and stored in vials. Water was added to each vial to increase the volume of the soil water/acetone solution for sampling so that the actual amount of acetone in the soil water could be determined. A 24-hour equilibration period was allowed after addition of water prior to analysis of the soil solution for acetone using gas chromatography.
One additional experiment on diffusion of acetone in water-saturated soil was performed using another method which differed from the one just described in that a 1-cm segment of soil was sandwiched between the usual acetone vapor source and a layer of water in the diffusion cell. The water on top of the soil acted as a trap for acetone diffusing up through the water-saturated soil. The amount of acetone appearing in the water trap was monitored after a steady-state condition was reached. The water was changed frequently to prevent back-diffusion of acetone.
Calculations
Migration of volatile chemicals in soil can be considered a combined process of diffusion in both the gas and liquid (water) phases during which a relationship exists between the concentration of the chemical in the gas phase and liquid phases, and the amount of chemical adsorbed on soil surfaces. As was demonstrated by the experimental work on acetone adsorption, when the soil particles are covered by a film of water the effect of adsorption is negligible. This is the situation prevailing in the present work. We shall classify our experimental results into two categories according to the mechanism of migration, namely, 1) moist soil and 2) water-saturated soil.
DETECTION OF BURIED EXPLOSIVES AND TUNNELS 9
Dittusion in moist soi7. In this case, since the diffusivity of acetone in air is of a much greater magnitude than that in water, the rate of migration is dominated by diffusion in (he gus phase. In general, the relationship between the partition of acetone in the gas and in the liquid phases is in dynamic equilibrium. However, diffusion is thought to be much slower than partition of acetone in thin films of water. Therefore, we shall assume that a local static equilibrium condition holds throughout the moist soil.
The equation describing diffusion is written as'
dC\ d2C. _L Dl
l- (3)
where
Cj concentration of compound (g in the soil gas phase per cm1 soil)
X distance in cm
t - time in sec.
The initial and boundary conditions are:
(4)
(5)
(6)
The solution of eq 1 with the conditions eq 4-6 is given as
C
cl = 0 at t = 0
cl -co X 0 t > 0
ci 0 X ~ t > 0
_i=l- erf | ^--- |. (7) o . - . „ f.
Diffusion in water-saturated soil. The migration of volatile chemicals is governed in this case by diffusion in soil water. Since the soil pores are water-saturated, the influence of partition be- tween soil vapor and water phases can be neglected. The diffusion equation is then written as
* D.fl (8,
where
* a dX*
C concentration of acetone (g cm'1 soil)
D,. diffusion coefficient (cm1 sec'1) in soil water. a
The solution of eq 8 is the same as that of eq 3. Since the soil contains no compound at the be ginning, the initial and boundary conditions are written as
C 0 at t 0 (9)
10 DETECTION OF BURIED EXPLOSIVES AND TUNNELS
C C;(1 X 0 10 (10)
CO X ^ tO. (U)
Rquation 10 implies thai at the source of the compound the concentration is held constant. Equation 11 holds it the experiments are conducted so ttiat diffusion to physical boundaries is not significant. The solution of equation 8 with the above initial and boundary conditions is given as
C
C„ \ 2 \ D f / erf —_- \ (12)
wlieie the error function is defined as
x .2
erf(,Y) —- [ e"u du. (13) % 0
For both the water-saturated soil and moist soil conditions described above, the diffusion coefficient can be determined by comparing experimental results with those theoretically predicted. Namely, after obtaining an experimental concentration profile Cex,, (X, t) the theoretical profile C"[ti(.V. (, D) which best fits the experimental profile is determined by changing the value of D. Although it is possible to express quantitatively the degree of agreement between two profiles by introducing the distance between two functions as in the mathematical analysis of a functional space, the determination of diffusion coefficients in this work was made by visual comparison of the experimental and theoretical concentration profiles.
In the experiment on diffusion of acetone in water-saturated soil in which acetone was monitored in water above the soil column after attaining a steady-state condition, the diffusion coelucient from the experimental data was calculated using Fick's law:
F 0., £ ,14,
where the flux F is grams of acetone diffusing per unit of area per second.
Results and discussion
A comparison of the experimental plot of Cj C0 versus distance from the source after diffusion of acetone in moist soil from Laguna Joyuda for 5 hours, with curves obtained utilizing different values for Dj in eq T, is shown in Figure 5a. The closest agreement was obtained using a value of D j equal to 2,5 • 10"'. Virtually the same value of D, was also observed for experimental time periods of 2M, 1.7 and 1.1 hours. The experimental and calculated values for CJ/CQ versus distance for those results not shown in Figure 5a are found in Table 11. These experimental values for vapoi diffusion compare very favorably to the one estimated (1.65 x 10"* cm2 sec"1) using eq 1 which indi- cates the validity of tins relationship in estimating diffusion coefficients.
The comparison of experimental values of C/C0 versus distance (Fig. 5b) using water-saturated soil from Laguna Joyuda with values calculated using eq 12 showed a best fit using a value of Da
of about 1 ■ 10''. Similar values of D,. were observed for diffusion of acetone in the other water- u
saturated soils (Table ill). This similarity in values of the diffusion coefficients obtained using clay soils as compared with those obtained using soils much lightP! in texture and lower in surface
DETECTION OF BURIED EXPLOSIVES AND TUNNELS 11
0.8 -
_C, 0.6
Co
0.4
0.2 -
IV^ ' 1 ' 1 1
r^v At =5 hrs
[ \\\Nv r X^XNT^^ J
\ \\^ ̂ ^lO'5
\- \^V XSxIO4 4
IxlO"4 >v
1 1 1 1
S^SxIO4
^^ Loguno ^^•^^Joyudo
1 1 3 4 Distance, cm
a. Moist soil.
0.8
0.6 -
0.4 -
0.2 -
At »24 hrs
b. Water-saturated soil.
Figure 5. Plot of CJ/CQ VS distance from source tor diffusion of acetone in Laguna Joyuda soil.
U DETECTION OF BURIED EXPLOSIVES AND TUNNELS
Table II. Comparison of eipeclmental and theoretical values for diffusion of acetone In moist Lacuna Joyuda soil.
Table m. Diffusion coefficient of acetone in water-saturated soils.
Site Texture Da cm2 sec*1
Rio Quayanes Sandy loam 2 x 10*'
Sabana Hoyos Silt loam 1 x W5
Laguna Joyuda Silt loam 1 x 10'5
Lajas Clay 0.9 x ID'5
Tore Negro Silt loam 1.5 x 10''
Moca Clay 0.45 x 10'5
area supports the view that adsorption on mineral surfaces is not a factor in influencing diffusion in moist or wet soils. Differences in diffusion coefficient are probably due to variations in moisture content and in internal geometry of the samples, the clay soils having the lowest diffusion coefficient and the light-textured soils the highest value.
Although not shown, values of the diffusion coefficient in water-saturated Moca and Lajas soils calculated using eq 14 were lower than thoso reported in Table III by only a factor of 2. The agreement between the two methods lends added assurance to the validity of the values obtained.
The results of this study indicate that vapor diffusion in soils is not significantly influenced by variation in soil texture. The interaction of a volatile compound with moist soil is primarily partition in soil water rather than adsorption at soil surfaces. The most important factors governing vapor diffusion in soil are soil water content and void porosity. For acetone the diffusion coeffi- cient decreased 10- to 20-fold upon water-saturating moist soil. This indicates that appearance of detectable vapors in the atmosphere above water-saturated soil will be considerably slower than in the case of moist soil.
DETECTION OF BURIED EXPLOSIVES AND TUNNELS 13
PREDICTION OF VAPOR DIFFUSION IN SOIL
Introduction
The experimental work described in the previous sections has been restricted to laboratory investigation. However, using these results it is now possible to predict the influence of soil on trace gas diffusion in the field. This is accomplished by first constructing a model for calculating the appearance of vapors in the atmosphere based upon one-dimensional diffusion from a subsur- face, constant source. The feasibility of detecting buried explosives and tunnels is discussed based upon this analysis. The results of these predictions are supported by experimental work on diffusion of acetone in the field at the Laguna Joyuda site in Puerto Rico.
Construction of model
To simplify the mathematical analysis for predicting the influence of coil on detection it is necessary to introduce assumptions which are physically acceptable. The process of primary concern is the migration of volatile chemicals from buried explosives or a tunnel source vertically upwards to the soil/atmosphere interface. The surface of the source can be approximated as a plane surface and the process treated as one-dimensional diffusion. In addition, it is assumed that the soil is homogeneous with respect to those properties which affect the diffusion of volatile chemicals. The next concern is the physical condition of the atmosphere close to the earth's sur- face where it is assumed that a boundary layer exists in which only molecular diffusion occurs. The concentration of compound in the atmosphere at the upper surface of the boundary layer is taken to be negligible relative to that at the soil/atmosphere interface. A schematic drawing depicting the situation described above is shown in Figure 6. The X-coordinate is taken to be positive perpen- dicular to the earth's surface in the direction of diffusion.
ATMOSPHERE (Mimnqand Convecf'on)
ATMOSPHERIC BOUNDARY i AVER
(Diffusion Onl»!
HOMOGENEOUS EARTH MEDIA
SOURCE (Mine or Tunnell
Figure 6. Schematic diagram of model (or predicting vapor diffusion from the surface
of a buried mine or a tunnel.
The variables not previously defined which are involved in the analysis are defined as follows:
C2 = concentration of compound in boundary layer air (g cm*1)
S = concentration of adsorbed compound, g cm"* soil
D8 = diffusion coefficient of compound in soil in absence of adsorption effects (cm1 sec"1)
S = thickness of boundary layer at earth's surface (cm)
L = distance between upper surface of the source and the soil/atmosphere interface (cm).
If local equilibrium can be assumed to exist be- tween the gas phase and immobile (liquid and solid)
phases, the equation of diffusion of a volatile chemical through the earth media and the boundary layer can be written,* respectively.
dC.
~dt = 0,
d*cx
Hx* L < X < 0 (15)
14 DETECTION OF BURIED EXPLOSIVES AND TUNNELS
D 0 v * v 5. (16) ßt ,1X2
In eq 15, the value of the diffusion coefficient Dj is given by
D' m (17)
where
k -^ . (18) Li
The constant k is the adsorption coefficient of the volatile chemical by the earth material which can be calculated from the linear portion of an experimental adsorption isotherm at low concentra- tion levels.
Now, if the volatile chemical compound under consideration is not initially present In the soil, then the initial condition may be stated as
Cj C;, 0 t -_ 0. (19)
If a volatile compound is then introduced into the soil from the surface of a mine or tunnel and its concentration at the source surface kept constant at C0 by some mechanism for t > 0, the boundary
(20)
(21)
(22)
X = 0. (23)
In this treatment, use of dimensionless variables is worthwhile in order to reduce the number of variables and, also, to demonstrate the Interdependence of sets of variables. The latter point is particularly helpful in this case since relative values can be calculated even though experimental values of many of the variables are not yet available.
With introduction of the following dimensionless variables,
x* - (24)
f>* ~ (25)
conditions are
Cl co X - L
C, 0 X = 8
c, ^c. X = 0
dC.
D**x D2 dX
;
c c
/)' D
r D't
L^7
DETECTION OF BURIED EXPLOSIVES AND TUNNELS I',
U'd)
(,'7
HCj ir>, 16 and 19-23 bt'i;ome
dC>, (f-C!, ..1 D!, -.--
(2K)
0 , x* v />* CW)
C; 0. C^ 0 lor lf • 0 Cil)
C| 1 at xf - 1 t* ^ 0 CW)
C^ 0 at x' (Sf f' : 0 CW)
C{ «C^ at x' 0 '* , 0 (:J«)
(>c; f)ci O; —_ D* - at x' Ü t1 ^ 0. {;i,r))
(IK* " ih>
In eq 27 and 28, any arbitrary v.aliie can be selected lor D*, a reference dilTiision coefficunil. In this treatment, however, D* cancels in all final equations so assignment of a value is not re- quired.
Applying the Laplace transform to eq 29-35, one obtains
PC. = Dt —1 (36) Jx,a
PC, D* -- _ (37) ^ . L.I
Jx^
Ki DETECTION OF BURIED EXPLOSIVES AND TUNNELS
C, \ at x' 1 (38)
C, Ü at x' <V (39)
C, .C, atx' Ü (40)
-1 D;, -__ dx dx'
O; - ' D!, —1 at x' 0 (41)
whor»'
C, j e '"' C; dt1 (/ 1,2). (42) o
The solutions for the above system of equations arc pven" as
rosh y, x+siiih q,, ß* - a sinh q. x4 cosh (/., ß' C. __J ! L 1__ (43)
l P((:osh qj sinh (jo (V * r; sinh flj cosh fl;, 5')
WIHTC
r1 sinh </„(«* - x4) C2 — (44)
P((:osh q, sinh q^ 54 < <; sinh qj cosh q2 5*)
.' | /"D4/D; (45)
q, /P/O; (46)
q8 s/P/Dl. . (47)
Since C, and Cj, are single-valued functions of the complex number P with simple poles, C j and Co can be obtained from eq 43 and 44 by use of the inversion theorem. The result is that
For application of the model to the problem of detection, it is only necessary to use eq 48 to calculate concentration profiles in the soil, the concentration in the air at the soil/atmosphere interface, and the flux of chemical at the soil/atmosphere interface. In order to calculate the transient concentration profile at any time, the two infinite series in eq 48 must he evaluated. Equation 48 can be rewritten as
C\(x\t+) - C\{x\~) 1 An - I BB (53) n 1 n-1
where
C; (x+. «) = (54) if>* \/ÜD0 4 1
2 sin2 S* \j'5ßn sin ßn (1 ^ x+) exp(-/^D; t4) Än _—" 'L ^Ll_ (55)
The order of magnitude for An and fln has to be estimated in order to decide the number of terms wludi must be computed. From eq 55 and 56 it can be shown that
the number of terms to l)e computed for a niven accuracy can be estimated from
An . i exp I (n^ U/DttM (00)
i4l n l
and
Bn . - - exp I (na l)m\~D\t'\. (61) Bj n l
In eq 60 and 61 the rate of convergence increases as tf increases. The roots of eq 52 (ßn) can be computed as follows when Sf ^D is small. Since
1 x ** (-l)""^2''B2n cot x ------ x*" l (68)
x 3 45 (2n)
where ön is the Bernoulli number, it follows that
cot 6' vD ^n ; (S* vD ^n)~l if ßf vVßn < I (63)
and that
cot ^n = -_i (64)
Thus, from eq 52
Hn —^— • (65) <&' D K 1
If 8¥ \li is not small enough, the Newton-Raphson's method can be used to obtain the roots.
From eq 48 it is seen that the steady-slate concentration profile at infinite time, C J (xh, «), is given by eq 54. Thus, the maximum obtainable concentration at the soil/atmosphere interface at x * 0 can be calculated from
DETECTION OF BURIED EXPLOSIVES AND TUNNELS 19
(8+ \/DD0 C+(0, «)= (66)
«rvPDo + 1
The relative concentration Cr indicating the degree of approach to the steady-state condition at t ^ «j is given by the ratio of eq 48 to eq 54.
c;(x+. t^ c.{x\t+) Cr(x4. t+) = -1 = . (67)
c;(x+.») c^x4.-)
The flux of chemical at the soil/atmosphere interface is given by
idC, H\dX I
(68)
where F is the flux in g cm*' sec'1. Using the dimensionless parameters previously defined, one obtains
8 L WI (69)
The concentration gradient (dC j/dx*) can be evaluated using eq 48.
Compntations
Using the model developed in the previous section, it is now possible to predict the rate of movement of trace gases originating from mines and tunnels and moving up through soils. As an example, the movement of acetone through soil will be examined by incorporating into the model results of investigations of the diffusion of acetone through soil from the detection site at Laguna Joyuda, Puerto Rico. Inasmuch as acetone is given off by people, the results obtained should be directly applicable to detection of occupied tunnels. Although acetone is probably not associated with mines, TNT vapors are expected to interact less than acetone with moist soils, as will be explained later. Thus, acetone diffusion from a source located near the soil surface may be slower than the diffusion of TNT vapors. In any event, these calculations should provide a reasonable indication of whether mines and tunnels can be located by detection of trace gases which have diffused through soil.
First, the range of variables appearing in eq 48 should be established. The value of (in a moist soil is likely to be in the range
0.1 < ' < 0.5 (70)
with the exact value depending on soil texture and water content. The relationship between the diffusion coefficient Dj and the adsorption coefficient k is given in eq 17. The relationship between the value of k and that of K, the adsorption coefficient previously discussed (eq 1), is
k - (1 - f) . (71)
20 DETECTION OF BURIED EXPLOSIVES AND TUNNELS
Now, le' us assume that the minimum value of K expected is that which corresponds to maximum adsorption of acetone by air-dry Laguna Joyuda soil. If the maximum value for K indicates no adsorption, then
5.5 . KT5 _ K ^ ~. (72)
The value of Da for acetone in eq 17 can be estimated using the relationship3
Ds 0.66*0;, (73)
where as a general rule"
D2 -- 0.1 cm2 sec"1. (74)
Combining eq 17, 71 and 73,
0.66 D..f
Equation 75 is the same as eq 1 which was shown through the experimental work described earlier to be valid for calculating the diffusion coefficient of vapor in soil. Thus, considering conditions 70 and 72:
5.1 x 10⁻⁸ < Dj ^ 0.033. (76)
The range in 5+ is difficult to estimate since the thickness of the boundary layer 8 is unknown, but if the depth of a source ranges ttom 10 to 100 cm and the thickness of the boundary layer is 1 cm, then
10"2 < S+ < 0.1. (77)
Examination of eq 48 shows that Cj is a function of xf and D\t+ at constant values ot f,k or K, and 5f. Values of C\ (x+, t+) have been calculated for the extremes im, K and S+ indicated above in conditions 70, 72 and 77 and are tabulated in Tables IV and V. In addition, the correspond- ing values of Cr(xf, t+) as defined in eq 67 are shown. The concentration gradient in eq 69 for the transient condition at the soil/atmosphere interface, C(0, t+), and the relative concentration gradient indicating the degree of approach to the steady-state condition, Gr, are also given in Tables IV and V as, respectively.
&) G(0, t+) = (— (78)
Gr - £<2iil . (79) ' 0(0,«)
DETECTION OF BURIED EXPLOSIVES AND TUNNELS 21
Table IV. Values of C\(x+, (+) and ",(*+, (f) predicted for extreme (low) value» of t. S*, and K.
Upon comparing the calculated values in Tables IV and V, it is clear that <,K ami 8* in the range of interest have little effect on the values of C j and C for Jt+ < -0.1. This is because for a given value of D^t+t x+ becomes the predominant variable. For example, for (<, K, 5+) < (0.5, «, 0.1), in eq 54 the term (8+ y/D DQ < 1.65 x 10~2. Therefore, eq 53 can be approximated by
Ct = *I - * ^ - 2L Ba. (80) n=l n=l
As the value of x+ approaches zero, the effect of the other variables on C J begins to predominate. However, the values of Cr(x+, t+) and G(0, t+) are insensitive to variation int.K, and S* even at x+ = 0. Inasmuch as the values in Tables IV and V are applicable over the entire range of the variables of interest, they have been summarized in Figures 7-9 in which Cj(x4, f+) and Cr(x+. t+)
DETECTION OF BURIED EXPLOSIVES AND TUNNELS
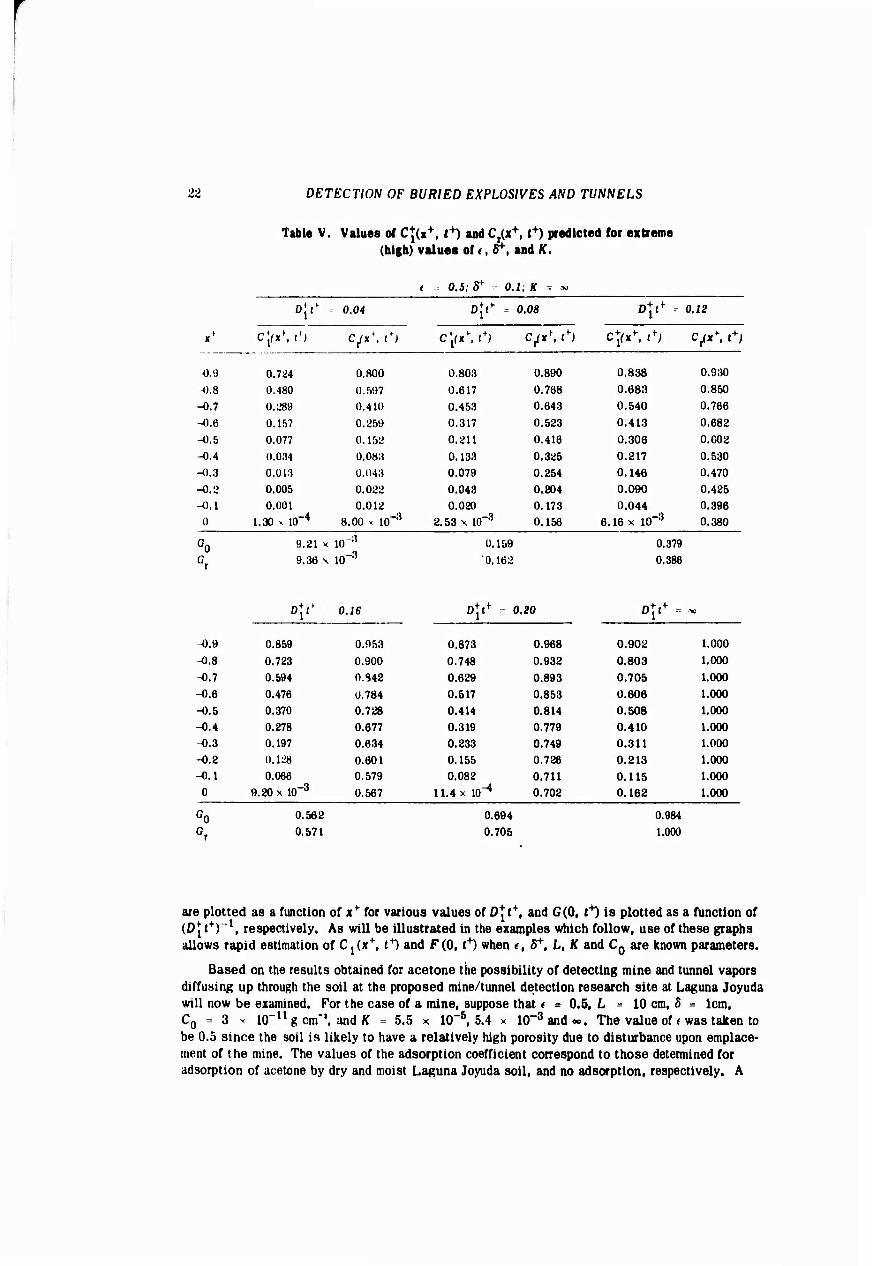
Table V. Values of C\(M*, t*) and Ct(x+, t+) predicted tor extreme
are plotted as a function of xf for various values of Dj t+, and 0(0, t4) is plotted as a function of (D\t+) x, respectively. As will be illustrated in the examples which follow, use of these graphs allows rapid estimation of C1(xf, t*) and F(0, (*) when r, £*, L, K and C0 are known parameters.
Based on the results obtained for acetone the possibility of detecting mine and tunnel vapors diffusing up through the soil at the proposed mine/tunnel detection research site at Laguna Joyuda will now be examined. For the case of a mine, suppose that t = 0.5, L = 10 cm, S = 1cm, C0 = 3 * 10~11 g cm'1, and ff = 5.5 x 10"5, 5.4 x 10~3 and «. The value of * was taken to be 0.5 since the soil is likely to have a relatively high porosity due to disturbance upon emplace- ment of the mine. The values of the adsorption coefficient correspond to those determined for adsorption of acetone by dry and moist Laguna Joyuda soil, and no adsorption, respectively. A
DETECTION OF BURIED EXPLOSIVES AND TUNNELS Ü3
u
0 8-
0 6-
0 4-
0 2
Figure 7, Relative concentration in soil vapor with respect to concentration at source as a function ol distance from the source at various times.
1 r -i 1 "- D' r» io?
00
Figure 8. Relative concentrMion in soil vapor with respect to steady state concentration as a /unction of distance from source at various
times.
24 DETECTION OF BURIED EXPLOSIVES AND TUNNELS
D^IO2
8
LFio.n / dc;\ O 66<C0Aax' /o.f
08
06
S 04 o
02 - 0 l<e<0 5
10"' S 8'« 0 I 5 5«I0 ' SK S®
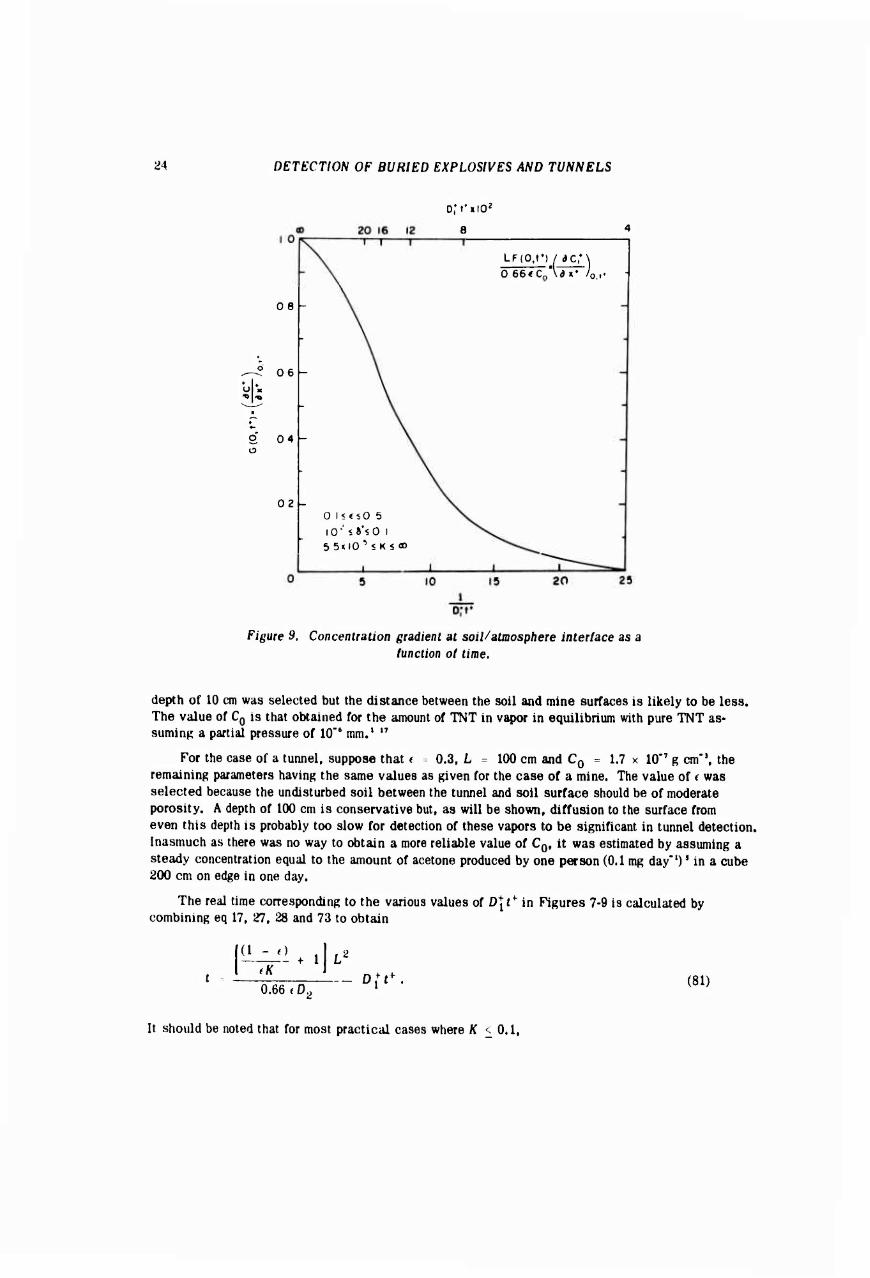
Figure 9, Concentration gradient at soiJ/atmosp/iere interface as a function of time.
depth of 10 cm was selected but the distance between the soil and mine surfaces is likely to be less. The value of C0 is that obtained for the amount of TNT in vapor in equilibrium with pure TNT as- suming a partial pressure of 10*6 mm.' "
For the case of a tunnel, suppose that < = 0.3, L = 100 cm and C0 = 1.7 x 10'' g cm'J, the remaining parameters having the same values as given for the case of a mine. The value of c was selected because the undisturbed soil between the tunnel and soil surface should be of moderate porosity. A depth of 100 cm is conservative but, as will be shown, diffusion to the surface from even this depth is probably too slow for detection of these vapors to be significant in tunnel detection. Inasmuch as there was no way to obtain a more reliable value of C0, it was estimated by assuming a steady concentration equal to the amount of acetone produced by one person (0.1 mg day'1)' in a cube 200 cm on edge in one day.
The real time corresponding to the various values of D\t¥ in Figures 7-9 is calculated by combining eq 17, 27, 28 and 73 to obtain
(1 - O <K
1 L'
0.66 t D0 — Of^ (81)
It should be noted that for most practical cases where K <. OA,
DETECTION OF BURIED EXPLOSIVES AND TUNNELS 25
t ~ i1 ~ <)L D*^ (82) 0.66f2D2K
but that if K 2 10,
I2
t ~ . (83) 0.66 <D2
The value of CjCx*. t+) for any depth greater than x^ -0.1 can be obtained directly usin^ Figure 7 since
Cj^. t+) = C0Ct(x+.t+). (84)
The value of Cr(x+t t+) for x+ < 0 can be taken directly from Figure 8. The following procedure
can be used to calculate the concentration of compound at the soil/atmosphere interface, C j (0, (). By combining eq 26 and 67 one obtains
C^O. t+) = C0C+ (0, ») Cr(0, t+). (85)
Ct(0, t+) is shown in Figure 8 and C| (0, «.) can be calculated using
Ct (0, «) = —^— (86) Z + 1
where
0.66 5+f2
F^T (87)
Equation 86 is obtained by combining eq 17, 50, 66, 71 and 73. For most practical cases where K < 0.1,
CU0,~).0M5*</tK% . (88) (1 - ^
UK > 10, then
Ci(0. «) - 0.66 5+«2. (89)
The flux of compound at the soil/atmosphere interface, F(0, rf), is given by
0.66 f Dp Cn F(0, tf) = ~1 G(0, tf) (90)
26 DETECTION OF BURIED EXPLOSIVES AND TUNNELS
which is obtained from eq 69 and 78. The value of the concentration gradient, C(0, tf), is taken directly from Figure 9.
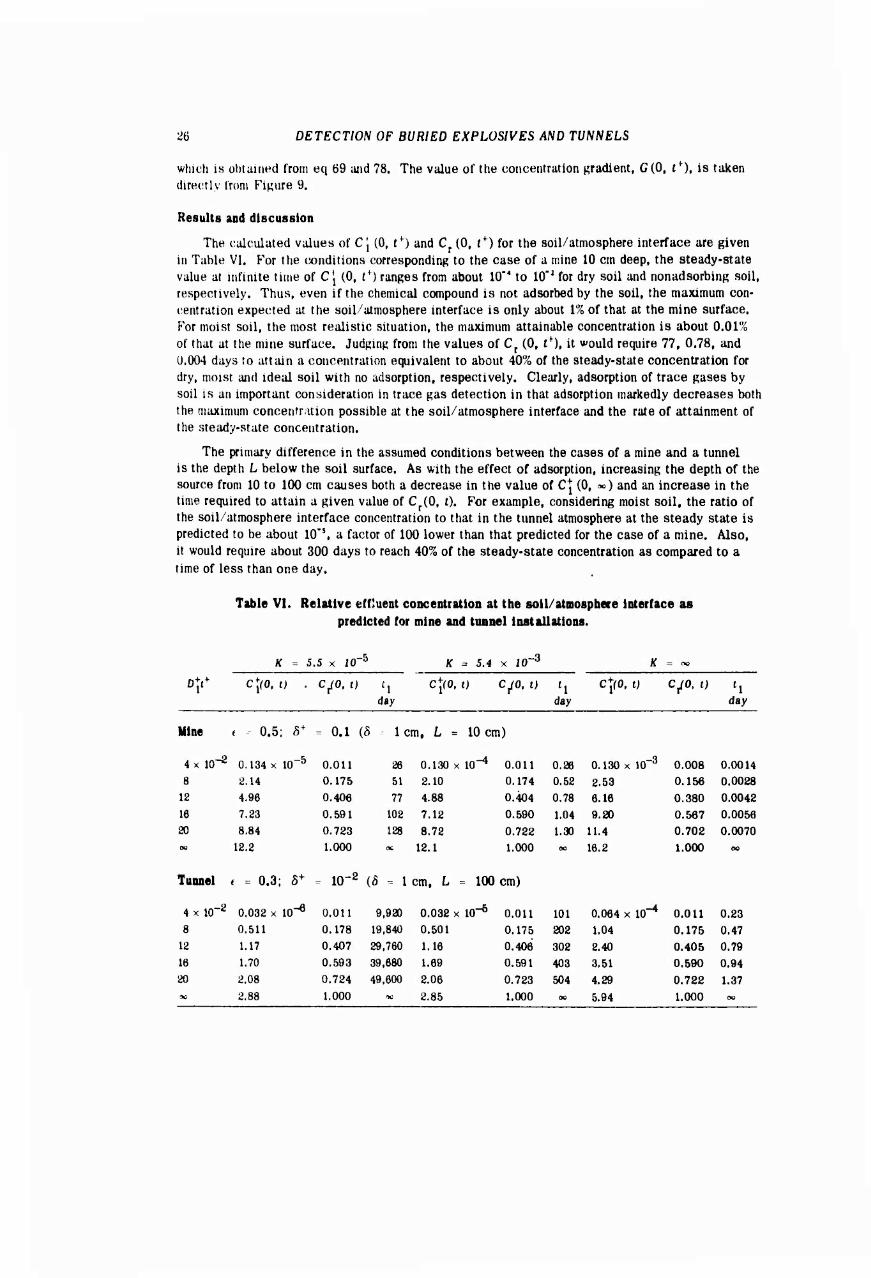
Results and discussion
The calculated values of Cj {0, tf) and Cr (0, f+) for the soil/atmosphere interface are given in Table VI. For the conditions corresponding to the case of a mine 10 cm deep, the steady-state value at infinite time of Cj (0, tf) ranges from about 10'4 to 10"J for dry soil and nonadsorbing soil, respectively. Thus, even if the chemical compound is not adsorbed by the soil, the maximum con- centration expected at the soil/atmosphere interface is only about 1% of that at the mine surface. For moist soil, the most realistic situation, the maximum attainable concentration is about 0.01% of that at the mine surface. Judginf? from the values of Cr (0, tf), it would require 77, 0.78, and U.004 days to attain a concentration equivalent to about 40% of the steady-state concentration for dry, moist and ideal soil with no adsorption, respectively. Clearly, adsorption of trace gases by soil is an important consideration in trace gas detection in that adsorption markedly decreases both the maximum concenfrition possible at the soil/atmosphere interface and the rate of attainment of the steady-state concentration.
The primary difference in the assumed conditions between the cases of a mine and a tunnel is the depth L below the soil surface. As with the effect of adsorption, increasing the depth of the source from 10 to 100 cm causes both a decrease in the value of C| (0, ») and an increase in the time required to attain a given value of Cr(0, t). For example, considering moist soil, the ratio of the soil/atmosphere interface concentration to that in the tunnel atmosphere at the steady state is predicted to be about 10'5, a factor of 100 lower than that predicted for the case of a mine. Also, it would require about 300 days to reach 40% of the steady-state concentration as compared to a time of less than one day.
Table VI. Relative effluent concentration at the soil/atmosphere Interface as predicted for mine and tunnel installations.
It seems worthwhile emphasizing that in comparing the cases of a mine and a tunnel, it has been assumed that the thickness of the boundary layer at the soil/atmosphere interface, Is), is constant. Thus, in changing the depth from 10 to 100 cm, the effect is to decrease the value of «*)' from 0.1 to 10"2. The importance of the atmospheric boundary layer thickness becomes apparent when it is recognized that the same results would be obtained for a mine 10 cm deep and a tunnel 100 cm deep if the corresponding boundary layer thicknesses were 1 cm and 10 cm, respectively. Similarly, the results given in Table VI for the case of a tunnel would be valid for the case of a mine if the mine were 10 cm deep and the boundary layer thickness 0.1 cm.
The dependence of C| (0, «.) on the parameters *, 5* and /f is given for practical cases by eq 87. Although the value of Cj (0, ~) is most sensitive to changes in < followed by S* and K, the range in these parameters given by eq 70, 72 and 77 indicates that in practice, ^ and 6* are the most important parameters in determining the steady-state concentration at the soil/atmosphere interface.
In Table IV, the predicted concentration of volatile chemical in the gas at the soil/atmosphere interface is given. The choice of concentration at the source, CQ, was discussed earlier. The flux of compound at the soil surface has also been computed. Finally, the time required to collect a minimum detectable amount of the compound under ideal conditions has been estimated in the following way. Let
F(0, l+) — (91) AT
where to is the minimum detectable weight of compound in the sample in g, A is the soil area directly above the source from which the collection is made in cm2, and t is the sample collection time in seconds. Thus, it is assumed that the sample is collected directly above the source for a time T with 100% efficiency. The value of CJ, lO"10 g, was selected because in our laboratory it is possible to detect this amount of compound in a total collection volume of 3 liters of gas which corresponds to about 10"" to 10'" g cm'1. A collection area of 100 and 1000 cm2 was selected for the cases of a mine and a tunnel, respectively. The value of f (0, t) is that calculated using eq 89.
If the adsorption behavior of TNT were similar to that of acetone the concentration of TNT in the vapor near the soil surface, as shown in Table VII, would be about 10'", lO*14 and 10'" g cm*' for times of 77, 0.78 and 0.004 days after emplacement of a TNT mine in dry, moist and non- adsorbing soil, respectively. For all three conditions, the flux of TNT vapor from the soil above the mine into the atmosphere would be about 10'" g cm"2 sec"1. The estimated time necessary to collect a minimum detectable sample should be less than one minute. From the work on acetone adsorption it is known that the interaction of acetone with moist soil is due primarily to the partition of acetone in films of water rather than to adsorption on mineral surfaces. Since TNT is less soluble in water than acetone, one would expect that it would interact less than acetone with soil under the same moisture conditions. This means that the possibility of detecting mines in the moist soil by trace gas analysis may be more favorable than is indicated in Table VII. These results support the view that locating mines by detecting explosive vapors which diffuse through soil is possible.
For the case of a tunnel, the concentration of compound at the soil/atmosphere interface of dry, moist and non-adsorbing soils should be about 10'", 10'", and 10'" g cm'' of vapor about 2 x 10⁴, 200 and 0.5 days, respectively, after initial release of a compound within the tunnel. The corresponding flux of compound into the atmosphere would be about 10'" g cm'2 sec'1. A minimum detectable sample might be collected in about 20 seconds. These results show that detection of trace gases which have diffused up through soil is not likely to be of importance in locating tunnels by trace gas analysis. This is because of prohibitive time which must elapse after release of a
DETECTION OF BURIED EXPLOSIVES AND TUNNELS
Table VD. Effluent concentoaUon and (lux at the soil/atmosphere Interface, and minlmiui sanpUng tine as predicted (or mine and tunnel Installaticns.
K = 5.5
Cx(0, l)
X io-5
C day
K = S.4
CJO, t)
x IO"3
t. day
K = «
-2 -1 g cm sec oy CJO.t)
day r.
sec
Mine ( = 0.5 '. ' s+ = 0.1 (S = 1 cm. = 10 cm); C0 = 3.1 x io-llg cm"3
4 x 10" ■2 0.416 x 10 -16 26 0.403 x 10" "15 0.26 0.403 x 10~14 0.0014 0.112 x IO"14 892 8 6.65 51 6.51 0.52 7.85 0.0028 1.77 56
compound within a tunnel before a detectable atmospheric sample can be collected. Thus, the movement of trace gas through entrances and ducts should be of primary concern in tunnel detection. However, consideration should be given to the effect of the interaction of trace gases with soil at the tunnel walls on the concentration of effluent which appears in the atmosphere.
Although no comprehensive experimental investigation of diffusion under field conditions has been undertaken, one preliminary experiment has been completed which supports the results of the laboratory and theoretical work. In performing this experiment 10-ml quantities of liquid acetone were deposited at depths of 1. 2. 4 and 8 feet in the soil near the Laguna Joyuda site. The acetone was then allowed to diffuse for a period of 3 weeks at which time the atmosphere above the soil at each location was sampled, and the acetone concentrations determined by gas chromatography. The results (Table VIII) indicate that the acetone concentration found at the 2- and 4-ft locations was significantly greater than that normally present in the ambient atmosphere. The data suggest that the acetone in the soil at the 1-ft depth had already dissipated whereas that at the 8-ft depth had not yet appeared in the atmosphere. These results support the view that trace gas diffusion through soil is rapid enough to be a consideration in mine detection but too slow to be of importance in tunnel detection by trace gas analysis.
In addition to acetone, the gas Chromatographie analysis indicated the presence of several other compounds present in concentrations greater than normally expected in the absence of implaced acetone. It is possible that these compounds resulted from biodegradation of the acetone deposited in the soil. One of the compounds has been tentatively identified by its gas Chromatographie re- tention time as propane which could be formed by the reduction of the ketone group of acetone. The other two compounds have not been identified but have retention times close to those of acetaldehyde and 2-propanol. both of which are possible reduction products of acetone. Although no quantitative results are available, the relative concentrations determined using Chromatographie peak areas are given in Table IX.
DETECTION OF BURIED EXPLOSIVES AND TUNNELS 29
Table VIII. CooceotratioD of acetone la atmosphere above soil containing acetone emplaced at various depths at Lagana Joyuda.
Oeptti Acetone cone (ft) W1?
1 1.5 2 21 4 7.2 8 0.8
No acetone emplaced 0.8
Hanover, N.H. air 0.7
♦Assumes 100% recovery. Checks of the re- covery efficiency of acetone injected into evacuated sample cylinders indicate that about 70% is recovered by this method.
Table IX. Relative amounts of possible decomposition products of acetone emplaced at various depths In sell at Laguna Joyuda.
No acetone emplaced 1.0 1.0 0.0* 1.0 Hanover, N.H. air 0.9 4.1 1.0 0.0
♦Not measurable in absence of acetone emplacement; Hanover air used as reference sample.
A STATISTICAL METHOD FOR ANALYSIS OF DIFFUSION THROUGH SOIL
Introduction
When the mechanism of transport of volatile chemicals in soils is governed by Pick's law of diffusion, theoretical analysis involves solving a certain differential equation of a parabolic type under properly imposed initial and boundary conditions. Unfortunately, an exact mathematical solution is not always possible for many practical situations. This is because the diffusion coefficient is seldom constant but varies with location, concentration and time due to the structural inhomogeneity of the soil and to variable physical conditions such as temperature and moisture content within the soil. For such a problem of variable coefficient, the finite difference method* has been considered one of the most effective methods of analysis. However, there is another quite different approach, the so-called method of statistical trials or Monte Carlo method. Using the Monte Carlo method, many different types of problems of computational mathematics can be solved by
;iO DETECTIOS OF BURIED EXPLOSIVES AND TUNNELS
deflnitVR each particular problem in terms of a random process.20 Boundary value and initial value problems for linear differential equations are among the most interesting fields of application of the Monte Carlo method. The general mathematical scheme of the Monte Carlo method for solution of differential equations involves construction of random walk processes with finite sets of states. For cases involving diffusion in which the underlying phenomenon is a random process, problems can be solved by direct construction of the corresponding random process rather than by solution of a differential equation as is normally done by the Monte Carlo method.
The connection between the linear parabolic type of partial differential equation and random processes, so-called stochastic diffusion processes, has long been known." The first attempt to apply this relation to the solution of the equations was made by Sragovich.21 In the present work, a method based on stochastic diffusion processes for analysis of diffusion problems is developed. The method is then demonstrated for acetone diffusion using the data obtained on the soil at the Laguna Joyuda detection site.
Theory
Consider the following initial-value problem in three-dimensional space:
3^ 3
^ii> = I y _L_ ib (x. o c (x. 01 - v -L la^x. oc(x, oi 02)
with the initial condition
C(x, 0) = C0(x) (93)
where x denotes a j)oint (x., x2, x3). The problem can be described20 " in terms of a corresponding diffusion process ^t(^lt, f2t, ^3t), with a diffusion matrix B = ||b^|| and a transition vector a (aj, a2, a3). The probabilistic meaning of the solution C(x, t) of eq 92 is the unconditional prob- ability density of the diffusion process ^t at time t. Therefore, the problem reduces to one of finding the probability density of ^t.
The diffusion process ft can be constructed from a Brownian process or a so-called Wiener process, '7t('7lt, *lat. V^' whose mathematical definition is a normal, real process with an independ- ent increment, in which
Zfit - V = Q ■ m
Ei\ - %)2 = It - «I (95)
where E denotes a mathematical expectation. Specifically, the relation between ft and r/t is described in the following manner by Ito:" "
0 )=1 o
where ?jlt, T}2t and T;3t are independent in the set of Wiener processes, the function r^(t, f) forms a matrix R which is connected with B by the relation
R • R ~ B (97)
DETECTION OF BURIED EXPLOSIVES AND TUNNELS 31
or, In more detail,
_3 _ _
V' & r: 1 rie{t' ^ rle ('• £> 1 L '. / L 3 (98) e=l
The system of eq 96 has a solution which is both continuous with a probability of one and unique under the condition that the functions a^ and b^ satisfy a Lipschitz condition. Although the Lipschitz condition requires more than continuity, it does not impose a serious restriction on practical applications. Under this condition eq 92 and 96 are merely two different mathematical descriptions of the same problem. Therefore, we seek the solution of eq 96 instead of eq 92. The solution of eq 96 may be constructed by means of a direct finite difference approximation with respect to time. In order to perform this procedure, we dissect the interval (0, T) by the points
0 = t0 < t1 < t2 < ... < «„_! < tn = T (99)
into parts of length
Mi - li - t^j. (100)
First, we determine an initial value, ^0 (^10, ^20, £j0), for the process from the given mitial condition, eq 93. The initial curve C0(x) is interpreted as the density distribution of £0. Thus, the initial value of £0 is determined by the method of statistical trial according to the density distribution. The diffusion process £t is computed by means of the random variables
A^(m). j = 1, 2, 3; m = 0, 1 n - 1 (101)
which are independent and normal, with parameter (0, \/At ) from the following formula:
m + i m m .-i ' ni (m)
m = 0, 1 n - 1. (102)
With sufficiently fine dissection of the interval (0, T), the sequence £ta(0 < a < n) approximates the continuous process £t within any specified accuracy.
There are several methods of generating the random variable A »7 on a digital computer." In the present work, random numbers were generated by a multiplicative congruential procedure in which the following recurrence relation was used:
Rn+l = aRn0nodni). (103)
From the many possible alternatives of the proper choice of parameters a and m, a suggestion by Moshman" was adapted in which
a = 2{P/2) + 1 + 3 (104)
ro = yP (105)
32 DETECTION OF BURIED EXPLOSIVES AND TUNNELS
for a muchine with radix y having a word length of p digits. The symbol X denotes the largest integer less than X. The random real numbers Sa uniformly distributed between 0 and 1.0 can be generated from Rn as
Sn VRmax (106)
where Rmax denotes the maximum value of Rn. Finally, the random variable A r;(m) is constructed* from Sn by the use of the relation
K K IS,-*
i i 2
.\r,(m) -. ^ /\t^ (107) s,K/\2
in which A f/(m) approaches a true normal distribution asymptotically as K increases.
Application
The use of the statistical method in solving a problem will now be demonstrated by predicting the diffusion of acetone vapor through a soil profile.
As shown by the experimental and theoretical work described earlier, the migration of volatile chemicals in the gas phase of unsaturated soil depends primarily on soil water content, void porosity, and the degree of interaction of the volatile chemical with soil water and minerals. If the interaction processes proceed very rapidly compared with the diffusion process, local equilib- rium can be assumed to exist between the components in the gas phase, and liquid and/or solid phases. In the case where a linear relationship for partition of component between the vapor and immobile phases holds, the migration of volatile chemicals can be described' by eq 92.
In determining the adsorption of acetone by Laguna Joyuda soil, it was found that the following simple relation holds when the concentration of acetone is low;
S kCj (18)
where
C - concentration of acetone per unit volume of the soil gas phase (g cm'1)
S concentration of acetone per unit volume of interfacial water and minerals (g cm'J)
k = adsorption coefficient of acetone by earth media.
If physical variables such as the water content do not change significantly during the time period under consideration, the migration of acetone can be described mathematically in Cartesian coordinates as
dCx 3
where
1 —
Dsix)
dCl (108)
Djlx) _1— . (109)
DETECTION OF BURIED EXPLOSIVES AND TUNNELS 33
The value of Da can be estimated usin^ the
Atmoiphtrt
Figure 10. Model of soil profile indicating position of line source of acetone.
relationship
D 0.66 fD,,.
CombiniiiK eq 109 and 73 one obtains
0.66 D,
(73)
D^x) k{x) . 1
r(x). (119)
The migration of acetone in soil from the Laguna detection site for the situation shown in Figure 10 will now be analyzed. In this case, the soil profile consists of two distinct layers, namely a moist and less compact layer overlying a dry, compact horizon. It ib assumed that an instanta- neous line source of acetone is deposited at a depth of 20 cm from the surface. The computation on the migration of acetone is performed as follows.
For the sake of convenience, the following dimensionless variables are introduced:
x; - — (111)
C+ L2C
// Cdx^
(112)
D+ = D*
(113)
L2 (114)
Since D depends only on the coordinate (Xj) eq 106 reduces to
^1 i ^ ,32 J / dDt(*l)\ -1 = i V A. [2D\(*\)c\] - -L (q -21S . <r 2^f dx+2 dx\ \ dx\ I
(115)
The problem can be described as a corresponding diffusion process ^(-f jj, ^gi) wit'1 a diffusion matrix
B (116)
34 DETECTION OF BURIED EXPLOSIVES AND TUNNELS
and a truivsition vector ä \(dDydx[), 0, 01. From eq98 one obtains a matrix R as
f2D[,Q (117)
Finally, the following formula is obtained for ^lt and f2t:
/dD[\ ^fnul ^U^ \^;)\^ >*D\^iW (118)
Wi ^t^n, + ^^..W C119)
m = 0, 1..,, n - 1.
Since D^(Xj) has discontinuity at the interface of the two soil layers, it is obvious that the Lipschitz condition is not satisfied. However, it is possible to approximate the function D^(x+) as close as one wishes by another function D, (x+> which satisfies all requirements without distorting the physical picture. Generally, a sufficient condition for a function f(x+) to satisfy the Lipschitz condition is that /(x+) has bounded first derivatives. In this case, it is easy to see that if Dj (x+) has bounded second derivatives, eq 118 and 119 have a unique solution. A discontinuity at x i 0 was connected smoothly by a polynomial of the third order as follows:
D + D + y z
D^xM = Dy 4.66 • 10"6 x^ < - x0
D*y) = v-00" •>•■ "-'(:■; - xo ^ *\ < xo
D;U+) = Dz = 1.77 • KT3 x0 < x^ < 1 1.5. (120)
It was assumed that the concentration of acetone above tlie soil/atmosphere interface is virtually zero. In the theory of probability such a boundary condition is referred to as an absorbing barrier. If the path of ^t goes beyond the boundary, there is no chance for the path to reenter the boundary.
The calculated distribution of acetone in the soil after two days is indicated in Figure 11 where the final points of each sample path are plotted. The point density is proportional to the acetone concentration. In this computation, the time increment was taken as 15 minutes and x0 as 0.1. The proper choice of x0 depends on the value of the time increment. x0 should be selected so that the sample path will include at least one point in the regions (-x0 < x^ < x0) whenever it traverses the boundary, x^ = 0. Now, in an idealized situation in which acetone is deposited as an instantaneous line source in an infinite, homogeneous soil having diffusion coefficient D^ the concentration distribution would be given by
i /(x* - 0.5)2 + x+2 q = __L_ exp ( — — (121)
4rrD1tf \ 40^
DETECTION OF BURIED EXPLOSIVES AND TUNNELS 35
<i
Atmotphtr« i
Upp«r Loytr
i ,- ■
■• ■',.■■'■ '-•
>
■ ■■ * , Lm.
. . ■ ■ ■■- . '.:■-' , ■ . ;/.- ^:-. TSource
■ ■■■.•■: ■■:■■'■■.■•■■ ]■'.' '.' "i'
Lower Loytr *'■■"» • ■ .' * '■' •
Figure 11. Distribution of acetone after 2 days.
from which it is easy to see that the distribution of acetone would be symmetrical. This is also the situation which exists in the present case before the concentration distribution is distorted due to the effect of soil inhomogeneity and the atmosphere/soil interface. Although the distribution is symmetrical with respect to the plane x2 - 0, eventually the lower soil horizon acts as a barrier (low diffusion coefficient) retarding diffusion from the upper layer. Thus, acetone accumulates in the vicinity of the interface. The opposite situation exists at the atmosphere/soil interface due to the relatively rapid diffusivity of acetone in air.
The method based on stochastic diffusion processes can be applied successfully to much more complicated problems than the example discussed. For instance the properties of soil change not only with location but also with time due to the influence of climatic variation. Once chemical effluvia unique to buried explosives are characterized, and if proper geological and meteorological data are both available it should be possible to use this method to predict the appearance of effluvia in the atmosphere under different natural environmental situations.
LITERATURE CITED
1. Anderson, D.M.; F.B. Kistner and M.J. Schwarz (1969) The mass spectra of volatile constituents in military explosives. U.S. Army Cold Regions Research and Engineering Laboratory (USA CRREL) Special Report 105 (AD 699325).
2. Baver, L.D. (1961) Sou pAysics. New York: Wiley and Sons, Inc., 3rd ed., p. 214.
3. Beckman Instruments, Inc. (1965) Program for remote detection of personnel. Report No. APaC-TDR-65.
4. Beckman Instruments, Inc. (1965) Program for remote detection of personnel. Report No. ATL-TR-65-60.
156 DETECTION OF BURIED EXPLOSIVES AND TUNNELS
LITERATURE CITED (Cont'd)
5, Heckimui Instruments, Inc. (1966) Scientific and technoloBical application forecast for rheniical detection of personnel by gaseous and paniculate matter. Report No. AD 4893351,.
(!. Carslaw, U.S. and J.C. Jaeger (1959) Conduction of heat in so/ids. Clarendon Press, p. aaa. "
7. Coats, J.f. et al. (1965) Chemical and biological sensors for personnel dete'tion. Institute of Defense Analysis Report No. S-177.
8. Crank, J. (1956) The mathematics of diffusion. Clarendon Press, p. 121.
9. Iliiniiiiing, R.W. (1962) JVumerica/metJiods for scientists and engineers. New York: McGraw Hill. p. 34. 389.
10. Ito, K. (1946) On a stochastic integral equation. Proceedings, Japan academy, vol. U2, p. 32-35.
11. Ito, K. and 11.P. McKean, Jr. (1965) Diffusion processes and their sample paths. New York: Academic Press.
12. Krause, H.H. et al. (1966) State of tue art study on chemical and biological detection of humans l>y sensing natural exudates. Baltelle Memorial Institute. Report No. BAT- 171-34 (AD 376439).
13. Miller. J.F. and R.W. Coutant (1965) Variations in atmospheric carbon dioxide concentra- tion and their measurement. Phase I: Status study. Battelle Memorial Institute, Report No. BAT-171-21 (AD 461770).
14. Morris, H. (1965) Detection of persons by measurement of carbon dioxide. IDA Report No. 5 RADC-65-1371, p. 181, and IDA/NQ-65-3515 (AD 464578).
15. Moshman, J. (1967) Random number generation. In Mathematical methods tor digital computers, Ralston, S. and S. Herbert (Ed.). New York: Wiley and Sons, Inc.. p. 249-263.
16. Murrmann, R.P.; D.O. Leggett and T.F". Jenkins (1970) Feasibility of tunnel detection by trace gas analysis. USA CRREL Special Report 148.
17. Nicholson, B.J. and T.S. Shilliday (1967) Brief review on vapors from explosives and their detection. RACIC Report.
18. Parfitt, R.L. and M.M. Morland (1968) Ketone adsorption on montmorillonite. Sou Science Society of America Proceedings, vol. 32, p. 355-363.
19. Robinson, E. (1963) Investigation of olfactory techniques. Stanford Research Institute, Report Nos. SRI-3-2203 and ASD-TDR-63-520 (AD 344680).
20. Shreider, Y.A. (1966) The Monte Carlo method. New York: Pergamon Press, p. 334.
21. Simpson, T.J. and R.P. Murrmann (1969) Description of soils at mine-tunnel detection research sites, Puerto Rico. USA CRREL Special Report 144 (AD 707928).
22. Simpson, T.J. and R.P. Murrmann (1970) Chemical properties of soils at mine-tunnel detection sites, Puerto Rico. USA CRREL Special Report 147 (AD 708545).
23. Sragovich, V.G. (1964) Un the numerical solution of the Cauchy problem for linear second- order parabolic equations. Zhurn. Vych. Mat. i Mat. Fiz., vol. 4, no. 5. p. 592-596.
24. Weast, R.C. and S.M. Selby (Ed.) (1967-1968) Handbook of chemistry and physics. 48th ed. p. F-45.
25. Wheeler. R.,I. (1963) Personnel detection by atmospheric monitoring. Southwest Research Institute. Report No. AD 418678L.


![Department of Homeland Security Office of …explosives detection systems and checkpoint [passenger screening] explosives detection equipment.” TSA is currently allocating $734 million](https://static.documents.pub/doc/80x56/5f39c79aee778822c706b048/department-of-homeland-security-office-of-explosives-detection-systems-and-checkpoint.jpg)
