International Snow Science Workshop Grenoble – Chamonix Mont-Blanc - 2013 Influence of summer and winter surface topography on numerical avalanche simulations Maggioni M. 1, *, Bovet, E. 2,3 , Dreier, L. 4 , Buehler, Y. 4 , Godone, D. 1 , Bartelt, P. 4 , Freppaz M. 1 , Chiaia, B. 2 , Segor V. 5 1 DISAFA and NatRisk-LNSA – Università di Torino, Torino – Italy 2 Fondazione Montagna sicura, Courmayeur (AO) – Italy 3 DISEG – Politecnico di Torino, Torino – Italy 4 WSL Institute for Snow and Avalanche Research SLF, Davos – Switzerland 5 Assetto idrogeologico dei bacini montani – Ufficio Neve e Valanghe della Regione autonoma Valle d’Aosta, Quart (AO) – Italy Numerical avalanche dynamics models are widely used to calculate extreme avalanches for hazard mapping and mitigation measure planning. A basic model input is the terrain represented by Digital Elevation Models (DEM). Usually summer topography is used as model input, even though most ava- lanches run on snow-covered terrain with filled gullies and smoothed roughness. Moreover, the depos- its of previous avalanche events can significantly influence the dynamics of following events, espe- cially considering frequent avalanches on the same path. The aim of this paper is to analyze the outputs of the avalanche dynamics model RAMMS obtained using DEM input from summer compared to Digital Surface Model (DSM) generated in winter by laser scanning and digital photogrammetry. We use the 2D model RAMMS to calculate avalanches in two study areas: Seehore test site in Aosta Valley (IT) and Davos (CH). At the Seehore test site we analyze two small artificially triggered avalanches. In those occasions, we performed terrestrial laser scanning (TLS) and photogrammetry before and after the events, to get information on the avalanche volume and on the snow cover distribution before the event. Previous deposits clearly influence the dynamics of the avalanche flow, mainly the direction and the deposition pattern. Simulations on the summer DEM do not consider them, while simulations on the winter DSM are closer to reality. In the Davos area we analyze two avalanche paths and calculate two avalanche events on summer DEM as well as on winter DSM data generated by airborne digital photogrammetry. We find slight dif- ferences in flow velocity as well as in flow path of the simulated avalanches. In particular, snow filled gullies are relevant for the avalanche path. In this work we present the results obtained in these two study areas and draw general conclusions about this important and not yet developed issue. KEYWORDS: avalanche modelling, surface topography, running surface, uncertainty 1 INTRODUCTION Numerical avalanche dynamics models are widely used by avalanche practitioners to calcu- late extreme avalanches for hazard mapping and mitigation measure planning. They are also used in a more scientific context to back- calculate specific avalanche events, usually trig- gered at real scale test sites, either extreme (for ex. Barbolini et al., 2000; Christen et al., 2010a, Casteller et al., 2008, Sampl and Zwinger, 2004) or small avalanches (for ex. Meunier et al., 2004; Barpi et al., 2007; Maggioni et al., 2012). A basic model input is the terrain represen- ted by Digital Elevation Models (DEM). The out- puts of numerical avalanche simulation models are influenced from the choice of the surface topography used as input. Bühler et al. (2011) found that DEM resolution and quality is critical for modelled flow paths, run-out, distances, de- posits, velocities and impact pressures. In avalanche models, usually summer topog- raphies are used as input, even though most avalanches run on snow-covered terrain with filled gullies and smoothed roughness. More- over, the deposits of previous avalanche events ______________________ Corresponding author address: Maggioni M., DISAFA and NatRisk-LNSA – Università di Tori- no, Torino – Italy; tel: +39 011 670 8522; fax: +39 011 670 8692; email: [email protected]591
Transcript
International Snow Science Workshop Grenoble – Chamonix Mont-Blanc - 2013
Influence of summer and winter surface topography on numerical avalanche simulations
Maggioni M.
1,*, Bovet, E.
2,3, Dreier, L.
4, Buehler, Y.
4, Godone, D.
1, Bartelt, P.
4, Freppaz M.
1, Chiaia,
B.2, Segor V.
5
1 DISAFA and NatRisk-LNSA – Università di Torino, Torino – Italy
4 WSL Institute for Snow and Avalanche Research SLF, Davos – Switzerland
5 Assetto idrogeologico dei bacini montani – Ufficio Neve e Valanghe della Regione autonoma Valle
d’Aosta, Quart (AO) – Italy
Numerical avalanche dynamics models are widely used to calculate extreme avalanches for hazard mapping and mitigation measure planning. A basic model input is the terrain represented by Digital Elevation Models (DEM). Usually summer topography is used as model input, even though most ava-lanches run on snow-covered terrain with filled gullies and smoothed roughness. Moreover, the depos-its of previous avalanche events can significantly influence the dynamics of following events, espe-cially considering frequent avalanches on the same path.
The aim of this paper is to analyze the outputs of the avalanche dynamics model RAMMS obtained using DEM input from summer compared to Digital Surface Model (DSM) generated in winter by laser scanning and digital photogrammetry.
We use the 2D model RAMMS to calculate avalanches in two study areas: Seehore test site in Aosta Valley (IT) and Davos (CH).
At the Seehore test site we analyze two small artificially triggered avalanches. In those occasions, we performed terrestrial laser scanning (TLS) and photogrammetry before and after the events, to get information on the avalanche volume and on the snow cover distribution before the event. Previous deposits clearly influence the dynamics of the avalanche flow, mainly the direction and the deposition pattern. Simulations on the summer DEM do not consider them, while simulations on the winter DSM are closer to reality.
In the Davos area we analyze two avalanche paths and calculate two avalanche events on summer DEM as well as on winter DSM data generated by airborne digital photogrammetry. We find slight dif-ferences in flow velocity as well as in flow path of the simulated avalanches. In particular, snow filled gullies are relevant for the avalanche path.
In this work we present the results obtained in these two study areas and draw general conclusions about this important and not yet developed issue.
Numerical avalanche dynamics models are widely used by avalanche practitioners to calcu-late extreme avalanches for hazard mapping and mitigation measure planning. They are also used in a more scientific context to back-calculate specific avalanche events, usually trig-gered at real scale test sites, either extreme (for
ex. Barbolini et al., 2000; Christen et al., 2010a, Casteller et al., 2008, Sampl and Zwinger, 2004) or small avalanches (for ex. Meunier et al., 2004; Barpi et al., 2007; Maggioni et al., 2012).
A basic model input is the terrain represen-ted by Digital Elevation Models (DEM). The out-puts of numerical avalanche simulation models are influenced from the choice of the surface topography used as input. Bühler et al. (2011) found that DEM resolution and quality is critical for modelled flow paths, run-out, distances, de-posits, velocities and impact pressures.
In avalanche models, usually summer topog-raphies are used as input, even though most avalanches run on snow-covered terrain with filled gullies and smoothed roughness. More-over, the deposits of previous avalanche events
______________________
Corresponding author address: Maggioni M., DISAFA and NatRisk-LNSA – Università di Tori-no, Torino – Italy; tel: +39 011 670 8522; fax: +39 011 670 8692; email: [email protected]
591
International Snow Science Workshop Grenoble – Chamonix Mont-Blanc - 2013
can significantly influence the dynamics of fol-lowing events, especially considering frequent avalanches on the same path.
The aim of this paper is to analyze the out-puts of the avalanche dynamics model RAMMS obtained using DEM input from summer com-pared to Digital Surface Model (DSM) generated in winter by laser scanning and digital photo-grammetry.
We choose two study areas:
• The Seehore avalanche test site in Aosta Valley (IT) where two small ava-lanches were artificially triggered and well documented with field measure-ments;
• The Davos area (CH) where two differ-ent extreme avalanche paths are con-sidered.
2 STUDY AREA
2.1 Seehore avalanche test site, Aosta Valley (Italy)
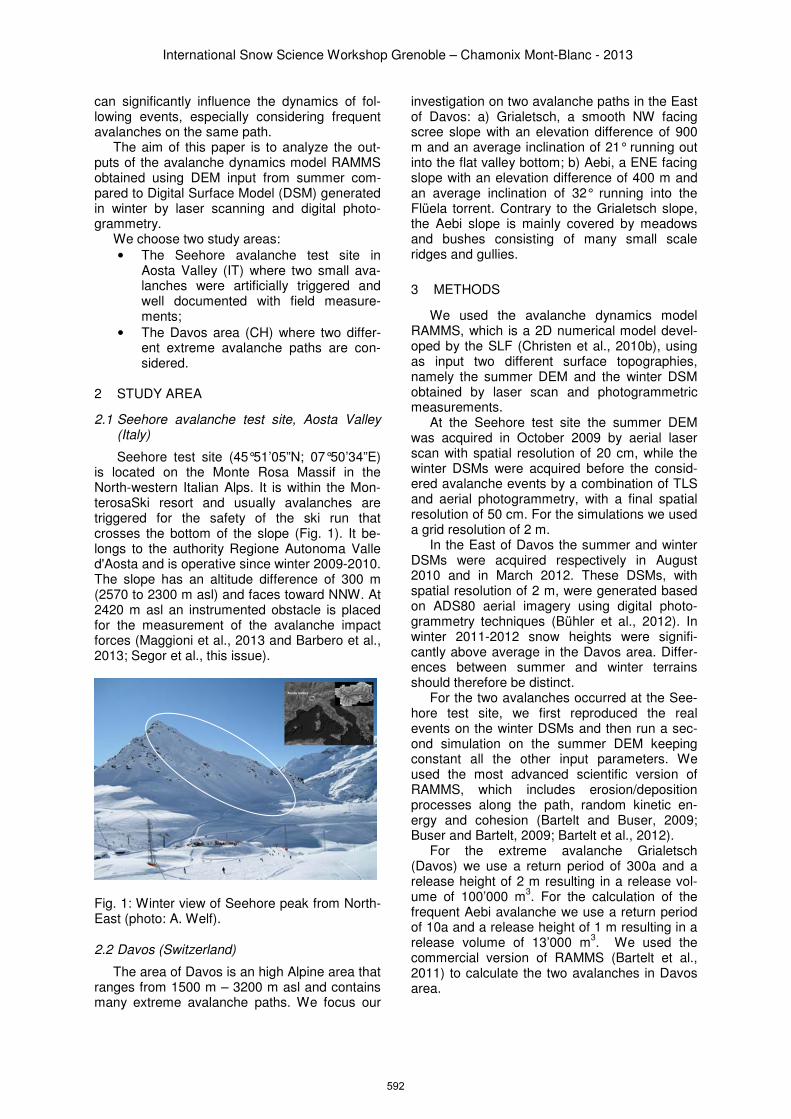
Seehore test site (45°51’05”N; 07°50’34”E) is located on the Monte Rosa Massif in the North-western Italian Alps. It is within the Mon-terosaSki resort and usually avalanches are triggered for the safety of the ski run that crosses the bottom of the slope (Fig. 1). It be-longs to the authority Regione Autonoma Valle d'Aosta and is operative since winter 2009-2010. The slope has an altitude difference of 300 m (2570 to 2300 m asl) and faces toward NNW. At 2420 m asl an instrumented obstacle is placed for the measurement of the avalanche impact forces (Maggioni et al., 2013 and Barbero et al., 2013; Segor et al., this issue).
Fig. 1: Winter view of Seehore peak from North-East (photo: A. Welf).
2.2 Davos (Switzerland)
The area of Davos is an high Alpine area that ranges from 1500 m – 3200 m asl and contains many extreme avalanche paths. We focus our
investigation on two avalanche paths in the East of Davos: a) Grialetsch, a smooth NW facing scree slope with an elevation difference of 900 m and an average inclination of 21° running out into the flat valley bottom; b) Aebi, a ENE facing slope with an elevation difference of 400 m and an average inclination of 32° running into the Flüela torrent. Contrary to the Grialetsch slope, the Aebi slope is mainly covered by meadows and bushes consisting of many small scale ridges and gullies.
3 METHODS
We used the avalanche dynamics model RAMMS, which is a 2D numerical model devel-oped by the SLF (Christen et al., 2010b), using as input two different surface topographies, namely the summer DEM and the winter DSM obtained by laser scan and photogrammetric measurements.
At the Seehore test site the summer DEM was acquired in October 2009 by aerial laser scan with spatial resolution of 20 cm, while the winter DSMs were acquired before the consid-ered avalanche events by a combination of TLS and aerial photogrammetry, with a final spatial resolution of 50 cm. For the simulations we used a grid resolution of 2 m.
In the East of Davos the summer and winter DSMs were acquired respectively in August 2010 and in March 2012. These DSMs, with spatial resolution of 2 m, were generated based on ADS80 aerial imagery using digital photo-grammetry techniques (Bühler et al., 2012). In winter 2011-2012 snow heights were signifi-cantly above average in the Davos area. Differ-ences between summer and winter terrains should therefore be distinct.
For the two avalanches occurred at the See-hore test site, we first reproduced the real events on the winter DSMs and then run a sec-ond simulation on the summer DEM keeping constant all the other input parameters. We used the most advanced scientific version of RAMMS, which includes erosion/deposition processes along the path, random kinetic en-ergy and cohesion (Bartelt and Buser, 2009; Buser and Bartelt, 2009; Bartelt et al., 2012).
For the extreme avalanche Grialetsch (Davos) we use a return period of 300a and a release height of 2 m resulting in a release vol-ume of 100’000 m
3. For the calculation of the
frequent Aebi avalanche we use a return period of 10a and a release height of 1 m resulting in a release volume of 13’000 m
3. We used the
commercial version of RAMMS (Bartelt et al., 2011) to calculate the two avalanches in Davos area.
592
International Snow Science Workshop Grenoble – Chamonix Mont-Blanc - 2013
At the Seehore test site laser scan meas-urements were made also after the event in or-der to get information on erosion and deposition along the path; moreover, field works were done to record snowpack and avalanche characteris-tics. All these data are useful for the evaluation of the RAMMS simulations and the choice of the best set of parameters to back-calculate the real events. However, here we do not show all these data, but we do concentrate on the difference between the outputs of the simulations done on the different summer and winter topographies.
For the avalanches in the Davos area we do not have well documented observations. There-fore, we use expert knowledge to estimate the potential release areas, while friction parameters µ and ξ were classified based on the input DSMs as described in the RAMMS user manual (Bartelt et al., 2011). 4 AVALANCHE DATA 4.1 Seehore test site
On 27th
of March 2010, three avalanches were artificially released (Fig. 2). They were all dense avalanches with a fracture depth of about 25 cm. From the snow pit, the superficial layer was 25 cm thick with a density of 180 kg/m
3.
The deposit presented a dual-lobe shape, with maximum height on the left lobe at around 2380 m asl. The difference between the DSMs generated from laser scan measurements made after and before the avalanche showed that the deposition volume was about 600 m
3 and the
erosion along the path about 1300 m3 (Bovet et
al., 2012).
Fig. 2. Overview of the avalanche triggered on the 27
th of March 2010. In yellow the triggering
points, all with a positive result. As concern the snow cover distribution be-
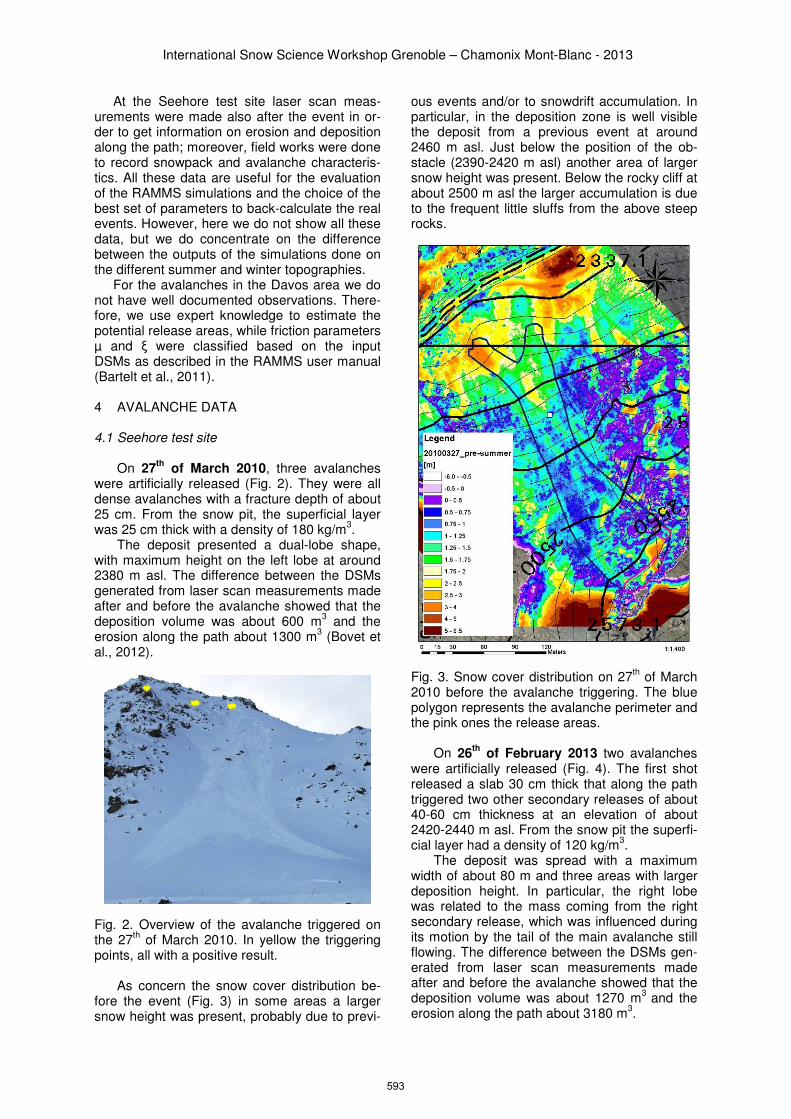
fore the event (Fig. 3) in some areas a larger snow height was present, probably due to previ-
ous events and/or to snowdrift accumulation. In particular, in the deposition zone is well visible the deposit from a previous event at around 2460 m asl. Just below the position of the ob-stacle (2390-2420 m asl) another area of larger snow height was present. Below the rocky cliff at about 2500 m asl the larger accumulation is due to the frequent little sluffs from the above steep rocks.
Fig. 3. Snow cover distribution on 27th of March
2010 before the avalanche triggering. The blue polygon represents the avalanche perimeter and the pink ones the release areas.
On 26
th of February 2013 two avalanches
were artificially released (Fig. 4). The first shot released a slab 30 cm thick that along the path triggered two other secondary releases of about 40-60 cm thickness at an elevation of about 2420-2440 m asl. From the snow pit the superfi-cial layer had a density of 120 kg/m
3.
The deposit was spread with a maximum width of about 80 m and three areas with larger deposition height. In particular, the right lobe was related to the mass coming from the right secondary release, which was influenced during its motion by the tail of the main avalanche still flowing. The difference between the DSMs gen-erated from laser scan measurements made after and before the avalanche showed that the deposition volume was about 1270 m
3 and the
erosion along the path about 3180 m3.
593
International Snow Science Workshop Grenoble – Chamonix Mont-Blanc - 2013
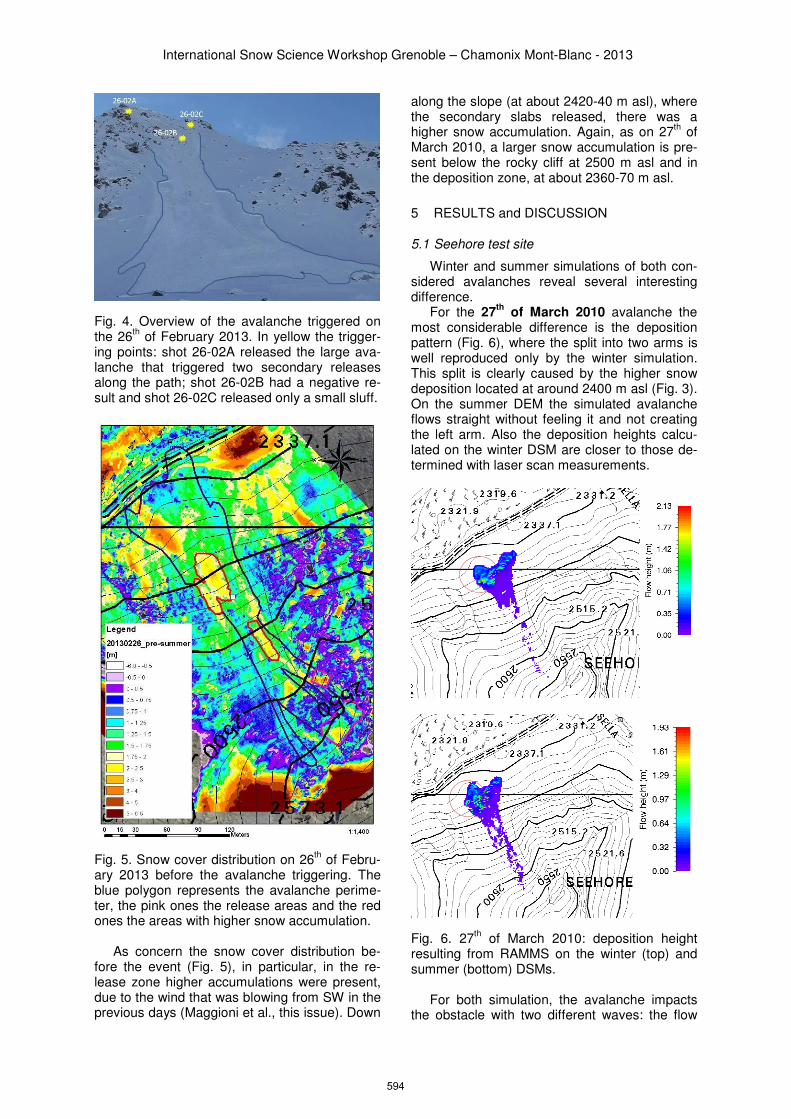
Fig. 4. Overview of the avalanche triggered on the 26
th of February 2013. In yellow the trigger-
ing points: shot 26-02A released the large ava-lanche that triggered two secondary releases along the path; shot 26-02B had a negative re-sult and shot 26-02C released only a small sluff.
Fig. 5. Snow cover distribution on 26th of Febru-
ary 2013 before the avalanche triggering. The blue polygon represents the avalanche perime-ter, the pink ones the release areas and the red ones the areas with higher snow accumulation.
As concern the snow cover distribution be-
fore the event (Fig. 5), in particular, in the re-lease zone higher accumulations were present, due to the wind that was blowing from SW in the previous days (Maggioni et al., this issue). Down
along the slope (at about 2420-40 m asl), where the secondary slabs released, there was a higher snow accumulation. Again, as on 27
th of
March 2010, a larger snow accumulation is pre-sent below the rocky cliff at 2500 m asl and in the deposition zone, at about 2360-70 m asl.
5 RESULTS and DISCUSSION
5.1 Seehore test site
Winter and summer simulations of both con-sidered avalanches reveal several interesting difference.
For the 27th
of March 2010 avalanche the most considerable difference is the deposition pattern (Fig. 6), where the split into two arms is well reproduced only by the winter simulation. This split is clearly caused by the higher snow deposition located at around 2400 m asl (Fig. 3). On the summer DEM the simulated avalanche flows straight without feeling it and not creating the left arm. Also the deposition heights calcu-lated on the winter DSM are closer to those de-termined with laser scan measurements.
Fig. 6. 27th of March 2010: deposition height
resulting from RAMMS on the winter (top) and summer (bottom) DSMs.
For both simulation, the avalanche impacts the obstacle with two different waves: the flow
594
International Snow Science Workshop Grenoble – Chamonix Mont-Blanc - 2013
velocities are similar, while the flow height is higher on the winter DSM (Fig. 7). We explain this fact with the larger erosion occurring on win-ter DSM.
Fig. 7. 27th of March 2010: flow height at the
obstacle resulting from RAMMS on the summer (green) and winter (blue) DSMs.
For the 26
th of February 2013 avalanche
both the winter and summer simulations cannot reproduce the left arm and the left part of the central deposit, which were actually related to a secondary release along the path at about 2420 m slm. If simulating only this secondary ava-lanche, we could see that this flow is influenced by the former deposit in the winter case, and not in the summer one.
In addition, even the deposition pattern is dif-ferent: in the winter case the deposit fills the ar-eas with lower snow accumulation, while in the summer case the flow goes right (Fig. 8).
The maximum velocities along the path (Fig. 9) are generally higher in the winter case, probably due to the lower roughness of the DSM. However, in the first part of the flow and in the zones of larger snow accumulation (2390-2420 m a.s.l.), the flow is faster in the summer case, probably due to the larger slope angle. In these zones, also the erosion is larger in the summer case: we explain this with the fact that the model uses an erosion law proportional to the velocity. However, the total erosion is slightly higher in the winter case.
Fig. 8. 26th of February 2013: maximum velocity
resulting from RAMMS on the winter (top) and summer (bottom) DSMs. The red line defines the profile along which the maximum velocities were calculated (see Fig. 9).
Fig. 9. 26th of February 2013: maximum velocity
resulting from RAMMS along the red profile line (Fig. 8) in the summer (green) and winter (blue) simulations (bottom).
595
International Snow Science Workshop Grenoble – Chamonix Mont-Blanc - 2013
5.2 Davos area
Winter and summer simulations of the ex-treme Grialetsch avalanche (Fig. 10) reveal several small but interesting differences. In the runout part the avalanche flow path is clearly wider on the winter DSM. In winter, gullies are filled with snow (Fig. 10, bottom) and the runout area is smoother which allows the avalanche to spread. At the western end of the avalanche deposit we simulate an about one hundred me-ters longer runout in north-western direction on
0 500 Meters250
0 300100 200 Meters 0 300100 200 Meters
Fig. 10. Maximum velocity of the extreme Gri-aletsch avalanche resulting from the RAMMS simulation based on winter DSM (top). Runout of the simulation based on summer (middle left) and winter DSMs (middle right) and profile line in red. Snow depth profile along the red line in summer (green) and winter (blue) (bottom).
the winter DSM due to the snow filled gully. Such differences could be of big importance for hazard zonation.
The comparison of the winter and summer simulation of the Aebi avalanche (Fig.11) shows some small but interesting effects. In the first part of the flow path (200– 350 m) the ava-lanche is running marginally faster on the sum-mer DSM. We explain this by the slightly steeper slope. In the intermediate part of the flow path (400 – 550 m) the avalanche is running faster on the winter DSM. We measure a significantly lower roughness along the main flow path in the winter DSM. The smoother surface may lead to a higher acceleration. Because the avalanches stop in the Flüela creek, we cannot observe ma-jor differences in the runout part (550 – 650 m), but we see that in the runout zone, the ava-lanche is running slightly faster on the summer DSM. We explain this with a higher channelling of the snow in the summer DSM. This causes acceleration and a minor shift of the main flow path. On the winter DSM the flow is less con-fined and the avalanche gets wider.
0 250 Meters125
Fig. 11. Maximum velocity of Aebi avalanche simulation based on summer DSM (top). Maxi-mum velocity along the red profile line in the
596
International Snow Science Workshop Grenoble – Chamonix Mont-Blanc - 2013
summer (green) and winter (blue) simulations (bottom).
6 CONCLUSIONS
In this work we showed in different study ar-eas how the choice of the terrain input to an avalanche dynamics model can influence the model outputs, especially the deposition pattern and the maximum velocity.
The deposition pattern is clearly influenced by previous avalanche deposits and/or larger snow accumulation due for ex. to snowdrift ac-tion. There is not a clear behaviour for the maximum velocity: for ex. in areas of larger snow accumulations it is higher in the summer case due to a steeper inclination of the slope, while in general in the central part of the ava-lanche paths it is higher in the winter case due to a lower surface roughness. However, from the considered study cases, we cannot draw general conclusion about the avalanche velocity.
As avalanche dynamics models such as RAMMS are becoming very sophisticated and able to describe better and better the real phys-ics that occurs within an avalanche flow, it is very important to understand which is the run-ning surface of an avalanche. This implies a bet-ter knowledge of the erosion and deposition processes within the avalanche flow. These processes are very important especially for small avalanches such as those triggered at the Seehore test site, which becomes an important full-scale test site to proceed in this research topic.
On the other hand, for extreme avalanches, we think that a well-calibrated dynamics model can perform well also on less detailed terrain models, but that some uncertainties in the out-puts has to be taken into consideration in the final expert evaluation of the avalanche hazard.
7 AKNOWLEDGEMENTS
This work was possible thanks to the Opera-tional Program ALCOTRA Italy/France (Alps) Project “Map3 – Monitoring for the Avalanche Prevision, Prediction and Protection”.
We would like to thank the other members of the Seehore team for their collaboration and useful discussion.
8 REFERENCES
Barbero, M., Barpi, F., Borri-Brunetto, M., Bovet, E., Chiaia, B., De Biagi, V., Frigo, B., Pallara, O., Maggioni, M., Freppaz, M., Ceaglio, E., Godone, D., Viglietti, D., Zanini, E., 2013. A new experimental snow avalanche test site at Seehore Peak in Aosta Valley (NW Italian Alps) -
Part II: engineering aspects. Cold Regions Science and Technology 86, 14-21.
Barbolini, M., Gruber, U., Keylock, C.J., Naaim, M., Savi, F., 2000. Application of statistical and hydraulic-continuum dense-snow avalanche models to five real European sites, Cold Regions Science and Technology 31, 133–149.
Barpi, F, Borri-Brunetto, M., Veneri, L.D., 2007. Cellular-automata model for dense-snow avalanches. Journal of Cold Regions Engineering, 21 (4):121-140.
Bartelt, P., Buser, O., 2009. Frictional relaxation in avalanches. Annals of Glaciology 54, 121–130.
Bartelt, P., Buehler, Y., Christen, M., Deubelbeiss, Y., Salz, M., Schumacher, L., 2011. RAMMS User Manual v1.4 Avalanche, WSL-SLF.
Bartelt, P., Buehler, Y., Buser, O., Christen, M., Meier, L., 2012. Modeling mass-dependent flow regime transitions to predict the stopping and depositional behavior of snow avalanches, Journal of Geophysical Research 117, F01015, 28 pp. doi:10.1029/2010JF001957.
Bovet, E., Chiaia, B., Maggioni, M., Godone, D., Freppaz, M., 2012.,Different surveys techniques to assess the snow erosion and deposition at the Punta Seehore test site. International Snow Science Workshop 2012 Proceedings, ISSW, Anchorage (AK, USA), 16-22 October 2012.
Bühler, Y., Christen, M., Kowalski, J., Bartelt, P., 2011. Sensitivity of snow avalanche simulations to digital elevation model quality and resolution. Annals of Glaciology 52(58).
Bühler, Y., Marty, M., Ginzler, C., 2012. High Resolution DEM Generation in High-Alpine Terrain Using Airborne Remote Sensing Techniques. Transactions in GIS 16(5), 635-647.
Buser, O., Bartelt, P., 2009. The production and decay of random energy in granular snow avalanches. Journal of Glaciology 55 (189), 3–12.
Casteller, A., Christen, M., Villalba, R., Martinez, H., Stoeckli, V., Leiva, J.C., Bartelt, P., 2008. Validating numerical simulations of snow avalanches using dendrochronology: the Cerro Ventana event in Northern Patagonia, Argentina. Nat. Hazards Earth Syst. Sci. 8, 433–443.
Christen, M., Bartelt, P., Kowalski, J., 2010a. Back calculation of the In den Arelen avalanche with RAMMS: interpretation of model results. Annals of Glaciology 51(54), 161–168.
Christen, M., Kowalski, J., Bartelt, P., 2010b. RAMMS: numerical simulation of dense snow avalanches in three-dimensional terrain. Cold Regions Science and Technology 63 (1–2), 1–14.
Maggioni, M., Freppaz, M., Christen, M., Bartelt, P., Zanini, E., (2012). Back-calculation of small-size avalanches with the 2D avalanche dynamics model RAMMS: four events artificially triggered at the Seehore test site in Aosta Valley (NW Italy). Proceeding of the 2012 International Snow Science Workshop, 15-21 September 2012, Anchorage, Alaska.
Maggioni, M., Freppaz, M., Ceaglio, E., Godone, D., Viglietti, D., Zanini, E., Barbero, M., Barpi, F., Borri-Brunetto, M., Bovet, E., Chiaia, B., De Biagi,
597
International Snow Science Workshop Grenoble – Chamonix Mont-Blanc - 2013
V., Frigo, B., Pallara, O., 2013. A new experimental snow avalanche test site at Seehore peak in Aosta Valley (NW Italian Alps) - Part I: conception and logistics. Cold Regions Science and Technology 85, 175-182.
Maggioni, M., Durand, N., Frigo, B., Pallara, O., Dellavedova, P., Segor, V., Naaim-Bouvet, F., Bellot, H., 2013. Preliminary measurements and survey of snowdrift at the Seehore avalanche test site – Aosta Valley (IT). This issue.
Meunier, M., Ancey, C., Taillandier, J.T., 2004. Fitting avalanche-dynamics models with documented events from the Col du Lautaret site (France) using the conceptual approach. Cold Regions Science and Technology 39, 55-66.
Sampl, P., Zwinger, T., 2004. Avalanche simulations with SAMOS. Annals of Glaciology 38 (1), 393-398.
Segor, V., Pitet, L., Maggioni, M., Frigo, B., Freppaz, M., Chiaia, B., Bovet, E., Ceaglio, E., Welf, A., Dellavedova, P., 2013. The experimental snow avalanche test site at Seehore Peak in Aosta Valley (IT). This issue.