Page 1
Influence of the Chemical Composition of Aggregates in the Adhesion Quality
and Durability of Asphalt-Aggregate Systems
A Thesis by:
Andrés Felipe Cala Pérez
Advisor:
Ph.D Silvia Caro Spinel
Universidad de los Andes
Department of Civil and Environmental Engineering
In partial fulfillment for the degree of:
MSc in Civil Engineering
Bogotá, Colombia
May, 2019
This dissertation was published and uses material from the article “Impact of the chemical
composition of aggregates on the adhesion quality and durability of asphalt-aggregate systems”
(volume 216, pp 661-672) from: Andres Cala, Silvia Caro, Maria Lleras and Yamirka Rojas-
Agramonte published in the journal Construction and Building Materials © . Copyright: Elsevier.
Article is available online at:
https://www.sciencedirect.com/science/article/abs/pii/S0950061819311894?via%3Dihub
Page 2
ABSTRACT
Rock mineralogy is critical in determining the adhesion quality and moisture susceptibility of
asphalt-aggregate systems in asphalt mixtures. This work aims at identifying the chemical
properties of aggregates that influence the quality and durability of these systems. To accomplish
this goal, three lithologies with an ample mineralogical and chemical spectrum (i.e. quartzite,
granodiorite and serpentinite) were selected. Asphalt-aggregate specimens fabricated with these
lithologies were tested using a new pull-off experiment in dry condition, and after 1, 3 and 7
days of being submerged in water. The results show that rocks of mafic composition (e.g.
serpentinite) have better resistance to moisture damage than felsic rocks (e.g. quartzite and
granodiorite), and that certain specific aggregate oxides promote or prevent moisture degradation
in these systems.
Keywords: Asphalt pavements, Mineralogy, Asphalt-aggregate system, Adhesion, Moisture
damage
Page 3
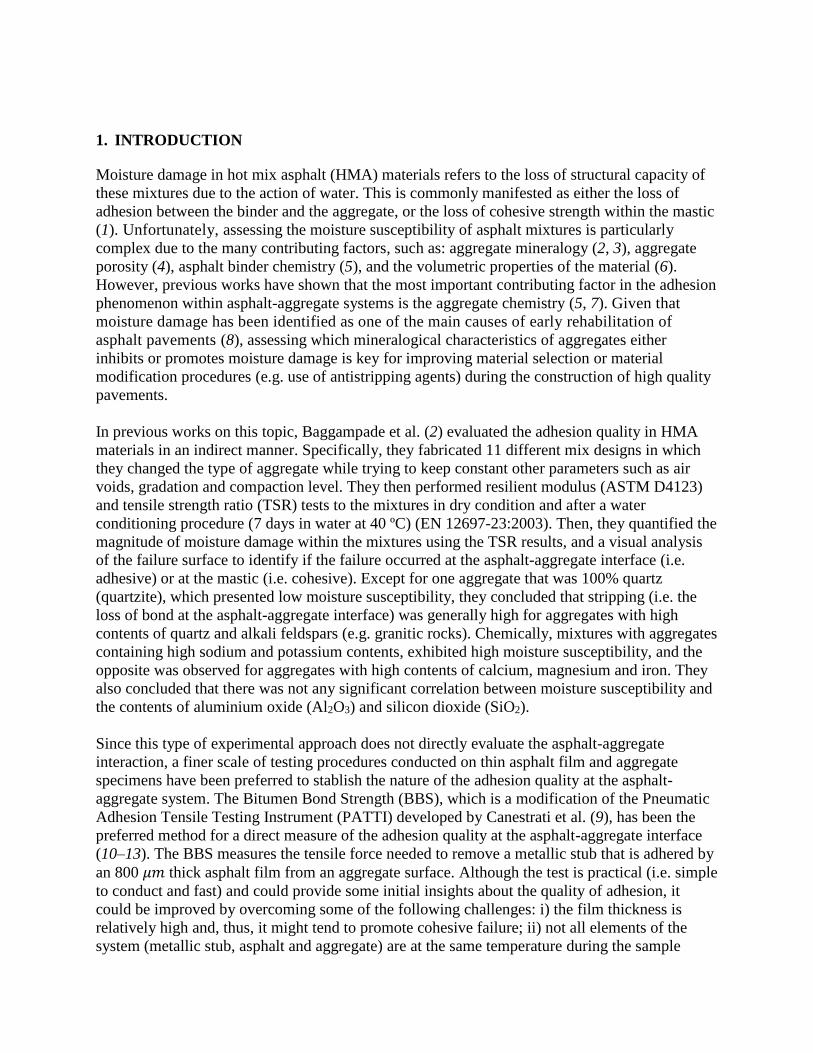
1. INTRODUCTION
Moisture damage in hot mix asphalt (HMA) materials refers to the loss of structural capacity of
these mixtures due to the action of water. This is commonly manifested as either the loss of
adhesion between the binder and the aggregate, or the loss of cohesive strength within the mastic
(1). Unfortunately, assessing the moisture susceptibility of asphalt mixtures is particularly
complex due to the many contributing factors, such as: aggregate mineralogy (2, 3), aggregate
porosity (4), asphalt binder chemistry (5), and the volumetric properties of the material (6).
However, previous works have shown that the most important contributing factor in the adhesion
phenomenon within asphalt-aggregate systems is the aggregate chemistry (5, 7). Given that
moisture damage has been identified as one of the main causes of early rehabilitation of
asphalt pavements (8), assessing which mineralogical characteristics of aggregates either
inhibits or promotes moisture damage is key for improving material selection or material
modification procedures (e.g. use of antistripping agents) during the construction of high quality
pavements.
In previous works on this topic, Baggampade et al. (2) evaluated the adhesion quality in HMA
materials in an indirect manner. Specifically, they fabricated 11 different mix designs in which
they changed the type of aggregate while trying to keep constant other parameters such as air
voids, gradation and compaction level. They then performed resilient modulus (ASTM D4123)
and tensile strength ratio (TSR) tests to the mixtures in dry condition and after a water
conditioning procedure (7 days in water at 40 ºC) (EN 12697-23:2003). Then, they quantified the
magnitude of moisture damage within the mixtures using the TSR results, and a visual analysis
of the failure surface to identify if the failure occurred at the asphalt-aggregate interface (i.e.
adhesive) or at the mastic (i.e. cohesive). Except for one aggregate that was 100% quartz
(quartzite), which presented low moisture susceptibility, they concluded that stripping (i.e. the
loss of bond at the asphalt-aggregate interface) was generally high for aggregates with high
contents of quartz and alkali feldspars (e.g. granitic rocks). Chemically, mixtures with aggregates
containing high sodium and potassium contents, exhibited high moisture susceptibility, and the
opposite was observed for aggregates with high contents of calcium, magnesium and iron. They
also concluded that there was not any significant correlation between moisture susceptibility and
the contents of aluminium oxide (Al2O3) and silicon dioxide (SiO2).
Since this type of experimental approach does not directly evaluate the asphalt-aggregate
interaction, a finer scale of testing procedures conducted on thin asphalt film and aggregate
specimens have been preferred to stablish the nature of the adhesion quality at the asphalt-
aggregate system. The Bitumen Bond Strength (BBS), which is a modification of the Pneumatic
Adhesion Tensile Testing Instrument (PATTI) developed by Canestrati et al. (9), has been the
preferred method for a direct measure of the adhesion quality at the asphalt-aggregate interface
(10–13). The BBS measures the tensile force needed to remove a metallic stub that is adhered by
an 800 𝜇𝑚 thick asphalt film from an aggregate surface. Although the test is practical (i.e. simple
to conduct and fast) and could provide some initial insights about the quality of adhesion, it
could be improved by overcoming some of the following challenges: i) the film thickness is
relatively high and, thus, it might tend to promote cohesive failure; ii) not all elements of the
system (metallic stub, asphalt and aggregate) are at the same temperature during the sample
Page 4
preparation procedure, given that the asphalt has to be in a semi-solid state for its manipulation
and placement at the aggregate surface; iii) the testing specimen (i.e. polished rock slab), in
which the pull-off test is performed, has an uncontrolled geometry which can affect water
permeability; and iv) although the high velocity of the test promotes adhesive failure, it does not
allow to obtain deformation or strain data that could be of help to understand the debonding
process.
To surpass some of these difficulties, some researchers have used rheometers to study the
adhesion phenomenon in these systems. These efforts have been conducted through two different
approaches, either performing dynamic shear rheometer (DSR) tests over two rocks bonded with
a thin asphalt film (e.g. (14)) or by fabricating small cylindrical asphalt-aggregate specimens on
a rheometer and then failing them under tensile conditions using a loading frame (e.g. (15)).
Since the latter is a direct measure of the bonding quality of these systems, it has gained
popularity. For instance, Howson (16) used a rheometer to fabricate specimens that consisted on
two rock samples bonded with a thin asphalt layer (up to 10 𝜇𝑚 thick) and then, the system was
subjected to tensile failure using a hydraulic press. When the specimens are prepared and tested
in a rheometer, the equipment allows for precise control over the temperature, the asphalt film
thickness and the applied loading conditions. Nevertheless, it also has some limitations such as:
i) test velocities are usually slow, thus promoting cohesive failure at the interface; ii) moisture
conditioning to evaluate moisture susceptibility of the system can be difficult to perform; iii)
aggregate preparation requires more steps than in the case of the BBS (e.g. coring cylindrical
rock samples, levelling the faces of the rock cores to avid eccentricity, etc.); and iv) given that
rheometers are a quite expensive equipment, modifying them for this purpose might be not
feasible.
Usually, the studies that have explored the adhesive quality of asphalt-aggregate systems with
either the BBS or with the aid of a rheometer and/or a loading frame aim at comparing the
relative performance of different aggregate sources. Nevertheless, most of them have missed a
comprehensive aggregate chemical and mineralogical characterization, which is necessary to
obtain a precise measure of the moisture susceptibility of aggregates with different chemical
and/or mineralogical characteristics. This might be partially due to the fact that aggregates in
pavement engineering are not typically rigorously characterized based on their mineralogical
characteristics. Consequently, to better understand and analyse the adhesion at the asphalt-
aggregate system, a more in-depth analysis of the aggregates is needed.
In fact, lack of proper aggregate characterization procedures has made the conflictive idea that
moisture susceptibility in HMA could be positively correlated with aggregate acidity (i.e. SiO2
content), and negatively correlated with aggregate basicity (i.e. calcium carbonate (CaCO3)
content) (17, 18). However, the term basicity, from a geochemical standpoint, refers to the lack
of SiO2 and not to the presence of CaCO3. Moreover, some rocks can have high amounts of SiO2
and CaCO3 simultaneously since they are compatible oxides, making the original statement
inapplicable for most rocks. Furthermore, the term acidity and basicity were only intended for
the classification of igneous rocks and has since been replaced by the mafic and felsic terms,
which refer to the overall rock composition, rather than just to a single oxide. A mafic rock has
high amounts of magnesium and iron, which are usually accompanied with relatively high
amounts of elements such as aluminium and manganese; on the other hand, a felsic rock has high
amounts of quartz and feldspar minerals with relatively high amounts of silicon, sodium and
Page 5
calcium. Therefore, the mafic and felsic terms better reflect the overall chemistry of a rock and,
therefore, its mineralogy.
The objective of this work is to identify the chemical components of aggregates that affect
moisture susceptibility of asphalt-aggregate systems, by means of a new testing methodology
that offers some improvements over previous works. This new methodology consists in using a
modified micrometer to prepare a thin film of asphalt of 20 𝜇𝑚 in between a metallic stub and a
cylindrical rock core with a controlled geometry. Afterwards, the samples (i.e. metallic stub-
asphalt-aggregate) are left on dry or room environment conditions, or are moisture conditioned
under water for 1, 3 and 7 days; and then taken to failure using a hydraulic press under a
displacement-controlled test velocity of 10 mm/min. This procedure was conducted using three
different aggregates that were rigorously characterized, and that represented a wide range of
mineralogical and chemical compositions (i.e. quartzite, granodiorite and serpentinite). The
results of this work offer new and valuable information about the influence of the aggregate
chemistry on the moisture susceptibility of HMA, and they could be used for improving the
selection of materials as part of the design methodologies of asphalt mixtures.
2. MATERIALS
2.1. Asphalt Binder
Since the main goal of this work is to identify the chemical parameters of aggregates that
generate better bonding with the asphalt, all samples were prepared using an unmodified asphalt
binder labelled as penetration of 60/70 (1/10 mm). This decision is supported on the fact that
even though it is recognized that asphalt chemistry has some influence over the asphalt-
aggregate interactions, aggregate chemistry has been proven to be much more relevant at
determining the stripping and damage potential of these systems (5, 7). Moreover, Grenfell et al.
(19) used surface free energy measurements of four different aggregate sources and three
different binders, and concluded that aggregates with high quartz and feldspar contents had
higher moisture susceptibility than those with high calcite contents, despite the binder used.
2.2. Aggregates
Aggregates were selected following two main criteria: i) to have a wide compositional and
mineralogical spectrum, and ii) to have little to no porosity, so water diffusion during moisture
conditioning occurred only through the asphalt-aggregate interface. For this work, three different
lithologies were selected: i) quartzite (Qtz), ii) granodiorite (Grt) and iii) serpentinite (Spt).
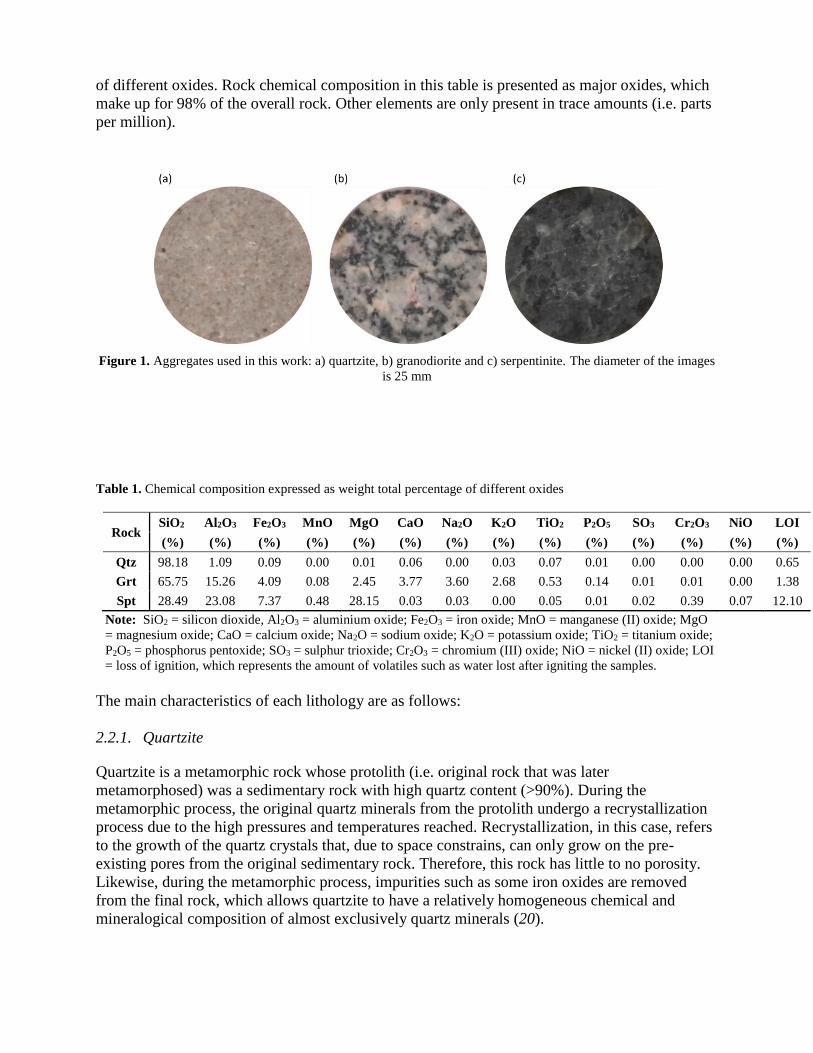
Quartzite (Figure 1a) samples were collected from the Quetame mastiff located at the Meta
department in Colombia, while the granodiorite (Figure 1b) and serpentinite (Figure 1c) samples
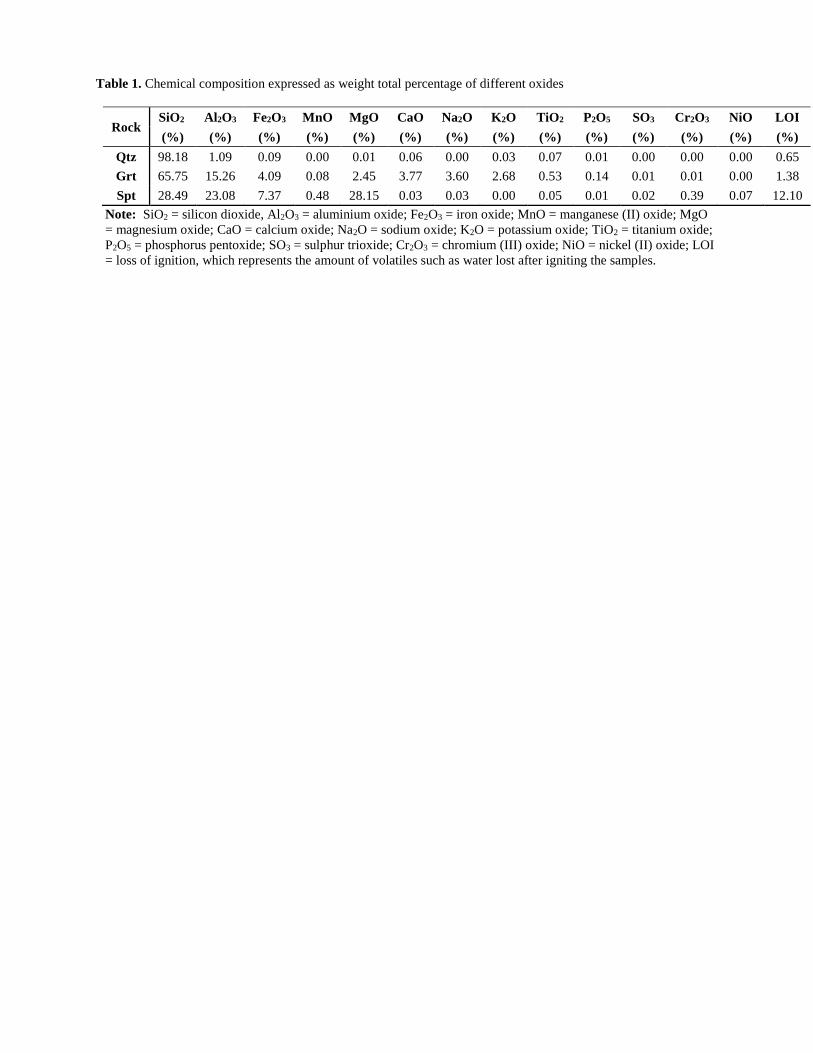
were obtained from the Cajamarca complex located in the Tolima region. Table 1 presents the
chemical composition obtained through high precision X-ray fluorescence (XRF) of each of
these rocks, which is an advanced and rigorous procedure, expressed as weight total percentage
Page 6
of different oxides. Rock chemical composition in this table is presented as major oxides, which
make up for 98% of the overall rock. Other elements are only present in trace amounts (i.e. parts
per million).
Figure 1. Aggregates used in this work: a) quartzite, b) granodiorite and c) serpentinite. The diameter of the images
is 25 mm
Table 1. Chemical composition expressed as weight total percentage of different oxides
Rock SiO2 Al2O3 Fe2O3 MnO MgO CaO Na2O K2O TiO2 P2O5 SO3 Cr2O3 NiO LOI
(%) (%) (%) (%) (%) (%) (%) (%) (%) (%) (%) (%) (%) (%)
Qtz 98.18 1.09 0.09 0.00 0.01 0.06 0.00 0.03 0.07 0.01 0.00 0.00 0.00 0.65
Grt 65.75 15.26 4.09 0.08 2.45 3.77 3.60 2.68 0.53 0.14 0.01 0.01 0.00 1.38
Spt 28.49 23.08 7.37 0.48 28.15 0.03 0.03 0.00 0.05 0.01 0.02 0.39 0.07 12.10
Note: SiO2 = silicon dioxide, Al2O3 = aluminium oxide; Fe2O3 = iron oxide; MnO = manganese (II) oxide; MgO
= magnesium oxide; CaO = calcium oxide; Na2O = sodium oxide; K2O = potassium oxide; TiO2 = titanium oxide;
P2O5 = phosphorus pentoxide; SO3 = sulphur trioxide; Cr2O3 = chromium (III) oxide; NiO = nickel (II) oxide; LOI
= loss of ignition, which represents the amount of volatiles such as water lost after igniting the samples.
The main characteristics of each lithology are as follows:
2.2.1. Quartzite
Quartzite is a metamorphic rock whose protolith (i.e. original rock that was later
metamorphosed) was a sedimentary rock with high quartz content (>90%). During the
metamorphic process, the original quartz minerals from the protolith undergo a recrystallization
process due to the high pressures and temperatures reached. Recrystallization, in this case, refers
to the growth of the quartz crystals that, due to space constrains, can only grow on the pre-
existing pores from the original sedimentary rock. Therefore, this rock has little to no porosity.
Likewise, during the metamorphic process, impurities such as some iron oxides are removed
from the final rock, which allows quartzite to have a relatively homogeneous chemical and
mineralogical composition of almost exclusively quartz minerals (20).
Page 7
The quartzite used in this work has a holocrystalline-phaneritic texture (i.e. all minerals can be
distinguished at plain sight) with a crystal size ranging from 3 to 4 mm. Mineralogically, it is
composed almost exclusively from quartz minerals with some minor inclusions of iron and
aluminium oxides (<1%). According to Table 1, this rock has a 98.18% SiO2 content, which is
the consequence of its extremely felsic nature.
2.2.2. Granodiorite
Granodiorite is an intrusive (i.e. crystallizes inside earth’s crust) granitic rock product of the slow
cooling of felsic magma. It has a holocrystalline-phaneritic texture in which individual minerals
can be easily distinguished from one another (Figure 1b). Unlike quartzite, this rock has a
heterogeneous chemical and mineralogical composition with common mineral assemblages of:
quartz, plagioclase, orthoclase, amphiboles, biotite and pyroxenes (21).
The granodiorite used in this study is mainly composed of quartz (50%), feldspars (35%) and
hornblende (15%). According to the results from Table 1, this rock has a high SiO2 content
(65.75%), which is a consequence of the high presence of felsic minerals such as quartz and
feldspars. Likewise, its high Al2O3 content (15.62%) might be the result of the presence of the
hornblende amphibole. It is noteworthy that, geologically speaking, this rock is considered to
have a global felsic composition – although not as extreme as quartzite – despite the presence of
the after mentioned not-so-felsic minerals.
2.2.3. Serpentinite
Serpentinite is a low pressure and temperature metamorphic rock. It is the product of the
metamorphism of extremely mafic igneous rocks composed mainly of olivine and pyroxenes,
which are only found at the mantle of the earth. During the exhumation procedure (i.e. when
these rocks reach the surface of the earth), olivine minerals hydrate, giving origin to serpentine
minerals (20). In order for these minerals to retain water within their mineral structure, they have
to be hydrophobic.
The serpentinite used in this study presents a hipocrystalline texture in which serpentine minerals
(1 to 5 mm) are embedded within a black pyroxene matrix. This rock is ultramafic, which is
evident due to its low SiO2 content (28.49%), and it high MgO content (28.15%). It should be
noted that since olivine and quartz are incompatible minerals, the SiO2 content from this rock
does not come from quartz but from the olivine and pyroxene minerals, which are of mafic
nature.
3. EXPERIMENTAL METHODOLOGY
The experimental methodology consisted in preparing small cylindrical asphalt-aggregate-
metallic stub (AAS) testing samples, with asphalt films of 20 μm thick, using a modified
micrometer (Mitutoyo Ref: 293-253-10). The AAS systems were either kept at dry (room)
conditions or conditioned in type 1 water (i.e. ultrapure water that has been depleted of most
contaminants) for either 1, 3 or 7 days. Then, the AAS systems were failed under tensile stresses
using a hydraulic press (ELE Ref: Tritest 50kN) at a 10 mm/min loading condition. The final
results of the test are the maximum load at failure and the adhesive failure area on the aggregate
Page 8
surface. Details concerning the rock sample preparation, the modified micrometer and the AAS
system fabrication are presented in the following sections.
3.1. Rock Sample preparation
Rock sample preparation consists of the following procedure:
1. 25 mm (1 inch) cores are obtained in the laboratory from rocks collected from the field.
2. Cores are cut to obtain cylindrical specimens with 25 mm of height.
3. Both faces of the cylindrical core are grinded with a cup wheel that has a diamond
particle size of 40 μm in a high precision cutting and grinding machine (Struers Ref:
Accutom-100). This ensures that: i) the faces of the cores are completely parallel (± 1 μm
tolerance), and ii) the polishing level of the faces between replicates is the same, so no
textural effects are present at the asphalt-aggregate interface.
4. Samples are subjected to an ultrasound bath for 10 minutes at 60ºC to remove possible
residues that might have been left behind during the cutting and polishing procedures.
3.2. Modified micrometer for the fabrication of the testing specimens
To ensure a homogenous 20 μm thick asphalt film in the AAS systems, a modified micrometer
was developed. In this micrometer, a metallic stub with a diameter of 25mm is placed at one end,
and a rock sample of the same diameter at the other, as observed in Figure 2. The metallic stub
has a controlled roughness that promotes mechanical interlocking with the asphalt and prevents
undesirable failure at the stub-asphalt interface. This setup has a precise control over the film
thickness as the resolution of the micrometer is of ± 1 μm. Furthermore, by using this setup, the
asphalt binder can be used in a liquid state (i.e. at HMA mixing temperatures) since surface
tension forces retain enough asphalt at the surface of the rock core prior to the lowering of the
metallic stub.
Page 9
Figure 2. Modified micrometer for AAS sample preparation.
3.3. Aggregates-Asphalt-Stub (AAS) system preparation
The preparation of the AAS system was conducted using the cylindrical rock samples and the
modified micrometer previously described, as follows:
1. Metallic stubs are cleaned to remove possible residues or dust.
2. The rock sample and the metallic stub are introduced into an oven at 150 ºC for at least a
30 min period, assuring that water has completely evaporated from both elements.
3. Simultaneously with step 2, 1.50 g of asphalt binder are introduced into the oven during
the last 15 min. Therefore, after the initial 30 min period all elements are expected to be
at 150 ºC.
4. The metallic stub and rock sample are placed on the modified micrometer, as shown in
Figure 2.
5. The micrometer is zeroed at the point in which the metallic stub touches the rock sample.
6. The asphalt binder is placed on top of the rock sample.
7. The metallic stub is lowered until the micrometer’s dial reaches 20 𝜇𝑚.
8. The complete setup is left cooling down for at least 45 minutes. After this period, the
AAS system (Figure 3a) can be dismounted from the micrometer.
9. Aluminium foil, which was used to wrap rock samples, is removed so that the excess
binder that was dripped to the sides after lowering the metallic stub does not alter the
water exposure of the asphalt-aggregate interface.
10. If the AAS system is going to be subjected to water conditioning, it is placed upside-
down in a container with water. A counterweight with the exact weigh of the rock sample
is connected to the bottom of the system (Figure 3b) to prevent asphalt creep (i.e.
alteration of the asphalt film thickness) during the extent of the conditioning period.
Page 10
Figure 3. a) AAS system, all dimensions shown are in mm; and b) water conditioning setup of the AAS system.
3.4. Testing procedure
The testing procedure consists in applying tensile forces on the AAS systems under a control
displacement condition of 10 mm/min until failure; i.e. debonding of the rock sample from the
metallic stub. This displacement condition, which is considered fast enough for the purposes of
the experiment, was selected as it was the fastest loading condition provided by the hydraulic
equipment used for the experiment. Also, this speed allowed for a minimal deformation of the
asphalt binder which reduced the possibility of only cohesive failures due to the viscoelastic
properties of asphalt materials.
Adhesive failure corresponds to the case when the debonding occurs at the asphalt-aggregate
interface (i.e. asphalt is not observed on the surface of the rock core), and, cohesive failure when
the failure occurs within the asphalt binder (i.e. asphalt covers the surface of the rock core).
Usually, the failure mode is neither fully adhesive nor cohesive. Therefore, image analysis of the
failure surface is required to determine the extent of the adhesive failure area.
In order to conduct the pull-off debonding test on the AAS system, a couple of add-ons were
required on the hydraulic press (Figure 4). During the test, loading data were captured using an
Omega LC201-300 load cell. The initial results from the test are Force [N] vs. Time [s] data
collected every 0.1s, and the adhesive failure area (𝐴%) on the surface of the rock specimen,
which is obtained through image analysis using the software ImageJ and the guidelines proposed
by Abramoff et al. (22). From the mechanical results, the maximum load at failure, Fmax, and the
work of fracture, Wf (i.e. area under the Force vs. Time curve) were calculated.
Page 11
Figure 4. Experimental testing procedure setup
4. RESULTS AND ANALYSIS
All samples were labelled considering three characteristics: i) rock lithology, Qtz (quartzite), Grt
(granodiorite) and Spt (serpentinite); ii) the time they were subjected to water conditioning, 0, 1,
3 or 7 days; and iii) the replicate number. For instance, the sample Grt-7-2 corresponds to the
second replicate of a granodiorite sample that was subjected to water conditioning for 7 days. If
only one number is shown, for instance Qtz-7, it refers to the average obtained for all replicates
of that rock at that conditioning period.
4.1. Mechanical performance of the AAS systems
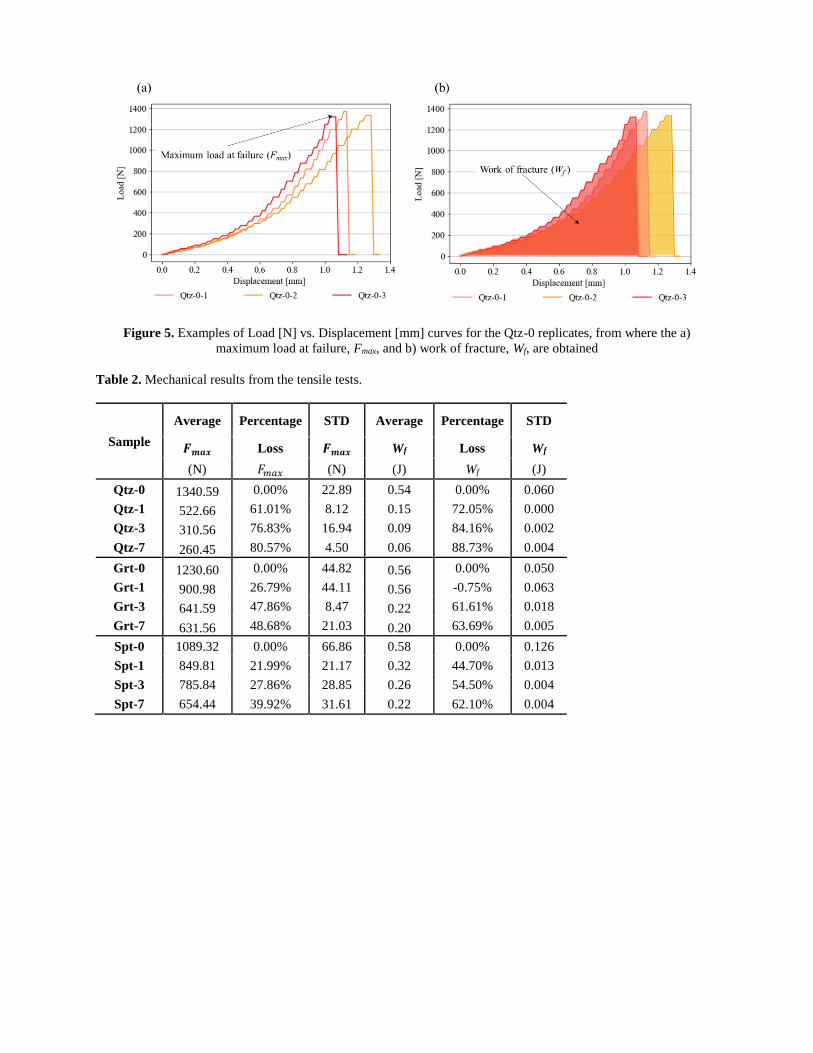
Since the test velocity was set to be 10 mm/min (0.166 mm/s), the Load [N] vs. Time [s]
information obtained from the mechanical test can be translated to Load [N] vs Displacement
[mm] curves, which are the ones used in this section. As observed in Figure 5, two main results
can be obtained from the Load [N] vs Displacement [mm] curve for each sample: i) the
maximum load at failure (𝐹𝑚𝑎𝑥[N]), and ii) the work of fracture (𝑊𝑓 [J]) that corresponds to the
area below the Load vs. Displacement curve.
For all lithologies, three replicates for every water conditioning period were tested. Average
results and standard deviation (STD) values for each lithology under each water conditioning
period (1, 3 and 7 days) are presented in Table 2. The ‘percentage loss’ data in this table refer to
the reduction in the maximum load at failure or work of fracture of any conditioned aggregate-
binder system with respect to the results of the controlled or dry systems. Trends from these
results can be seen on Figure 6.
Page 12
Figure 5. Examples of Load [N] vs. Displacement [mm] curves for the Qtz-0 replicates, from where the a)
maximum load at failure, Fmax, and b) work of fracture, Wf, are obtained
Table 2. Mechanical results from the tensile tests.
Sample
Average Percentage STD Average Percentage STD
𝑭𝒎𝒂𝒙 Loss 𝑭𝒎𝒂𝒙 Wf Loss Wf
(N) 𝐹𝑚𝑎𝑥 (N) (J) Wf (J)
Qtz-0 1340.59 0.00% 22.89 0.54 0.00% 0.060
Qtz-1 522.66 61.01% 8.12 0.15 72.05% 0.000
Qtz-3 310.56 76.83% 16.94 0.09 84.16% 0.002
Qtz-7 260.45 80.57% 4.50 0.06 88.73% 0.004
Grt-0 1230.60 0.00% 44.82 0.56 0.00% 0.050
Grt-1 900.98 26.79% 44.11 0.56 -0.75% 0.063
Grt-3 641.59 47.86% 8.47 0.22 61.61% 0.018
Grt-7 631.56 48.68% 21.03 0.20 63.69% 0.005
Spt-0 1089.32 0.00% 66.86 0.58 0.00% 0.126
Spt-1 849.81 21.99% 21.17 0.32 44.70% 0.013
Spt-3 785.84 27.86% 28.85 0.26 54.50% 0.004
Spt-7 654.44 39.92% 31.61 0.22 62.10% 0.004
Page 13
Figure 6. Evolution of the Fmax and Wf values with water conditioning time for a) and b) quartzite (Qtz); c) and d)
granodiorite (Grt); and e) and f) serpentinite (Spt), respectively.
Page 14
4.1.1. Mechanical performance of the quartzite
From Figure 6a and Figure 6b, it can be seen that there is an inverse relationship of the 𝐹𝑚𝑎𝑥 and
𝑊𝑓 values with water conditioning time. On average, there is a decrease of 80.6 and 88.7% in
these values, respectively, when comparing the dry samples to those that had been subjected to 7
days of water conditioning. Nevertheless, given that after just 1 day of water conditioning the
𝐹𝑚𝑎𝑥 and 𝑊𝑓 values had already decreased on average 61.0 and 72.1%, it can be concluded that
most of the water damaged over the AAS system occurred rapidly within the specimen.
4.1.2. Mechanical performance of the granodiorite
The evolution of the 𝐹𝑚𝑎𝑥 and the 𝑊𝑓 values as a function of the water conditioning time is
shown in Figure 6c and Figure 6d. The degradation of the mechanical performance of this
lithology is more gradual than the one observed for the Qtz samples. Most of the percentage loss
of 𝐹𝑚𝑎𝑥 and 𝑊𝑓 values occur after 3 days of moisture conditioning in which it reaches 47.9 and
61.7%, respectively. After 3 days of water conditioning, degradation occurs at a lower rate, yet
exhibiting an inverse trend with moisture conditioning time.
4.1.3. Mechanical performance of the serpentinite
Figure 6e and Figure 6f shows that the degradation of 𝐹𝑚𝑎𝑥 and 𝑊𝑓 in the Spt samples exhibit at
downwards trend with conditioning time that is more gradual than for the previous two
lithologies. From these graphs there seems to be two different regions: i) a steeper decline in the
mechanical parameters from the dry condition to the 1 day of water conditioning time, in which
the 𝐹𝑚𝑎𝑥 and 𝑊𝑓 had a decrease of 22 and 44.7% respectively, and ii) a more gradual decline
after 1 day of conditioning time (i.e. from 1 to 7 days of conditioning time the 𝐹𝑚𝑎𝑥 and 𝑊𝑓
values dropped an additional 17.9 and 17.4%, despite being submerged in water for 7 times as
much as the initial conditioning time period).
4.1.4. Comparison of results among rocks
To stablish the relative performance of these three lithologies, a comparative analysis of the
results previously presented is herein evaluated. As expected, the AAS systems with all
lithologies exhibit a degradation of the bonding quality with the increase of the water
conditioning time, as expected. Nevertheless, some lithologies do present better adhesive
qualities and less moisture susceptibility than others.
For instance, for the dry specimens, the 𝐹𝑚𝑎𝑥 values are highest for the Qtz specimens and lowest
for the Spt samples. Nevertheless, the opposite is seen for the 7 days conditioned samples, where
the Spt samples have the highest 𝐹𝑚𝑎𝑥 whereas the Qtz samples have the lowest values (the Grt
sample is in between these two lithologies). This suggests that the Qtz samples are highly
susceptible to moisture damage in terms of the mechanical properties of the asphalt-aggregate
interface, and that the Spt are more moisture resistant. The same could be said for the 𝑊𝑓 values,
but the variability of the data for the dry specimens does not allow to get to the same conclusion
Page 15
as clearly as with the 𝐹𝑚𝑎𝑥 values. Therefore, the mechanical performance of the asphalt-
aggregate bond is herein evaluated using the 𝐹𝑚𝑎𝑥 parameter rather than the 𝑊𝑓 values.
It is noteworthy that the interest of pavement engineers is that the performance of any mixture
varies as little as possible with time. Thus, although a minimum dry bonding quality must be
achieved in order to obtain acceptable levels of mechanical integrity, what matters the most is for
this bonding quality to be retained over time. Within this context, Figure 7 shows the relative
degradation of the 𝐹𝑚𝑎𝑥 values over time for the three lithologies evaluated. This figure shows
that after 7 days of water conditioning time, the Qtz, Grt and Spt samples had lost 80.6, 48.7 and
39.9% of the 𝐹𝑚𝑎𝑥 values, respectively. The rate in which each degradation curve change over
time gives a clear indication of the moisture susceptibility of each aggregate. From the
lithologies evaluated, it can be said that moisture susceptibility increases as the rock chemical
composition goes from mafic to felsic. Therefore, Qtz is the most moisture susceptible lithology
evaluated, whereas Spt is the least sensible to the action of water.
Figure 7. Change of the average Fmax values over conditioning time with respect to the average dry Fmax values for
each lithology.
Finally, it should be noted that the Qtz and Grt samples under dry conditions failed at a higher
load than the Spt samples (Figure 6), yet they did not fail in a completely cohesive fashion as the
Spt samples did. This might happened due to two reasons: i) there is a change in the cohesive
strength of the binder (i.e. if the cohesive strength of the binder film was the same in the Qtz and
Grt as in the Spt, then the former lithologies must have had a cohesive failure upon reaching the
lower failure load of the latter), and ii) the quality of the adhesive bonds were of higher quality
within the Qtz and Grt than in the Spt, which allowed for the adhesive bonds to sustain more of
the stress requirements and prevented the binder to reach its Rb prematurely. In any case, the
results suggest that the properties of the AAS system are indeed affected by asphalt-aggregate
interactions. Guo et al. (23) proved that the adsorbed asphalt in mineral fillers changes its rigidity
as a function of the filler type, and something similar might be happening within the adsorbed
asphalt of the used aggregates.
Page 16
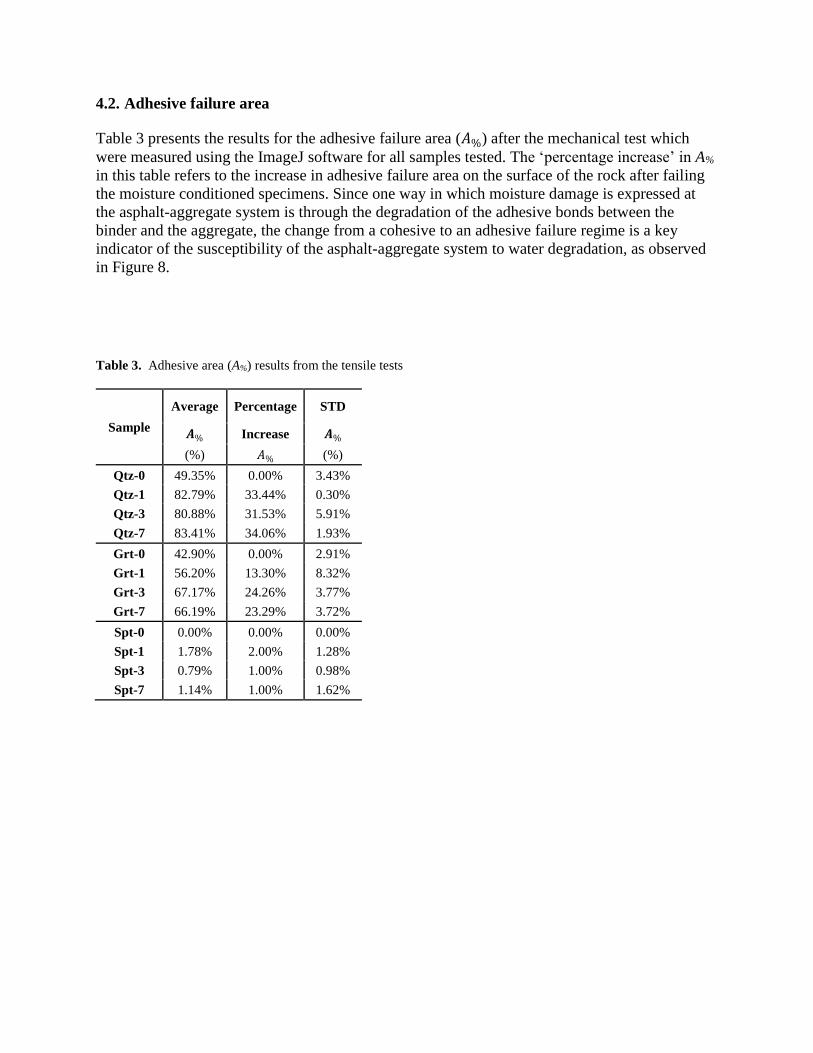
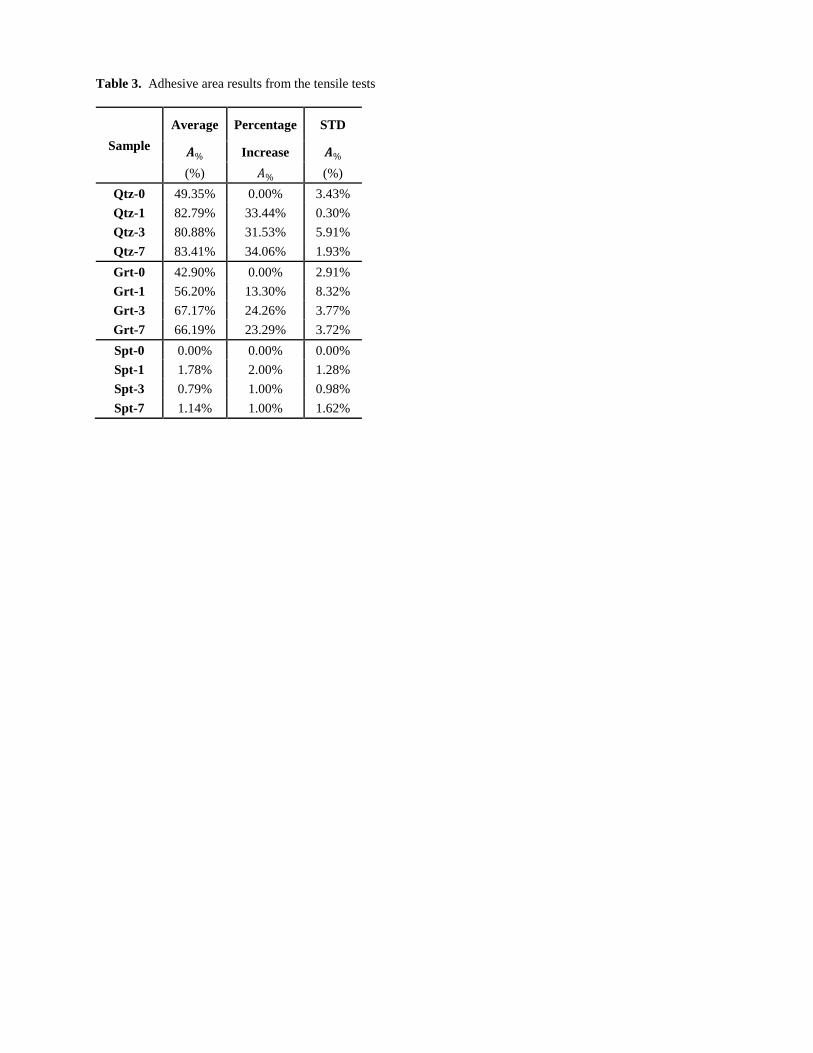
4.2. Adhesive failure area
Table 3 presents the results for the adhesive failure area (𝐴%) after the mechanical test which
were measured using the ImageJ software for all samples tested. The ‘percentage increase’ in A%
in this table refers to the increase in adhesive failure area on the surface of the rock after failing
the moisture conditioned specimens. Since one way in which moisture damage is expressed at
the asphalt-aggregate system is through the degradation of the adhesive bonds between the
binder and the aggregate, the change from a cohesive to an adhesive failure regime is a key
indicator of the susceptibility of the asphalt-aggregate system to water degradation, as observed
in Figure 8.
Table 3. Adhesive area (A%) results from the tensile tests
Sample
Average Percentage STD
𝑨% Increase 𝑨%
(%) 𝐴% (%)
Qtz-0 49.35% 0.00% 3.43%
Qtz-1 82.79% 33.44% 0.30%
Qtz-3 80.88% 31.53% 5.91%
Qtz-7 83.41% 34.06% 1.93%
Grt-0 42.90% 0.00% 2.91%
Grt-1 56.20% 13.30% 8.32%
Grt-3 67.17% 24.26% 3.77%
Grt-7 66.19% 23.29% 3.72%
Spt-0 0.00% 0.00% 0.00%
Spt-1 1.78% 2.00% 1.28%
Spt-3 0.79% 1.00% 0.98%
Spt-7 1.14% 1.00% 1.62%
Page 17
Figure 8. Typical failure surfaces for a) Qtz, b) Grt, and c) Spt samples at increasing water conditioning times (0, 1,
3 and 7 days, respectively). Note that there is a change from a more cohesive to a more adhesive failure regime in
the Qtz and Grt samples.
Figure 9 shows the evolution of the adhesive failure area with water conditioning time for all
lithologies, and Figure 10 shows the change of these values over time in comparison to the dry
𝐴% values. These data show that, under dry conditions, the Spt samples were the only ones that
presented a fully cohesive failure surface. Under all water conditioning periods, Qtz had an
adhesive failure area of over 80%, whereas these values were always less than 3% for the Spt
samples. Since the changes in adhesive failure were significant after just one day of water
conditioning for the Qtz sample, this lithology, which is extremely felsic, is highly susceptible to
moisture damage. The opposite is true for the extremely mafic lithology of Spt, in which the
changes in the adhesive failure area through the water conditioning time were small. On the other
hand, the felsic Grt samples presented an in-between behaviour from the Qtz and Spt samples,
which is mainly due to its heterogenous mineralogical nature (i.e. presence of felsic and mafic
minerals, as observed in Figure 1b).
Page 18
Figure 9. Evolution of the adhesive failure area with the water conditioning time for all three lithologies.
Figure 10. Change in the average A% values over conditioning time with respect to the average dry A% values for
each lithology.
The effect of such heterogeneity and its relationship to the 𝐴% values can be seen in Figure 11, in
which most of the retained asphalt over the rock surface is located on the black mafic amphibole
minerals, and is almost completely wiped off the white felsic quartz and plagioclase minerals.
This may explain why the 𝐴% variability of this lithology is higher in comparison to the other
lithologies, and serves to prove that the experimental setup proposed is sensitive enough to
consider the mineralogical and chemical effect of the aggregate over the quality of the asphalt-
aggregate interface.
Page 19
Figure 11. 35x zoom on a highly deteriorated part of a Grt sample after 3 days of water conditioning.
In terms of the Spt lithology, there is an interesting observation when analysing the Fmax and A%
results. From Figure 6e it can be seen that 𝐹𝑚𝑎𝑥 values decrease with conditioning time despite
that the 𝐴% values remain virtually 0 (i.e. full cohesive failure; Figure 10); unlike the Qtz and Grt
lithologies in which the reduction in 𝐹𝑚𝑎𝑥 values can be easily correlated with an increase in the
𝐴%, meaning that water deteriorated the asphalt-aggregate adhesive bonds within the AAS
systems. There are two main areas near the interface of the AAS system that are prone to failure
during the tensile testing performed: i) in-between the binder, and ii) at the asphalt-aggregate
interface. The mechanical strength of these zones corresponds to the asphalt cohesive resistance
and the asphalt-aggregate adhesive resistance, respectively. Since the AAS is a ‘series system’,
the contribution to the load resistance of these two zones depends on: i) material properties (i.e.
viscoelasticity), and ii) the quality of the adhesive and cohesive bonds. It is highly unlikely that
the cohesive properties of the binder changed drastically over the short water conditioning
periods considered. Therefore, it is hypothesized that the adhesive bonds degraded in the Spt
samples. If some of the adhesive bonds got deteriorated, the concentration of stresses within the
binder would increase promoting cohesive failure at lower values of Fmax. Notice that despite the
increase of stresses within the interface due to the quality loss of some adhesive bonds with
conditioning time, the adhesive resistance of this lithology was never superseded in any
conditioning period.
Finally, it should be noted that the Qtz and Grt samples under dry condition failed at a higher
load than the Spt samples, yet they did not fail in a completely cohesive fashion as the Spt
samples did. This might happened due a change in the cohesive strength of the binder due to a
chemical interaction with each lithology (i.e. if the cohesive strength of the binder film was the
same in the Qtz and Grt as in the Spt, then the former lithologies must have had a cohesive
failure upon reaching the lower failure load of the latter, which was not the case). This
hypothesis might be supported by the work by Guo et al. (23), who proved that the adsorbed
asphalt in mineral fillers changes its rigidity as a function of the filler type; thus, something
similar might be happening within the adsorbed asphalt of the used aggregates.
Page 20
4.3. Statistical analysis of the results
In order to statistically validate the obtained results, a one-way analysis of variance (ANOVA)
test was performed. This type of test was conducted to stablish if the observations of one data
group can be considered to be statistically different, considering the difference in the mean
values as well as the variability within the data, from the observations of another group (24). If
the probability value (p-value) of an ANOVA test is below 0.05, the null hypothesis can be
rejected with a 95% confidence. It is noteworthy that this 0.05 value is the general accepted
threshold for statistical significance in sciences.
Four different hypotheses were considered: that i) 𝐹𝑚𝑎𝑥 after 7 days of water conditioning, ii)
𝐹𝑚𝑎𝑥 in dry conditions, iii) 𝐴% after 7 days of water conditioning, and iv) the difference between
the 𝐹𝑚𝑎𝑥 values after 7 days of water conditioning and the average 𝐹𝑚𝑎𝑥 for dry condition, were
all lithology dependent. The null hypothesis for all these parameters was that they were not
lithology dependent. It is noteworthy that the latter hypothesis reduces the variability of the data
since an average value is being considered, which is not ideal for an ANOVA test. Nevertheless,
this serves as a first approximation to stablish if the change in the load response obtained through
the experimental set up, which is a proxy of moisture damage, is lithology dependent.
Results for the ANOVA tests over these four hypotheses are shown on Table 4. It can be
concluded that all the tested hypotheses are lithology dependent. This serves to further validate
the proposed experimental setup to evaluate moisture damage in asphalt-aggregate systems, as
well as the results about the influence of the lithologies on the moisture susceptibility the
systems.
Table 4 Results for the one-way ANOVA test done for different parameters
Parameter p-value Lithology dependent?
𝐹𝑚𝑎𝑥 (15 days) 0.00013 Yes
𝐹𝑚𝑎𝑥 (dry) 0.01134 Yes
𝐴% (15 days) 1.51E-7 Yes
[𝐹𝑚𝑎𝑥 (dry) -Average
(𝐹𝑚𝑎𝑥 (15 days))] 0.00002 Yes
4.4. Rock chemistry relationships
Previous results have shown that the lithologies impact the moisture susceptibility of the
systems. Nevertheless, the influence of the chemical composition of the aggregates (Table 1) on
the water susceptibility of these systems has not been evaluated. Stablishing which oxides do or
do not promote this phenomenon is key for objectively classifying aggregates based on their
expected performance to this degradation phenomenon.
Two different moisture damage proxies based on the relative changes of the maximum load at
failure (Fmax) and the adhesive area (A%) were arbitrarily selected for this evaluation: i) the area
beneath each curve shown in Figure 7 (Equation 1), which gives an indication of the extent and
rate of deterioration of the mechanical performance of asphalt-aggregate interface, and ii) the
Page 21
area beneath each curve shown in Figure 10 (Equation 2), which gives an indication of the extent
and rate of deterioration of the adhesive bonds due to the action of water.
These parameters are higher if the lithology is more susceptible to moisture damage, as the loss
of 𝐹𝑚𝑎𝑥 and the change in 𝐴% increase with the extent of this deterioration. As previously stated,
these parameters do not only consider the extent of moisture damage, but also the rate at which it
increases. For instance, the area beneath the curve of a lithology that loses 90% of its 𝐹𝑚𝑎𝑥 or has
a 90% change in its 𝐴% after just 1 day would be higher than if it gradually reached that same
extent of degradation after 7 days of conditioning time.
𝑀𝑜𝑖𝑠𝑡𝑢𝑟𝑒 𝑑𝑎𝑚𝑎𝑔𝑒 𝑚𝑒𝑐ℎ𝑎𝑛𝑖𝑐𝑎𝑙 𝑝𝑟𝑜𝑥𝑦 = ∫ 𝑅𝑒𝑙𝑎𝑡𝑖𝑣𝑒 𝑙𝑜𝑠𝑠 𝑜𝑓 𝐹𝑚𝑎𝑥 𝑐𝑢𝑟𝑣𝑒7 𝑑𝑎𝑦𝑠
0 𝑑𝑎𝑦𝑠
(1)
𝑀𝑜𝑖𝑠𝑡𝑢𝑟𝑒 𝑑𝑎𝑚𝑎𝑔𝑒 𝑎𝑑ℎ𝑒𝑠𝑖𝑣𝑒 𝑓𝑎𝑖𝑙𝑢𝑟𝑒 𝑝𝑟𝑜𝑥𝑦 = ∫ 𝐶ℎ𝑎𝑛𝑔𝑒 𝑜𝑓 𝐴% 𝑐𝑢𝑟𝑣𝑒 7 𝑑𝑎𝑦𝑠
0 𝑑𝑎𝑦𝑠
(2)
These two proxies were calculated for the three lithologies and the Pearson correlation
coefficient (Equation 3), which represents how linearly correlated are certain data (i.e. 1: perfect
positive correlation, -1: perfect negative correlation and 0: uncorrelated), was calculated to see if
the proposed proxies presents any linear positive or negative correlation with any of the
compositional oxides of rocks listed in Table 1.
𝑃𝑒𝑎𝑟𝑠𝑜𝑛 𝑐𝑜𝑟𝑟𝑒𝑙𝑎𝑡𝑖𝑜𝑛 𝑐𝑜𝑒𝑓𝑓𝑖𝑐𝑖𝑒𝑛𝑡 = 𝑐𝑜𝑣(𝑥, 𝑦)
𝜎𝑥𝜎𝑦,
(3)
where 𝑐𝑜𝑣(𝑥, 𝑦) is the covariance between data (i.e. with x being one of the proxies and y being
a specific oxide in Table 1), and x and y are the standard deviation of x and y data respectively.
In other words, the Pearson correlation coefficient permits to evaluate the relationship between
the moisture damage proxies and each compositional oxide of all the lithologies. Thus, for
example, the Pearson correlation coefficient between the moisture damage indexes and a specific
oxide, like CaO, results from computing the three values of the moisture damage proxies (i.e.
one per lithology) and the three compositional values of that specific oxide for each lithology
(i.e. CaO values of 0.06, 3.77 and 0.03% for this example, according to Table 1). Therefore,
there is a value of the Pearson coefficient for every oxide, which allows to identify if there is a
liner trend of the proposed moisture damage proxies and the content of each oxide.
The results for the Pearson correlation coefficient, summarized in Figure 12, show that both
indexes have a strong positive linear correlation with SiO2 and a strong negative correlation with
Al2O3, Fe2O3, MnO, MgO, SO3, Cr2O3 and NiO. This means that the presence of SiO2 in an
aggregate promotes moisture damage while the presence of Al2O3, Fe2O3, MnO, MgO, SO3,
Cr2O3 and NiO in an aggregate helps preventing this phenomenon. It is interesting to point out
that all oxides typical from of mafic rock compositions (i.e. Al2O3, Fe2O3, MnO, MgO) have a
negative correlation with the two proposed proxies, thus, implying that high contents of these
Page 22
oxides inhibit moisture damage. Moreover, since SO3, Cr2O3 and NiO oxides are typically found
only in small amounts in most rocks, the moisture resistance effect can be attributed mainly to
the mafic oxides (i.e. Al2O3, Fe2O3, MnO, MgO). On the other hand, the only oxide that
correlates positively with the proxies (i.e. promotes moisture damage) is the SiO2, which is
common of felsic rock compositions, like the quartzite sample herein evaluated. Other common
felsic oxides such as CaO and Na2O do not correlate with the proposed proxies. Overall, this
serves to conclude that the moisture damage phenomenon should not be only associated to the
SiO2, as the whole rock chemistry plays an important role in determining this phenomenon.
Figure 12. Pearson correlation coefficient for the a) mechanical, and b) adhesive bond moisture damage proxies
with the oxides weight total for all three lithologies.
The fact that the mechanical and adhesive bond indexes had virtually the same results for the
Pearson coefficient implies that there is an intrinsic correlation between them. Therefore, a loss
in the mechanical properties of the asphalt-aggregate bond is usually related to a degradation of
the adhesive bonds between the asphalt-aggregate interface, as expected.
Finally, it should be noticed that the oxides correlations with the indexes shown in Figure 12 are
thought to be true for any lithology that falls between the compositional spectrum of the three
rocks herein evaluated. Since Qtz is an extremely felsic rock, and Spt is an extremely mafic rock,
these results must hold also true for a wide range of different rocks (i.e. any rock with a high
Page 23
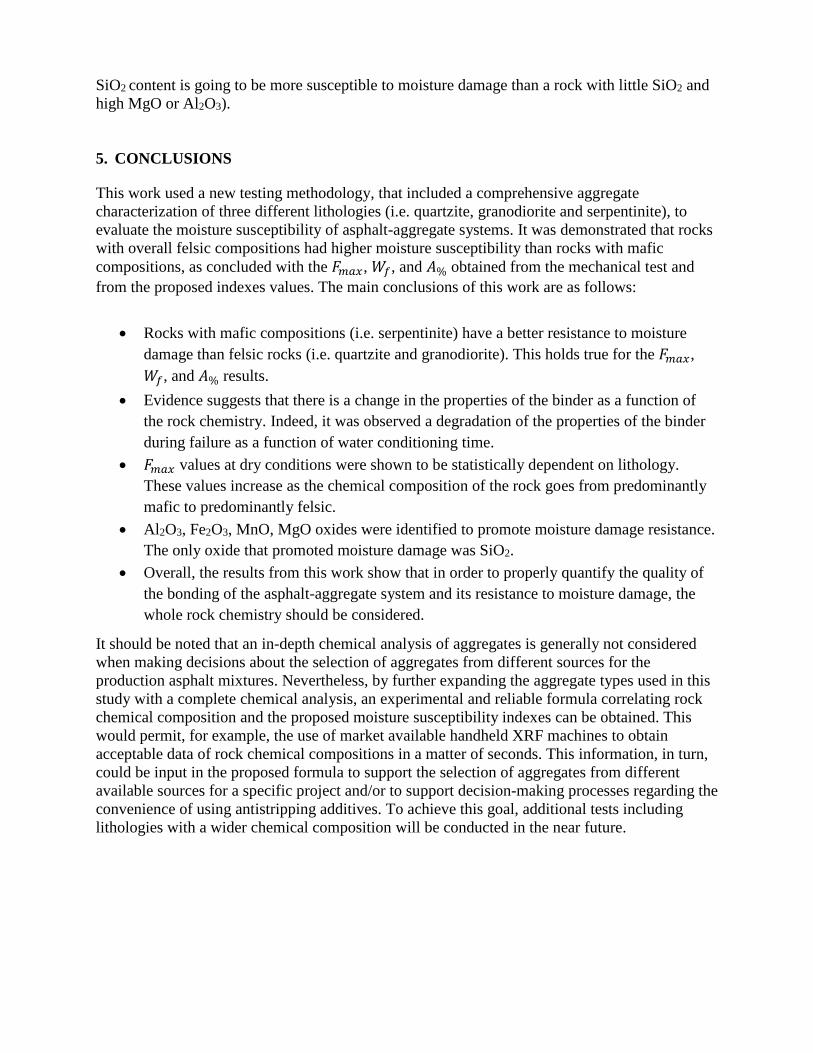
SiO2 content is going to be more susceptible to moisture damage than a rock with little SiO2 and
high MgO or Al2O3).
5. CONCLUSIONS
This work used a new testing methodology, that included a comprehensive aggregate
characterization of three different lithologies (i.e. quartzite, granodiorite and serpentinite), to
evaluate the moisture susceptibility of asphalt-aggregate systems. It was demonstrated that rocks
with overall felsic compositions had higher moisture susceptibility than rocks with mafic
compositions, as concluded with the 𝐹𝑚𝑎𝑥, 𝑊𝑓, and 𝐴% obtained from the mechanical test and
from the proposed indexes values. The main conclusions of this work are as follows:
• Rocks with mafic compositions (i.e. serpentinite) have a better resistance to moisture
damage than felsic rocks (i.e. quartzite and granodiorite). This holds true for the 𝐹𝑚𝑎𝑥,
𝑊𝑓, and 𝐴% results.
• Evidence suggests that there is a change in the properties of the binder as a function of
the rock chemistry. Indeed, it was observed a degradation of the properties of the binder
during failure as a function of water conditioning time.
• 𝐹𝑚𝑎𝑥 values at dry conditions were shown to be statistically dependent on lithology.
These values increase as the chemical composition of the rock goes from predominantly
mafic to predominantly felsic.
• Al2O3, Fe2O3, MnO, MgO oxides were identified to promote moisture damage resistance.
The only oxide that promoted moisture damage was SiO2.
• Overall, the results from this work show that in order to properly quantify the quality of
the bonding of the asphalt-aggregate system and its resistance to moisture damage, the
whole rock chemistry should be considered.
It should be noted that an in-depth chemical analysis of aggregates is generally not considered
when making decisions about the selection of aggregates from different sources for the
production asphalt mixtures. Nevertheless, by further expanding the aggregate types used in this
study with a complete chemical analysis, an experimental and reliable formula correlating rock
chemical composition and the proposed moisture susceptibility indexes can be obtained. This
would permit, for example, the use of market available handheld XRF machines to obtain
acceptable data of rock chemical compositions in a matter of seconds. This information, in turn,
could be input in the proposed formula to support the selection of aggregates from different
available sources for a specific project and/or to support decision-making processes regarding the
convenience of using antistripping additives. To achieve this goal, additional tests including
lithologies with a wider chemical composition will be conducted in the near future.
Page 24
ACKNOWLEDGEMENTS
This work was made possible due to the Inter-school (Civil engineering – Geosciences) research
grant provided by the Office of the Vice-presidency of Research of Universidad de los Andes.
REFERENCES
1. Kiggundu, B. M., and F. L. Roberts. Stripping in HMA Mixtures: State-of-the-Art and
Critical Review of Test Methods. National Center for Asphalt Technology Auburn, AL,
USA, 1988.
2. Bagampadde, U., U. Isacsson, and B. M. Kiggundu. Influence of Aggregate Chemical and
Mineralogical Composition on Stripping in Bituminous Mixtures. International Journal of
Pavement Engineering, Vol. 6, No. 4, 2005, pp. 229–239.
https://doi.org/10.1080/10298430500440796.
3. Bagampadde, U., U. Isacsson, and B. M. Kiggundu. Impact of Bitumen and Aggregate
Composition on Stripping in Bituminous Mixtures. Materials and Structures, Vol. 39, No.
3, 2006, pp. 303–315. https://doi.org/10.1007/s11527-005-9040-5.
4. D’angelo, J., and R. M. Anderson. Material Production, Mix Design, and Pavement Design
Effects on Moisture Damage. Presented at: Moisture Sensitivity of Asphalt Pavements: A
National Seminar, San Diego, CA, Transportation Research Board, 2003.
5. Curtis, C. W., K. Ensley, and J. Epps. Fundamental Properties of Asphalt-Aggregate
Interactions Including Adhesion and Absorption. SHRP-A-341. Strategic Highway
Research Program, National Research Council, Washington, DC: 1993.
6. Behiry, A. E. A. E.-M. Laboratory Evaluation of Resistance to Moisture Damage in Asphalt
Mixtures. Ain Shams Engineering Journal, Vol. 4, No. 3, 2013, pp. 351–363.
https://doi.org/10.1016/j.asej.2012.10.009.
7. Curtis, C. W. Investigation of Asphalt-Aggregate Interactions in Asphalt Pavements.
American Chemical Society, Fuel, Vol. 37, 1992, pp. 1292–1297.
8. Caro, S., E. Masad, A. Bhasin, and D. N. Little. Moisture Susceptibility of Asphalt
Mixtures, Part 1: Mechanisms. International Journal of Pavement Engineering, Vol. 9, No.
2, 2008, pp. 81–98. https://doi.org/10.1080/10298430701792128.
9. Canestrari, F., F. Cardone, A. Graziani, F. A. Santagata, and H. U. Bahia. Adhesive and
Cohesive Properties of Asphalt-Aggregate Systems Subjected to Moisture Damage. Road
Materials and Pavement Design, Vol. 11, No. sup1, 2010, pp. 11–32.
https://doi.org/10.1080/14680629.2010.9690325.
10. Aguiar-Moya, J. P., L. G. Loría-Salazar, J. Salazar-Delgado, J. P. Corrales-Azofeifa, and E.
Y. Hajj. Evaluation of Adhesion Properties of Costa Rican Asphalt Mixtures Using the
Bitumen Bond Strength (BBS) and Contact Angle Measurement Tests. Presented at 92nd
Annual Meeting of the Transportation Research Board, Washington, D.C., 2013..
11. Alavi, M., E. Hajj, A. Hanz, and H. Bahia. Evaluating Adhesion Properties and Moisture
Damage Susceptibility of Warm-Mix Asphalts: Bitumen Bond Strength and Dynamic
Modulus Ratio Tests. Transportation Research Record: Journal of the Transportation
Research Board, No. 2295, 2012, pp. 44–53.
12. Aguiar-Moya, J. P., J. Salazar-Delgado, A. Baldi-Sevilla, F. Leiva-Villacorta, and L. Loria-
Salazar. Effect of Aging on Adhesion Properties of Asphalt Mixtures with the Use of
Page 25
Bitumen Bond Strength and Surface Energy Measurement Tests. Transportation Research
Record: Journal of the Transportation Research Board, No. 2505, 2015, pp. 57–65.
13. Moraes, R., R. Velasquez, and H. Bahia. Measuring the Effect of Moisture on Asphalt-
Aggregate Bond with the Bitumen Bond Strength Test. Transportation Research Record:
Journal of the Transportation Research Board, Vol. 2209, 2011, pp. 70–81.
https://doi.org/10.3141/2209-09.
14. Cho, D.-W., and H. U. Bahia. New Parameter to Evaluate Moisture Damage of Asphalt-
Aggregate Bond in Using Dynamic Shear Rheometer. Journal of Materials in Civil
Engineering, Vol. 22, No. 3, 2010, pp. 267–276.
15. Zhang, J., A. K. Apeagyei, G. D. Airey, and J. R. Grenfell. Influence of Aggregate
Mineralogical Composition on Water Resistance of Aggregate–Bitumen Adhesion.
International Journal of Adhesion and Adhesives, Vol. 62, 2015, pp. 45–54.
16. Howson, J. E. Relationship between Surface Free Energy and Total Work of Fracture of
Asphalt Binder and Asphalt Binder-Aggregate Interfaces. Ph.D. Thesis, Texas A&M
University, 2011.
17. Airey, G. D., A. C. Collop, S. E. Zoorob, and R. C. Elliott. The Influence of Aggregate,
Filler and Bitumen on Asphalt Mixture Moisture Damage. Construction and Building
Materials, Vol. 22, No. 9, 2008, pp. 2015–2024.
https://doi.org/10.1016/j.conbuildmat.2007.07.009.
18. Kakar, M. R., M. O. Hamzah, and J. Valentin. A Review on Moisture Damages of Hot and
Warm Mix Asphalt and Related Investigations. Journal of Cleaner Production, Vol. 99,
2015, pp. 39–58.
19. Grenfell, J. R., N. Ahmad, Y. Liu, A. K. Apeagyei, G. D. Airey, and D. Large. Application
of Surface Free Energy Techniques to Evaluate Bitumen-Aggregate Bonding Strength and
Bituminous Mixture Moisture Sensitivity. Proceedings of the Institution of Civil Engineers-
Construction Materials, Vol. 167, No. 4, 2013, pp. 214–226.
20. Bucher, K., and M. Frey. Petrogenesis of Metamorphic Rocks. Springer Science & Business
Media, Berlin Heidelberg, New York, 2002.
21. Frost, B. R., C. G. Barnes, W. J. Collins, R. J. Arculus, D. J. Ellis, and C. D. Frost. A
Geochemical Classification for Granitic Rocks. Journal of petrology, Vol. 42, No. 11,
2001, pp. 2033–2048.
22. Abràmoff, M. D., P. J. Magalhães, and S. J. Ram. Image Processing with ImageJ.
Biophotonics international, Vol. 11, No. 7, 2004, pp. 36–42.
23. Guo, M., A. Bhasin, and Y. Tan. Effect of Mineral Fillers Adsorption on Rheological and
Chemical Properties of Asphalt Binder. Construction and Building Materials, Vol. 141,
2017, pp. 152–159.
24. Sokal, R. R., and F. J. Rohlf. The Principles and Practice of Statistics in Biological
Research. WH Freeman and company, San Francisco, 1969.
Page 26
List of Figures
Figure 1. Aggregates used in this work: a) quartzite, b) granodiorite and c) serpentinite.
The diameter of the images is 25 mm
Figure 2. Modified micrometer for AAS sample preparationx
Figure 3. a) AAS system, all dimensions shown are in mm; and b) water conditioning setup of the AAS system.
Figure 4. Experimental testing procedure setup
Figure 5. Examples of Load [N] vs. Displacement [mm] curves for the Qtz-0 replicates, from where the a)
maximum load at failure, Fmax, and b) work of fracture, Wf, are obtained
Figure 6. Evolution of the Fmax and Wf values with water conditioning time for a) and b) quartzite (Qtz); c) and d)
granodiorite (Grt); and e) and f) serpentinite (Spt), respectively.
Figure 7. Evolution of the maximum load at failure for the 3 lithologies with the water conditioning period; and
b) Evolution of the failure energy for all three lithologies with the water conditioning period.
Figure 8. Change of the average Fmax values over conditioning time with respect to the average dry Fmax values for
each lithology.
Figure 9. Typical failure surfaces for a) Qtz, b) Grt, and c) spt samples at increasing water conditioning times (0,
1, 3 and 7 days, respectively). Note that there is a change from a more cohesive to a more adhesive
failure regime in the Qtz and Grt samples.
Figure 10. Evolution of the adhesive failure area with the water conditioning time for all three lithologies.
Figure 11. Change in the average A% values over conditioning time with respect to the average dry A% values for
each lithology.
Figure 12. 35x zoom on a highly deteriorated part of a Grt sample after 3 days of water conditioning.
Figure 13. Zoom over a representation of the AAS system in which the asphalt cohesive resistance and asphalt-
aggregate adhesive resistance is shown schematically. Figure 14. Pearson correlation coefficient for the a) mechanical, and b) adhesive bond moisture damage proxies
with the oxides weight total for all three lithologies.
Page 27
List of Tables
Table 1. Chemical composition expressed as weight total percentage of different oxides
Table 2. Mechanical results from the tensile tests.
Table 3. Adhesive area results from the tensile tests
Table 4. Results for the one-way ANOVA test done for different parameters
Page 28
Table 1. Chemical composition expressed as weight total percentage of different oxides
Rock SiO2 Al2O3 Fe2O3 MnO MgO CaO Na2O K2O TiO2 P2O5 SO3 Cr2O3 NiO LOI
(%) (%) (%) (%) (%) (%) (%) (%) (%) (%) (%) (%) (%) (%)
Qtz 98.18 1.09 0.09 0.00 0.01 0.06 0.00 0.03 0.07 0.01 0.00 0.00 0.00 0.65
Grt 65.75 15.26 4.09 0.08 2.45 3.77 3.60 2.68 0.53 0.14 0.01 0.01 0.00 1.38
Spt 28.49 23.08 7.37 0.48 28.15 0.03 0.03 0.00 0.05 0.01 0.02 0.39 0.07 12.10
Note: SiO2 = silicon dioxide, Al2O3 = aluminium oxide; Fe2O3 = iron oxide; MnO = manganese (II) oxide; MgO
= magnesium oxide; CaO = calcium oxide; Na2O = sodium oxide; K2O = potassium oxide; TiO2 = titanium oxide;
P2O5 = phosphorus pentoxide; SO3 = sulphur trioxide; Cr2O3 = chromium (III) oxide; NiO = nickel (II) oxide; LOI
= loss of ignition, which represents the amount of volatiles such as water lost after igniting the samples.
Page 29
Table 2. Mechanical results from the tensile tests.
Sample
Average Percentage STD Average Percentage STD
𝑭𝒎𝒂𝒙 Loss 𝑭𝒎𝒂𝒙 Wf Loss Wf
(N) 𝐹𝑚𝑎𝑥 (N) (J) Wf (J)
Qtz-0 1340.59 0.00% 22.89 0.54 0.00% 0.060
Qtz-1 522.66 61.01% 8.12 0.15 72.05% 0.000
Qtz-3 310.56 76.83% 16.94 0.09 84.16% 0.002
Qtz-7 260.45 80.57% 4.50 0.06 88.73% 0.004
Grt-0 1230.60 0.00% 44.82 0.56 0.00% 0.050
Grt-1 900.98 26.79% 44.11 0.56 -0.75% 0.063
Grt-3 641.59 47.86% 8.47 0.22 61.61% 0.018
Grt-7 631.56 48.68% 21.03 0.20 63.69% 0.005
Spt-0 1089.32 0.00% 66.86 0.58 0.00% 0.126
Spt-1 849.81 21.99% 21.17 0.32 44.70% 0.013
Spt-3 785.84 27.86% 28.85 0.26 54.50% 0.004
Spt-7 654.44 39.92% 31.61 0.22 62.10% 0.004
Page 30
Table 3. Adhesive area results from the tensile tests
Sample
Average Percentage STD
𝑨% Increase 𝑨%
(%) 𝐴% (%)
Qtz-0 49.35% 0.00% 3.43%
Qtz-1 82.79% 33.44% 0.30%
Qtz-3 80.88% 31.53% 5.91%
Qtz-7 83.41% 34.06% 1.93%
Grt-0 42.90% 0.00% 2.91%
Grt-1 56.20% 13.30% 8.32%
Grt-3 67.17% 24.26% 3.77%
Grt-7 66.19% 23.29% 3.72%
Spt-0 0.00% 0.00% 0.00%
Spt-1 1.78% 2.00% 1.28%
Spt-3 0.79% 1.00% 0.98%
Spt-7 1.14% 1.00% 1.62%
Page 31
Table 4. Results for the one-way ANOVA test done for different parameters
Parameter p-value Lithology dependent?
𝐹𝑚𝑎𝑥 (15 days) 0.00013 Yes
𝐹𝑚𝑎𝑥 (dry) 0.01134 Yes
𝐴% (15 days) 1.51E-7 Yes
[𝐹𝑚𝑎𝑥 (dry) -Average
(𝐹𝑚𝑎𝑥 (15 days))] 0.00002 Yes