HAL Id: tel-01795003 https://tel.archives-ouvertes.fr/tel-01795003 Submitted on 18 May 2018 HAL is a multi-disciplinary open access archive for the deposit and dissemination of sci- entific research documents, whether they are pub- lished or not. The documents may come from teaching and research institutions in France or abroad, or from public or private research centers. L’archive ouverte pluridisciplinaire HAL, est destinée au dépôt et à la diffusion de documents scientifiques de niveau recherche, publiés ou non, émanant des établissements d’enseignement et de recherche français ou étrangers, des laboratoires publics ou privés. Influence of the chemical modification of the interface on the dispersion of lignocellulosic reinforcements in Green Wood Plastic Composites GWPC : numerical model contribution on the optimization of the mechanical properties Erica Rodi To cite this version: Erica Rodi. Influence of the chemical modification of the interface on the dispersion of lignocellulosic reinforcements in Green Wood Plastic Composites GWPC : numerical model contribution on the optimization of the mechanical properties. Material chemistry. Université Paris-Est, 2017. English. NNT : 2017PESC1100. tel-01795003
Transcript
HAL Id: tel-01795003https://tel.archives-ouvertes.fr/tel-01795003
Submitted on 18 May 2018
HAL is a multi-disciplinary open accessarchive for the deposit and dissemination of sci-entific research documents, whether they are pub-lished or not. The documents may come fromteaching and research institutions in France orabroad, or from public or private research centers.
L’archive ouverte pluridisciplinaire HAL, estdestinée au dépôt et à la diffusion de documentsscientifiques de niveau recherche, publiés ou non,émanant des établissements d’enseignement et derecherche français ou étrangers, des laboratoirespublics ou privés.
Influence of the chemical modification of the interface onthe dispersion of lignocellulosic reinforcements in Green
Wood Plastic Composites GWPC : numerical modelcontribution on the optimization of the mechanical
propertiesErica Rodi
To cite this version:Erica Rodi. Influence of the chemical modification of the interface on the dispersion of lignocellulosicreinforcements in Green Wood Plastic Composites GWPC : numerical model contribution on theoptimization of the mechanical properties. Material chemistry. Université Paris-Est, 2017. English.�NNT : 2017PESC1100�. �tel-01795003�
Acknowledgments "Gratitude is not only the greatest of virtues, but the mother of all the others"; this is what
Cicero said in I century B.C. Now, by saying “thank you” I want to express my gratitude to all those
persons who have contributed to this work and I want to return the affection received during these long three years.
First of all, I would like to thank the directors of the two laboratories, the professor Michel Latroche of the ICMPE and the professor Salah Naili of the MSME for having hosting me in their institutes and allowing me to work in the best conditions, as well as the LABEX MMCD for funding this work and the “École doctorale ED-SIE” for all the proposed courses that have enriched me. I would like to thank also the members of the jury, Professors Richaud and Gigliotti who have done me the honor of evaluating my thesis, giving precise advises and useful suggestions about the work. A great thanks goes also to Professor Ramtani for his kindness and availability to accept the role of examiner in the committee.
I would like to express all my gratitude to my supervisor Valérie Langlois. She was constantly engaged with energy in this project, conducting this work with optimism and allowing me to always see the positive side of doing research. I would like to thank my co-supervisor, Estelle Renard for her generosity and also for her extraordinary good mood. Thanks also to my other co-supervisor Vittorio Sansalone for his prompt intervention in solving all problems presented during this work and for the discussions in our mother tongue that have often reassured me. I would like to express my endless gratitude to my other supervisor, Thibault Lemaire, excellent teacher and source of inspiration. Thank you, Thibault, for accepting my strange professional profile in your research team, thank you for guiding me in this path with the irony and sympathy that I needed and finally thank you for believing in me.
I would like to thank Luca Andena and Francesco Briatico for hosting me in the department “Giulio Natta” at the Polytechnic of Milan, directing my work carefully and integrating me into a solid and intellectually stimulating research group. A great thanks goes also to Professor Andrea Pavan for his valuable tips. I will always remember “my Milanese period” with a great smile!
I would like to thank all the members of the administrative team and in particular Isabelle of the MSME, whose “joie de vivre” has been for me as a drug delivered every morning and Marcelle of the ICMPE whose affection makes me feel at home. A great "thank you" goes to all the technicians and lecturers of the three laboratories who have contributed to this work from the beginning. I would like to express my gratitude also to all the professors of the three laboratories for their unconditional help and to all the interns who have worked by my side and who have contributed in a decisive way for the result of this work.
A great thanks goes to my colleagues all, companions of adventure, some of them became friends during this long journey. I will never forget the endless hours spent with my dear friend Etienne in front of the extruder or the memorable evenings with Antoine B., Sarra, Etienne, Romain P., Azad, little Alina and Pierre. I will never forget the extraordinary days with Ilaria, Romain V. and Antoine T. and our aperitifs in the afternoon to have the necessary “energy” to work or the good
times spent with Carine and Tina in our office and lastly the Milanese colleagues, true gentlemen. I
IV
will always carry you into my heart. I would like to thank also my Italian friends who never abandoned me during this long journey. Thanks to my best friend Maria and also to Riccardo whose eclecticism has always dissolved my negative thoughts. Thanks also to Maria Teresa for her constant energy and Anastasia and her mother who have always been ready to welcome me with a smile, a hug and a packet of candied almonds to make my Parisian stay less bitter.
Surely the greatest thanks goes to my family all. To Marco and Zenia, who have constantly helped and encouraged me since I was a child. To my aunt Pina and my uncle Giovanni who have always supported me. To my grandparents who have seen the beginning of this journey but not unfortunately the end. Finally, thanks to my father and my mother for their infinite sacrifices and to have taught me honesty, persistence, goodness and sincerity, fundamental talents to accomplish this work.
V
To Maria Foresi,
whose doubtful mind and pure soul,
have inspired my best thoughts and
consolidated my deepest certainties.
VI
Table of contents
VII
Table of contents
Pag.
List of figures and schemes ................................................................................................... XV
List of tables .......................................................................................................................... XIX
General Introduction ................................................................................................................. 1
Chapter I
Green Wood Plastic Composites
I-1. An overview on composites materials .............................................................................. 6
I-2. The reinforcing fibers ..................................................................................................... 10
Conclusion and perspectives ................................................................................................. 229
XIV
List of figures and schemes
XV
List of figures and schemes General Introduction Figure I-0. Performance, competitiveness, sustainability balance and applications of biocomposites .. 3
Chapter I
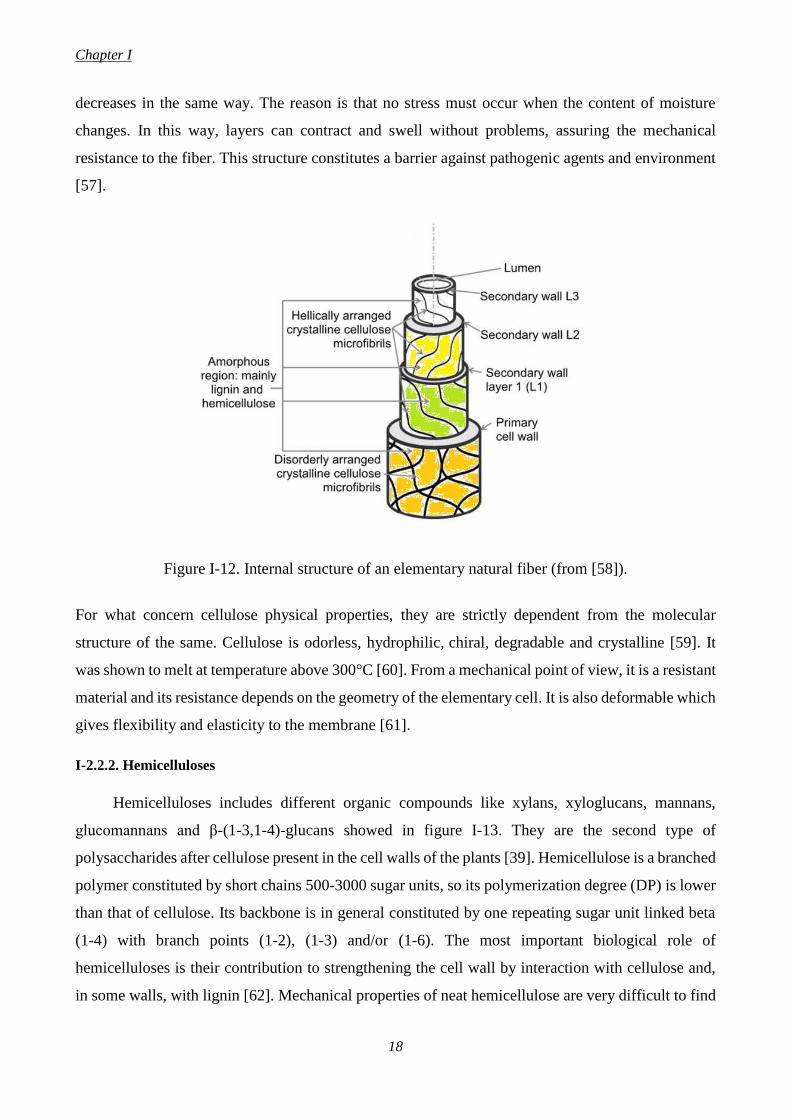
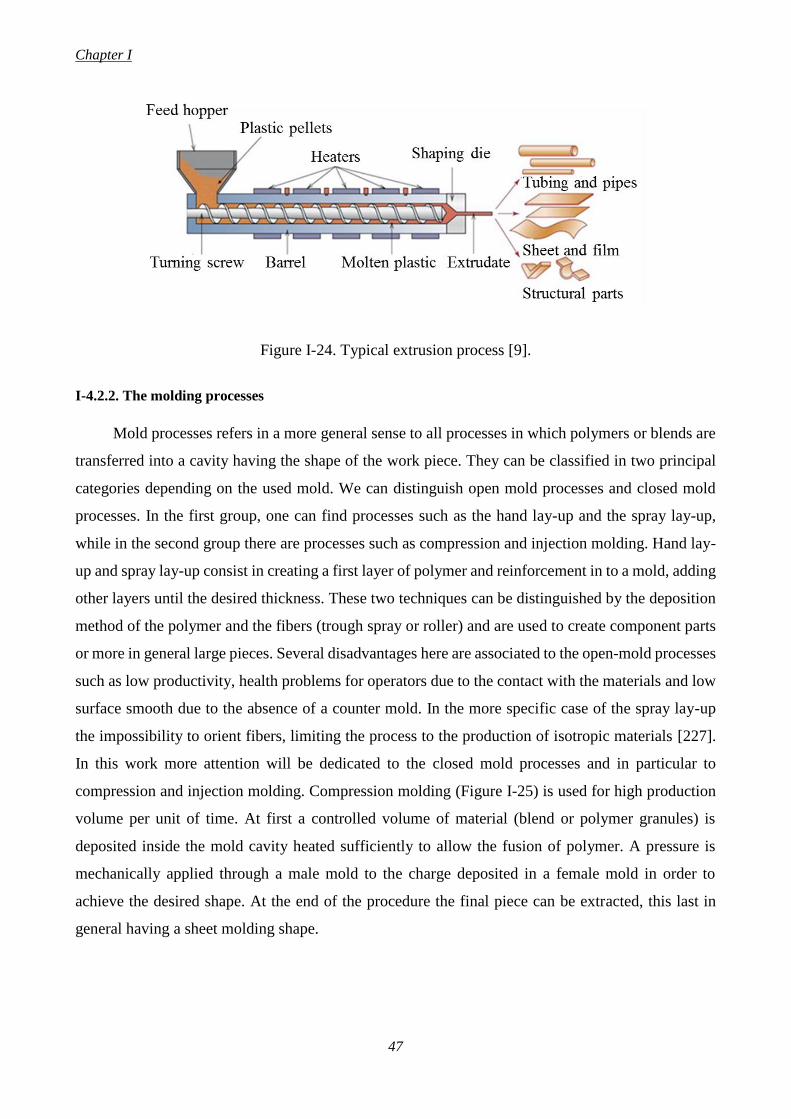
Figure I-1. Principle of combined actions for the mechanical resistance of a composite material constituted by a fiber reinforced polymeric matrix ................................................................................. 7 Figure I-2. Example of reinforcement in the matrix. From left to right: particulate random, discontinuous fibers (unidirectional), discontinuous fibers (randomly arranged), continuous fibers (unidirectional) and continuous fibers (bidirectional) ............................................................................. 7 Figure I-3. Common polymers classification ......................................................................................... 8 Figure I-4. Crystalline and amorphous regions in a semicrystalline polymer ........................................ 9 Figure I-5. Log E vs T curves for amorphous, semicrystalline and semicrystalline thermoplastic reinforced with fibers .......................................................................................................................... 10 Figure I-6. Tensile Modulus (E) vs Density (ρ) of different fibers and composites ............................ 11 Figure I-7. Tensile Modulus (E) vs Cost (Cm)/Volume of different fibers and composites ................. 12 Figure I-8. Fibers used in France in materials field.............................................................................. 15 Figure I-9. Chemical structure of cellulose .......................................................................................... 16 Figure I-10. Formation of cellulose allomorphs ................................................................................... 16 Figure I-11. Arrangement of fibrils, microfibrils and cellulose in cell wall ........................................ 17 Figure I-12. Internal structure of an elementary natural fiber ............................................................. 18 Figure I-13. Principal hemicellulose constituents ................................................................................ 19 Figure I-14. Three standard monomers of lignin ................................................................................. 20 Figure I-15. Structural motif of softwood lignin .................................................................................. 20 Figure I-16. Miscanthus: from plant to common applications ............................................................. 23 Figure I-17. Global biodegradable polymer market, 2014-2020 .......................................................... 25 Figure I-18. Molecular structure of PLA, PCL and PHBHV polymers ............................................... 26 Figure I-19. Stereoforms of lactides ..................................................................................................... 29 Figure I-20. General formula of (PHA)s .............................................................................................. 31 Figure I-21. Principal temperature ranges for PLA, PCL and PHBHV polymers ............................... 33 Figure I-22. Cleavage of the polymeric chain during the degradation of PCL .................................... 40 Figure I-23. Physical and chemical treatment of cellulose ................................................................... 43 Figure I-24. Typical extrusion process ................................................................................................. 47 Figure I-25. Compression molding process ......................................................................................... 48 Figure I-26. Injection molding process ................................................................................................ 48 Figure I-27. Multiscale methods for different length scale levels ........................................................ 55 Figure I-28. Principal scales in micromechanics approach .................................................................. 57 Figure I-29. Scheme of a composite with fiber aligned in the stress direction .................................... 61 Figure I-30. Micro-CT reconstruction of a polymer/fibers composite and determination of a realistic RVE volume .......................................................................................................................................... 63 Scheme I-1. Synthesis methods for high molecular weight PLA: condensation/coupling, azeotropic dehydrative condensation and ring-opening polymerization of lactide ................................................. 28 Scheme I-2. Initiation step for coordination-insertion ROP ................................................................. 30 Scheme I-3. Mechanism of ROP using lipase ....................................................................................... 31 Scheme I-4. Pathway for the production of PHBHV from acetyl-CoA and from propionyl-CoA ....... 32 Scheme I-5. Lifecycle of poly(lactic acid) (PLA) ................................................................................. 36 Scheme I-6. Degradation pathway for poly(ε-caprolactone) (PCL) ..................................................... 37 Scheme I-7. Intracellular degradation pathway for PHB polymer ........................................................ 38 Scheme I-8. Unzipping depolymerization step of PCL ........................................................................ 39 Scheme I-9. Thermal degradation mechanism for PHB ....................................................................... 40
List of figures and schemes
XVI
Chapter II
Figure II-1. Realization and mechanical characterization of PCL/MIS biocomposites ....................... 80 Figure II-2. EDX spectra of MIS and MIS-Br ..................................................................................... 87 Figure II-3. FTIR-ATR spectra of MIS, PMMS and MIS-g-PMMS ................................................... 88 Figure II-4. XPS survey spectra of A) MIS and B) MIS-g-PMMS ..................................................... 89 Figure II-5. TGA analysis of MIS and MIS-g-PMMS ......................................................................... 89 Figure II-6. Strain-stress curves of PCL80MIS20 (sample 1) and PCL79.5MIS20PMMS0.5 (sample 4) ... 94 Figure II-7. Numerical toy model to illustrate the role of the interface grafting.a/ Geometry; b/ Results: PMMS non-grafted interface; c/ Results: PMMS grafted interface ...................................................... 95 Figure II-8. SEM images of PCL
Figure II-A1. Strain-stress curves for PCL/MIS composites with variable weight fraction of MIS fibers from 0 to 20 wt % .................................................................................................................................. 98 Figure II-B1. Strain-stress curves for PCL/MIS composites with 5 wt % of fibers with and without BPO ............................................................................................................................................................. 100 Figure II-B2. Strain-stress curves for PCL/MIS composites with 20 wt % of fibers with and without BPO ..................................................................................................................................................... 100 Scheme II-1. Different methods to elaborate PCLxMISy composites by using PMMS coating (A) or PMMS photo-grafting (B) ..................................................................................................................... 84
Chapter III
Figure III-1. Schematic of the Mori-Tanaka model. On the left: actual, heterogeneous material; on the right: effective, homogeneous material. The intermediate step represents the homogenization procedure where individual inclusions are considered as embedded in the matrix phase and contribute to the overall elasticity of the homogenized material ................................................................................................ 113 Figure III-2. Strain-stress curves for PHBHV/MIS composites (the weight percent contents are indicated) ............................................................................................................................................. 115 Figure III-3. Young Modulus vs Nominal fibers content calculated with the two methods of loading-unloading tests (■) and traction tests (●) ............................................................................................. 115 Figure III-4. Loading-unloading cycle for a PHBHV95MIS5 specimen ............................................. 116 Figure III-5. SEM images of the cross section of PHBHV/MIS composites: (A) PHBHV95MIS5; (B) PHBHV90MIS10; (C) PHBHV80MIS20; (D) PHBHV70MIS30 ....................... 116 Figure III-6. Results of numerical simulation: the values obtained with ROM rule are superposed with those obtained with the Mori-Tanaka with cylindrical inclusions....................................................... 119 Figure III-A1. Actual sample (on the top) and 2D FE model of the sample (on the bottom); the “active”
part is coloured in yellow .................................................................................................................... 124 Figure III-C1. Strain-stress curves for PHBHV95MIS5 composites tested after 8 days (black curve) and after 8 months (red curve) ................................................................................................................... 126 Figure III-C2. DSC first heating thermograms of PHBHV95MIS5 biocomposites tested after 8 days (black curve) and after 8 months (red curve) ...................................................................................... 126
Chapter IV
Figure IV-1. SEM images of long fibers (on the left) and short fibers (on the right) before processing ............................................................................................................................................................. 137 Figure IV-2. SEM images of PHBHV95MIS5 composites with long (A1) and short (A2) fibers and of PHBHV80MIS20 composites with long (B1) and short (B2) fibers ...................................................... 138 Figure IV-3. Comparison between strain-stress curves for PHBHV95MIS5 composites realized with long (solid line) and short (dashed line) fibers ............................................................................................ 139
List of figures and schemes
XVII
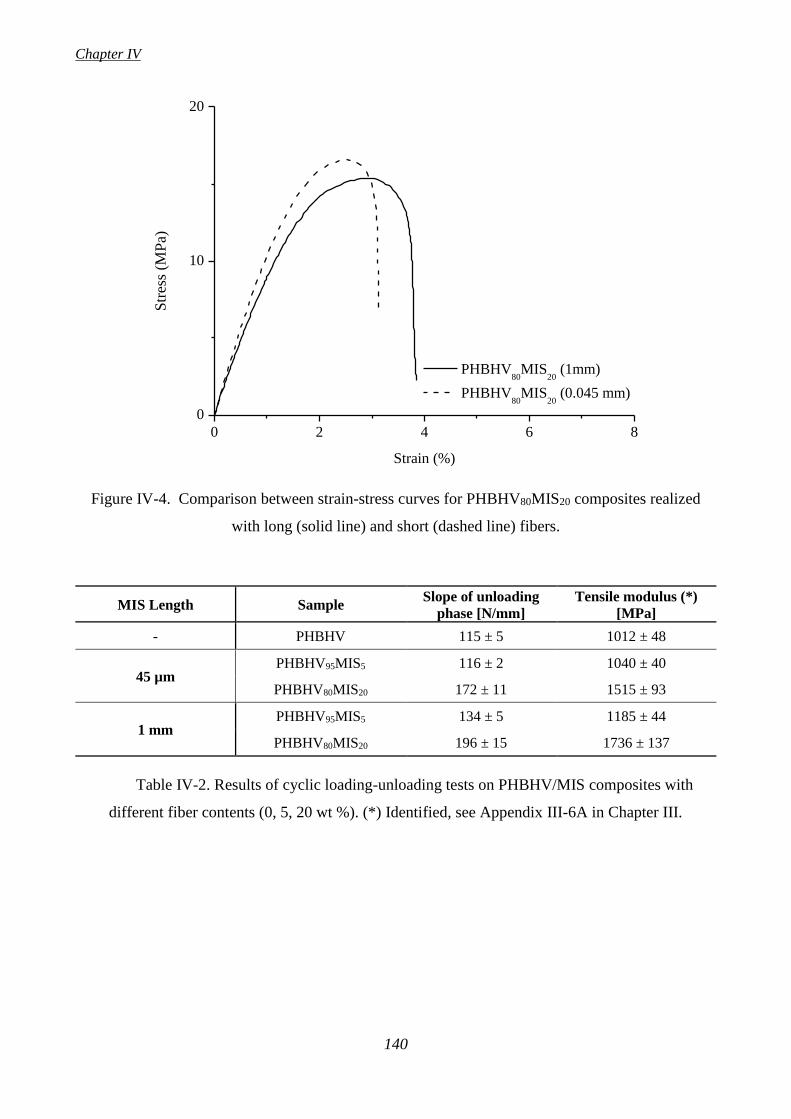
Figure IV-4. Comparison between strain-stress curves for PHBHV80MIS20 composites realized with long (solid line) and short (dashed line) fibers .................................................................................... 140 Figure IV-5. Numerical models developed in this study. On the left: FE models (2D and 3D); on the right: homogenization models (spherical and cylindrical inclusions) ................................................. 143 Figure IV-6. 2D FE models of long-fiber (top row) and small-fiber (bottom row) composites with 20 wt % (left column) and 5 wt % (right column) MIS fiber content ...................................................... 144 Figure IV-7. 2D FE models with different patterns of long fibers: clustered (a), staggered (b), random with small (c) and large (d) levels of randomness ............................................................................... 145 Figure IV-8. 3D FE models of long-fiber composites with 20 wt % (on the left) and 5 wt % (on the right) MIS fiber content ....................................................................................................................... 145 Figure IV-9. Top: Experimental and numerical values of the tensile moduli. Bottom: Relative errors of the numerical predictions with respect to the experimental measures. FE results refer to the Unif fiber pattern .................................................................................................................................................. 147 Figure IV-10. Highly stressed regions in the matrix. Results refer to 2D and 3D FE models of 20 wt % MIS composites (namely models 2, 4, 7, and 9). Gray regions: p1 > m,y; Red regions p1 > m,u (See paragraph IV-3.3.2 for details) ............................................................................................................ 149 Figure IV-11. Images of long-fiber, 5 wt % MIS (on the left) and 20 wt % MIS (on the right) composites obtained through micro-computed tomography. A few individual fibers are colored differently to highlight their pattern .......................................................................................................................... 152 Chapter V
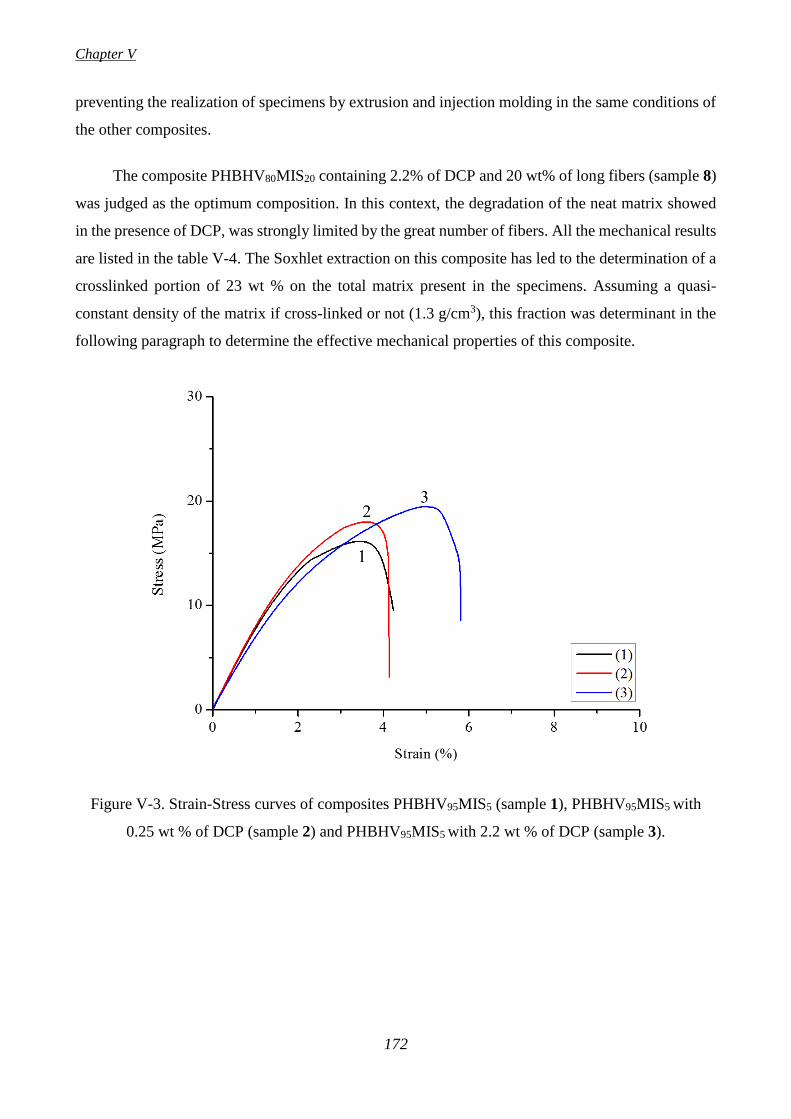
Figure V-1. FTIR-ATR spectra of MIS, MIS extracted from a composite PHBHV95MIS5 (sample 1) and MIS extracted from a composites PHBHV95MIS5 DCP (2.2%) (sample 3)... ..................................... 168 Figure V-2. FTIR-ATR spectrum of a PHBHV specimen in the range 2000-1000 cm-1.... ............... 169 Figure V-3. Strain-stress curves of composites PHBHV95MIS5 (sample 1), PHBHV95MIS5 with 0.25 wt % of DCP (sample 2) and PHBHV95MIS5 with 2.2 wt % of DCP (sample 3) .................................... 172 Figure V-4. Strain-stress curves of composites PHBHV95MIS5 (sample 4), PHBHV95MIS5 with 0.25 wt % of DCP (sample 5) and PHBHV95MIS5 with 2.2 wt % of DCP (sample 6) .................................... 173 Figure V-5. Strain-stress curves of composites PHBHV80MIS20 (sample 7) and PHBHV80MIS20 with 2.2 wt % of DCP (sample 8) ...................................................................................................................... 173 Figure V-6. SEM images of PHBHV95MIS5 composites realized with fibers of 1 mm treated with DCP (A) and untreated (B) .......................................................................................................................... 175 Figure V-7. SEM images of pure PHBHV (C) and of the matrix in the PHBHV95MIS5 (DCP) composites realized with fibers of 1 mm (D) (sample 3) and 45 µm (E) (sample 6) ........................................... 176 Figure V-8. DSC first heating thermograms of PHBHV, PHBHV80MIS20 (sample 7) and PHBHV80MIS20 (DCP) (sample 8) ............................................................................................ 177 Figure V-9. XRD diffractograms of MIS, PHBHV, PHBHV80MIS20 (sample 7) and PHBHV80MIS20 (DCP) (sample 8)................................................................................................................................. 178 Figure V-10. Evaluation of EG as function of ΦG for composites PHBHV95MIS5 (samples 2, 3, 5 and 6) ............................................................................................................................................................. 183 Figure V-11. Evaluation of EG as function of ΦG for composites PHBHV80MIS20 (sample 8) .......... 183 Figure V-A1. Evaluation of EG as function of ΦG for composites PHBHV90MIS10 (DCP) ................ 185
Chapter VI
Figure VI-1. Manufacturing methods of PLA-based composites.... ................................................... 195 Figure VI-2. In-plane dimensions of the samples used for fracture tests. The value of H refers to the gauge length, with the samples being longer to allow for firm gripping ............................................. 200 Figure VI-3. FTIR-ATR spectrum of PLA realized by compression (C), mixing and compression (MC) and extrusion and injection (EI). Normalization at 1454 cm-1 assigned to δCH3 .................................. 204 Figure VI-4. FTIR-ATR spectra of PLA processed in different ways in the zones 1650-1850 cm-1 and 750-1350 cm-1. Normalization at 1454 cm-1 assigned to δCH3 .............................................................. 204 Figure VI-5. XRD of PLA (C) (black curve), PLA (MC) (bleu curve) and PLA (EI) (red curve) .... 205
List of figures and schemes
XVIII
Figure VI-6. DSC curves for PLA80MIS20 (DCP) (sample 6 and 7) ................................................... 207 Figure VI-7. Young Modulus vs Final strength for mixed and compressed (■) and extruded and injected
(o) specimens ........................................................................................................................... 211 Figure VI-8. SEM images of PLA80MIS20 realized by extrusion and injection molding (A) and by mixing and compression molding (B) ................................................................................................. 212 Figure VI-9. DSC curves for PLA80MIS20 (DCP) specimens not aged (black curve), aged with UV (λ<280nm) for 250h (red curve) and for 500h (bleu curve) at 47±5°C and 50% of humidity ............ 215 Figure VI-10. Young Modulus (E) for neat matrix (■), PLA80MIS20 (MC) (●) and PLA80MIS20(DCP) (MC) (▲) after 250h and 500h of UV (λ<280nm) at 47±5°C and 50% of humidity ......................... 216 Figure VI-11. Final strength for neat matrix (■), PLA80MIS20 (MC) (●) and PLA80MIS20 (DCP) (MC) (▲) after 250h and 500h of UV (λ<280nm) at 47±5°C and 50% of humidity ................................... 217 Figure VI-12. SEM images of PLA80MIS20 (A) PLA80MIS20 (DCP) (C) not aged and PLA80MIS20 (B) PLA80MIS20 (DCP) (D) after aging (UV (λ<280nm) at 47±5°C for 250h at 50% humidity) .............. 218 Figure VI-A1. Torque and Temperature profiles vs Time for neat PLA and PLA/MIS composites realized with raw or modified fibers. .................................................................................................. 221 Figure VI-B1. Texture of composites PLA80MIS20 at 2.2% DCP (on the left) and 5% DCP (on the right). ............................................................................................................................................................. 222 Figure VI-C1. Effect of UV, temperature and humidity on the carbonyl ester group and on the crystalline zone (700-950 cm-1) for neat PLA, composite PLA80MIS20 and PLA80MIS20 (DCP) ......................... 223 Figure VI-C2. Diffractograms of PLA(C) (on the left) and PLA80MIS20 (MC) (on the right) before (black curves) and after aging (red curves) ......................................................................................... 223
List of tables
XIX
List of tables
Chapter I
Table I-1. Chemical composition of some common vegetal fibers....................................................... 13 Table I-2. Properties of some natural and synthetic fibers .................................................................... 14 Table I-3. Young Modulus and tensile strength for different natural fibers ......................................... 24 Table I-4. Thermal and mechanical properties of PLLA, PDLLA, PCL, PHB and PHB86HV14 .......... 34 Table I-5. Tensile properties of PLA-based composites with fibers untreated and treated with NaOH and silane. E: tensile modulus; σ: strength at yield; ε: elongation at break; nd: not determined .......... 51 Table I-6. Tensile properties of PHBHV-based composites with different vegetal fibers. E: tensile modulus; σ: strength at yield ................................................................................................................. 53
Chapter II
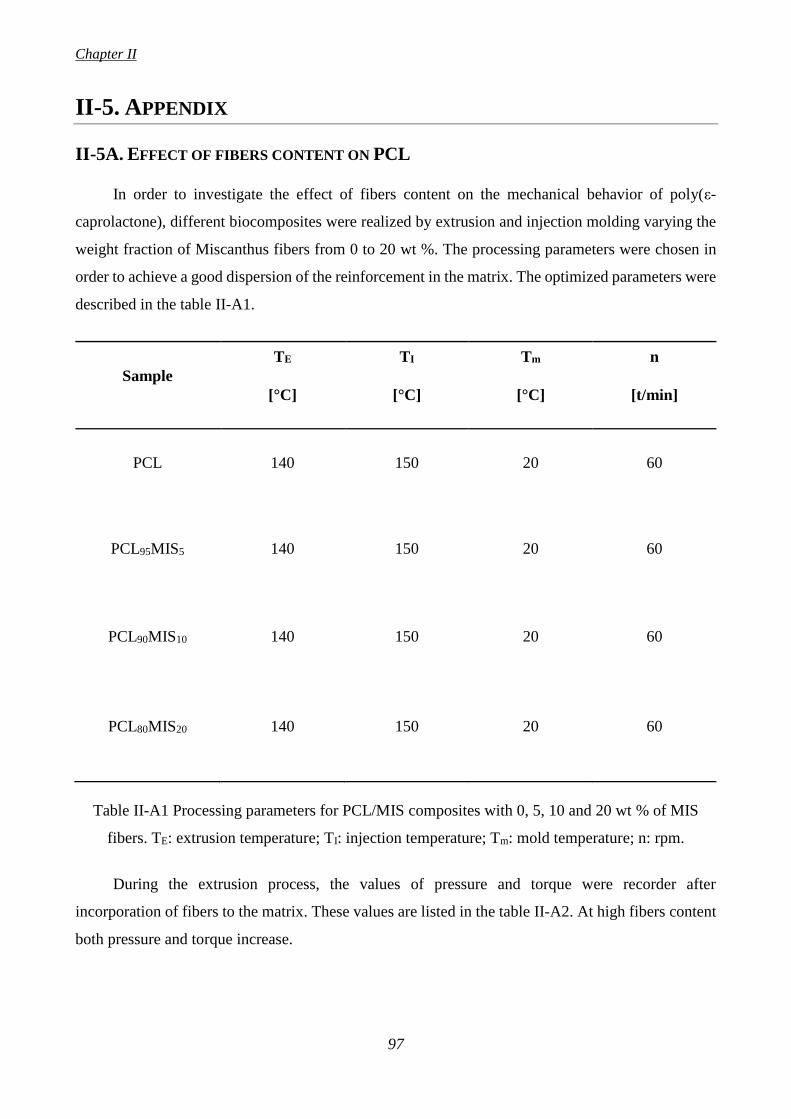
Table II-1. Structure of the polymer, the grafting agent and photo-initiator used in this study.. ......... 82 Table II-2. PMMS grafting on MIS determined by gravimetric and FTIR-ATR analyses................... 88 Table II-3. Comparison between R2 values determined by FTIR-ATR analysis .................................. 90 Table II-4. Tensile properties of the realized composites samples. E: Young modulus; εr: fracture strain; σr: tensile strength; η: global mechanical performance index ............................................................... 94 Table II-A1. Processing parameters for PCL/MIS composites with 0, 5, 10 and 20 wt % of MIS fibers. TE: extrusion temperature; TI: injection temperature; Tm: mold temperature; n: rpm ........................... 97 Table II-A2. Pressure and torque values for PCL/MIS composites during extrusion process .............. 98 Table II-A3. Results of loading-unloading cycles for PCL/MIS composites ....................................... 99 Table II-B1. Mechanical results for PCL/MIS composites with 5 and 20 wt % of fibers realized in the presence or not of BPO ....................................................................................................................... 101
Chapter III
Table III-1. Some of the extrusion and injection molding parameters. TE: extrusion temperature; n: rotational speed; TI: injection temperature; Tm: mold temperature. ................................................... .110 Table III-2. Technical data of Young Modulus and Poisson coefficient for Miscanthus giganteus and PHBHV ............................................................................................................................................... 113 Table III-3. Results of tensile tests on PHBHV/MIS composites at different fiber content (0, 5, 10, 20, 30 wt %) .............................................................................................................................................. 114 Table III-4. Results of cyclic loading-unloading test on PHBHV/MIS composites at different fiber content (0, 5, 10, 20, 30 wt %) ............................................................................................................ 114 Table III-5. Evaluation of fiber-size distribution ................................................................................ 117 Table III-6. Density values for MIS fibers and composites materials calculated with weight values (a) and with a Helium pycnometer (b). νMIS_n: nominal mass fraction of Miscanthus; νMIS_m: measured mass fraction; <ρMIS>: average density of Miscanthus; <ρC_calc>: calculated average density of composites; <ρC_exp>: experimental average density of composites ........................................................................ 118
Chapter IV
Table IV-1. Fiber size distributions in long-fiber composites with 5 and 20 wt % of MIS ................ 138 Table IV-2. Results of cyclic loading-unloading tests on PHBHV/MIS composites with different fiber contents (0, 5, 20 wt %). (*) Identified, see Appendix III-6A in Chapter III ..................................... .140
List of tables
XX
Table IV-3. Results of tensile tests on PHBHV/MIS composites with different fiber contents (0, 5, 20 wt %) realized with two lengths of fibers (1 mm and 45 µm). (*) Identified, see Appendix III-6A in Chapter III ........................................................................................................................................... 141 Table IV-4. Elastic moduli and mass density of the constituent phases of the composite used in the numerical models ................................................................................................................................ 142 Table IV-5. FE model information. Column “Model features” provides information on the model
dimension (either 2D or 3D), type of fibers (either long or short), nominal fiber weight fraction (%), and fiber pattern (either uniformly distributed (Unif), clustered (Clust), or randomly distributed fibers (RandNoise and RandPattern Unif, see paragraph IV-3.1.1 for details). Columns 3 to 5 indicate the study that the models were used for. Note that the numbers of elements and degrees of freedom (DOFS) are also presented ...................................................................................................................................... 142 Table IV-6. Experimental values and numerical predictions of the tensile modulus of the composites. Exp: experimental value; MT: Mori-Tanaka model; 2D FEM and 3D FEM: FEM models with uniformly distributed fibers .................................................................................................................................. 146 Table IV-7. Tensile moduli of long-fiber, 20 wt % MIS composite predicted by 2D FE models with different fiber patterns. Unif: uniformly distributed fibers; Clust: clustered fibers; RandNoise and RandPattern: randomly dispersed fibers (see paragraph IV-3.1.1 for details) .................................... 147 Table IV-8. Volume fractions m1 and m2 of highly stressed matrix when the boundary traction is equal to m,y and c,u, respectively (see paragraph IV.3.3.2 for details). Column “Model features” provides
information on the model dimension (either 2D or 3D), type of fibers (either long or short), nominal fiber weight fraction (%), and fiber pattern (either Unif, Clust, RndNoise, or RndPattern) ............... 148 Table IV-A1. Final parameters used in extrusion and injection molding procedure ........................... 156
Chapter V
Table V-1. Composition of PHBHV/MIS composites at different fibers content (5 and 20 wt %) length (1 mm and 45 µm) and DCP content (0, 0.25 and 2.2 wt %).... .......................................................... 167 Table V-2. Comparison of R1 values obtained by FTIR-ATR analysis as function of DCP content for fibers of 1 mm raw and extracted from biocomposites PHBHV95MIS5 (samples 1 and 3) ................. 169 Table V-3. Crystallinity parameters of PHBHV and its composites determined by FTIR-ATR analysis ............................................................................................................................................................. 170 Table V-4. Tensile properties of biocomposites determined by tensile tests ...................................... 174 Table V-5. DSC data for PHBHV/MIS composites realized with fibers of 1 mm and 45 μm: TM1 and TM2 (Melt temperatures); ΔH
M (Melt Enthalpy); Xc (Cristallinity degree) .......................................... 177
Table V-6. Technical data for Young Modulus and volumetric fraction for Miscanthus giganteus, PHBHV and gel fraction. (a) Adapted from [69]; (b) Experimental value; (c) evaluated according to procedure described in paragraph V-2.4.2 .......................................................................................... 180 Table V-7. Comparison between Mori-Tanaka model, FE model and the experimental value for the composite PHBHV80MIS20 (DCP) (sample 8) .................................................................................... 181 Table V-A1. Tensile properties of biocomposite PHBHV90MIS10 (DCP) determined by tensile tests ............................................................................................................................................................ .185
Chapter VI
Table VI-1. Processing parameters for the three processing methods: TM (Melt temperature); rpm (rotation speed); tM (mixing time); TI (injection temperature); Tm (mold temperature); tc (contact time), P1, P2 (first and second pressures), t1 and t2 (time of contact 1 and 2).... ............................................ 198 Table VI-2. Description of principal samples realized. PLA: poly(lactic acid); MIS: Miscanthus giganteus fibers; DCP: dicumyl peroxide; PMMS: poly(mercapropropylmethylsiloxane) ................ 199 Table VI-3. Typical bands assignment for PLA.................................................................................. 203 Table VI-4. Effect of process on the thermal properties of neat PLA and its composites .................. 207 Table VI-5. Crystallinity degree of PLA(C) after heating at 70°C and 100°C for 24h ....................... 208
List of tables
XXI
Table VI-6. Molar masses (Mn) and polydispersity index (PI) of PLA realized by different processing methods ............................................................................................................................................... 208 Table VI-7. Effect of UV (λ<280nm), temperature (47±5°C) and humidity (50% RH) on neat PLA, on
composite PLA80MIS20 with and without DCP ................................................................................... 214 Table VI-8. Stress intensity factor (KI) values for PLA (C) and PLA80MIS20 (MC) not aged (NA) and aged for 250 hours with UV (λ<280nm) at 32°C in a dried environment ........................................... 215 Table VI-B1. Effect of mixing step on the mechanical properties of neat PLA: compressed granules (C) and mixed and compressed granules (MC) ......................................................................................... 222
XXII
XXIII
“How much truth can a spirit endure, how much truth can it dare?
This became for me more and more the actual test of value.
Error (the belief in the ideal) is not blindness; error is cowardice.
Every conquest, every step forward in knowledge
is the outcome of courage, of hardness towards one’s self; of cleanliness towards one’s self.”
(Friedrich Nietzsche)
XXIV
General Introduction
1
GENERAL INTRODUCTION
The manufacturing and characterization of green composite materials constituted by bio-based
and biodegradable polymers as matrixes and vegetal fibers as reinforcement represents the general
context of this work. Growing environmental consciousness and changes in public policy have led to
an increasing demand for environmental eco-friendly materials with a subsequent progress in the field
of material science and an improvement of the associated technology. More precisely, in the recent
years, many efforts have been carried out from industries and researchers in different fields such as
organic chemistry, chemical engineering and process to improve the properties of such
biocomposites. The goals are to find new green materials by optimizing the processing steps
necessary to their manufacture and trying to control their mechanical behavior. Nowadays, the high
specific strength, the lightweight, the biodegradability and the eco-friendly character of natural fiber
reinforced polymer composites should be preferred to the traditional composites derived from
petroleum resources, these last being not eco-friendly due to their low degradability level. Many
efforts have been made to improve the characteristics of the biocomposites, typically acting on their
mechanical resistance and their thermal stability, in order to make them competitive with the
traditional ones.
Notwithstanding their green character, biocomposites present a series of concerns that affect
their final application. Some of these problems are related to the cost, which remains relatively high
at present and to the difficulty in processability of certain bio-based matrixes when compared to
traditional ones. A second concern is related to the physical incompatibility between the hydrophilic
vegetal fibers and the hydrophobic matrixes, which causes a lack of adhesion between the constituents
at their interface, inducing poor dispersion of reinforcement in the continuous phase, fibers pulling
out, mechanical properties and resistance to environmental aging of the composite worse than those
in which the contact matrix/fibers is good. In this context important challenges include the good
homogenization of fibers in the matrix, the improvement of the adhesion between fibers and matrix,
the reduction of the processing impact on the degradation of polymer and on the fibers structure, and
the full understanding of all those mechanisms related to the environmental conditions to which a
biocomposite could be subjected during his life-cycle. Undoubtedly, the combined action of a good
treatment of natural fibers, the appropriate choice of the matrix and an adequate processing method
are the key factors for the realization of biocomposites that meet the criteria of sustainability,
biodegradability and compostability required these last years (figure I-0). Among all existing
matrixes, this work takes into account the thermoplastic polymers and among these last, the aliphatic
General Introduction
2
biodegradable polyesters were chosen thanks to their great availability, biodegradability and pretty
good mechanical properties. More precisely, this thesis focuses on the realization and characterization
of biocomposites made of poly(ε-caprolactone) (PCL), poly(3-hydroxybutyrate-co-3-
hydroxyvalerate) (PHBHV) and poly (lactic acid) (PLA), as matrixes and Miscanthus giganteus
(MIS) fibers as reinforcement. The thesis has been organized as a set of articles in which different
aspects of biocomposites were taken into account and studied.
The first chapter constitutes a general overview on the existing literature about composites
materials, with peculiar attention to the mechanical and thermal properties of the biopolymers and
the effect of fiber’s type and arrangement on the characteristics of the final composite. The properties
of each constituent were taken into account in order to choose appropriate matrixes and reinforcement
for the experimental section. Moreover, particular attention was given to the processing methods and
to all those chemical treatments that could improve the mechanical properties of the final material. In
addition, an overview on analytical and numerical models was made in order to choose an appropriate
model that could help in designing the mechanical behavior of the biocomposites.
The second chapter focuses on the effect of chemical modification of fibers based on a two-
steps procedure. The first step consists on a thiol-ene reaction carried out between the double bonds
present in the lignin of fibers and the thiol groups characterizing the reactive used. The second step
consists in the grafting of the polyester, in this case PCL, to the vegetal fibers using a peroxide. The
originality of this method relies on the fact that it directly modifies vegetable fibers without using
pre-treatments and it acts on the unsaturated bonds present in the fibers instead of cellulose, this last
being largely studied in literature. This part has allowed us to find a green chemical modification
method applicable to any polyester. The identified chemical treatment will be able to improve the
mechanical properties of the final material maintaining the green character of the composite.
The third, fourth and fifth chapters are dedicated to the characterization of biocomposites
realized with the most innovative bio-based matrix used in this work, the PHBHV. In the third chapter
the effect of filler content was investigated and a micromechanical approach was used to identify a
model that could approximate the mechanical behavior of the final material. More precisely, a
homogenization approach was used and fibers modeled as cylindrical inclusions in a perfect contact
with the matrix seems to well approximate the experimental mechanical behavior of the
biocomposites.
General Introduction
3
Once defined processing parameters, the effect of reinforcement sizes and arrangement were
investigated in the fourth chapter by 2D and 3D numerical models aiming at determining not only the
effective mechanical behavior of the biocomposites but also the distribution of the stress in the
material, giving by this way important information on the non-linear behavior. The fifth chapter
focuses on the combined effect of fibers size and chemical treatment using reactive extrusion on the
PHBHV-based composites. The aim of this chapter was to understand the mechanism behind the
reactive process and to try to provide a quantification of the cross-linking phenomenon occurring
during the reactive extrusion.
The last chapter focuses on the effect of processing, chemical modification of fibers and photo-
oxidative aging on PLA-based composites. At this stage, a more pragmatic approach was considered,
taking into account the reduction of the total cost by the use of a less expensive matrix such as the
PLA and the possibility to use other processing methods that can minimize the polymer degradation.
Moreover, a preliminary study of the long term behavior of the PLA/MIS composites allowed us to
a present a full characterization of the biocomposites, establishing relations between the mechanical
properties and the microstructural changes of the polymer matrix.
Figure I-0. Performance, competitiveness, sustainability balance and applications of biocomposites
(adapted from [1]).
4
Chapter I
5
Chapter I:
Green Wood Plastic Composites
Chapter I
6
I-1. AN OVERVIEW ON COMPOSITES MATERIALS
The term “composite” refers to a material obtained by combining two or more constituents, by
adhesion or cohesion, different in shape and chemical composition and separated by an interface. The
final product has properties that are different from those of the individual constituents [2]. This
concept is very old. For instance, the ancients mixed straw and mud to get a building material and
Mongol warriors used biocomposites made of natural fibers and pine resins to craft swifter and more
powerful archery bows [3]. However, the word “composite” was first introduced only in the 1950’s.
Today one of the most used composites in the construction field, the reinforced concrete, belongs to
this type of materials.
In general, composites are constituted by a continuous phase called “matrix” and a
discontinuous one called “reinforcement”. This last is in general responsible of the strength and
stiffness of the final material, while the matrix is used to transfer the applied external loads by
adhering to the discontinuous phase. Furthermore, the matrix has the function to give a shape to the
finished object, holding together the type of reinforcement used (particles or fibers) [4]. A more
accurate analysis of the composition and internal structure of composite materials shows that, in
addition to those phases previously mentioned (matrix and fibers), there is also a third phase, located
between the matrix and the reinforcement, called interface. This last can be seen as a separation
surface between the different phases that constitute the composite material. However, the microscopic
observation of the areas near to the interface shows that this part have not only different structure but
also different properties. For this reason, in such cases, the word interface is substituted by the word
interphase, which corresponds to a defined area with specific chemical structure produced during the
processing step or created voluntarily to protect the reinforcement. This fact means that a composite
cannot be considered as a homogeneous material from a microscopic point of view because of the
presence of different phases and also of an interphase [5].
The constituents of a composite exhibit very different performances and according to the
principle of the combined actions, the optimization of properties (mechanical, cost etc.) are achieved
by the careful combination of two or more different materials. For instance, in the case of mechanical
properties, the addition of fibers with high tensile modulus to a matrix highly deformable results in a
composite with intermediary properties between those of the two constituents, like showed in the
figure I-1.
Chapter I
7
Figure I-1. Principle of combined actions for the mechanical resistance of a composite material
constituted by a fiber reinforced polymeric matrix.
Composites can be classified using different criteria. One of this is based on the reinforcing
type and its orientation in the polymer matrix (see figure I-2). More precisely, we can distinguish
fibrous or particulate reinforcements. The fibrous one can be organized in a discontinuous or in a
continuous way. In the first case, short fibers are used with a random or a partial orientation, while in
the second case long fibers are preferred, resulting in unidirectional or bidirectional composites [5].
Figure I-2. Example of reinforcement in the matrix. From left to right: particulate random,
Table I-5. Tensile properties of PLA-based composites with fibers untreated and treated with NaOH
and silane. E: tensile modulus; σ: strength at yield; ε: elongation at break; nd: not determined.
Chapter I
52
I-4.4. PCL-BASED BIOCOMPOSITES
In order to keep intact the biodegradability of the starting material, improving at the same time
the mechanical properties of the final composite, PCL can be combined with various natural fibers
by adjusting the ratio matrix/fiber [242, 243]. For different application areas, the use of
lignocellulosic filler (cellulose, sisal, flax fibers) in PCL matrix was investigated [244, 245]. PCL is
generally blended [115, 246, 247], but it can be also extruded [248] and in this case the influence of
extrusion parameters like rotation speed, throughput, and screw configuration on the residence time
have to be taken into account. One of the advantage of PCL-based biocomposites is that they require
low energy for thermal recycling and they can be used as eco-friendly materials for energy recovery.
The low melt temperature of PCL is a great problem not only for the manufacturing the
biocomposites, but also for the final applications of the materials that cannot be exposed to slightly
elevated temperatures. In order to avoid the problem related to low melt temperature and degradation
of matrix and lignocellulosic fibers, biocomposites were realized by impregnation baths for fibrous
mats. In this case, thermal properties of PCL were maintained and mechanical ones were improved
thanks to this technique and to the refining treatment of alfa fibers [249]. Composites with various
types of lignocellulosic fibers, such as cotton, cellulose obtained from the same and hydrolyzed
cellulose were realized [250]. In this case, best performances were obtained for a composite with 15%
of simple cellulose, in which mechanical properties were improved and the barrier properties of the
pure matrix were not affected by the presence of the filler. The results demonstrated also that the
effort and costs involved in the chemical treatments to prepare the hydrolyzed cellulose were not
justified. In such case, other biocomposites properties such as water-resistance were improved acting
on the modification of the polymer, as demonstrated by PCL modified with acrylic acid or cross-
linked PCL, exhibiting lower swelling, higher water resistance but at the same time lower degradation
rate [251, 252].
I-4.5. PHBHV-BASED BIOCOMPOSITES
A lot of fibers have been used these last years to improve the mechanical properties of PHBHV,
such as flax [253], jute [119], cellulose [118], wood [254] and bamboo [255]. The elastic properties
of some of these composites are showed in table I-6.
Chapter I
53
Sample % fibers [wt%] E [GPa] σ [MPa] References
PHB97HV3 - 2.1 ± 0.07 27.3 ± 0.3
[119]
PHB97HV3/man made cellulose 30 4.4 ± 0.34 41.7 ± 3.8
PHB97HV3/abaca 30 4.4 ± 0.06 28.0 ± 1.3
PHB97HV3/jute 30 7.0 ± 0.26 35.2 ± 1.3
Biopol - 1.0 ± 0.09 21.4 ± 1.5
[254]
Biopol/wood 30 1.9 ± 0.33 18.0 ± 2.04
Biopol/bamboo 30 1.71 18.9 [255]
Table I-6. Tensile properties of PHBHV-based composites with different vegetal fibers. E: tensile
modulus; σ: strength at yield.
In general these composites show an increase in mechanical properties and various changes in
thermal properties with increasing the filler content. For example, the elastic modulus of neat PHBHV
can be improved by around 167% by adding 40 % by weight of wood flour. In contrast tensile strength
decreases with increasing wood flour content [254]. A similar trend can be found changing
reinforcement type, using for example 40 wt% of recycled cellulose as filler for PHBHV. In this case
tensile modulus was improved by 220% and at higher cellulose content (over 20%) tensile strength
increases [118]. Exception to this case, in general when fibers are not modified by a chemical or a
physical treatment, a decrease in final strength can be observed. The incompatibility between the
hydrophilic fibers and the hydrophobic matrix led to lack adhesion fiber/matrix with poor dispersion
of the reinforcement in the matrix. These results are often confirmed by SEM images in which fibers
pull out from the matrix or with formation of fibers aggregates at high content of reinforcement. The
crystal morphology of PHBHV-based biocomposites is another parameter that can be affected by the
presence of natural filler and that can influence the mechanical properties of the final composite.
Fibers or flour can act as nucleation points increasing crystallinity and changing the crystallization
rate [255]. Similar results were reported in literature on wood fiber and wheat straw fiber filled
Chapter I
54
PHBHV composites [256, 257]. However there are also many case reported in literature in which no
change in crystallinity of PHBHV or its crystallization kinetics are detected [258-260]. A great
amount of investigations done with PHBHV biocomposites focuses on processing techniques and in
particular on compression molding of thin layers or films [261-263]. The use of lab-scale equipment
such as mini-molders or mini-processing machines [118, 255] constitutes a limitation for a large scale
application of these materials. In most cases, the up-scaling procedure is not applicable [119].
However many studies [264, 265] were carried out using semi-scale processing equipment, resulting
in excellent fibers dispersion. These results are encouraging for an industrial application of these
materials. In order to show the advantages of PHBHV-based biocomposites, polypropylene (PP) was
used as matrix and reinforced with vegetal fibers. The comparison between the two matrixes was
possible because processing parameters and fibers type were the same in the two cases. The addition
of 30% of wheat straw in PP and PHBHV causes a much higher increase in Young Modulus for this
last matrix. This fact can be explained by the better compatibility of wheat straw with the PHBHV
matrix as compared to PP matrix. Moreover, scanning electron microscopy (SEM) images reveal
more deformation of PP matrix than PHBHV in all biomass reinforced composites, with a significant
gap between the fibers and PP, while no gap was detected for biomass fiber-reinforced PHBHV [266].
The results described proved that these green composites can surely provide a sustainable alternative
to oil-derived composites.
Chapter I
55
I-5. MICROMECHANICS OF HETEROGENEOUS MATERIALS
The constitution of a material intended as its chemical composition, the arrangement of the
different constituents and their volumetric fraction, constitute important requirements to realize a
composite with desired properties. The possibility to evaluate and predict the overall characteristics
of a composite has a fundamental role.
Thus, a multiscale procedure consists in evaluating the effective properties of a hierarchically
structured material at a scale of observation from considerations of the phenomena occurring at the
lowers scales. As presented in figure I-27, the methods that have to be carried out to obtain this
effective behavior depend on the considered scales, from stochastic approaches for very large systems
to classical multiscale methods of continuum mechanics and even atomistic approaches necessary to
describe nanometric media.
Figure I-27. Multiscale methods for different length scale levels.
Chapter I
56
At the laboratory scale, all the observable material properties are only the macroscopic
manifestation of very many complex interaction mechanisms involving structural components on
numerous scales smaller than those we perceive with the naked eye. Among these last, some of
interest are the mechanical performance (elastic modulus, hardness, toughness and ductility, or its
fracture resistance) and also the acoustic (i.e., its ability to propagate or attenuate acoustic waves),
electric (e.g., the electrical conductivity or the magnetic permeability) and optical properties.
Therefore, it’s necessary to investigate the multiscale nature of the materials in order to well
understand, describe and control the mechanics and physics of solids. In this context, composites
materials perfectly describe the differences between scales, being constituted by different phases and
they are a perfect example of how the microscopic structure can influence qualitatively and
quantitatively the macroscopic properties of the final material.
To illustrate how multiscale phenomena can influence the overall properties of a given material,
we can refers to a crystalline material. As already discussed, the crystallinity (for example of a
polymer) is linked to the chemical structure and influence the mechanical behavior of a material. At
the macroscale, which ranges above a few millimeters, it’s possible to observe the general
organization of a material. When zooming in, it is then possible to observe a large number of grains
with different properties of orientation. At this scale, often called mesoscale, the local particularities
and heterogeneities of the material appear. The next length scale, the microscale with typical
submicronic dimensions, requires imaging tools such as microscopy or tomography. At this scale,
within each grain, complex configurations of defects in the regular atomic lattice (most importantly,
the so-called dislocations) become visible, forming a complicated network. Together with all other
crystal defects, the dislocation network forms the microstructure.
I-5.1. MICROMECHANICAL FRAMEWORK
When studying matrix-fiber composites, the microscale typically refers to the inclusion size
whereas the macroscale is linked to the size of the composite product. According to figure I-27, this
situation typically corresponds to the use of deterministic methods such as micromechanics. Aiming
describing heterogeneous materials by considering the properties of the matrix, the inclusions and the
interfacial phenomena, this approach involves classical tools of continuum mechanics. At the
macroscale, the notion of material particle is however replaced by the concept of Representative
Volume Element (RVE) [267]. This last can be seen as a sub-volume of a heterogeneous medium that
perfectly represents from a statistical point of view the composite, including all the micro-elements
(fibers, voids etc.) that constitutes the total material. It has thus to be large enough in comparison with
Chapter I
57
the size of the microstructural constituents. Moreover, the RVE also has to be small enough when
compared to the characteristic size of the macroscopic medium in order to be able to introduce the
concept of material particle during a structural calculation [268].
The Russian dolls configuration of our types of composite materials are showed in figure I-
28 [269].
Figure I-28. Principal scales in micromechanics approach.
Focusing the attention on the mechanical response, micromechanics tools make it possible to
determine the elastic moduli of a composite material starting from those of its constituents [270, 271].
The problem of the determination of elastic moduli in heterogeneous materials has been largely
investigated in past years [272-274] The transformation of a heterogeneous material into a
constitutively equivalent body of a homogeneous continuum constitutes the basic principle for
various composite homogenization models whose characteristics will be described in the next
paragraph.
I-5.2. FIRST SIMPLE ANALYTICAL METHODS
We consider hereafter that the scales separation that is necessary to derive the concept of RVE
is valid. This RVE is made by the union of two phases (typically the matrix and the fibers indexed
“M” and “F”).
The volume of this representative element is noted V (𝑉𝐹 and 𝑉𝑀 being the subvolumes
occupied by the fibers and the matrix) and the averaging over this domain of a quantity $ is noted
Chapter I
58
⟨$⟩=1
V∫ $dV
𝑉=
1
V[∫ $dV+ ∫ $dV
VMVF] (I-1)
To illustrate how this averaging procedure can be performed, let us consider the Young E modulus
as the quantity $. It is then possible to derive the rule of mixtures (ROM) providing an estimation of
the effective Young modulus Eeff from the constant moduli of the two phases:
Eeff=1
V[∫ EFdV+ ∫ EMdV
VMVF] = ΦFEF +(1-ΦF)EM (I-2)
where 𝛷𝐹 = 𝑉𝐹/𝑉 is the fibers volume fraction.
More generally, the development of a micromechanical model requires to provide the behavior of
each constituent of the heterogeneous medium. For instance, if x represents a location inside the RVE
and if each phase is considered as an elastic material, the local Hooke’s law in a Cartesian frame
reads:
σij(x)=Cijkl(x)εkl(x) (I-3)
or
εij(x)=Sijkl(x)σkl(x) (I-4)
Here, 𝜎𝑖𝑗 and 𝜀𝑘𝑙 represent the local stress and strain tensors and C=S-1 are the two fourth-order
elastic tensors (stiffness and compliance tensors). The aim of micromechanics being to provide
effective values of these latter properties tensors, the first two simple ideas consist in considering
homogeneous strain (Voigt approach), respectively homogeneous stress (Reuss approach), by
applying average values of the strain ⟨𝜀⟩, respectively of the stress ⟨𝜎⟩ at the boundaries of the RVE.
Thus, the effective stiffness tensor Ceff linking the average stress and strain through the effective
Hooke’s law
⟨σ⟩=Ceff ⟨ε⟩ (I-5)
can be derived as follows
Ceff = ⟨C⟩ (I-6)
in the case of the Voigt approximation and
Chapter I
59
Ceff= ⟨S⟩-1 (I-7)
in the case of the Reuss approximation.
Being quite simple, these two approximations do not generally provide a satisfactory
description of the effective behavior of the heterogeneous material. Indeed, the Voigt method tends
to overestimate the stiffness of the equivalent homogeneous material, whereas the Reuss one leads to
an underestimation. That is why other approaches have been proposed in order to obtain more realistic
descriptions of the effective behavior of heterogeneous materials.
I-5.3. ESHELBY APPROXIMATION
Seeded in the works of Hill [273] introducing the fiber strain concentration tensor AF, it can be
demonstrated that the average composite stiffness Ceff can be expressed as a function of this tensor
and the stiffness tensors of fibers (indexed “F”) and matrix (indexed “M”):
Ceff = CM + Φ F(CF- CM) AF (I-8)
The fiber strain concentration tensor 𝐴𝑓 corresponds to the ratio between the average strain in the
fiber and that of the composite. Note that the previous Voigt and Reuss approximations can be easily
recovered from this equation considering homogeneous strain or stress conditions.
However, the determination of Ceff remains very complex since the stress and strain fields in
the heterogeneous medium have to be determined. An analytical possibility to achieve such a
determination is based on the inclusion theory of Eshelby, developed in 1957 [275], concerning the
problem of an elastic inclusion in an infinite elastic homogenous medium. Eshelby considered the
matrix as a linear elastic solid containing an inclusion constituted by the same material of the matrix,
of a certain volume Vi and boundary Si which undergoes a change in shape and size caused by the
surrounding matrix. In order to determine the exact elastic state of the inclusion and the matrix,
Eshelby started to remove the inclusion from the matrix. This caused the so called “eigenstrain” [276,
277], a uniform strain with zero stress indicated with εT. After this removing step, by applying a
surface force on Si, he restored the cut inclusion to its original shape causing this time a stress in the
region of the inclusion with zero stress in the matrix. The whole body developed a complicated strain
field εC. At the end of this procedure, Eshelby calculated the stress and strain fields in the inclusion,
Chapter I
60
allowing to determine the effective elastic tensor Ceff. More precisely he defined the stress in the
inclusion 𝜎𝐼 as:
σI= CM(εC-εT) (I-9)
where CM is the stiffness of the matrix. For an ellipsoidal inclusion, Eshelpy showed that the strain
field εC was uniform and related to the eigeinstrain εT by the following relation:
εC=EεT (I-10)
Where E is the Eshelby tensor and is dependent on inclusion aspect ratio and the matrix elastic
constants [278]. The second step in Eshelby’s approach consists in demonstrating an equivalence
between the homogeneous inclusion problem and an inhomogeneous inclusion of the same shape. He
showed that the stress field in the inhomogeneous inclusion can be expressed as follows:
σI= CM(E-I)[(CI-CM)E+CM]-1CI εT* (I-11)
where I is the identity tensor, εT*is the eigenstrain in the inhomogeneity and C refers to the stiffness
tensor of matrix (indexed “M”) and inclusion (index “I”). The Eshelby theory is considered as the
background for all the homogenization methods developed. However, this method is restricting
because it was formulated for a single particle surrounded by an infinite medium. Moreover, Eshelby
solution treated only ellipsoidal fibers and can be used to evaluate the stiffness of a certain composite
with good accuracy for low volume fractions of fibers. This approximation is often called very dilute
inclusion approximation.
I-5.4. HALPIN-TSAI EQUATIONS
Other analytical techniques can be used to predict and better characterize the behavior of these
composites [279]. Again, these methods make simplifying assumptions about the microstructure to
solve the problem [280-282]. The perfect interface between the constituents and the elastic behavior
of fibers and matrix during the mechanical response are two of the most used assumptions in the
modelling of mechanical behavior of fibers-reinforced composites.
When focusing on the Young modulus, experimental observations have shown that the values
obtained with the rule of mixtures ( equation I-2) do not predict the real values [283]. This remark is
particularly true when considering anisotropic materials. For instance in figure I-29, the fibers are
Chapter I
61
mainly oriented in the longitudinal direction and it is obvious that the mechanical properties in this
direction strongly differs from the one in the transverse one.
Figure I-29. Scheme of a composite with fiber aligned in the stress direction
In such a configuration, the Halpin-Tsai model [284], largely used in the case of polymeric blends
[285] but also in the case of biopolymers reinforced with natural fillers [118, 254], is rather efficient.
Halpin-Tsai equations predicts the longitudinal (E1) and transversal (E2) moduli of an aligned short
fiber composite [286]:
E1=EFΦF+EM(1-ΦF) (I-12)
E2
EM= [
1+ξηΦF
1-ηΦF] η (I-13)
where 𝜉 is the “reinforcing factor” depending on the fibers geometry, their “packing”, the loading
condition and where 𝜂 is given by the following expression:
η = [(
EFEM
)-1
(EFEM
)+ξ] (I-14)
I-5.5. MORI-TANAKA-BENVENISTE MODEL
Another model largely used in the domain of composite materials is the Mori-Tanaka model
[287] developed in 1973 and then reformulated by Benveniste in 1987 [288]. In their work, Mori and
Tanaka, starting from Eshelby’s theory, proposed a method to correlate the average stresses and
Chapter I
62
strains of the inclusion with those of the matrix in a composite [289]. This approach is based on some
assumptions:
The matrix is considered as a linear elastic and isotropic material;
Fibers are considered as linearly elastic and they can be isotropic or transversely isotropic;
Fibers can be characterized by a certain aspect ratio between their length “l” and their diameter
“d”;
There is a perfect contact at the interface between fibers and matrix; no interfacial slip, or
fiber/matrix debonding, or matrix crack is considered.
The average strain in fiber is related to the average strain in the matrix by a fourth order tensor
expressing the relation between the uniform strain in the inclusion embedded in a matrix
material subjected to uniform strain at infinity.
Such approaches have been used in the laboratory to study bone properties [290] and these
implemented methods will thus be used to characterize our composites.
I-5.6. NUMERICAL METHODS: A FOCUS ON FINITE ELEMENT METHOD
If many theoretical models are present in literature [291-294], they are appropriate for the case
of unidirectional short-fiber composites but from an experimental point of view, it’s very difficult to
manufacture a material with short fibers perfectly aligned in a direction. In general, partial alignment
can be obtained using processing methods such as those described in the previous paragraph (injection
for instance). As visible in figure I-30, advanced imaging techniques such as micro-tomography
shows that the intimate structure of the composite presents a level of disorder that increases the
accuracy of the theoretical estimations of the effective mechanical parameters.
The idea can then to simulate a tensile test on a sample to derive a numerical estimation of the
effective properties.
To do that, the most classical approach consist in using a Finite Element Method (FEM). This
numerical procedure is very well adapted to solve elliptic problems such as elasticity problem.
Basically, its idea consists in transforming the problem in its strong sense (the set of the partial
differential equations and the convenient boundary conditions defined over an open material domain
V and its boundaries ∂V) into a problem in the weak sense by using the scalar product by a test
function belonging to a convenient vector space of functions W. Using Green formulae, it is then
possible to explicitly incorporate the boundary condition into the formulation. Then, the solution to
Chapter I
63
the problem is searched from this weak problem. To overcome the infinite dimension of the vector
space W, an approximation of the solution is searched on a discrete sub-vector-space (for instance
polynomial functions of a given degree with prescripted values over identified nodes of the domain
and its boundary) with a finite dimension, the problem often becoming the resolution of a quite simple
linear problem. These nodes form a mesh of the material domain.
This analysis is useful in the case of complex geometries and different properties of the
inclusions compared to those of matrix. The division of the problem in subdomains allows to detect
also local effects.
In the finite element analysis, the mesh generation is a fundamental part of the analysis because
it guarantees the geometric accuracies and participates to the numerical precision. In fact, in such
cases classical mesh generation led to poor accuracies and fail to characterize the material
heterogeneities, while ultra-fine meshes assure good accuracies but they may affect the computational
efficiency [295].
In our situation, the FEM models can be built from geometrical representations of the composite
(see chapter IV for instance) or from advanced imaging techniques such as micro-tomography to
predict the elastic properties of materials [296] and in order to have realistic information about the
geometry of the inclusions [297].
Figure I-30. Micro-CT reconstruction of a polymer/fibers composite and determination of a realistic
RVE volume.
Chapter I
64
I-6. CONCLUSIONS
In this chapter the characteristics of different matrixes and reinforcements, the principal
processing methods, the current chemical treatments of cellulose and some numerical and analytical
approaches were described. Thanks to the information provided by this study, only three matrixes
were retained for the next part of this thesis. We decided to reinforce poly(ε-caprolactone), poly(lactic
acid) and poly(3-hydroxybutyrate-co-3-hydroxyvalerate), all belonging to the group of biodegradable
aliphatic polyesters, with vegetal fibers of Miscanthus giganteus.
The description of all possible chemical treatments on the reinforcement suggested that the
majority of these methods are applied to the hydroxyl groups of cellulose and some of these are very
aggressive in terms of reaction conditions. In the following part, we have tried to identify an eco-
friendly chemical treatment that could maintain the green character of the biocomposites, improving
at the same time the mechanical properties of the final material. The method that we have chosen is
not based on the chemical modification of the hydroxyl groups of cellulose (largely described in
literature), but it is based on the reactivity of the double bonds present in the lignin structure of vegetal
fibers. To this innovative technique we have associated a grafting initiated by peroxides which can
improve the adhesion matrix/fibers, acting also on the cross-linking of the matrix.
The study about the processing methods suggested that in order to realize a biocomposite with
competitive mechanical properties, a good dispersion and a good alignment of the reinforcement into
the matrix are two fundamental requirements to be achieved. To this aim, we have retained for the
next part extrusion and mixing as two compounding methods and injection and compression molding
as final steps to give a shape to biocomposites.
The descriprion of the basics of micromechanics revealed that different methods (analytical and
numerical) can be used in order to describe the elastic behaviour of the final biocomposite. Among
all the possible models, we have retained the Mori-Tanaka model and the finite element methods to
describe the effect of fibers content, size, arrangment and adhesion to the matrix on the mechanical
behaviour of the biocomposite.
Chapter I
65
I-7. REFERENCES
1. Pandey, J.K. et al., Commercial potential and competitiveness of natural fiber composites, in Biocomposites: Design and Mechanical Performance, M. Misra, J.K. Pandey, and A.K. Mohanty, Editors. Woodhead Publishing (2015).
2. Wang, R.M. et al., Polymer Matrix Composites and Technology. Woodhead Publishing Limited and Science Press Limited (2011).
3. Available from: http://compositeslab.com/composites-101/history-of-composites /. June 26, 2017. 4. Jones, R.M., Mechanics of Composite Materials. Second ed.: Taylor and Francis Group (1999). 5. Matthews, F.L. et al., Composite Materials: Engineering and Science. Woodhead Publishing Limited
and CRC Press LLC (1999). 6. Kaw, A.K., Mechanics of Composite Materials. Second ed.: CRC Press (2005). 7. United, S., Advanced materials by design. Washington, DC: Congress of the U.S., Office of
Technology Assessment : For sale by the Supt. of Docs., U.S. G.P.O. (1988). 8. Shalin, R.E., Polymer Matrix Composites. First ed.: Springer Netherlands (1995). 9. Callister, W.D. et al., Scienza e ingegneria dei materiali. Third ed.: Edises, Napoli (2012). 10. Peng, W. et al., Thermosetting Resins. Journal of Chemical Education 72(7), p. 587 (1995). 11. Marchetti, M. et al., Tecnologie dei materiali compositi. Editoriale ESA, Milano (1991). 12. Brukner, S. et al., Scienza e Tecnologia dei Materiali Polimerici. I ed, ed. N. Edises. (2001). 13. Vázquez, A. et al., Bagasse Fiber-Polypropylene Based Composites. Journal of Thermoplastic
Composite Materials 12(6), p. 477-497 (1999). 14. Berglund, L.A., Thermoplastic resins, in Handbook of Composites, S.T. Peters, Editor. Chapman &
Hall, London (1998). 15. Baker, A.-M. et al., Thermoplastics, in Handbook of Plastics, Elastomers & Composites, C.A.
Harper, Editor. McGraw Hill, New York (2002). 16. Strong, A.B., Fundamentals of composites manufacturing: materials, methods and applications.
Second ed.: SME, Dearborn (1989). 17. Wayne Hayden, H. et al., Mechanical behavior, in Structure and properties of materials. John Wiley
and Sons, Inc. (1965). 18. Available from: http://www.pluscomposites.eu/sites/default/files/technical-articles-chapter6-
English_0.pdf./ June 26, 2017. 19. Biagiotti, J. et al., A Review on Natural Fibre-Based Composites-Part I. Journal of Natural Fibers
1(2), p. 37-68 (2004). 20. Mallick, P.K., Fiber-reinforced composites: materials, manufacturing and design. CRC Press, Boca
Raton (2007). 21. Bledzki, A.K. et al., Composites reinforced with cellulose based fibres. Progress in Polymer Science
24(2), p. 221-274 (1999). 22. Saheb, D.N. et al., Natural fiber polymer composites: A review. Advances in Polymer Technology
18(4), p. 351-363 (1999). 23. Glasser, W.G. et al., Fiber-reinforced cellulosic thermoplastic composites. Journal of Applied Polymer
Science 73(7), p. 1329-1340 (1999). 24. Li, Y. et al., Sisal fibre and its composites: a review of recent developments. Composites Science and
Technology 60(11), p. 2037-2055 (2000). 25. Eichhorn, S.J. et al., Review: Current international research into cellulosic fibres and composites.
Journal of Materials Science 36(9), p. 2107-2131 (2001). 26. Corbière-Nicollier, T. et al., Life cycle assessment of biofibres replacing glass fibres as reinforcement
in plastics. Resources, Conservation and Recycling 33(4), p. 267-287 (2001). 27. Joshi, S.V. et al., Are natural fiber composites environmentally superior to glass fiber reinforced
composites? Composites Part A: Applied Science and Manufacturing 35(3), p. 371-376 (2004). 28. Ahmad, F. et al., A Review: Natural Fiber Composites Selection in View of Mechanical, Light Weight,
and Economic Properties. Macromolecular Materials and Engineering 300(1), p. 10-24 (2015). 29. Ray, A.K. et al., Bamboo—A functionally graded composite-correlation between microstructure and
mechanical strength. Journal of Materials Science 40(19), p. 5249-5253 (2005).
30. Dittenber, D.B. et al., Critical review of recent publications on use of natural composites in infrastructure. Composites Part A: Applied Science and Manufacturing 43(8), p. 1419-1429 (2012).
31. Dicker, M.P.M. et al., Green composites: A review of material attributes and complementary applications. Composites Part A: Applied Science and Manufacturing 56, p. 280-289 (2014).
32. Charlet, K. et al., Characteristics of Hermès flax fibres as a function of their location in the stem and properties of the derived unidirectional composites. Composites Part A: Applied Science and Manufacturing 38(8), p. 1912-1921 (2007).
33. Kaack, K. et al., Variation in morphology, anatomy and chemistry of stems of Miscanthus genotypes differing in mechanical properties. Industrial Crops and Products 17(2), p. 131-142 (2003).
34. De Rosa, I.M. et al., Morphological, thermal and mechanical characterization of okra (Abelmoschus esculentus) fibres as potential reinforcement in polymer composites. Composites Science and Technology 70(1), p. 116-122 (2010).
35. Wielage, B. et al., Thermogravimetric and differential scanning calorimetric analysis of natural fibres and polypropylene. Thermochimica Acta 337(1), p. 169-177 (1999).
36. Pickering, K.L. et al., A review of recent developments in natural fibre composites and their mechanical performance. Composites Part A: Applied Science and Manufacturing 83, p. 98-112 (2016).
37. Célino, A. et al., The hygroscopic behavior of plant fibers: a review. Frontiers in Chemistry 1, p. 43 (2013).
38. Pereira, P.H.F. et al., Vegetal fibers in polymeric composites: a review. Polímeros 25, p. 9-22 (2015). 39. Scheller, H.V. et al., Hemicelluloses, in Annual Review of Plant Biology, Vol 61, S. Merchant, W.R.
Briggs, and D. Ort, Editors. (2010). 40. Available from: http://www.cours-pharmacie.com/biologie-vegetale/les-parois-vegetales.html. June
26, 2017. 41. Muthuraj, R. et al., 5 - Studies on mechanical, thermal, and morphological characteristics of
biocomposites from biodegradable polymer blends and natural fibers, in Biocomposites. Woodhead Publishing. (2015).
42. Shah, D.U., Developing plant fibre composites for structural applications by optimising composite parameters: a critical review. Journal of Materials Science 48(18), p. 6083-6107 (2013).
43. Mohanty, A.K. et al., Biofibres, biodegradable polymers and biocomposites: An overview. Macromolecular Materials and Engineering 276-277(1), p. 1-24 (2000).
44. Koronis, G. et al., Green composites: A review of adequate materials for automotive applications. Composites Part B: Engineering 44(1), p. 120-127 (2013).
45. Akil, H.M. et al., Kenaf fiber reinforced composites: A review. Materials & Design 32(8), p. 4107-4121 (2011).
46. Nanda, M.R. et al., Performance Evaluation of Biofibers and Their Hybrids as Reinforcements in Bioplastic Composites. Macromolecular Materials and Engineering 298(7), p. 779-788 (2013).
47. Bourmaud, A. et al., Investigations on mechanical properties of poly(propylene) and poly(lactic acid) reinforced by miscanthus fibers. Composites Part a-Applied Science and Manufacturing 39(9), p. 1444-1454 (2008).
48. Nagarajan, V. et al., New engineered biocomposites from poly(3-hydroxybutyrate-co-3-hydroxyvalerate) (PHBV)/poly(butylene adipate-co-terephthalate) (PBAT) blends and switchgrass: Fabrication and performance evaluation. Industrial Crops and Products 42, p. 461-468 (2013).
49. Available from: http://www.agrobiobase.com/sites/default/files/dossiers/fichiers/memento_2016_-_panorama_des_marches_fibres_vegetales_techniques_materiaux_hors_bois.pdf. 26 June, 2017.
50. Woodings, C., A brief history of regenerated cellulosic fibers in Regenerated cellulose fibres, C. Woodings, Editor. Woodhead Publishing Ltd. (2001).
51. Atalla, R.H. et al., Native Cellulose: A Composite of Two Distinct Crystalline Forms. Science 223(4633), p. 283 (1984).
52. Rojas, J., Effect of Polymorphism on the Particle and Compaction Properties of Microcrystalline Cellulose, in Cellulose - Medical, Pharmaceutical and Electronic Applications, T.v.d. Ven and L. Godbout, Editors. InTech: Rijeka. (2013).
53. Deguchi, S. et al., Cooking cellulose in hot and compressed water. Chemical Communications 21(31), p. 3293-3295 (2006).
54. Moore, R. et al., Botany Visual Resource Library the McGraw-Hill Companies, Inc. (1998).
55. Brett, C. et al., Physiology and Biochemistry of Plant Cell Walls. First ed.: Chapman and Hall, London (1990).
56. Darvill, J.E. et al., Structure of Plant Cell Walls. Plant Physiology 66, p. 1135-1139 (1980). 57. Available from: https://employees.csbsju.edu/ssaupe/biol327/Lecture/cell-wall.htm. June 26, 2017. 58. Cordeiro, R., Plasma Treatment of Natural Fibers to Improve Fiber-Matrix Compatibility. (2016). 59. Klemm, D. et al., Cellulose: Fascinating Biopolymer and Sustainable Raw Material. Angewandte
Chemie International Edition 44(22), p. 3358-3393 (2005). 60. Krumm, C. et al., Millisecond Pulsed Films Unify the Mechanisms of Cellulose Fragmentation.
Chemistry of Materials 28(9), p. 3108-3114 (2016). 61. Available from: http://www.cours-pharmacie.com/biologie-vegetale/les-parois-vegetales.html. June
26, 2017. 62. Rowell, R.M. et al., Paper and Composites from Agro-Based Resources. CRC Press, Inc, US (1997). 63. Salmén, L., Micromechanical understanding of the cell-wall structure. Comptes Rendus Biologies
327(9–10), p. 873-880 (2004). 64. Cousins, W.J., Young's modulus of hemicellulose as related to moisture content. Wood Science and
Technology 12(3), p. 161-167 (1978). 65. Freudenberg, K., Biosynthesis and Constitution of Lignin. Nature 183(4669), p. 1152-1155 (1959). 66. Heitner, C. et al., Lignin and Lignans: Advances in Chemistry. CRC Press, Boca Raton, FL (2010). 67. Upton, B.M. et al., Strategies for the conversion of lignin to high-value polymeric materials: Review
and perspective. Chemical reviews 116(4), p. 2275-2306 (2015). 68. Monties, B., Biological variability of lignification and mechanical behaviour of woody plants, in
International Conference of the European Society for Wood Mechanics. 2004: Stockholm, SWE. p. 3-14.
69. Cousins, W.J. et al., Young's modulus of lignin from a continuous indentation test. Journal of Materials Science 10(10), p. 1655-1658 (1975).
70. Faruk, O. et al., 6 - Lignin Reinforcement in Thermoplastic Composites, in Lignin in Polymer Composites. William Andrew Publishing. (2016).
71. Al Mamun, A. et al., 8 - Lignin Reinforcement in Bioplastic Composites, in Lignin in Polymer Composites. William Andrew Publishing. (2016).
72. EL Bassam, N., Energy Plant Species: Their Use and Impact on Environment and Development. James & James (Science Publishers) Ltd. (1998).
73. Moon, Y.-H. et al., Development of "Miscanthus" the Promising Bioenergy Crop. Korean Journal of Weed Science 30(4), p. 330-339 (2010).
74. Murnen, H.K. et al., Optimization of Ammonia Fiber Expansion (AFEX) Pretreatment and Enzymatic Hydrolysis of Miscanthus x giganteus to Fermentable Sugars. Biotechnology Progress 23(4), p. 846-850 (2007).
75. Dohleman, F.G. et al., More Productive Than Maize in the Midwest: How Does Miscanthus Do It? Plant Physiology 150(4), p. 2104-2115 (2009).
76. Heaton, E.A. et al., Miscanthus. Advances in Botanical Research 56, p. 75-137 (2010). 77. Beale, C.V. et al., Can perennial C4 grasses attain high efficiencies of radiant energy conversion in
cool climates? Plant, Cell & Environment 18(6), p. 641-650 (1995). 78. Botto, L. et al., Physical characterisation and yield stress of a concentrated Miscanthus suspension.
Rheologica Acta 53(10), p. 805-815 (2014). 79. Heaton, E.A. et al., Meeting US biofuel goals with less land: the potential of Miscanthus. Global
Change Biology 14(9), p. 2000-2014 (2008). 80. Fischer, G. et al., Biomass potentials of miscanthus, willow and poplar: results and policy implications
for Eastern Europe, Northern and Central Asia. Biomass and Bioenergy 28(2), p. 119-132 (2005). 81. Dorge, S. et al., Thermal degradation of Miscanthus pellets: kinetics and aerosols characterization.
Waste and Biomass Valorization 2(2), p. 149-155 (2011). 82. Michel, R. et al., Miscanthus × Giganteus straw and pellets as sustainable fuels and raw material for
activated carbon. Environmental Chemistry Letters 4(4), p. 185-189 (2006). 83. De Jong, W., Prolysis of Miscanthus giganteus and wood pellets : TG-FITIR analysis and reaction
kinetics. Fuel 82, p. 1139-1147 (2003). 84. Collura, S. et al., Thermal behaviour of Miscanthus grasses, an alternative biological fuel.
Environmental Chemistry Letters 5(1), p. 49-49 (2007).
85. Collura, S. et al., Miscanthus giganteus straw and pellets as sustainable fuels combustion and emission tests. Environmental Chemistry Letters 4, p. 75-78 (2006).
86. Johnson, M. et al., Improvement of the impact performance of a starch based biopolymer via the incorporation of Miscanthus giganteus fibres. Industrial Crops and Products 22(3), p. 175-186 (2005).
87. Ly, A. et al., Fibres de miscanthus et matériaux composites, in Cerig/Grenoble INP-Pagora. 2015. 88. Available from:
http://www.valbiom.be/files/library/Docs/Chanvre/etudecomparativedesapplicationsnonenergetiquesduchanvreetdumiscanthus1302508542.pdf. June 26, 2017.
89. Zhang, K. et al., Co-Injection Molded New Green Composites from Biodegradable Polyesters and Miscanthus Fibers. Macromolecular Materials and Engineering 299(4), p. 436-446 (2014).
90. Kaack, K. et al., Morphological and mechanical properties of Miscanthus in relation to harvesting, lodging, and growth conditions. Industrial Crops and Products 14(2), p. 145-154 (2001).
91. Lundquist, L. et al., Alkali–methanol–anthraquinone pulping of Miscanthus x giganteus for thermoplastic composite reinforcement. Journal of Applied Polymer Science 92(4), p. 2132-2143 (2004).
92. Baley, C., Analysis of the flax fibres tensile behaviour and analysis of the tensile stiffness increase. Composites Part A: Applied Science and Manufacturing 33(7), p. 939-948 (2002).
93. Szabó, P. et al., Thermogravimetric/mass spectrometric characterization of two energy crops, Arundo donax and Miscanthus sinensis. Journal of Analytical and Applied Pyrolysis 36(2), p. 179-190 (1996).
94. Johnson, R.M. et al., Impact performance of Miscanthus/Novamont Mater-Bi® biocomposites. Polymer Testing 22(2), p. 209-215 (2003).
95. Chanprateep, S., Current trends in biodegradable polyhydroxyalkanoates. Journal of Bioscience and Bioengineering 110(6), p. 621-632 (2010).
96. Albertsson, A.-c. et al., Macromolecular Architecture-Nature as a Model for Degradable Polymers. Journal of Macromolecular Science, Part A 33(10), p. 1565-1570 (1996).
97. Research, Z., Biodegradable Polymer (Polymers with Carbon Backbones, Polymers with Hydrolyzable Backbones, Natural Polymers) Market For Packaging, Agricultural, Medical and Other Applications: Global Industry Perspective, Comprehensive Analysis, Size, Share, Growth, Segment, Trends and Forecast 2014 – 2020, p. 110 (2016).
98. Leja, K. et al., Polymer Biodegradation and Biodegradable Polymers – a Review Polish Journal of Environmental Studies 19(2), p. 255-266 (2010).
99. Doppalapudi, S. et al., Biodegradable polymers—an overview. Polymers for Advanced Technologies 25(5), p. 427-435 (2014).
100. Armentano, I. et al., Multifunctional nanostructured PLA materials for packaging and tissue engineering. Progress in Polymer Science 38(10), p. 1720-1747 (2013).
101. Sadegh-Hassani, F. et al., Preparation and characterization of bionanocomposite films based on potato starch/halloysite nanoclay. International Journal of Biological Macromolecules 67, p. 458-462 (2014).
102. Mensitieri, G. et al., Processing and shelf life issues of selected food packaging materials and structures from renewable resources. Trends in Food Science & Technology 22(2–3), p. 72-80 (2011).
103. Sarasini, F., 4 - Thermoplastic biopolymer matrices for biocomposites A2 - Ray, Dipa, in Biocomposites for High-Performance Applications. Woodhead Publishing. (2017).
104. Murariu, M. et al., PLA composites: From production to properties. Advanced Drug Delivery Reviews 107, p. 17-46 (2016).
105. Lim, L.T. et al., Processing technologies for poly(lactic acid). Progress in Polymer Science 33(8), p. 820-852 (2008).
106. Plackett, D. et al., Polylactide-based biocomposites, in Natural fibers, biopolymers and biocomposites, A.K. Mohanty, M. M., and L.T. Drzal, Editors. Boca Raton, FL: CRC Press. (2005).
107. Mukherjee, T. et al., PLA Based Biopolymer Reinforced with Natural Fibre: A Review. Journal of Polymers and the Environment 19(3), p. 714-725 (2011).
108. Plackett, D. et al., Natural polymer sources, in Green composites: polymer composites and the environment, C. Baillie, Editor. Woodhead Publishing Ltd and CRC Press LLC: Cambridge, UK. (2004).
109. Shen, L. et al., Present and future development in plastics from biomass. Biofuels, Bioproducts and Biorefining 4(1), p. 25-40 (2010).
110. Eshraghi, S. et al., Mechanical and microstructural properties of polycaprolactone scaffolds with one-dimensional, two-dimensional, and three-dimensional orthogonally oriented porous architectures produced by selective laser sintering. Acta Biomaterialia 6(7), p. 2467-2476 (2010).
111. Serrano, M.C. et al., In vitro biocompatibility assessment of poly(ε-caprolactone) films using L929 mouse fibroblasts. Biomaterials 25(25), p. 5603-5611 (2004).
112. Lahiri, D. et al., Boron nitride nanotube reinforced polylactide–polycaprolactone copolymer composite: Mechanical properties and cytocompatibility with osteoblasts and macrophages in vitro. Acta Biomaterialia 6(9), p. 3524-3533 (2010).
113. Choi, J.-i. et al., Process analysis and economic evaluation for Poly(3-hydroxybutyrate) production by fermentation. Bioprocess Engineering 17(6), p. 335-342 (1997).
114. Jacquel, N. et al., Solubility of polyhydroxyalkanoates by experiment and thermodynamic correlations. AIChE Journal 53(10), p. 2704-2714 (2007).
115. Yu, L. et al., Polymer blends and composites from renewable resources. Progress in Polymer Science 31(6), p. 576-602 (2006).
116. Satyanarayana, K.G. et al., Biodegradable composites based on lignocellulosic fibers—An overview. Progress in Polymer Science 34(9), p. 982-1021 (2009).
117. Arbelaiz, A. et al., Mechanical properties of short flax fibre bundle/poly(ε-caprolactone) composites: Influence of matrix modification and fibre content. Carbohydrate Polymers 64(2), p. 224-232 (2006).
118. Bhardwaj, R. et al., Renewable Resource-Based Green Composites from Recycled Cellulose Fiber and Poly(3-hydroxybutyrate-co-3-hydroxyvalerate) Bioplastic. Biomacromolecules 7(6), p. 2044-2051 (2006).
119. Bledzki, A. et al., Mechanical performance of biocomposites based on PLA and PHBV reinforced with natural fibres–A comparative study to PP. Composites science and technology 70(12), p. 1687-1696 (2010).
120. Oksman, K. et al., Natural fibres as reinforcement in polylactic acid (PLA) composites. Composites Science and Technology 63(9), p. 1317-1324 (2003).
121. Garlotta, D., A Literature Review of Poly(Lactic Acid). Journal of Polymers and the Environment 9(2), p. 63-84 (2001).
122. Rasal, R.M. et al., Poly(lactic acid) modifications. Progress in Polymer Science 35(3), p. 338-356 (2010).
123. Carothers, W.H. et al., Studies of polymerization and ring formation. X. The reversible polymerization of six-membered cyclic esters Journal of the American Chemical Society 54(2), p. 761-772 (1932).
124. Auras, R. et al., An Overview of Polylactides as Packaging Materials. Macromolecular Bioscience 4(9), p. 835-864 (2004).
125. Madhavan Nampoothiri, K. et al., An overview of the recent developments in polylactide (PLA) research. Bioresource Technology 101(22), p. 8493-8501 (2010).
126. Labet, M. et al., Synthesis of polycaprolactone: a review. Chemical Society Reviews 38, p. 3484–3504 (2009).
127. Stridsberg, K.M. et al., Controlled Ring-Opening Polymerization: Polymers with designed Macromolecular Architecture, in Degradable Aliphatic Polyesters. Springer Berlin Heidelberg: Berlin, Heidelberg. (2002).
128. Okada, M., Chemical syntheses of biodegradable polymers. Progress in Polymer Science 27(1), p. 87-133 (2002).
129. Seyednejad, H. et al., Functional aliphatic polyesters for biomedical and pharmaceutical applications. Journal of Controlled Release 152(1), p. 168-176 (2011).
130. Kobayashi, S., Enzymatic polymerization: A new method of polymer synthesis. Journal of Polymer Science Part A: Polymer Chemistry 37(16), p. 3041-3056 (1999).
131. MacDonald, R.T. et al., Enzyme-Catalyzed .epsilon.-Caprolactone Ring-Opening Polymerization. Macromolecules 28(1), p. 73-78 (1995).
132. Anjum, A. et al., Microbial production of polyhydroxyalkanoates (PHAs) and its copolymers: A review of recent advancements. International Journal of Biological Macromolecules 89, p. 161-174 (2016).
Chapter I
70
133. Slater, S. et al., Multiple β-ketothiolases mediate poly (β-hydroxyalkanoate) copolymer synthesis in Ralstonia eutropha. Journal of bacteriology 180(8), p. 1979-1987 (1998).
134. Urayama, H. et al., Microstructure and Thermal Properties of Polylactides with Different L- and D-Unit Sequences: Importance of the Helical Nature of the L-Sequenced Segments. Macromolecular Materials and Engineering 288(2), p. 137-143 (2003).
135. Tsuji, H. et al., Crystallization from the melt of poly(lactide)s with different optical purities and their blends. Macromolecular Chemistry and Physics 197(10), p. 3483-3499 (1996).
136. Södergård, A. et al., Properties of lactic acid based polymers and their correlation with composition. Progress in Polymer Science 27(6), p. 1123-1163 (2002).
137. Jacobsen, S. et al., Plasticizing polylactide—the effect of different plasticizers on the mechanical properties. Polymer Engineering & Science 39(7), p. 1303-1310 (1999).
138. Gupta, A.P. et al., New emerging trends in synthetic biodegradable polymers – Polylactide: A critique. European Polymer Journal 43(10), p. 4053-4074 (2007).
139. Perego, G. et al., Effect of molecular weight and crystallinity on poly(lactic acid) mechanical properties. Journal of Applied Polymer Science 59(1), p. 37-43 (1996).
140. Karakus, K., Polycaprolactone (PCL) based polymer composites filled wheat straw flour. Kastamonu University Journal of Forestry Faculty 16(1) (2016).
141. Koleske, J.V., Blends containing poly-caprolactone and related polymers, in Polymer Blends, D.R. Paul and S. Neuman, Editors. Academic Press New York. (1978).
142. Armani, D.K. et al., Microfabrication technology for polycaprolactone, a biodegradable polymer. Journal of Micromechanics and Microengineering 10, p. 80-84 (2000).
143. Sudesh, K. et al., Synthesis, structure and properties of polyhydroxyalkanoates: biological polyesters. Progress in Polymer Science 25(10), p. 1503-1555 (2000).
144. Anderson, A.J. et al., Occurrence, metabolism, metabolic role, and industrial uses of bacterial polyhydroxyalkanoates. Microbiological Reviews 54(4), p. 450-472 (1990).
145. Brandl, H. et al., Plastics from bacteria and for bacteria: Poly(β-hydroxyalkanoates) as natural, biocompatible, and biodegradable polyesters, in Microbial Bioproducts. Springer Berlin Heidelberg: Berlin, Heidelberg. (1990).
146. Asrar, J. et al., Biosynthesis and properties of poly (3-hydroxybutyrate-co-3-hydroxyhexanoate) polymers. Biomacromolecules 3(5), p. 1006-1012 (2002).
147. Doi, Y., Microbial polyesters. VCH, Weinheim (1990). 148. Lee, S.Y., Bacterial polyhydroxyalkanoates. Biotechnology and Bioengineering 49(1), p. 1-14 (1996). 149. Kai, W. et al., Fast crystallization of poly(3-hydroxybutyrate) and poly(3-hydroxybutyrate-co-3-
hydroxyvalerate) with talc and boron nitride as nucleating agents. Polymer International 54(5), p. 780-789 (2005).
150. Bugnicourt, E. et al., The main Characteristics, Properties, Improvements, and Market Data of Polyhydroxyalkanoates, in Handbook of Sustainable Polymers: Processing and Applications, V.K. Thakur and M.K. Thakur, Editors. Pan Stanford Publishing Pte. Ltd. (2016).
151. El-Hadi, A. et al., Correlation between degree of crystallinity, morphology, glass temperature, mechanical properties and biodegradation of poly (3-hydroxyalkanoate) PHAs and their blends. Polymer Testing 21(6), p. 665-674 (2002).
152. Ikada, Y. et al., Biodegradable polyesters for medical and ecological applications. Macromolecular Rapid Communications 21(3), p. 117-132 (2000).
153. Luckachan, G.E. et al., Biodegradable Polymers- A Review on Recent Trends and Emerging Perspectives. Journal of Polymers and the Environment 19(3), p. 637-676 (2011).
154. Martin, R.T. et al., Marine-degradable polylactic acid. Green Chemistry 16(4), p. 1768-1773 (2014). 155. Celli, A. et al., Thermal properties and physical ageing of poly (l-lactic acid). Polymer 33(13), p.
2699-2703 (1992). 156. Middleton, J.C. et al., Synthetic biodegradable polymers as orthopedic devices. Biomaterials 21(23),
p. 2335-2346 (2000). 157. Gross, R.A. et al., Biodegradable Polymers for the Environment. Science 297(5582), p. 803-807
(2002). 158. Zhu, Y. et al., Surface Modification of Polycaprolactone Membrane via Aminolysis and
Biomacromolecule Immobilization for Promoting Cytocompatibility of Human Endothelial Cells. Biomacromolecules 3(6), p. 1312-1319 (2002).
Chapter I
71
159. Bosworth, L.A. et al., Physicochemical characterisation of degrading polycaprolactone scaffolds. Polymer Degradation and Stability 95(12), p. 2269-2276 (2010).
160. Lam, C.X.F. et al., Comparison of the degradation of polycaprolactone and polycaprolactone–(β-tricalcium phosphate) scaffolds in alkaline medium. Polymer International 56(6), p. 718-728 (2007).
161. Sinha, V.R. et al., Poly-ϵ-caprolactone microspheres and nanospheres: an overview. International Journal of Pharmaceutics 278(1), p. 1-23 (2004).
162. Pena, J. et al., Long term degradation of poly (ɛ-caprolactone) films in biologically related fluids. Polymer Degradation and Stability 91(7), p. 1424-1432 (2006).
163. Chen, D. et al., Polycaprolactone microparticles and their biodegradation. Polymer Degradation and Stability 67(3), p. 455-459 (2000).
164. Goldberg, D., A review of the biodegradability and utility of poly (caprolactone). Journal of Polymers and the Environment 3(2), p. 61-67 (1995).
165. Numata, K. et al., Biodegradability of poly (hydroxyalkanoate) materials. Materials 2(3), p. 1104-1126 (2009).
166. J Moskowitz, G. et al., Metabolism of Poly-β-hydroxybutyrate. II. Enzymatic Synthesis of D-(-)-β-Hydroxybutyryl Coenzyme A by an Enoyl Hydrase from Rhodospirillum rubrum.Vol. 8. (1969).
167. Hocking, P. et al., Poly(hydroxyalkanoates), in Biopolymers from renewable resources, D.L. Kaplan, Editor. Springer-Verlag Berlin Heidelberg. (1998).
168. Mergaert, J. et al., Microbial degradation of poly(3-hydroxybutyrate) and poly(3-hydroxybutyrate-co-3-hydroxyvalerate) in soils. Applied and Environmental Microbiology 59(10), p. 3233-3238 (1993).
169. Mergaert, J. et al., Biodiversity of microorganisms that degrade bacterial and synthetic polyesters. Journal of Industrial Microbiology 17(5), p. 463-469 (1996).
170. Doi, Y. et al., Biodegradation of microbial polyesters in the marine environment. Polymer degradation and stability 36(2), p. 173-177 (1992).
171. Volova, T. et al., Degradation of polyhydroxyalkanoates in eutrophic reservoir. Polymer Degradation and Stability 92(4), p. 580-586 (2007).
172. Volova, T. et al., Biodegradation of polyhydroxyalkanoates (PHAs) in the South China Sea and identification of PHA-degrading bacteria. Microbiology 80(2), p. 252-260 (2011).
173. Weng, Y.-X. et al., Biodegradation behavior of PHAs with different chemical structures under controlled composting conditions. Polymer Testing 30(4), p. 372-380 (2011).
174. Taubner, V. et al., Influence of processing parameters on the degradation of poly(L-lactide) during extrusion. Journal of Applied Polymer Science 79(12), p. 2128–2135 (2001).
175. Kopinke, F.D. et al., Thermal decomposition of biodegradable polyesters—II. Poly(lactic acid). Polymer Degradation and Stability 53(3), p. 329-342 (1996).
176. McNeill, I.C. et al., Degradation studies of some polyesters and polycarbonates—2. Polylactide: Degradation under isothermal conditions, thermal degradation mechanism and photolysis of the polymer. Polymer Degradation and Stability 11(4), p. 309-326 (1985).
177. Persenaire, O. et al., Mechanisms and kinetics of thermal degradation of poly(epsilon-caprolactone). Biomacromolecules 2(1), p. 288-294 (2001).
178. Aoyagi, Y. et al., Thermal degradation of poly[(R)-3-hydroxybutyrate], poly[ε-caprolactone], and poly[(S)-lactide]. Polymer Degradation and Stability 76(1), p. 53-59 (2002).
179. Joshi, P. et al., Degradation of polycaprolactone in supercritical fluids. Polymer Degradation and Stability 93(10), p. 1901-1908 (2008).
180. Doi, Y. et al., Biodegradation of Biosynthetic and Chemosynthetic Polyhydroxyalkanoates. Studies in Polymer Science 12, p. 39-51 (1994).
181. Grassie, N. et al., The thermal degradation of poly (-(D)-beta-hydroxybutyric acid): Part I-Identification and quantitative analysis of products. Polymer Degradation and Stability 6(1), p. 47-61 (1984).
182. Grassie, N. et al., The thermal degradation of poly (-(D)-beta-hydroxybutyric acid): Part II-Changes in molecular weight. Polymer Degradation and Stability 6(2), p. 95-103 (1984).
183. Mohanty, A.K. et al., Sustainable Bio-Composites from Renewable Resources: Opportunities and Challenges in the Green Materials World. Journal of Polymers and the Environment 10(1), p. 19-26 (2002).
184. Xiang, H. et al., Thermal depolymerization mechanisms of poly(3-hydroxybutyrate-co-3-hydroxyvalerate). Progress in Natural Science: Materials International 26(1), p. 58-64 (2016).
Chapter I
72
185. Le Troedec, M. et al., Influence of various chemical treatments on the composition and structure of hemp fibres. Composites Part A: Applied Science and Manufacturing 39(3), p. 514-522 (2008).
186. Sgriccia, N. et al., Characterization of natural fiber surfaces and natural fiber composites. Composites Part A: Applied Science and Manufacturing 39(10), p. 1632-1637 (2008).
187. Kalia, S. et al., Pretreatments of natural fibers and their application as reinforcing material in polymer composites—A review. Polymer Engineering & Science 49(7), p. 1253-1272 (2009).
188. John, M.J. et al., Effect of chemical modification on properties of hybrid fiber biocomposites. Composites Part A: Applied Science and Manufacturing 39(2), p. 352-363 (2008).
189. Ray, P.K. et al., Fine structure and mechanical properties of jute differently dried after retting. Journal of Applied Polymer Science 20(7), p. 1765-1767 (1976).
190. Da Cunha, C. et al., Synthesis and polymerization of lignin-based macromonomers. III. Radical copolymerization of lignin-based macromonomers with methyl methacrylate. Journal of Applied Polymer Science 48(5), p. 819-831 (1993).
191. Stamboulis, A. et al., Environmental Durability of Flax Fibres and their Composites based on Polypropylene Matrix. Applied Composite Materials 7(5), p. 273-294 (2000).
192. Yuan, X. et al., Effects of plasma treatment in enhancing the performance of woodfibre-polypropylene composites. Composites Part A: Applied Science and Manufacturing 35(12), p. 1363-1374 (2004).
193. Gouanvé, F. et al., Study of water sorption in modified flax fibers. Journal of Applied Polymer Science 101(6), p. 4281-4289 (2006).
194. Wong, K.K. et al., Topographical Study of Low Temperature Plasma Treated Flax Fibers. Textile Research Journal 70(10), p. 886-893 (2000).
195. Lee, S.G. et al., Characterization of surface modified flax fibers and their biocomposites with PHB. Macromolecular Symposia 197(1), p. 089-100 (2003).
196. Aziz, S.H. et al., The effect of alkalization and fibre alignment on the mechanical and thermal properties of kenaf and hemp bast fibre composites: Part 1 – polyester resin matrix. Composites Science and Technology 64(9), p. 1219-1230 (2004).
197. Rodriguez, E.S. et al., Effects of Fibers' Alkali Treatment on the Resin Transfer Molding Processing and Mechanical Properties of Jute—Vinylester Composites. Journal of Composite Materials 41(14), p. 1729-1741 (2007).
198. Dufresne, A., Nanocellulose: a new ageless bionanomaterial. Materials Today 16(6), p. 220-227 (2013).
199. Moon, R.J. et al., Cellulose nanomaterials review: structure, properties and nanocomposites. Chemical Society Reviews 40(7), p. 3941-3994 (2011).
200. Carlmark, A. et al., Grafting of cellulose by ring-opening polymerisation–A review. European Polymer Journal 48(10), p. 1646-1659 (2012).
201. Isogai, A. et al., TEMPO-oxidized cellulose nanofibers. Nanoscale 3(1), p. 71-85 (2011). 202. Park, S.-J. et al., Effect of Silane Coupling Agent on Interphase and Performance of Glass
Fibers/Unsaturated Polyester Composites. Journal of Colloid and Interface Science 242(1), p. 174-179 (2001).
203. Hu, L. et al., Effect of coupling treatment on mechanical properties of bacterial cellulose nanofibre-reinforced UPR ecocomposites. Materials Letters 63(22), p. 1952-1954 (2009).
204. Valadez-Gonzalez, A. et al., Effect of fiber surface treatment on the fiber–matrix bond strength of natural fiber reinforced composites. Composites Part B: Engineering 30(3), p. 309-320 (1999).
205. Raj, R.G. et al., Effect of chemical treatment of fibers on the mechanical properties of polyethylene-wood fiber composites. Journal of Adhesion Science and Technology 3(1), p. 55-64 (1989).
206. Kokta, B.V. et al., Composites of Polyvinyl Chloride-Wood Fibers. I. Effect of Isocyanate as a Bonding Agent. Polymer-Plastics Technology and Engineering 29(1-2), p. 87-118 (1990).
207. Samain, X. et al., Grafting biodegradable polyesters onto cellulose. Journal of Applied Polymer Science 121(2), p. 1183-1192 (2011).
208. Canché-Escamilla, G. et al., Mechanical properties of acrylate-grafted henequen cellulose fibers and their application in composites. Composites Part A: Applied Science and Manufacturing 30(3), p. 349-359 (1999).
209. Gupta, K.C. et al., Graft Copolymerization of Ethyl Acrylate onto Cellulose Using Ceric Ammonium Nitrate as Initiator in Aqueous Medium. Biomacromolecules 3(5), p. 1087-1094 (2002).
Chapter I
73
210. Nayak, P.L. et al., Grafting vinyl monomers onto silk fibers. II. Graft copolymerization of methyl methacrylate onto silk by hexavalent chromium ion. Journal of Applied Polymer Science 23(5), p. 1345-1354 (1979).
211. Tingaut, P. et al., Highly efficient and straightforward functionalization of cellulose films with thiol-ene click chemistry. Journal of Materials Chemistry 21(40), p. 16066-16076 (2011).
212. Hoyle, C.E. et al., Thiol–Ene Click Chemistry. Angewandte Chemie International Edition 49(9), p. 1540-1573 (2010).
213. Tadmor, Z. et al., Principles of Polymer Processing 2nd Edition. John Wiley & Sons, Inc. (2006). 214. Sunny, A.T. et al., 1 - Recent advances in polymer processing: the state of the art, new challenges and
opportunities, in Advances in Polymer Processing. Woodhead Publishing. (2009). 215. Utracki, L.A., Polymer Blends Handbook, ed. T.N. Kluwer Academic Publishers.Vol. 1. (2002). 216. Silviya, E.K. et al., 4 - Compounding and mixing of polymers, in Advances in Polymer Processing.
Woodhead Publishing. (2009). 217. Guaita, M. et al., Fondamenti di scienza dei polimeri, ed. Pacini. (2003). 218. Sikora, J.W., 5 - Screw extrusion, in Advances in Polymer Processing. Woodhead Publishing. (2009). 219. JeziÓrska, R.M., 6 - Reactive extrusion of polymers, in Advances in Polymer Processing. Woodhead
Publishing. (2009). 220. Bremner, T. et al., Peroxide modification of linear low-density polyethylene: A comparison of dialkyl
peroxides. Journal of Applied Polymer Science 49(5), p. 785-798 (1993). 221. Rengarajan, R. et al., Solid phase graft copolymerization. I. Effect of initiator and catalyst. Journal of
Applied Polymer Science 39(8), p. 1783-1791 (1990). 222. Ghahari, S.M. et al., Study on Functionalization of Isotactic PP with Maleic Anhydride in an Internal
Mixer and a Twin-screw Extruder. International Polymer Processing 18(3), p. 285-290 (2003). 223. Ruggeri, G. et al., Some aspects of polypropylene functionalization by free radical reactions. European
Polymer Journal 19(10), p. 863-866 (1983). 224. Bettini, S.H.P. et al., Grafting of maleic anhydride onto polypropylene by reactive processing. Part II.
Effect of rotor speed and reaction time. Journal of Applied Polymer Science 74, p. 256-263 (1999). 225. Moad, G., The synthesis of polyolefin graft copolymers by reactive extrusion. Progress in Polymer
Science 24(1), p. 81-142 (1999). 226. Jeziórska, R., Functionalization of Low Density Polyethylene with Ricinol-2-oxazoline Methyl
Maleate in a Twin-screw Extruder. International Polymer Processing 22(2), p. 122-131 (2007). 227. Kaynak, C. et al., Open Mould Processes, in Handbook of Composite Fabrication, G. Akovali, Editor.
Rapra Technology Ltd. (2001). 228. Available from: http://kids.britannica.com/students/assembly/view/53835 June 26, 2017. 229. Available from: http://injectionmoldingprocess.net/how-to-mold-polymer-clay. June 26, 2017. 230. Bajpai, P.K. et al., Development and characterization of PLA-based green composites: A review.
Journal of Thermoplastic Composite Materials 27(1), p. 52-81 (2014). 231. Nishino, T. et al., Kenaf reinforced biodegradable composite. Composites Science and Technology
63(9), p. 1281-1286 (2003). 232. Plackett, D. et al., Biodegradable composites based on l-polylactide and jute fibres. Composites
Science and Technology 63(9), p. 1287-1296 (2003). 233. Shibata, M. et al., Biocomposites Made from Short Abaca Fiber and Biodegradable Polyesters.
Macromolecular Materials and Engineering 288(1), p. 35-43 (2003). 234. Awal, A. et al., Thermorheological and mechanical properties of cellulose reinforced PLA bio-
composites. Mechanics of Materials 80, Part A, p. 87-95 (2015). 235. Csikós, Á. et al., Modification of interfacial adhesion with a functionalized polymer in PLA/wood
composites. European Polymer Journal 68, p. 592-600 (2015). 236. Yu, T. et al., Preparation and properties of short natural fiber reinforced poly(lactic acid) composites.
Transactions of Nonferrous Metals Society of China 19, p. s651-s655 (2009). 237. Hu, R. et al., Fabrication and mechanical properties of completely biodegradable hemp fiber reinforced
polylactic acid composites. Journal of Composite Materials 41(13), p. 1655–1669 (2007). 238. Yu, T. et al., Effect of fiber surface-treatments on the properties of poly(lactic acid)/ramie composites.
Composites Part A: Applied Science and Manufacturing 41(4), p. 499-505 (2010). 239. Gregorova, A. et al., Surface modification of spruce wood flour and effects on the dynamic fragility
of PLA/wood composites. Polymer Engineering & Science 51(1), p. 143-150 (2011).
240. Bax, B. et al., Impact and tensile properties of PLA/Cordenka and PLA/flax composites. Composites Science and Technology 68(7–8), p. 1601-1607 (2008).
241. Graupner, N. et al., Natural and man-made cellulose fibre-reinforced poly(lactic acid) (PLA) composites: An overview about mechanical characteristics and application areas. Composites Part A: Applied Science and Manufacturing 40(6–7), p. 810-821 (2009).
242. Song, F. et al., Biodegradable Soy Protein Isolate-Based Materials: A Review. Biomacromolecules 12(10), p. 3369-3380 (2011).
243. Wu, C.-S. et al., Polycaprolactone-Based Green Renewable Ecocomposites Made from Rice Straw Fiber: Characterization and Assessment of Mechanical and Thermal Properties. Industrial & Engineering Chemistry Research 51(8), p. 3329-3337 (2012).
244. Ruseckaite, R.A. et al., Thermal degradation of mixtures of polycaprolactone with cellulose derivatives. Polymer Degradation and Stability 81(2), p. 353-358 (2003).
245. Van de Velde, K. et al., Biopolymers: overview of several properties and consequences on their applications. Polymer Testing 21(4), p. 433-442 (2002).
246. Ludueña, L.N. et al., Processing and microstructure of PCL/clay nanocomposites. Materials Science and Engineering: A 460–461, p. 121-129 (2007).
247. Swapna, J.C. et al., Optimum Blend of Chitosan and Poly-(ε-caprolactone) for Fabrication of Films for Food Packaging Applications. Food and Bioprocess Technology 4(7), p. 1179-1185 (2011).
248. Villmow, T. et al., Influence of screw configuration, residence time, and specific mechanical energy in twin-screw extrusion of polycaprolactone/multi-walled carbon nanotube composites. Composites Science and Technology 70(14), p. 2045-2055 (2010).
249. Marrakchi, Z. et al., Biocomposites based on polycaprolactone reinforced with alfa fibre mats. Composites Part A: Applied Science and Manufacturing 43(4), p. 742-747 (2012).
250. Ludueña, L. et al., Effect of lignocellulosic filler type and content on the behavior of polycaprolactone based eco-composites for packaging applications. Carbohydrate Polymers 87(1), p. 411-421 (2012).
251. Wu, C.-S., Preparation and characterizations of polycaprolactone/green coconut fiber composites. Journal of Applied Polymer Science 115(2), p. 948-956 (2010).
252. Koenig, M.F. et al., Evaluation of crosslinked poly(caprolactone) as a biodegradable, hydrophobic coating. Polymer Degradation and Stability 45(1), p. 139-144 (1994).
253. Yan, L. et al., Flax fibre and its composites – A review. Composites Part B: Engineering 56, p. 296-317 (2014).
254. Singh, S. et al., Wood fiber reinforced bacterial bioplastic composites: Fabrication and performance evaluation. Composites Science and Technology 67(9), p. 1753-1763 (2007).
255. Singh, S. et al., Renewable resource based biocomposites from natural fiber and polyhydroxybutyrate-co-valerate (PHBV) bioplastic. Composites Part A: Applied Science and Manufacturing 39(5), p. 875-886 (2008).
256. Reinsch, V.E. et al., Crystallization of poly(hydroxybutrate-co-hydroxyvalerate) in wood fiber-reinforced composites. Journal of Applied Polymer Science 64(9), p. 1785-1796 (1997).
257. Dufresne, A. et al., Lignocellulosic flour-reinforced poly(hydroxybutyrate-co-valerate) composites. Journal of Applied Polymer Science 87(8), p. 1302-1315 (2003).
258. Luo, S. et al., Mechanical and thermal properties of environment-friendly “green” composites made
from pineapple leaf fibers and poly(hydroxybutyrate-co-valerate) resin. Polymer Composites 20(3), p. 367-378 (1999).
259. Gatenholm, P. et al., Cellulose-Polymer Composites with Improved Properties, in Advances in New Materials, J.C. Salamone and J.S. Riffle, Editors. Springer US: Boston, MA. (1992).
260. Buzarovska, A. et al., Crystallization behavior of poly(hydroxybytyrate-co-valerate) in model and bulk PHBV/kenaf fiber composites. Journal of Materials Science 42(16), p. 6501-6509 (2007).
261. Zini, E. et al., Bio-composite of bacterial poly(3-hydroxybutyrate-co-3-hydroxyhexanoate) reinforced with vegetable fibers. Composites Science and Technology 67(10), p. 2085-2094 (2007).
262. Avella, M. et al., Poly(3-hydroxybutyrate-co-3-hydroxyvalerate) and wheat straw fibre composites: thermal, mechanical properties and biodegradation behaviour. Journal of Materials Science 35(4), p. 829-836 (2000).
263. Luo, S. et al., Interfacial and mechanical properties of environment-friendly “green” composites made
from pineapple fibers and poly(hydroxybutyrate-co-valerate) resin. Journal of Materials Science 34(15), p. 3709-3719 (1999).
Chapter I
75
264. Gatenholm, P. et al., Biodegradable natural composites. I. Processing and properties. Journal of Applied Polymer Science 45(9), p. 1667-1677 (1992).
265. Gatenholm, P. et al., Biodegradable natural composites. II. Synergistic effects of processing cellulose with PHB. Journal of Applied Polymer Science 51(7), p. 1231-1237 (1994).
266. Ahankari, S.S. et al., Mechanical behaviour of agro-residue reinforced poly(3-hydroxybutyrate-co-3-hydroxyvalerate), (PHBV) green composites: A comparison with traditional polypropylene composites. Composites Science and Technology 71(5), p. 653-657 (2011).
267. Nemat Nasser, S. et al., Micromechanics: overall properties of heterogeneous materials. Second ed.: North Holland (1999).
268. Kanit, T. et al., Determination of the size of the representative volume element for random composites: statistical and numerical approach. International Journal of Solids and Structures 40(13), p. 3647-3679 (2003).
269. Aboudi, J. et al., Chapter 7 - Multiscale Modeling of Composites, in Micromechanics of Composite Materials. Butterworth-Heinemann: Oxford. (2013).
270. Vasiliev, V.V. et al., Mechanics and Analysis of Composite Materials Elservier Science Ltd (2001). 271. Kollar, L.P. et al., Micromechanics, in Mechanics of composites structures Cambridge University
Press (2003). 272. Hashin, Z., The Elastic Moduli of Heterogeneous Materials. Journal of Applied Mechanics 29(1), p.
143-150 (1962). 273. Hill, R., Elastic properties of reinforced solids: Some theoretical principles. Journal of the Mechanics
and Physics of Solids 11(5), p. 357-372 (1963). 274. Dvorak, G., Micromechanics of Composite Materials. First ed. Solid Mechanics and Its Applications.
Springer Netherlands (2013). 275. Eshelby, J.D., The Determination of the Elastic Field of an Ellipsoidal Inclusion, and Related
Problems. Proceedings of the Royal Society of London. Series A. Mathematical and Physical Sciences 241(1226), p. 376 (1957).
276. Jun, T.-S. et al., Evaluation of residual stresses and strains using the Eigenstrain Reconstruction Method. International Journal of Solids and Structures 47(13), p. 1678-1686 (2010).
277. Mura, T., General theory of eigenstrains, in Micromechanics of defects in solids. Springer Netherlands: Dordrecht. (1987).
278. Tucker Iii, C.L. et al., Stiffness predictions for unidirectional short-fiber composites: Review and evaluation. Composites Science and Technology 59(5), p. 655-671 (1999).
279. Aboudi, J. et al., Chapter 1 - Introduction, in Micromechanics of Composite Materials. Butterworth-Heinemann: Oxford. (2013).
280. Houshyar, S. et al., Modelling of polypropylene fibre-matrix composites using finite element analysis Express Polymer Letters 3(1), p. 2-12 (2009).
281. Houshyar, S. et al., The effect of fiber concentration on mechanical and thermal properties of fiber-reinforced polypropylene composites. Journal of Applied Polymer Science 96(6), p. 2260-2272 (2005).
282. Kalaprasad, G. et al., Theoretical modelling of tensile properties of short sisal fibre-reinforced low-density polyethylene composites. Journal of Materials Science 32(16), p. 4261-4267 (1997).
283. Facca, A.G. et al., Predicting the elastic modulus of natural fibre reinforced thermoplastics. Composites Part A: Applied Science and Manufacturing 37(10), p. 1660-1671 (2006).
284. Affdl, J.C.H. et al., The Halpin-Tsai equations: A review. Polymer Engineering & Science 16(5), p. 344-352 (1976).
285. Kumar, C.R. et al., Morphology and mechanical properties of thermoplastic elastomers from nylon-nitrile rubber blends. Journal of Applied Polymer Science 61(13), p. 2383-2396 (1996).
286. Pal, B. et al., Analytical Estimation of Elastic Properties of Polypropylene Fiber Matrix Composite by Finite Element Analysis. Advances in Materials Physics and Chemistry 2(1), p. 23-30 (2012).
287. Mori, T. et al., Average stress in matrix and average elastic energy of materials with misfitting inclusions. Acta Metallurgica 21(5), p. 571-574 (1973).
288. Benveniste, Y., A new approach to the application of Mori-Tanaka's theory in composite materials. Mechanics of Materials 6(2), p. 147-157 (1987).
289. Liu, L. et al., A Note on mori-tanaka's method. Acta Mechanica Solida Sinica 27(3), p. 234-244 (2014).
Chapter I
76
290. Sansalone, V. et al., Determination of the heterogeneous anisotropic elastic properties of human femoral bone: from nanoscopic to organ scale. Journal of Biomechanics 43(10), p. 1857-1863 (2010).
291. Hashin, Z. et al., The Elastic Moduli of Fiber-Reinforced Materials. Journal of Applied Mechanics 31(2), p. 223-232 (1964).
292. Lielens, G. et al., Prediction of thermo-mechanical properties for compression moulded composites. Composites Part A: Applied Science and Manufacturing 29(1), p. 63-70 (1998).
293. Laws, N. et al., The effect of fibre length on the overall moduli of composite materials. Journal of the Mechanics and Physics of Solids 27(1), p. 1-13 (1979).
294. Chou, T.-W. et al., A Self-Consistent Approach to the Elastic Stiffness of Short-Fiber Composites. Journal of Composite Materials 14(3), p. 178-188 (1980).
295. You, Y.H. et al., Adaptive meshing for finite element analysis of heterogeneous materials. Computer-Aided Design 62, p. 176-189 (2015).
296. Arns, C.H. et al., Computation of linear elastic properties from microtomographic images: Methodology and agreement between theory and experiment. Geophysics 67(5), p. 1396 (2002).
297. Alemdar, A. et al., Determination of Fiber Size Distributions of Injection Moulded Polypropylene/Natural Fibers Using X-ray Microtomography. Advanced Engineering Materials 10(1-2), p. 126-130 (2008).
77
78
Chapter II
79
Chapter II
“Science is but a perversion of itself unless it has as its ultimate goal
the betterment of humanity”
(Nikola Tesla)
Chapter II
80
FUNCTIONALIZATION OF MISCANTHUS BY PHOTO-ACTIVATED
THIOL-ENE ADDITION TO IMPROVE INTERFACIAL ADHESION WITH
POLYCAPROLACTONE
In this chapter totally green biocomposites were realized using poly(ε-caprolactone) (PCL) as
matrix, thanks to its biodegradable character and its good elasticity and Miscanthus giganteus (MIS)
fibers as reinforcement. The main goal of this work was to find a totally green chemical treatment of
fibers able to improve the adhesion matrix/reinforcement. To this aim, a fast thiol-ene reaction
between the unsaturated groups of the Miscanthus fibers and poly(mercaptopropyl)methylsiloxane
(PMMS) activated by a photo-initiator was adopted in order to improve the interfacial bonding
matrix/fibers. To this aim PCL-based biocomposites with 20 % by weight of raw, coated and grafted
MIS fibers were realized by a lab-scale extruder and injector molding in the presence of benzoyle
peroxide (BPO) as radical initiator for the in-situ grafting reaction. Specimens realized were then
characterized by tensile tests (Figure II-1) and the evidence of the grafting was studied by energy-
Table II-B1. Mechanical results for PCL/MIS composites with 5 and 20 wt % of fibers realized in
the presence or not of BPO.
Chapter II
102
II-6. REFERENCES
1. Mohanty, A.K. et al., Biofibres, biodegradable polymers and biocomposites: An overview. Macromolecular Materials and Engineering 276-277(1), p. 1-24 (2000).
2. Belgacem, M. et al., Monomers, Polymers and Composites from Renewable Resources. Elsevier (2011).
3. Alvarez, V.A. et al., Degradation of sisal fibre/Mater Bi-Y biocomposites buried in soil. Polymer Degradation and Stability 91(12), p. 3156-3162 (2006).
4. Zini, E. et al., Biodegradable Polyesters Reinforced with Surface-Modified Vegetable Fibers. Macromolecular Bioscience 4(3), p. 286-295 (2004).
5. Shibata, M. et al., Biocomposites Made from Short Abaca Fiber and Biodegradable Polyesters. Macromolecular Materials and Engineering 288(1), p. 35-43 (2003).
6. Wollerdorfer, M. et al., Influence of natural fibres on the mechanical properties of biodegradable polymers. Industrial Crops and Products 8(2), p. 105-112 (1998).
7. Mohanty, A.K. et al., Sustainable Bio-Composites from Renewable Resources: Opportunities and Challenges in the Green Materials World. Journal of Polymers and the Environment 10(1), p. 19-26 (2002).
8. Avella, M. et al., Poly(lactic acid)-based biocomposites reinforced with kenaf fibers. Journal of Applied Polymer Science 108(6), p. 3542-3551 (2008).
9. Bogoeva-Gaceva, G. et al., Natural fiber eco-composites. Polymer Composites 28(1), p. 98-107 (2007).
10. Dimzoski, B. et al., Preparation and characterization of poly(lactic acid)/rice hulls based biodegradable composites. Journal of Polymer Engineering 28(6-7), p. 369-383 (2008).
11. Faruk, O. et al., Biocomposites reinforced with natural fibers: 2000–2010. Progress in Polymer Science 37(11), p. 1552-1596 (2012).
12. Joseph, K. et al., Effect of chemical treatment on the tensile properties of short sisal fibre-reinforced polyethylene composites. Polymer 37(23), p. 5139-5149 (1996).
13. Fischer, G. et al., Biomass potentials of miscanthus, willow and poplar: results and policy implications for Eastern Europe, Northern and Central Asia. Biomass and Bioenergy 28(2), p. 119-132 (2005).
14. Collura, S. et al., Thermal behaviour of Miscanthus grasses, an alternative biological fuel. Environmental Chemistry Letters 5(1), p. 49-49 (2007).
15. Raj, R.G. et al., Use of wood fibers in thermoplastic composites: VI. Isocyanate as a bonding agent for polyethylene–wood fiber composites. Polymer Composites 9(6), p. 404-411 (1988).
16. Devi, L.U. et al., Mechanical properties of pineapple leaf fiber-reinforced polyester composites. Journal of Applied Polymer Science 64(9), p. 1739-1748 (1997).
17. Wong, S. et al., Interfacial improvements in poly(3-hydroxybutyrate)-flax fibre composites with hydrogen bonding additives. Composites Science and Technology 64(9), p. 1321-1330 (2004).
18. Shanks, R.A. et al., Thermoplastic biopolyester natural fiber composites. Journal of Applied Polymer Science 91(4), p. 2114-2121 (2004).
19. Lee, S.G. et al., Characterization of surface modified flax fibers and their biocomposites with PHB. Macromolecular Symposia 197(1), p. 089-100 (2003).
20. Haque, M.M.-U. et al., Functionalization and Compatibilization of Poly(ε-caprolactone) Composites with Cellulose Microfibres: Morphology, Thermal and Mechanical Properties. Macromolecular Materials and Engineering 297(10), p. 985-993 (2012).
21. Shibata, M. et al., Poly(ε-caprolactone) composites reinforced with short abaca fibres. Polymers and Polymer Composites 11(5), p. 359–367 (2003).
22. Kusumi, R. et al., Cellulose alkyl ester/poly(ε-caprolactone) blends: characterization of miscibility and crystallization behaviour. Cellulose 15(1), p. 1-16 (2008).
23. Wong, S. et al., Properties of Poly(3-hydroxybutyric acid) Composites with Flax Fibres Modified by Plasticiser Absorption. Macromolecular Materials and Engineering 287(10), p. 647-655 (2002).
24. Mohanty, A.K. et al., Anhydride functionalized polyhydroxyalkanoates, preparation and use thereof. 2005.
25. Chen, C. et al., Synthesis and characterization of maleated poly(3-hydroxybutyrate). Journal of Applied Polymer Science 88(3), p. 659-668 (2003).
Chapter II
103
26. Carlmark, A. et al., ATRP Grafting from Cellulose Fibers to Create Block-Copolymer Grafts. Biomacromolecules 4(6), p. 1740-1745 (2003).
27. Lönnberg, H. et al., Grafting of Cellulose Fibers with Poly(ε-caprolactone) and Poly(l-lactic acid) via Ring-Opening Polymerization. Biomacromolecules 7(7), p. 2178-2185 (2006).
28. Samain, X. et al., Grafting biodegradable polyesters onto cellulose. Journal of Applied Polymer Science 121(2), p. 1183-1192 (2011).
29. Adler, E., Lignin chemistry—past, present and future. Wood Science and Technology 11(3), p. 169-218 (1977).
30. Nimz, H., Beech Lignin—Proposal of a Constitutional Scheme. Angewandte Chemie International Edition in English 13(5), p. 313-321 (1974).
31. Piló-Veloso, D. et al., Isolamento e Análise Estrutural de Ligninas. Quimica Nova 16 (5), p. 435–448 (1993).
32. Aoyama, M. et al., Hydrolysis of lignin with dioxane-water (XVII). Isolation of a new lignol from hardwood lignin. Mokuzai Gakkaishi 25(10), p. 644-646 (1979).
33. Nascimento, M.S. et al., Phenolic Extractives and Natural Resistance of Wood, in Biodegradation - Life of Science, R. Chamy and F. Rosenkranz, Editors. InTech. (2013), p. 378.
34. Heo, J. et al., Improved Performance of Protected Catecholic Polysiloxanes for Bioinspired Wet Adhesion to Surface Oxides. Journal of the American Chemical Society 134(49), p. 20139-20145 (2012).
35. Zhou, C. et al., Poly[(mercaptopropyl)methylsiloxane] (PMMS)-based antibacterial polymer coatings prepared by a two-step sequential thiol–ene click chemistry. Chinese Chemical Letters 27(5), p. 685-688 (2016).
36. Popescu, C.-M. et al., XPS characterization of naturally aged wood. Applied Surface Science 256(5), p. 1355-1360 (2009).
37. Inari, G.N. et al., XPS characterization of wood chemical composition after heat-treatment. Surface and Interface Analysis 38(10), p. 1336-1342 (2006).
38. Dufour, A. et al., The Origin of Molecular Mobility During Biomass Pyrolysis as Revealed by In situ 1H NMR Spectroscopy. ChemSusChem 5(7), p. 1258-1265 (2012).
39. Wei, L. et al., Interfacial improvements in biocomposites based on poly(3-hydroxybutyrate) and poly(3-hydroxybutyrate-co-3-hydroxyvalerate) bioplastics reinforced and grafted with [small alpha]-cellulose fibers. Green Chemistry 17(10), p. 4800-4814 (2015).
40. Wei, L. et al., Grafting of Bacterial Polyhydroxybutyrate (PHB) onto Cellulose via In Situ Reactive Extrusion with Dicumyl Peroxide. Biomacromolecules 16(3), p. 1040-1049 (2015).
41. Cyras, V.P. et al., Relationship between processing and properties of biodegradable composites based on PCL/starch matrix and sisal fibers. Polymer Composites 22(1), p. 104-110 (2001).
42. Keller, A., Compounding and mechanical properties of biodegradable hemp fibre composites. Composites Science and Technology 63(9), p. 1307-1316 (2003).
43. Ganster, J. et al., Novel cellulose fibre reinforced thermoplastic materials. Cellulose 13(3), p. 271-280 (2006).
44. Pracella, M. et al., Functionalization, Compatibilization and Properties of Polyolefin Composites with Natural Fibers. Polymers 2(4), p. 554– 574 (2010).
45. Han, J.T. et al., Biomimetic Fabrication of Vaterite Film from Amorphous Calcium Carbonate on Polymer Melt: Effect of Polymer Chain Mobility and Functionality. Chemistry of Materials 17(1), p. 136-141 (2005).
104
Chapter III
105
Chapter III
“Only when the last tree has been cut down, the last fish been caught
and the last stream poisoned, will we realize that we cannot eat money.”
(Cree Indians Prophecy)
Chapter III
106
STUDY OF MECHANICAL PROPERTIES OF PHBHV/MISCANTHUS
GREEN COMPOSITES COMBINING EXPERIMENTAL AND
MICROMECHANICAL APPROACHES
The need to reduce the proliferation of synthetic and not-biodegradable plastics has been
already underlined in the previous chapters. The low melting temperature of PCL and its not bio-
based character are some aspects that have led us to the investigation of new bio-based and
biodegradable plastics with interesting mechanical properties. To this aim, the bacterial poly(3-
hydroxybutyrate-co-3-hydroxyvalerate) (PHBHV) has been chosen as alternative to PCL to realize
totally green biocomposites by adding Miscanthus giganteus (MIS) fibers as reinforcement,
improving in this way its mechanical properties. This work aims to be a preliminary study on the
characteristics of these biocomposites before any chemical treatment of vegetal fibers. All the
manufactured materials were studied from their synthesis to the characterization of their mechanical
properties. These last are related to the underlying microstructure using both experimental and
modeling approaches. In this study, PHBHV with 12 % of HV units (PHB88MIS12) was chosen as
matrix. Different contents of Miscanthus giganteus fibers, 5, 10, 20, 30 weight percent were thus
combined with the matrix. The samples were manufactured by extrusion and injection molding
processing at lab scale already treated in the previous chapter. The obtained samples were then
characterized by cyclic-tensile tests and microscopy. In parallel, the measured properties of the
biocomposite were also estimated using a Mori-Tanaka approach to derive the effective behavior of
the composite. As expected, the addition of reinforcement to the polymer matrix results in composites
with higher tensile moduli on the one hand, and lower failure strains and tensile strengths on the
other hand.
Chapter III
107
III-1. INTRODUCTION
In recent years the market for Wood Plastic Composites (WPCs) has grown exponentially and
is expected to exceed $ 4.5 billion in 2019 [1]. The different applications for these materials, such as
in building and construction field or automotive, make this market highly fragmented but at the same
time very attractive for many research groups and industries. Today, most of these materials are
constituted by matrixes derived from oil such as polyethylene (PE) or polypropylene (PP). Even
though natural cellulosic fibers have been successfully used with petroleum-derived polymers, the
environmental benefits of natural fiber composites can be enhanced considerably if biodegradable
polymers are used [2]. These biocomposites can be easily disposed of or composted at the end of their
life without harming the environment, which is not possible with synthetic fiber based polymer
composites.
Poly(3-hydroxyalkanoates) (PHAs) are a class of natural biodegradable polyesters accumulated
by many bacteria as carbon and energy supply when an essential nutrient is limited [3, 4]. Using
various substrates, a wide variety of PHAs can be synthesized, differing notably in the length of their
side chains [3, 5]. Two types of PHAs can be distinguished; (i) short chain length PHAs, or scl-PHAs,
possessing alkyl side chains having up to two carbon atoms, as for example the widely used poly(3-
hydroxybutyrate-co-3-hydroxyvalerate) PHBHV that is considered hereafter; (ii) medium chain
length PHAs, or mcl-PHAs, with at least three carbon atoms in their side chains. (PHAs) have been
suggested as green substitutes for conventional plastics, due to their synthesis from renewable
resources and their biodegradation by enzymatic action [6]. Owing to their biocompatibility and their
biodegradability, PHAs proved to be good candidates for biomedical applications including the
design of devices, biodegradable drug carriers and tissue engineering (TE) scaffolds [7-10]. They also
have been combined with natural cellulosic fibers such as hemp jute flax carnauba fibers, miscanthus,
bamboo [11-13], pineapple fibers [14], recycled wood fiber [15] and cellulose [16-18] to prepare
biocomposites.
Among all the existing PHAs, poly(3-hydroxybutyrate) (PHB) is certainly one of the most
important. It possesses a melting point close to that of polypropylene, better oxygen barrier property
and similar mechanical properties [6]. However, its brittleness and narrow processing temperature
window limit its application. To overcome the inferior properties of PHB, a variety of copolymers
have been synthesized by bioconversion such as the poly(3-hydroxybutyrate-co-3-hydroxyvalerate)
(PHBHV). In this study, a PHBHV with 12 % of valerate units was chosen to realize composite
Chapter III
108
materials. Among the different vegetable fibers that can be used, Miscanthus (Miscanthus giganteus)
was retained. This last is a perennial crop, highly productive, with a very efficient nitrogen-recycling
system and a very interesting energy balance due to the absence of nitrogen [19] and recently used
in composites [20-22]. A well-known phenomenon in these materials is the incompatibility between
fibers and matrix caused by the hydrophobicity of the polymer and the hydrophilic nature of the
fibers. This effect has serious consequences on the mechanical seal of the final material and this is
the reason why the presence of compatibilizer agents or additives improving the cohesion at the
matrix / fiber interface is often necessary [23]. Thus, we recently showed the possibility to improve
the adhesion between poly(ε-caprolactone) and vegetal fibers using photo-activated grafting of a
bounding agent [24]. Such a functionalization of the fibers to improve their adhesion is out of the
scope of this paper since it is first important to present here a complete study of our
PHBHV/Miscanthus composites from their synthesis to their testing and in silico characterization.
Considering different contents of Miscanthus fibers, the purpose of the present paper is to
propose a rigorous method to produce these composites and then determine their mechanical
properties. This characterization is performed using a twofold approach since, in addition to classical
mechanical testing, a micromechanical approach taking into account the geometry, volume fraction
and organization of the fibers in the matrix is carried out to estimate the effective mechanical
properties of the composite. Thus, this modelling approach could be useful to derive a model-driven
optimization of the composite synthesis in a further step.
Chapter III
109
III-2. MATERIALS AND METHODS
III-2.1. MATERIALS
Poly(3-hydroxybutyrate-co-3-hydroxyvalerate) (PHB88HV12), containing 12 % of valerate was
purchased from Goodfellow in a pelletized form. Miscanthus giganteus (MIS) fibers were provided
by Miscanplus, France. MIS fibers came from a 2014 spring crop roughly chopped and subsequently
milled until fiber length ranged between 1 and 5 mm.
III-2.2. COMPOSITE PROCESSING
Thermogravimetric analysis revealed that the MIS has ambient moisture of 5 %. For this reason,
prior to processing, both PHBHV and Miscanthus were dried in a conventional oven at 80°C for 5 h
in order to remove any moisture and then they were stored in a desiccator containing K2HPO4 prior
to processing. To investigate the effect of the fiber content on composite mechanical properties, the
following nominal values were investigated: 0, 5, 10, 20 and 30 wt %. The nominal mass content
corresponds to the mass content of MIS at the beginning of the composite processing. As shown later
(see section III-3.4), the fiber mass content of the final product may be slightly lower.
Notwithstanding this observation, the classical use of nominal contents is adopted hereafter to present
the results.
According to the nominal mass content of each phase, PHBHV and MIS were mixed together
in a lab-scale twin-screw extruder (Minilab Thermo Scientific Haake). The experiments were
performed at 160°C (TE) with a screw speed of 60 rpm (n). The retention time for the pure matrix
was of 1 minute; this time was increased to 2 minutes in order to fully disperse the fibers into the
matrix. After recirculation, the extruded molten material was transferred by means of a preheated
piston-cylinder assembly and was shot in the micro-injection unit (MiniJet Thermo Scientific Haake)
at the injection pressure for 30 seconds. A maintenance pressure, lower than that used during the
phase of injection, was applied for other 30 seconds. The collector and the mold temperatures were
set at 165°C (TI) and 45° (Tm) respectively. Parameters during the phase of injection of the material
were adjusted according to the increase of the polymer melt viscosity with the fiber content. Some of
the final optimized parameters used for the entire process are resumed in table III-1.
Chapter III
110
TE
[°C]
n
[tr/min]
TI
[°C]
Tm
[°C]
160 60 165 45
Table III-1. Some of the extrusion and injection molding parameters. TE: extrusion temperature; n:
Table III-6. Density values for MIS fibers and composites materials calculated with weight values
(a) and with a Helium pycnometer (b). νMIS_n: nominal mass fraction of Miscanthus; νMIS_m:
measured mass fraction; <ρMIS>: average density of Miscanthus; <ρC_calc>: calculated average
density of composites; <ρC_exp>: experimental average density of composites.
III-3.5. RESULTS OF NUMERICAL SIMULATION
A Mori-Tanaka model was used to estimate the overall homogenized elastic modulus of
PHBHV/MIS composites in the direction of application of the stress (E3). In a first case it is assumed
that the fibers had a cylindrical shape and were aligned along the axis of stress, leading to a
transversely isotropic effective behavior. In a second case, it is assumed that fibers had a spherical
shape realizing an isotropic system. Both models require knowledge of the volumetric fractions of
fibers in the biocomposites and the mechanical properties of the constituents. In both models, both
matrix and fibers are assumed to be isotropic. Then, their elastic behavior is fully described by their
Young modulus and Poisson ratio.
The experimental values calculated with the loading-unloading cycles lie between the two
simulations, which constitute the upper and lower limits for the elastic modulus E3.
Chapter III
119
The model with cylindrical fibers aligned in the direction of the stress seems to get closer to the
experimental values than the model with spherical fibers. Moreover, result obtained from the
cylindrical fiber model are perfectly overlapped with those obtained using the rule of mixtures
(ROM). All these results are shown in figure III-6.
Figure III-6. Results of numerical simulation: the values obtained with ROM rule are superposed
with those obtained with the Mori-Tanaka with cylindrical inclusions.
0 5 10 15 20 25 30 350
500
1000
1500
2000
2500
ROM rule Experimental values Mori-Tanaka cylindrical inclusions Mori-Tanaka spherical inclusions
You
ng M
odul
us d
irec
tion
3 (
MP
a)
Nominal fibers content (weigth %)
Chapter III
120
III-4. DISCUSSION
III-4.1. THE MECHANICAL BEHAVIOR OF PHBHV/MIS COMPOSITES
A familiar behavior in composite materials is an increase of Young's modulus and a decrease
in failure strain and stress with increase of fiber mass content. This general trend was showed in many
previous works [32-36] and it seems to be independent from the nature of the polymer matrix.
Biocomposites realized with other bio-based matrix like PLA have shown an increase by 20% when
reinforced with 20 wt % of Miscanthus fibers and a slighty decrease in Young Modulus for percentage
over 20 wt %, this last probably due to the formation of aggregates [21, 37]. Comparing the tensile
modulus and strength of the polypropylene (PP) based wood fiber composites with PHBHV–wood
fiber composites, composites realized with polypropylene have higher order of tensile properties [38].
As reported in literature the modulus and the strength of a PP composite reinforced with 30 wt % of
wood fibers are 3.33 GPa and 27.1 MPa respectively [39]. In the present work, all the phenomena
previously described were highlighted by simple tensile tests (see table III-3) and by loading-
unloading tests (see table III-4). For our samples the tensile modulus was increased by 100 % and
tensile strength decreased by 23% when reinforced with 30 wt % of Miscanthus fibers as compared
to neat PHBHV.
Although the tensile modulus was calculated with the two methods, the values obtained with
tensile tests are lower from those obtained with the cyclic procedure (figure III-3). Another important
point of these tests is the difference between the slopes of the curve during the loading and unloading
phases, the latter being more important (figure III-4). These phenomena may be explained by the fact
that the matrix is subjected to crystallization during time. PHBHV is a semicrystalline polymer and
changes in the microstructure of the polymer are possible at temperatures higher than the glass
transition one. In our case, the tests were carried out at a temperature (23°C) that is slightly higher
than the glass transition temperature of the neat matrix (5°C) evaluated in a precedent work [40]. A
possible mechanism occurring during the traction tests consists of different deformation steps. In
particular, in the first stage of deformation, changes occur exclusively in amorphous zones that
stretch. Successively, the crystalline areas start to slide parallel to the traction axis pulled from the
stretched amorphous zones and, at the end, the highly stretched polymer chains align with the axis.
Since the polymer chains may vary during the loading, slopes in the loading and unloading phases
Chapter III
121
can be different from each other. The crystallization phenomenon occurring during time was checked
“a posteriori” using both mechanical and thermal tests as showed in appendix III-6C.
III-4.2. INTERNAL MORPHOLOGY AND DENSITY OF THE BIO COMPOSITES
The morphology of the biocomposites can be perfectly identified by SEM images. Moreover,
optical microscopy can provide important information on the effect of the processing on the fibers.
Generally, when a compatibilizing agent is not used, fibers pull-out from matrix because of the poor
adhesion between the two constituents. In the case of the biocomposites manufactured by extrusion
and injection molding, a multi-layer effect along the cross section was also observed. This
phenomenon was likely caused by the flow of melted material in the mold during the phase of
injection molding and has a clear effect on the dispersion of the fibers in the matrix. These latter are
mainly located in the upper part of the cross section while pure matrix is visible in the lower part (see
figures III-5A and III-5B). This effect can be explained as the result of low interfacial adhesion
between the fibers and the matrix.
The fabrication procedure, from milling to injection molding, strongly impacts the length of the
fibers, preserving their width (see table III-5). At low contents of reinforcement in the matrix, the
fibers appear intact and long, while at high levels they are reduced to a finer powder. Keeping constant
the rotational speed and time of mixing during the extrusion process, the mechanical torque of the
extruder machine was observed to increase with the fiber content. As expected, after processing, there
is a reduction of the aspect ratio due to the breakup of the fibers during processing. Moreover, the
density of the fibers and consequently that of the composites is influenced by the degree of
compression imposed during the step of injection.
III-4.3. NUMERICAL SIMULATION
For the numerical simulation, a Mori-Tanaka model was adopted considering either cylindrical
or spherical inclusions (see sec III-2.4). The hypothesis of cylindrical fibers seems to be confirmed
from SEM observations, while the hypothesis of a transversal isotropic organization seems to be
plausible and suggested by the method adopted to realize the biocomposites. In particular, the
injection molding procedure requires the injection of the extruded material into a mold along the
vertical direction. Fibers and polymer chains are forced to enter into the mold and to basically align
with the flow direction. Accordingly, both the Young modulus calculated using the ROM (see Eq.
Chapter III
122
III-2) and the E3 modulus provided by the Mori-Tanaka model with cylindrical inclusions correspond
to the fiber direction. Although the transversely isotropic model with cylindrical inclusions is closer
to the experimental results than the one with spherical inclusions (see figure III-6), it remains a
relatively rough model, showing that the reality is different and more complex than assumed. The
fibers are likely oriented in several directions resulting in an anisotropic material. Moreover, the
method used for manufacturing the materials causes a reduction of fiber size, with effects on their
shape, the latter not being perfectly cylindrical. An avenue of research to investigate these effects
consists in performing a direct Finite Element (FE) analysis from constructed geometries mimicking
the composite or from grid built from 3D micro-CT images of the composite. Such a FEM based
analysis is proposed in the next chapter.
Chapter III
123
III-5. CONCLUSIONS AND PERSPECTIVES
Biocomposites from PHBHV and Miscanthus giganteus fibers were fabricated using extrusion
followed by injection molding. Tensile properties were evaluated using loading-unloading and simple
traction tests. Young modulus increased slowly for low fiber contents, typically 5, 10, 20 wt %. It is
necessary to attain 30 wt % of fibers to observe a significant difference in the Young modulus.
Although composites appear to be more rigid when compared to the pure matrix due to the presence
of the reinforcement, they exhibit a decrease of the tensile strength. This effect can be justified by the
lack of adhesion between the fibers and the matrix, which causes a loss of mechanical seal under
tensile stress. An evidence of this lack of adhesion is that the fibers pull out from the composites
instead of being totally immersed in the matrix as shown by SEM images. Moreover, a difference in
the Young modulus values calculated with the two methods (tensile tests and loading-unloading tests)
was observed, indicating that PHBHV crystallize during time. This phenomenon was demonstrated
by mechanical and thermal tests conducted “a posteriori” on the biocomposite with 5 wt % of raw
fibers at different times.
The mechanical behavior of these materials was modeled by a two-phase Mori-Tanaka model
where fibers were assumed either of cylindrical shape and oriented along the stress axis or spherical.
The first model provides a better approximation of the experimental values of the Young Modulus,
although in the reality fibers are not perfectly cylindrical and oriented in one direction. Indeed, fiber
size [41, 42], shape [41] and orientation [42] may strongly affect the effective elastic properties of
the composite and can explain the gap between the model and the experimental behavior. A better
understanding of fibers orientation and shape via micro-CT images may be useful to implement a
more accurate model. Moreover, the realization of PHBHV-based composites with different fibers
size could be an interesting perspective in order to further improve the mechanical properties of these
biocomposites. Lastly, as seen in the previous chapter, the adhesion between fibers and matrix can be
improved by the chemical modification of vegetal fibers [24] or by a simple reactive extrusion. To
this purpose, a green chemical modification of vegetal fibers could be adopted in order to obtain eco-
friendly composites with improved properties. However, before studying in detail the influence of
any chemical treatment on fiber/matrix adhesion, it seems more appropriate to investigate the effect
of the size and arrangement of the fibers in the matrix and their influence on the mechanical behavior
of the biocomposites, which will be the focus of the next chapter.
Chapter III
124
III-6. APPENDIX
III-6A. IDENTIFICATION OF THE YOUNG MODULUS OF THE MATRIX
The Young modulus of the matrix was identified by inverse analysis using as input data. Our
raw input data are the slopes of the force/displacement curves of pure PHBHV samples in the
unloading phase of the loading-unloading tests (see table III-4). No extensometer or other devices
allowing direct measures of stress and strain were available. The average value of these slopes, i.e.
115 N/mm, was assumed to be the stiffness of the PHBHV sample, Ks.
A 2D Comsol model was then developed to model the part of the actual sample between the
clamps of the testing machine, see figure III-A1. The effective thickness of the model was set to that
of the actual sample, i.e. H = 0.93 mm, the material was defined as linearly elastic and homogeneous,
and simple traction conditions were applied on the left and right boundaries. A parametric analysis
was then performed by letting the Young modulus of the material, EM, vary (while keeping fixed the
Poisson ratio to 0.3) and the stiffness of the sample was computed as the ratio between the total force
applied on the boundaries and the calculated elongation of the sample. The value of EM best matching
the experimental value was found to be about 1 GPa.
Figure III-A1. Actual sample (on the top) and 2D FE model of the sample (on the bottom); the
“active” part is coloured in yellow.
Since the numerical models developed afterward focus only on the “active” part of the sample,
i.e. the central rectangular region sized L B = 12 mm 2 mm, a shape factor was calculated to
transform the experimental values measured on the whole sample into values corresponding to its
Chapter III
125
active part only. This shape factor is the ratio between the stiffness of the active sample, i.e. Ka =
EM(BH)/L, and the stiffness of the sample Ks (numerically computed). It turned out that = Ka/Ks
= 1.37. Assuming that this shape factor does not change when considering a composite sample, it
allows computing the tensile modulus of composite material, Ec, based on the experimental value of
the stiffness of the composite sample, Kc, namely: Ec = KcL/(BH).
III-6B. ESTIMATION OF VOLUMETRIC FRACTION OF FIBERS IN THE SPECIMENS
The Mori-Tanaka method requires the knowledge of the volumetric fraction of the fibers in
each composite specimen. This parameter FF
C
VV is defined as the ratio between the volume of
the fibers FV and the total volume of the composite C F MV V V , the volume of the matrix phase
being MV . Note that we can measure the composite volume CV from the sample geometry. In order
to obtain F , we adopted an invasive procedure in order to separate the matrix from the fibers. First
of all, every specimen manufactured by extrusion and injection molding was weighed and then
solubilized under pressure and high temperature in 100 mL of dichloromethane with a rotation speed
of 200 rpm for 30 minutes. After stirring, the solution was filtered and the solvent was evaporated in
a static manner. Fibers were washed for 2 times with the same procedure in order to eliminate the
matrix attached. The matrix and the fibers were finally collected and their mass values MM and FM
were obtained. Then, knowing the matrix density M from the commercial provider, the fiber density
F , which may vary with processing due to the various degree of compression during the injection
molding procedure, is finally expressed as:
FF
MC
M
MMV
(III-B.1)
Finally, the fiber volume FF
F
MV
can be deduced and thus the fiber volume content F .
III-6C. EFFECT OF TIME ON MECHANICAL AND THERMAL PROPERTIES OF PHBHV-BASED COMPOSITES
In order to evaluate the change in mechanical properties due to the time, traction tests were
carried out on specimens of PHBHV95MIS5 after 8 days and then after 8 months. Results of these
tests are showed in figure III-C1. An increase in modulus and a decrease in the elongation at break
Chapter III
126
are visible after 8 months, confirming that the crystallization phenomenon during time observed from
other researchers is valid also for our composites. In a second time, we used differential scanning
calorimetry (DSC) as an additional analysis to evaluate the crystalline behavior of the biocomposites
and the results obtained are showed in figure III-C2. A shift in the melt temperature from 157 to
162°C and an increase in the crystallinity degree from 28 % to 34 % are visible after 8 months. This
result is a further confirmation of the crystallization phenomenon.
Figure III-C1. Strain-stress average curves for PHBHV95MIS5 composites tested after 8 days
(black curve) and after 8 months (red curve).
Figure III-C2. DSC first heating thermograms of PHBHV95MIS5 biocomposites tested after
8 days (black curve) and after 8 months (red curve).
0 1 2 3 4 50
5
10
15
20
25
Str
ess
(MP
a)
Strain (%)
Chapter III
127
III-7. REFERENCES
1. Available from: http://www.marketsandmarkets.com/Market-Reports/wood-plastic-composite-market-170450806.html,. June 10, 2016.
2. Gurunathan, T. et al., A review of the recent developments in biocomposites based on natural fibres and their application perspectives. Composites Part A: Applied Science and Manufacturing 77, p. 1-25 (2015).
3. Müller, H.-M. et al., Poly(hydroxyalkanoates): A Fifth Class of Physiologically Important Organic Biopolymers? Angewandte Chemie International Edition in English 32(4), p. 477-502 (1993).
4. Lao, H.-K. et al., Modification of Poly(3-hydroxybutyrate-co-3-hydroxyvalerate) Film by Chemical Graft Copolymerization. Biomacromolecules 8(2), p. 416-423 (2007).
5. Brandl, H. et al., Plastics from bacteria and for bacteria: Poly(β-hydroxyalkanoates) as natural, biocompatible, and biodegradable polyesters. Advances in Biochemical Engineering / Biotechnology 41, p. 77–93 (1990).
6. Chen, G.-Q. et al., Plastics Derived from Biological Sources: Present and Future: A Technical and Environmental Review. Chemical Reviews 112(4), p. 2082-2099 (2012).
7. Vergnol, G. et al., Multilayer approach for tuning the drug delivery from poly(3-hydroxyalkanaoate)s coatings. Reactive and Functional Polymers 72(4), p. 260-267 (2012).
8. Modjinou, T. et al., Poly(3-hydroxyalkanoate) sulfonate: From nanoparticles toward water soluble polyesters. European Polymer Journal 68, p. 471-479 (2015).
9. Vergnol, G. et al., Electrografting of a biodegradable layer as a primer adhesion coating onto a metallic stent: in vitro and in vivo evaluations. Journal of Materials Science: Materials in Medicine 24(12), p. 2729-2739 (2013).
10. Babinot, J. et al., Poly(3-hydroxyalkanoate)-derived amphiphilic graft copolymers for the design of polymersomes. Chemical Communications 48(43), p. 5364-5366 (2012).
11. Dufresne, A. et al., Lignocellulosic flour-reinforced poly(hydroxybutyrate-co-valerate) composites. Journal of Applied Polymer Science 87(8), p. 1302-1315 (2003).
12. Christian, S.J. et al., Mechanical response of PHB- and cellulose acetate natural fiber-reinforced composites for construction applications. Composites Part B: Engineering 42(7), p. 1920-1928 (2011).
13. Melo, J.D.D. et al., A biodegradable composite material based on polyhydroxybutyrate (PHB) and carnauba fibers. Composites Part B: Engineering 43(7), p. 2827-2835 (2012).
14. Luo, S. et al., Mechanical and thermal properties of environment-friendly “green” composites made
from pineapple leaf fibers and poly(hydroxybutyrate-co-valerate) resin. Polymer Composites 20(3), p. 367-378 (1999).
15. Javadi, A. et al., Processing and characterization of solid and microcellular PHBV/PBAT blend and its RWF/nanoclay composites. Composites Part A: Applied Science and Manufacturing 41(8), p. 982-990 (2010).
16. Ten, E. et al., Effects of Cellulose Nanowhiskers on Mechanical, Dielectric, and Rheological Properties of Poly(3-hydroxybutyrate-co-3-hydroxyvalerate)/Cellulose Nanowhisker Composites. Industrial & Engineering Chemistry Research 51(7), p. 2941-2951 (2012).
17. Ten, E. et al., Preparation and properties of aligned poly(3-hydroxybutyrate-co-3-hydroxyvalerate)/cellulose nanowhiskers composites. Carbohydrate Polymers 92(1), p. 206-213 (2013).
18. Samain, X. et al., Grafting biodegradable polyesters onto cellulose. Journal of Applied Polymer Science 121(2), p. 1183-1192 (2011).
19. Fischer, G. et al., Biomass potentials of miscanthus, willow and poplar: results and policy implications for Eastern Europe, Northern and Central Asia. Biomass and Bioenergy 28(2), p. 119-132 (2005).
20. Johnson, R.M. et al., Impact performance of Miscanthus/Novamont Mater-Bi® biocomposites. Polymer Testing 22(2), p. 209-215 (2003).
21. Bourmaud, A. et al., Investigations on mechanical properties of poly(propylene) and poly(lactic acid) reinforced by miscanthus fibers. Composites Part A 39(9), p. 1444–1454 (2008).
22. Gamon, G. et al., Twin-screw extrusion impact on natural fibre morphology and material properties in poly(lactic acid) based biocomposites. Industrial Crops and Products 46, p. 173-185 (2013).
23. Selke, S.E. et al., Wood fiber/polyolefin composites. Composites Part A: Applied Science and Manufacturing 35(3), p. 321-326 (2004).
24. Rodi, E.G. et al., Functionalization of Miscanthus by Photoactivated Thiol–Ene Addition to Improve Interfacial Adhesion with Polycaprolactone. ACS Sustainable Chemistry & Engineering 4(10), p. 5475-5482 (2016).
25. Berthet, M.A. et al., Impact of fibre moisture content on the structure/mechanical properties relationships of PHBV/wheat straw fibres biocomposites. Composites Science and Technology 117(Supplement C), p. 386-391 (2015).
26. Nemat Nasser, S. et al., Micromechanis: overall properties of heterogeneous materials, 2nd ed., Applied Mathematics and Mechanics. North-Holland (1999).
27. Qu, J. et al., Fundamentals of micromechanics of solids. Wiley & Sons, Hoboken, New Jersey (2006). 28. Tan, H. et al., The Mori–Tanaka method for composite materials with nonlinear interface debonding.
International Journal of Plasticity 21(10), p. 1890-1918 (2005). 29. Benveniste, Y., A new approach to the application of Mori-Tanaka's theory in composite materials.
Mechanics of Materials 6(2), p. 147-157 (1987). 30. Eshelby, J.D., The Determination of the Elastic Field of an Ellipsoidal Inclusion, and Related
Problems. Proceedings of the Royal Society of London. Series A. Mathematical and Physical Sciences 241(1226), p. 376 (1957).
31. Sansalone, V. et al., A stochastic homogenization approach to estimate bone elastic properties. Comptes Rendus Mécanique 342(5), p. 326-333 (2014).
32. Kaack, K. et al., Variation in morphology, anatomy and chemistry of stems of Miscanthus genotypes differing in mechanical properties. Industrial Crops and Products 17(2), p. 131-142 (2003).
33. Johnson, M. et al., Improvement of the impact performance of a starch based biopolymer via the incorporation of Miscanthus giganteus fibres. Industrial Crops and Products 22(3), p. 175-186 (2005).
34. Singh, S. et al., Wood fiber reinforced bacterial bioplastic composites: Fabrication and performance evaluation. Composites Science and Technology 67(9), p. 1753-1763 (2007).
35. Ahankari, S.S. et al., Mechanical behaviour of agro-residue reinforced poly(3-hydroxybutyrate-co-3-hydroxyvalerate), (PHBV) green composites: A comparison with traditional polypropylene composites. Composites Science and Technology 71(5), p. 653-657 (2011).
36. Gunning, M.A. et al., Mechanical and biodegradation performance of short natural fibre polyhydroxybutyrate composites. Polymer Testing 32(8), p. 1603-1611 (2013).
37. Ragoubi, M. et al., Effect of corona discharge treatment on mechanical and thermal properties of composites based on miscanthus fibres and polylactic acid or polypropylene matrix. Composites Part A: Applied Science and Manufacturing 43(4), p. 675-685 (2012).
38. Bledzki, A.K. et al., Mechanical performance of biocomposites based on PLA and PHBV reinforced with natural fibres – A comparative study to PP. Composites Science and Technology 70(12), p. 1687-1696 (2010).
39. Stark, N.M. et al. Effect of species and particle size on properties of wood–flour-filled polypropylene composites, functional fillers for thermoplastics, thermosets and elastomers. in Intertech Conferences. 1997. San Diego, California.
40. Lorenzini, C. et al., High glass transition temperature bio-based copolyesters from poly(3-hydroxybutyrate-co-3-hydroxyvalerate) and isosorbide. Reactive and Functional Polymers 73(12), p. 1656-1661 (2013).
41. Sansalone, V. et al., Nanostructure and effective elastic properties of bone fibril. Bioinspired, Biomimetic and Nanobiomaterials 1(3), p. 154-165 (2012).
42. Sansalone, V. et al., Multiscale modeling of materials by a multifield approach: Microscopic stress and strain distribution in fiber–matrix composites. Acta Materialia 54(13), p. 3485-3492 (2016).
129
130
131
Chapter IV
“Knowledge would be fatal. It is the uncertainty that charms one.
A mist makes things wonderful.”
(Oscar Wilde)
Chapter IV
132
EFFECT OF FIBER CONTENT, LENGTH AND ARRANGEMENT ON THE
MECHANICAL MODULUS OF PHBHV/MISCANTHUS FIBER
COMPOSITES: CONTRIBUTION OF A FINITE ELEMENT MODEL
The analytical models of Mori-Tanaka applied to the biocomposites manufactured in the
previous chapter have shown the limits of this homogenization technique which is not able to well
approximate the real elastic behavior of the biocomposites at high fibers content. Moreover, the lack
of knowledge concerning the distribution of fibers into the matrix and their effective size after
processing are two of the main factors which could affect the success of the models implemented. For
this reason, this chapter focuses on the effect of the fiber length and arrangement on the mechanical
properties of composites made of poly(3-hydroxybutyrate-co-3-hydroxyvalerate) matrix (PHBHV)
and Miscanthus giganteus fibers. Two fiber weight fractions (5% and 20%) and two different lengths
(1 mm and 45 µm) were investigated. Composites of standard dimensions were realized by extrusion
and injection molding processing. The samples were characterized by cyclic tensile tests and traction
tests. Microscopy and micro-tomography were used as fundamental techniques to have information
about fibers structure, size and arrangement in the biocomposites. Mori-Tanaka models were
implemented in a different manner, considering now that cylinders and spheres can be used to
represent long and short fibers respectively. 2D and 3D Finite element models with different fibers
patterns were used to determine not only the elastic modulus of biocomposites but also to describe
the different distribution of the stress in the matrix, taking into account by this way the non-linear
behavior of the material. This work elucidates on the effect of the fibers size and it provides important
information about the better orientation of fibers to achieve in the matrix in order to have composite
with improved mechanical properties. This last information is strictly related to the processing
method used, which is responsible of the homogeneous distribution of fibers in the matrix and also of
their partial alignment in a specific direction.
Chapter IV
133
IV-1. INTRODUCTION
In these last years, polymer scientists focused their researches on the development of new
Figure IV-10. Highly stressed regions in the matrix. Results refer to 2D and 3D FE models of 20 wt
% MIS composites (namely models 2, 4, 7, and 9). Gray regions: p1 > m,y; Red regions p1 > m,u
(See paragraph IV-3.3.2 for details).
Chapter IV
150
IV-4. DISCUSSIONS
IV-4.1. EFFECT OF FIBER LENGTH AND CONTENT ON THE MECHANICAL BEHAVIOR OF
THE BIOCOMPOSITES
A familiar behavior in PHBHV based composites is an increase in tensile modulus and a
decrease in failure strain and stress with increase of fiber mass content [22, 23]. These phenomena
were highlighted by cyclic and monotonic tensile tests (see tables IV-2 and IV-3, respectively) and
numerical simulations were used to gain further insight.
IV-4.1.1. Tensile modulus
Although the tensile modulus was calculated with both monotonic and cyclic tensile tests, we
consider only these latter in our discussion. As expected, the tensile moduli increase with the fiber
content, 20 wt % MIS composites showing a tensile modulus almost 50 % higher than short-fiber
composites. The numerical predictions of elastic moduli globally agree with the experimental
measures but in some cases substantial errors are observed (table IV-6 and figure IV-9). Despite their
simplicity, MT models perform quite well for the long-fiber composites and in particular for 20 wt %
MIS fibers composites. Therefore, the computational cost of such a model is absolutely negligible
with respect to that of a FE simulation. FE models (Unif fiber pattern) perform even better for the 5
wt % MIS composites (errors < 5%) but their accuracy decrease noticeably for 20 wt % MIS
composites, for which errors as high as 15% can be observed. As expected, being more realistic, 3D
FE models perform better than 2D ones.
Irrespective of the fiber content, long-fiber composites are stiffer than short-fiber ones. This
may be due to a shielding effect of long fibers which disappears as soon as the fibers become too
short. This shielding effect can be easily observed in the stress distributions predicted by the FE
models of short- and long-fiber composites shown in figure IV-10. Indeed, the region of matrix
characterized by high stress in long-fiber composites is much smaller than in short-fiber composites.
The difference between short- and long-fiber composites is more pronounced for 20 wt % MIS
content. Actually, the very low amount of fibers in 5 wt % MIS composites is likely unable to shield
the matrix. These conclusions are also supported by the values of m1 reported in table IV-8. Short-
fiber models (FE models 1 and 2) show the highest values of m1 (more than 40%), supporting the
idea that the matrix is largely involved in carrying the stress. In long-fiber models, matrix is more
Chapter IV
151
stressed in 5 wt % MIS models (m1 30%) than in 20 wt % MIS models (see FE models 3 & 8 vs.
4 & 9).
Comparing the experimental measures with the numerical results, it turns out that the elastic
moduli of the long-fiber composites are overestimated by the MT models and underestimated by the
FE models, irrespective of the fiber content. By contrast, all the numerical models behave similarly
with respect to short-fiber composites: experimental measures are overestimated at 5 wt % and
underestimated at 20 wt % fibers content.
The above discussion concerned models featuring regular fiber patterns. However, actual fiber
patterns are not regular. Figure IV-11 shows the microstructures of long-fiber, 5 wt % MIS (on the
left) and 20 wt % MIS (on the right) composites as imaged through micro-computed tomography
(µCT). On the right, a few individual fibers are colored differently to highlight their pattern. It is
apparent that in both composites fibers are randomly oriented and, although most of them are roughly
aligned with the sample axis, a significant fraction is not. Fiber distribution may affect the elastic
modulus of the composites and was investigated by means of 2D FEM models of long-fiber, 20 wt
% MIS composites. On the one hand, results reported in table IV-7 show that Unif, RandNoise and
RandPattern patterns provide similar estimates of the tensile modulus, the former leading to the
higher value. In view of the µCT images in figure IV-11, it appears that the concept of representative
volume element (RVE) that was defined in the introductive chapter may be delicate to be properly
defined here. Indeed, the scale separation between inclusions and the sample seems quite limited and
the statistical distribution and orientation of the fibers may vary for different samples.
Notwithstanding this limitation to provide a convenient theoretical representation of the various
synthetized composites, the RandPattern pattern seems to be the most realistic one. However, the
best estimate of the experimental elastic modulus is provided by the Unif pattern. On the other hand,
the Clust pattern provides a much smaller estimate of the tensile modulus and results in a quite
compliant composite. These results point out the importance of controlling the fiber pattern during
the processing of the composite. Indeed, a fiber pattern as regular as possible is likely to increase the
elastic modulus of the composite whereas the presence of clusters of fibers should be prevented since
it is expected to have a negative effect.
Chapter IV
152
Figure IV-11. Images of long-fiber, 5 wt % MIS (on the left) and 20 wt % MIS (on the right)
composites obtained through micro-computed tomography. A few individual fibers are colored
differently to highlight their pattern.
IV-4.1.2. Tensile strength
The increase in final strength observed in short-fiber with respect to long-fiber composites (See
figures IV-3 and IV-4) may be due to the fact that, at the same fiber content, shorter fibers are better
distributed within the volume of the sample, making the composite material more homogeneous. In
this case, the transmission of the applied stress is much more efficient and the propagation of
microcracks is more difficult than in long-fiber composites. In the case of composites realized with
long fibers, the stress concentration around the fibers is higher and the propagation and merging of
microcracks is easier due to the deflection and guidance phenomena occurring along the fibers.
Numerical results point in the same direction. Indeed, looking at the stress distribution in the
matrix shown in figure IV-10, it is apparent that the matrix in short-fiber composites is more
homogeneously stressed than in long-fiber ones where stress concentration around the fibers arise
(gray regions). This means that most of the matrix is involved in carrying stress in short-fiber
composites whereas, in long-fiber composites, only a small part of the matrix is concerned with
Chapter IV
153
transferring stress between the fibers therefore locally reaching higher values of stress. Stress
concentration is even more pronounced considering realistic fiber patterns or 3D models. In these
latter cases, very high stress levels appear in the matrix (red regions). These conclusions are supported
by the values of m1 and m2 reported in table IV-8. Indeed, the larger values of m1 and m2 are
observed in short-fiber composites (models 1 and 2).
Experimental results show that the impact of fiber length on the tensile strength of the
composite is stronger for low contents of fibers, typically 5 wt % (see figure IV-3). At 20 wt % of
fiber content, the effect of fiber length on the mechanical properties of the final composites is reduced
(see figure IV-4). This effect can be explained by the fact that at high fiber contents, the composite
cannot be considered as a real diluted and homogeneous system. For both long and short fibers, the
interaction between fibers is predominant than the interaction between matrix and fibers. These latter
tend to improve the formation of aggregates and are distributed in all the section independently of
their length, thus the stress is transmitted in the same way through the sections of the composites and
this may explain the fact that the final tensile strength does not increase.
Numerical results do not agree with the experimental results. Indeed, according to the values of
m1 and m2 reported in table IV-8, one would expect the main differences between short- and long-
fiber composites to appear at 20 wt % of fiber content. For instance, referring to the 2D FE models
with Unif fiber pattern (models 1 to 4), the ratio between the values of m1 in short- and long-fiber
models is about 3 at 20 wt % and about 1.5 at 5 wt % fiber content. A possible explanation is related
to the fact that the results of the FE models have been obtained through a linear analysis which cannot
account for microcracks transmission and deflection. Since these phenomena are likely the main
determinants of the tensile strength of the composites, an important feature is missed in these models.
Chapter IV
154
IV-5. CONCLUSIONS
Biocomposites realized with PHBHV as matrix and Miscanthus giganteus as reinforcement
were realized by extrusion and injection molding processing. The effect of fiber content, length and
arrangement were studied by the realization of composites at 5 wt % and 20 wt % of MIS fibers and
with two different lengths (1 mm and 45 µm). First results showed that processing has a great impact
on fibers size and orientation in the matrix. This limits the possibility to properly derive a convenient
RVE. The large surface area exposed from 45 µm particles facilitate stress transfer to the matrix
phase, increasing the final strength of the composites realized with 5 wt % of fibers. For composites
with higher content of fibers, typically 20 wt %, the particle-particle interaction is predominant on
the matrix-particle one and there is no evident effect of fiber length on the tensile strength. These
results were also supported by numerical simulations. The transmission of the applied stress is much
more efficient in the case of composites realized with short fibers, making more difficult the
propagation of microcracks than in long-fiber composites where fibers guide the cracks propagation.
Irrespective of the fiber content, long-fiber composites are stiffer than short-fiber ones. This effect
might be due to a shielding effect of long fibers which is not visible for short-fiber composites. This
effect is more pronounced for 20 wt % MIS content.
The developed models aim at understanding the elastic behavior of the biocomposites by
mimicking a tensile test and thus determining their elastic moduli. This parameter depends both on
fibers content and fibers distribution. Biocomposites with 20 wt % MIS fibers exhibit a modulus
higher than those with 5 wt % MIS fibers. Irrespective of the fiber content, the Mori-Tanaka models
overestimate the experimental values of long-fiber composites. Despite their simplicity, this
technique allow to a good approximation of the elastic behavior of composites realized with 20 wt %
of long fibers. Among all FE models implemented, undoubtedly 3D FE models are more realistic
than their corresponding 2D. However, it seems that no model represents perfectly the experimental
elastic modulus of biocomposites, overestimating or underestimating the real value of elastic
modulus. Despite this result, an important conclusion can be deducted from models with different
fibers distribution. In this case, composites with uniform pattern of fibers provide the best estimate
of the experimental elastic modulus, while composites with clusters of fibers provide the worsts. This
result suggests that the processing methods have to be better controlled, both during the
homogenization step occurring in the extruder and during the injection of fibers, this last causing a
partial alignment of fibers. Due to the numerical cost of 3D FEM analysis that is very much higher
than applying the Mori-Tanaka approach and the remaining uncertainties induced by the processing,
Chapter IV
155
it seems that the simpler second method should be preferred to in silico tailor the mechanical
properties of the composites.
Chapter IV
156
IV-6. APPENDIX
IV-6A. PROCESSING PARAMETERS DURING EXTRUSION AND INJECTION MOLDING
Biocomposites realized with different content of fibers (5 and 20 wt %) and two different fibers
lengths (1 mm and 45 µm) were realized by extrusion and injection molding. Some of the parameters
adopted during the processing steps are reported in table IV-A1. The processing temperatures TE, TI
and Tm corresponding to the extrusion, injection and mold temperatures respectively were maintained
the same in order to compare all the specimens. The screw speed was set to a fixed value of 60 t/min.
TE [°C] n [t/min] TI [°C] Tm [°C]
160 60 165 45
Table IV-A1. Final parameters used in extrusion and injection molding procedure.
Chapter IV
157
IV-7. REFERENCES
1. Sahari, J. et al., Natural fibre reinforced biodegradable polymer composites. Rev. Adv. Mater. Sci 30(2), p. 166-174 (2011).
2. Mohanty, A.K. et al., Natural fibers, biopolymers, and biocomposites. CRC press (2005). 3. Zhang, K. et al., Co‐Injection Molded New Green Composites from Biodegradable Polyesters and
Miscanthus Fibers. Macromolecular Materials and Engineering 299(4), p. 436-446 (2014). 4. Mohanty, A. et al., Sustainable bio-composites from renewable resources: opportunities and
challenges in the green materials world. Journal of Polymers and the Environment 10(1), p. 19-26 (2002).
5. Azizi Samir, M.A.S. et al., Review of recent research into cellulosic whiskers, their properties and their application in nanocomposite field. Biomacromolecules 6(2), p. 612-626 (2005).
6. Gallagher, L.W. et al., The effect of micron sized wood fibers in wood plastic composites. Maderas. Ciencia y tecnología 15(3), p. 357-374 (2013).
7. Stark, N.M. et al., Effects of wood fiber characteristics on mechanical properties of wood/polypropylene composites. Wood and fiber science 35(2), p. 167-174 (2007).
8. Klyosov, A.A., Wood-plastic composites. John Wiley & Sons (2007). 9. Migneault, S. et al., Effect of fiber length on processing and properties of extruded wood‐fiber/HDPE
composites. Journal of Applied Polymer Science 110(2), p. 1085-1092 (2008). 10. Bouafif, H. et al., Effects of fiber characteristics on the physical and mechanical properties of wood
plastic composites. Composites Part A: Applied Science and Manufacturing 40(12), p. 1975-1981 (2009).
11. Basiji, F. et al., The effects of fiber length and fiber loading on the mechanical properties of wood-plastic (polypropylene) composites. Turkish Journal of Agriculture and Forestry 34(3), p. 191-196 (2010).
12. Zaini, M.J. et al., The effect of filler content and size on the mechanical properties of polypropylene/oil palm wood flour composites. Polymer International 40(1), p. 51-55 (1996).
13. Venkateshwaran, N. et al., Effect of fiber length and fiber content on mechanical properties of banana fiber/epoxy composite. Journal of Reinforced Plastics and Composites 30(19), p. 1621-1627 (2011).
14. Fu, S.-Y. et al., Effects of fiber length and fiber orientation distributions on the tensile strength of short-fiber-reinforced polymers. Composites Science and Technology 56(10), p. 1179-1190 (1996).
15. Thomason, J.L. et al., Influence of fibre length and concentration on the properties of glass fibre-reinforced polypropylene: 1. Tensile and flexural modulus. Composites Part A: Applied Science and Manufacturing 27(6), p. 477-484 (1996).
16. Gamon, G. et al., Twin-screw extrusion impact on natural fibre morphology and material properties in poly (lactic acid) based biocomposites. Industrial crops and products 46, p. 173-185 (2013).
17. Kaack, K. et al., Variation in morphology, anatomy and chemistry of stems of Miscanthus genotypes differing in mechanical properties. Industrial crops and products 17(2), p. 131-142 (2003).
18. Continuum Micromechanics. 1 ed. CISM International Centre for Mechanical Sciences. Springer-Verlag Wien (1997).
19. Zaoui, A., Continuum micromechanics: survey. Journal of Engineering Mechanics 128(8), p. 808-816 (2002).
20. Eshelby, J.D., The Determination of the Elastic Field of an Ellipsoidal Inclusion, and Related Problems. Proceedings of the Royal Society of London. Series A. Mathematical and Physical Sciences 241(1226), p. 376-396 (1957).
21. Nemat-Nasser, S. et al., Micromechanics: overall properties of heterogeneous materials. Elsevier.Vol. 37. (2013).
22. Singh, S. et al., Renewable resource based biocomposites from natural fiber and polyhydroxybutyrate-co-valerate (PHBV) bioplastic. Composites Part A: Applied Science and Manufacturing 39(5), p. 875-886 (2008).
23. Avella, M. et al., Poly(3-hydroxybutyrate-co-3-hydroxyvalerate)-based biocomposites reinforced with kenaf fibers. Journal of Applied Polymer Science 104(5), p. 3192-3200 (2007).
158
Chapter V
159
Chapter V
“Experience is the name everyone gives
to his mistakes.”
(Oscar Wilde)
Chapter V
160
BIOCOMPOSITES BASED ON POLY(3-HYDROXYBUTYRATE-CO-3-HYDROXYVALERATE)
(PHBHV) AND MISCANTHUS GIGANTEUS FIBERS : MULTIPHASE MODELING OF THE
EFFECTIVE MECHANICAL BEHAVIOR OF BIOCOMPOSITE WITH IMPROVED FIBER/MATRIX
INTERFACE
This chapter is dedicated to the realization of green biocomposites based on Poly(3-hydroxybutyrate-
co-3-hydroxyvalerate) (PHBHV) and Miscanthus giganteus fibers (MIS) prepared in the presence of
dicumyl peroxide (DCP) via reactive extrusion. The objective of this study was to optimize the
interfacial adhesion between the reinforcement and the matrix, improving the mechanical properties
of the final material. To this aim, two fibers mass fractions (5 and 20 wt %) and two different fibers
sizes obtained by two opening mesh sieves (1 mm and 45 μm) were investigated. The impregnation
of fibers with DCP before processing was carried out in order to promote the PHBHV grafting onto
MIS fibers during the process, favoring in this way the interfacial adhesion between fibers and matrix
instead of the cross-linking of the matrix. All composites were realized by extrusion and injection
molding processing and then characterized by tensile tests, FTIR-ATR, SEM, DSC and XRD.
According to the improved adhesion of fibers to matrix due to DCP, we carried out an implementation
of both analytical and numerical models involving a perfect interface that can predict the effective
mechanical properties of the biocomposites. Three phases were taken into account here: cylindrical
inclusions mimicking aligned fibers and cross-linked or not matrix fractions. Due to the complexity
of the system (matrix-crosslinked matrix-fibers) and to the lack of knowledge about all the phenomena
occurring during the reactive extrusion, a mathematical approach was considered in order to obtain
information about the modulus of the cross-linked matrix and its fraction in the composites. This
study aims to estimate these last values and to clarify the effect caused by the presence of vegetal
fibers in a composite in which different reaction are promoted by DCP.
Chapter V
161
V-1. INTRODUCTION
In recent years, the attention of both academia and industry was focused on eco-friendly
materials from renewable resources due to the growing concern over environmental issues. The
pollution caused by non-biodegradable synthetic plastics led to the investigation of totally bio-based
polymers that could replace the first ones [1-7] . A class of polyesters of great interest is microbial
polymers known as poly(3-hydroxyalkanoate)s (PHAs). This family of polymers is known for the
good biodegradability and biocompatibility, being derived from bacterial synthesis [8-10]. These
polymers have been used for a wide range of applications, starting from biomedical such as for tissue
engineering and bone replacement to packaging, agriculture and personal disposal articles [8, 11-13].
Among PHAs, two of major polymers that have been largely investigated are the poly(3-
hydroxybutyrate) (PHB) and poly(3-hydroxybutyrate-co-3-hydroxyvalerate) (PHBHV). The
difficulty in processing and the very brittle character of PHB are two reasons explaining our interest
on the second polymer. Notwithstanding its better flexibility due to the HV units, its high cost limits
the usage of PHBHV in industrial applications. In this context, green composites associating such
bio-based polymers and vegetal fibers constitute an attractive alternative due to their lower cost,
biodegradability, renewability, and pretty good mechanical properties [14-27].
Among all vegetal fibers, Miscanthus giganteus has a great number of advantages, like the
possibility to be cultivated on poor quality soil and in the presence of very little amount of herbicide
and water [28-30], the high productivity in particular in temperate climates [31, 32] with good yield
also in relatively cold zones [33]. These features and the variegated mechanical properties [34, 35]
make Miscanthus as a good candidate for the production of fuels and chemicals [36] and also as
reinforcement [37]. Although all these advantages, the hydrophilic character of vegetal fibers and the
hydrophobic one of bio-based polyesters, affect the transmission of the stress, resulting in poor
mechanical properties [38].
Interfacial adhesion could be improved by different techniques already tested [39-47]. Recently
the free radical grafting initiated by peroxides has been largely used in different polymeric blends to
induce coupling between molecular chains [44, 48] but also to graft cellulosic fibers or wood
derivatives to different matrixes [49-53]. Although the biocomposites realized in precedent works
were fully characterized by mechanical and thermal tests, indicating a decrease in crystallinity after
addition of the reinforcement and DCP, no studies were carried out to predict the effective mechanical
behavior of these types of composites with compatibilized interface matrix/fibers.
Chapter V
162
Numerical models based on a kinetic approach were implemented in past years to predict the
molecular weight distribution as function of time for polyolefin crosslinked in the presence of
peroxides [54-57]. Other models based on statistical approaches [58-60] and Monte Carlo simulations
tried to predict a series of reactions that may occur during the crosslinking in order to fully
characterize this complex process [61]. Among all these methods, kinetics models were preferred to
statistical ones due to the impossibility of these last to predict the reactions as function of time, but
only as function of conversion. However, in such cases the mathematical analyses implemented were
too much simplistic for real polymers or too much specific to particular compositions or reactions
[61]. In this study we proposed an approach based on the reactive grafting initiated by DCP in order
to improve the adhesion of Miscanthus fibers to a PHBHV matrix with a consequent improvement of
the mechanical properties of the final composite. The reaction was conducted in situ using extrusion
followed by injection molding processing and the final materials were fully characterized to detect
any possible change in the crystalline structure. Starting from the experimental procedure, a modeling
strategies based on the inclusion theory of Eshelby was proposed to calculate the effective elastic
behavior of a composite realized by this technique. The confrontation between experimental and
numerical results doesn‘t provide a perfect agreement, showing that the complexity of the system and
the lack of knowledge about cross-linking and grafting phenomena occurring during the reactive
process need to be clarify more in details. In particular the elastic properties of the cross-linked matrix
and its exact fraction in the composites constitute two great limits for the implementation of realistic
models. To this aim a mathematical approach was considered in order to evaluate the change of the
elastic modulus of the cross-linked matrix as function of its fraction in the composites. This procedure
clarify the role of DCP and that of fibers in the reactive blend, quantifying a range of cross-linked
fraction matrix generated by a given content of DCP and for a given content of fibers.
Chapter V
163
V-2. EXPERIMENTAL
V-2.1 MATERIALS
Poly(3-hydroxybutyrate-co-3-hydroxyvalerate) (PHBHV) containing 12 % of valerate was
purchased from Goodfellow. Miscanthus giganteus (MIS) was provided by Miscanplus, France. It
came from a 2014 spring crop roughly chopped and subsequently milled with two different sieves
with an opening mesh of 1 mm and 45 µm. For simplicity, in this work fibers so obtained will be
referred to as long and short fibers, respectively. Dicumyl peroxide (DCP) at 98% was purchased
from Sigma-Aldrich.
V-2.2 CHEMICAL TREATMENT OF MISCANTHUS GIGANTEUS FIBERS
The surface of Miscanthus giganteus fibers was modified using the dicumyl peroxide (DCP).
All kinds of fibers were dried at 80°C in a conventional oven for 4 hours and then impregnated in a
solution (8 mg/ml) of DCP in acetone. The quantity of DCP was varied from 0.25 to 2.2 and 5 wt %
of the total mass used during the compounding step. Solutions were stirred for 30 minutes at 200 rpm
and fibers were then dried statically before the realization of composites until total evaporation of the
solvent, this last evaluated by gravimetric analysis.
V-2.3 COMPOSITE MANUFACTURING
Before processing, PHBHV pellets and raw fibers were dried under vacuum at 80°C for 4 hours
in order to avoid the presence of moisture during the mixing step. Composites with two different
content of fibers (20 wt % and 5 wt %) were realized by mixing together the matrix and the fibers,
modified or not, in a lab-scale twin-screw extruder (Minilab Thermo Scientific Haake). The
experiments were performed at 160°C (TE) with a screw speed of 60 rpm (n). The retention time for
the pure matrix was of 1 minute; this time was increased to 2 minutes in order to fully disperse the
fibers into the matrix. After recirculation, the molten material was shot in a micro-injection unit
(MiniJet Thermo Scientific Haake) at a variable pressure depending on the fibers weight fraction
applied for 30 seconds. A maintenance pressure, lower than that used during the phase of injection,
was applied for other 30 seconds. The collector and the mold temperatures were set at 165°C (TI) and
45° (Tm) respectively. The injection pressure was adjusted according to the increase of the polymer
melt viscosity with the fiber content in order to have entire specimens of 60 mm x 20 mm x 1 mm.
Chapter V
164
V-2.4 MATERIALS CHARACTERIZATION
V-2.4.1 Gel fraction
After processing, the gel content for the composite PHBHV80MIS20 (DCP) was evaluated by
solvent extraction. Samples (2 g) were extracted with 150 mL of CHCl3 using a Soxhlet for 24 hours.
The non-reacted PHBHV was extracted by the solvent, while gel and fibers were recovered after
extraction and dried until recovering constant weight. The knowledge of the total mass (gel + fibers)
and the knowledge of the fibers mass fraction present in the composite, allow to calculate the exact
weight of the gel and as consequence its percentage by gravimetric analysis using the following
expression:
Gel (%)= Wgel
W0 100 (V-1)
where Wgel and W0 are respectively the dry weights of isolated gel and of initial material.
V-2.4.2 Mechanical testing
Tensile modulus, tensile strength and failure strain for all realized composites were evaluated
using an Instron 5965 Universal Testing Machine equipped with a cell load of 100 N. All specimens
presented standard dimensions according to ASTM638 and they were stored at 23°C before testing 8
days after the realization day. The mechanical characteristics of composites were evaluated by tensile
tests. For each type of composite 10 specimens were tested at a speed of 5 mm/min. At the end of the
mechanical procedures curves were averaged in order to obtain one averaged curve representative of
each type of composite. Tensile modulus values were calculated using the procedure already
described in the chapter III (see appendix 6A).
V-2.4.3 Scanning electron microscopy (SEM)
SEM observations were performed on the fracture sections of composites using a JEOL
JSM6301F scanning electron microscope. Prior to observation, the cross sections of analyzed
specimens were sputter-coated with a thin layer of gold. Images were recorded with an acceleration
The zero-curve obtained from this function provides possible couples ( ΦG, EG ) checking the
experimental effective behavior. Note that this value is characterized by errors due to the standard
deviation associated to Eexp and to the assumptions made about EF.
V-3.5.3 Results of analytical and mathematical approach
The results of analytical simulations on the composite PHBHV80MIS20 (DCP) (sample 8) are
presented in Table V-7. The homogenized models with cylindrical and spherical inclusions
constituted the upper and lower boundary for the experimental values, the first one representing a
fully oriented configuration whereas the second one remaining isotropic. The discrepancies between
the experimental and approximated moduli can be, in part, explained by the bad repartition of the
fibers (see previous chapter).
Sample
MT model 3 phases ROM Experimental
EMT_cyl
[MPa]
EMT_sph
[MPa] EROM
[MPa] E
exp
[MPa] 8 1655 1170 1655 1358 ± 52
Table V-7. Comparison between Mori-Tanaka model, ROM and FE model and the experimental
value for the composite PHBHV80MIS20 (DCP) (sample 8).
According to the results in Table V-6, models provided unrealistic values compared to the
experimental ones. This fact means that the uncertainties presented in the previous paragraph
concerning the Young modulus of the cross-linked matrix and the choice made on that of vegetal
fibers have a great impact on the determination of the elastic modulus of a composite partially cross-
linked.
The mapping operation conducted on specimens of PHBHV95MIS5 (sample 2, 3, 5 and 6)
presents the various lines of possible. When considering fully cross-linked matrix, that is to say
asymptotic values which corresponds to the total cross-link of the matrix, it remains more or less the
same notwithstanding the DCP concentration (See Figure V-10). Moreover, the Young Modulus EG
find for these composites ranges between 0.6 and 0.8 GPa. These values agree with the experimental
modulus (0.782 GPa) evaluated on specimens of neat matrix totally cross-linked. More precisely,
lower values of modulus are obtained for higher DCP content (samples 3 and 6 were realized with
Chapter V
182
2.2 wt % of DCP), while higher values of modulus for lower DCP content (samples 2 and 5 were
realized with 0.25 wt % of DCP).
This result indicates that the cross-linking phenomenon within the matrix is predominant when
compared to the grafting of fibers.
At this point, it could be interesting to investigate the effect of the fibers content in order to
understand their role when the reaction of PHBHV with DCP takes place. To this aim, composite
PHBHV80MIS20 (sample 8) was analyzed in the same manner and the result is showed in Figure V-
11. For this sample, the value of ΦG is known and equal to 0.179. It is evident that at this gel fraction,
EG must be negative to obtain the experimental value corresponding to the composite. This fact means
that: i/ the analytical rule does not work well for high fiber content; ii/ the fiber content impacts the
PHBHV cross-linking process in addition to DCP concentration.
For all described composites it seems that the mechanical behavior oscillates from one (typical
of specimens with 5 wt % of fibers) in which the content of fibers is too low to have a remarkable
impact on the stiffness of the material, to another (typical of specimens with 20 wt % of fibers) in
which the presence of high content of reinforcement influences not only the mechanical behavior but
also the reaction of DCP. This threshold effect due to the content of fibers was verified a posteriori,
realizing PHBHV-based composites with 10 wt % of short MIS fibers and 2.2 wt % of DCP (see
appendix V-5A for more details). The properties obtained for the additional specimen demonstrate
that the composite is similar to those realized with 5 wt % of fibers in terms of mechanical behavior
and in terms of cross-linking phenomena. Moreover, the fact that the realization of this composite by
extrusion and injection molding was possible is a further clue that the high fiber content behavior was
not reached for this composite (the processing at 20 wt % of short fibers being unrealizable).
Chapter V
183
Figure V-10. Evaluation of EG as function of ΦG for composites PHBHV95MIS5 (samples 2, 3,
5 and 6).
Figure V-11. Evaluation of EG as function of ΦG for composites PHBHV80MIS20 (sample 8).
Chapter V
184
V-4. CONCLUSIONS
Free radical grafting initiated by DCP via reactive extrusion led to the improvement of the
mechanical performances of PHBHV/MIS blends. A total amount of 2.2 wt% of DCP was found to
be the optimum content in order to achieve a good adhesion fibers/matrix with consequent
improvement in final strength and elongation at break of the biocomposites. Fibers sieved with a 45
μm mesh sieve showed in general a better improvement of the mechanical properties. Although this
good result, the great interfacial area exposed by these little particles caused a limitation in the
processing step when a lot of these fibers were used. This fact led to the choice of the blend with 20
wt% of long fibers and 2.2% of DCP as the better solution realized in terms of mechanical results
obtained, less matrix degradation during the process and no significant change in crystallinity degree
due to the presence of fibers or DCP. The evidence of the grafting between the fibers and the matrix
proved by FTIR-ATR and SEM analyses and the knowledge of the gel fraction for this composite,
led to the implementation of analytical models. However, the Mori-Tanaka model with 3 phases (neat
matrix/cross-linked matrix/fibers) overestimates the mechanical behavior of the composite. The
mathematical approach used to evaluate the ranges of Young modulus of the cross-linked matrix and
of its volumetric fraction agree with the experimental values. However, this result is not true for
higher fibers content (typically 20 wt %) in which the presence of a lot of fibers influences the normal
reaction of DCP. A threshold effect correlated to the content of fibers is visible on the analyzed
specimens. The first behavior is that typical of a material without fibers while the second one of a
composite with a high content of fibers that is able to modify the normal reaction occurring between
DCP and PHBHV. This fact was also demonstrated by an additional tests with an intermediary
composition between those realized in which the mechanical behavior at 10 wt % of fibers is similar
to that of composites at 5 wt %. The possibility to substitute a part of the matrix with vegetal fibers,
the improvement of the adhesion fiber/matrix and the possibility to process these composites with
conventional techniques, all these factors suggests that the functionalization of natural fibers with
DCP appears to be a very promising way to improve the mechanical properties of any type of
polyesters.
Chapter V
185
V-5. APPENDIX
V-5A. REALIZATION OF SPECIMENS PHBHV90MIS10 (2.2 % DCP)
In order to demonstrate the threshold effect due to the fibers when the reaction of PHBHV with
DCP occurred, we decide to realize a composite with an intermediate content of short fibers (between
5 and 20 wt %) and 2.2 % of DCP. Note that the realization of a composite with 20 wt % of fibers
and the same content of DCP was impossible due to the excessive cross-linking effect in the extruder.
Once realized, specimens were tested in the same conditions than the others (See paragraph V-2.4.2
for details). Mechanical properties and results obtained by the mathematical approach are resumed in
the table V-A1 and visible in Figure V-A1 respectively.
Sample E [MPa] σmax [MPa] εr [%]
PHBHV90MIS10 (DCP) 1099 ± 65 22 ± 2.0 7 ± 1.0
Table V-A1. Tensile properties of biocomposite PHBHV90MIS10 (DCP) determined by tensile tests.
Figure V-A1. Evaluation of EG as function of ΦG for composites PHBHV90MIS10 (DCP).
The properties of PHBHV90MIS10 (DCP) composite are similar to those realized with 5 wt % of fibers
in terms of mechanical behavior and in terms of cross-linking phenomena.
Chapter V
186
V-6. REFERENCES
1. Mohanty, A.K. et al., Natural fibers, biopolymers, and biocomposites. CRC press (2005). 2. Mohanty, A. et al., Biofibers, biodegradable polymers and biocomposites: an overview.
Macromolecular materials and Engineering 276(1), p. 1-24 (2000). 3. Zhang, K. et al., Fully biodegradable and biorenewable ternary blends from Polylactide, Poly(3-
hydroxybutyrate-co-hydroxyvalerate) and Poly(butylene succinate) with balanced properties. ACS Appl. Mater. Interfaces 4, p. 3091−3101 (2012).
4. Gurunathan, T. et al., A review of the recent developments in biocomposites based on natural fibres and their application perspectives. Composites Part A: Applied Science and Manufacturing 77, p. 1-25 (2015).
5. Somleva, M.N. et al., PHA bioplastics, biochemicals, and energy from crops. Plant biotechnology journal 11(2), p. 233-252 (2013).
6. Laycock, B. et al., The chemomechanical properties of microbial polyhydroxyalkanoates. Progress in Polymer Science 39(2), p. 397-442 (2014).
7. Kai, D. et al., Polyhydroxyalkanoates: Chemical modifications toward biomedical applications. ACS Sustainable Chemistry & Engineering 2(2), p. 106-119 (2013).
8. Chen, G.-Q. et al., The application of polyhydroxyalkanoates as tissue engineering materials. Biomaterials 26(33), p. 6565-6578 (2005).
9. Chen, G.-Q. et al., Plastics derived from biological sources: present and future: a technical and environmental review. Chemical reviews 112(4), p. 2082-2099 (2011).
10. Lee, S.Y., Plastic bacteria? Progress and prospects for polyhydroxyalkanoate production in bacteria. Trends in Biotechnology 14(11), p. 431-438 (1996).
11. Sudesh, K., Molecular design and biosynthesis of biodegradable polyesters. Polymers for Advanced Technologies 11(8‐12), p. 865-872 (2000).
12. Díez-Pascual, A.M. et al., ZnO-reinforced poly (3-hydroxybutyrate-co-3-hydroxyvalerate) bionanocomposites with antimicrobial function for food packaging. ACS applied materials & interfaces 6(12), p. 9822-9834 (2014).
13. Mekonnen, T. et al., Progress in bio-based plastics and plasticizing modifications. Journal of Materials Chemistry A 1(43), p. 13379-13398 (2013).
14. Mohanty, A.K. et al., Sustainable Bio-Composites from Renewable Resources: Opportunities and Challenges in the Green Materials World. Journal of Polymers and the Environment 10(1), p. 19-26 (2002).
15. Bhardwaj, R. et al., Renewable resource-based green composites from recycled cellulose fiber and poly (3-hydroxybutyrate-co-3-hydroxyvalerate) bioplastic. Biomacromolecules 7(6), p. 2044-2051 (2006).
16. Singh, S. et al., Renewable resource based biocomposites from natural fiber and polyhydroxybutyrate-co-valerate (PHBV) bioplastic. Composites Part A: Applied Science and Manufacturing 39(5), p. 875-886 (2008).
17. Bledzki, A. et al., Mechanical performance of biocomposites based on PLA and PHBV reinforced with natural fibres–A comparative study to PP. Composites science and technology 70(12), p. 1687-1696 (2010).
18. Nagarajan, V. et al., Sustainable green composites: Value addition to agricultural residues and perennial grasses. ACS Sustainable Chemistry & Engineering 1(3), p. 325-333 (2013).
19. Nagarajan, V. et al., New engineered biocomposites from poly (3-hydroxybutyrate-co-3-hydroxyvalerate)(PHBV)/poly (butylene adipate-co-terephthalate)(PBAT) blends and switchgrass: Fabrication and performance evaluation. Industrial crops and products 42, p. 461-468 (2013).
20. Nyambo, C. et al., Polylactide-based renewable green composites from agricultural residues and their hybrids. Biomacromolecules 11(6), p. 1654-1660 (2010).
21. Jiang, L. et al., Reinforcing and toughening effects of bamboo pulp fiber on poly (3-hydroxybutyrate-co-3-hydroxyvalerate) fiber composites. Industrial & Engineering Chemistry Research 49(2), p. 572-577 (2009).
Chapter V
187
22. Ahankari, S.S. et al., Mechanical behaviour of agro-residue reinforced poly(3-hydroxybutyrate-co-3-hydroxyvalerate), (PHBV) green composites: A comparison with traditional polypropylene composites. Composites Science and Technology 71(5), p. 653-657 (2011).
23. Shibata, M. et al., Biocomposites made from short abaca fiber and biodegradable polyesters. Macromolecular Materials and Engineering 288(1), p. 35-43 (2003).
24. Wollerdorfer, M. et al., Influence of natural fibres on the mechanical properties of biodegradable polymers. Industrial Crops and Products 8(2), p. 105-112 (1998).
25. Avella, M. et al., Poly(lactic acid)-based biocomposites reinforced with kenaf fibers. Journal of Applied Polymer Science 108(6), p. 3542-3551 (2008).
26. Bogoeva‐Gaceva, G. et al., Natural fiber eco‐composites. Polymer composites 28(1), p. 98-107 (2007).
27. Faruk, O. et al., Biocomposites reinforced with natural fibers: 2000–2010. Progress in Polymer Science 37, p. 1552-1596 (2012).
28. Murnen, H.K. et al., Optimization of ammonia fiber expansion (AFEX) pretreatment and enzymatic hydrolysis of Miscanthus x giganteus to fermentable sugars. Biotechnology progress 23(4), p. 846-850 (2007).
29. Fischer, G. et al., Biomass potentials of miscanthus, willow and poplar: results and policy implications for Eastern Europe, Northern and Central Asia. Biomass and Bioenergy 28(2), p. 119-132 (2005).
30. Collura, S. et al., Thermal behaviour of Miscanthus grasses, an alternative biological fuel. Environmental Chemistry Letters 5(1), p. 49-49 (2007).
31. Dohleman, F.G. et al., More Productive Than Maize in the Midwest: How Does Miscanthus Do It? Plant Physiology 150(4), p. 2104-2115 (2009).
32. Widholm, J. et al., Miscanthus: a promising biomass crop. Adv Bot Res 56, p. 75137Hu (2010). 33. Beale, C.V. et al., Can perennial C4 grasses attain high efficiencies of radiant energy conversion in
cool climates? Plant, Cell & Environment 18(6), p. 641-650 (1995). 34. Kaack, K. et al., Morphological and mechanical properties of Miscanthus in relation to harvesting,
lodging, and growth conditions. Industrial Crops and Products 14(2), p. 145-154 (2001). 35. Park, H.-J. et al., Manufacture and properties of Miscanthus–wood particle composite boards. Journal
of wood science 58(5), p. 459-464 (2012). 36. Heaton, E.A. et al., Meeting US biofuel goals with less land: the potential of Miscanthus. Global
Change Biology 14(9), p. 2000-2014 (2008). 37. Bourmaud, A. et al., Investigations on mechanical properties of poly (propylene) and poly (lactic acid)
reinforced by miscanthus fibers. Composites Part A: Applied Science and Manufacturing 39(9), p. 1444-1454 (2008).
38. Avella, M. et al., Review Properties of blends and composites based on poly(3-hydroxy)butyrate (PHB) and poly(3-hydroxybutyrate-hydroxyvalerate) (PHBV) copolymers. Journal of Materials Science 35(3), p. 523-545 (2000).
39. Raj, R. et al., Use of wood fibers in thermoplastic composites: VI. Isocyanate as a bonding agent for polyethylene–wood fiber composites. Polymer Composites 9(6), p. 404-411 (1988).
40. Joseph, K. et al., Effect of chemical treatment on the tensile properties of short sisal fibre-reinforced polyethylene composites. Polymer 37(23), p. 5139-5149 (1996).
41. Wong, S. et al., Interfacial improvements in poly(3-hydroxybutyrate)-flax fibre composites with hydrogen bonding additives. Composites Science and Technology 64(9), p. 1321-1330 (2004).
42. Lee, S.G. et al. Characterization of surface modified flax fibers and their biocomposites with PHB. in Macromolecular symposia. 2003. Wiley Online Library.
43. Kusumi, R. et al., Cellulose alkyl ester/poly (ε-caprolactone) blends: characterization of miscibility and crystallization behaviour. Cellulose 15(1), p. 1-16 (2008).
44. Wong, S. et al., Properties of Poly (3‐hydroxybutyric acid) Composites with Flax Fibres Modified by Plasticiser Absorption. Macromolecular Materials and Engineering 287(10), p. 647-655 (2002).
45. Carlmark, A. et al., ATRP grafting from cellulose fibers to create block-copolymer grafts. Biomacromolecules 4(6), p. 1740-1745 (2003).
46. Lönnberg, H. et al., Grafting of cellulose fibers with poly (ε-caprolactone) and poly (l-lactic acid) via ring-opening polymerization. Biomacromolecules 7(7), p. 2178-2185 (2006).
47. Samain, X. et al., Grafting biodegradable polyesters onto cellulose. Journal of Applied Polymer Science 121(2), p. 1183-1192 (2011).
Chapter V
188
48. Mohanty, A.K. et al., Polyhydroxyalcanoates d'anhydride fonctionnalises, preparation et utilisation associees. 2005, Google Patents.
49. Srubar, W.V. et al., Mechanisms and impact of fiber–matrix compatibilization techniques on the material characterization of PHBV/oak wood flour engineered biobased composites. Composites Science and Technology 72(6), p. 708-715 (2012).
50. Wei, L. et al., Grafting of bacterial polyhydroxybutyrate (PHB) onto cellulose via in situ reactive extrusion with dicumyl peroxide. Biomacromolecules 16(3), p. 1040-1049 (2015).
51. Luo, S. et al., Interfacial Improvements in a Green Biopolymer Alloy of Poly(3-hydroxybutyrate-co-3-hydroxyvalerate) and Lignin via in Situ Reactive Extrusion. ACS Sustainable Chem. Eng. 4, p. 3465−3476 (2016).
52. Rodi, E.G. et al., Functionalization of Miscanthus by Photoactivated Thiol−Ene Addition to Improve
Interfacial Adhesion with Polycaprolactone. ACS Sustainable Chem. Eng. 4, p. 5475−5482 (2016). 53. Sapieha, S. et al., Dicumyl peroxide‐modified cellulose/LLDPE composites. Journal of Applied
Polymer Science 41(9‐10), p. 2039-2048 (1990). 54. Suwanda, D. et al., The reactive modification of polyethylene. II: Mathematical modeling. Polymer
Engineering & Science 33(24), p. 1592-1605 (1993). 55. Pedernera, M.N. et al., An improved kinetic model for the peroxide initiated modification of
polyethylene. Polymer Engineering & Science 39(10), p. 2085-2095 (1999). 56. Asteasuain, M. et al., Peroxide modification of polyethylene. Prediction of molecular weight
distributions by probability generating functions. Polymer 43(8), p. 2363-2373 (2002). 57. Brandolin, A. et al., Mathematical Modeling of the Reactive Modification of High− Density
Polyethylene. Effect of Vinyl Content. Industrial & Engineering Chemistry Research 46(23), p. 7561-7570 (2007).
58. Gloor, P. et al., Chemical modification of polyolefins by free radical mechanisms: a modelling and experimental study of simultaneous random scission, branching and crosslinking. Polymer 35(5), p. 1012-1030 (1994).
59. Tobita, H., Simulation model for the modification of polymers via crosslinking and degradation. Polymer 36(13), p. 2585-2596 (1995).
60. Zhu, S., Molecular weight distribution in free-radical polymer modification with cross-linking: effect of chain-length-dependent termination. Macromolecules 29(1), p. 456-461 (1996).
61. Johnston, R.T., Modelling peroxide cross-linking in polyolefins, in SPE ANTEC. 2002: San Francisco, USA.
62. Berthet, M.A. et al., Impact of fibre moisture content on the structure/mechanical properties relationships of PHBV/wheat straw fibres biocomposites. Composites Science and Technology 117, p. 386-391 (2015).
63. Cyras, V.P. et al., Relationship between processing and properties of biodegradable composites based on PCL/starch matrix and sisal fibers. Polymer Composites 22(1), p. 104-110 (2001).
64. Keller, A., Compounding and mechanical properties of biodegradable hemp fibre composites. Composites Science and Technology 63(9), p. 1307-1316 (2003).
65. Nemat-Nasser, S. et al., Micromechanics: overall properties of heterogeneous materials. Elsevier.Vol. 37. (2013).
66. Tan, H. et al., The Mori–Tanaka method for composite materials with nonlinear interface debonding. International Journal of Plasticity 21(10), p. 1890-1918 (2005).
67. Benveniste, Y., A new approach to the application of Mori-Tanaka's theory in composite materials. Mechanics of materials 6(2), p. 147-157 (1987).
68. Eshelby, J.D. The determination of the elastic field of an ellipsoidal inclusion, and related problems. in Proceedings of the Royal Society of London A: Mathematical, Physical and Engineering Sciences. 1957. The Royal Society.
69. Kaack, K. et al., Variation in morphology, anatomy and chemistry of stems of Miscanthus genotypes differing in mechanical properties. Industrial Crops and Products 17(2), p. 131-142 (2003).
189
190
Chapter VI
191
Chapter VI
“There are two possible outcomes: if the result confirms the hypothesis,
then you’ve made a measurement. If the result is contrary to the hypothesis,
then you’ve made a discovery.”
(Enrico Fermi)
Chapter VI
192
PROCESSING AND ACCELERATED AGING OF PLA/MISCANTHUS
COMPOSITES: CORRELATION BETWEEN MECHANICAL
PROPERTIES AND CHEMICAL AND PHYSICAL STRUCTURE OF THE
COMPOSITES
The production of biocomposites at large scale requires the use of abundant low cost matrix
and reinforcement, their easy availability and their processability by common industrial techniques.
In this last chapter, poly (lactic acid) (PLA) was chosen not only as green alternative to conventional
plastics such as polypropylene (PP) but also as a real inexpensive bio-based and biodegradable
matrix for the realization of PLA/Miscanthus composites. This chapter has essentially three main
goals concerning the improvement of fiber/matrix adhesion, the processing of composites and the
characterization of the long-term behavior of PLA-based composites. First of all, the chemical
modification of fibers based on the use of PMMS and DCP, successfully used in the presence of the
other matrixes treated in this work (PCL and PHBHV), was applied here to PLA. This treatment, was
used to increase the ductility of these composites and to favor the adhesion between fibers and matrix.
Secondly, two different processing methods (extrusion and injection molding vs mixing and
compression molding) were compared to identify the most appropriate process in term of matrix
structure (and possibly degradation) and consequently the final mechanical properties of the
composite. Lastly, the combined effects of different aging conditions such as temperature, UV and
humidity were evaluated, allowing to investigate the long term behavior of PLA-based composites in
different simulated environments and to well understand the degradation mechanisms of PLA.
Chapter VI
193
VI.1. INTRODUCTION
Plastics derived from petrochemical resources or made from synthetic polymers retain their
physical and chemical structure for a very long time, increasing the quantity of waste products in the
environment. Many efforts have been made from the R&D sector to substitute conventional plastics
with biodegradable ones. Among all the existing polymers, PLA, a bio-based and biodegradable
polyester has been widely produced and used in these last years. Due to its renewable origin (corn
starch, sugar beet), its easy recyclability and compostability [1] , good mechanical properties and
relatively low cost [2], PLA represent a promising candidate to replace synthetic plastics in many
applications. Moreover, this polymer can be processed by conventional techniques such as extrusion,
compression and injection molding [3, 4].
PLA has been largely used in biomedical applications for drug delivery or scaffolds due to its
hydrophobicity and biocompatibility respectively [5-7], and it has also been used for food packaging
applications [8, 9]. The polymer has been also mixed to vegetal fibers [10-13] such as kenaf [14, 15],
bamboo [16], miscanthus [17], ramie [18], cellulose [19, 20]. These fibers are biodegradable with a
low impact on the environment [21-23]. Moreover, they can be treated at processing temperature of
PLA without significant degradation or abrasion of processing equipment [24]. Although plant fibers
improve the mechanical properties of the final composite and allow to reduce the total costs, the
performances of the composite in terms of durability are limited by the external conditions at which
the composite is exposed, typically humidity, high temperature and UV exposure, as showed in a
previous works [25]. The aging of the composite is caused by a variety of mechanisms involving not
only the neat PLA, such as hydrolysis [26-28], thermal oxidation [29-31], photo oxidation [32] and
natural aging, but also the hydrophilic fibers which naturally contain moisture and that can accelerate
the degradation process [29]. This is the reason why many researchers have tried to study the effect
of aging conditions on composites realized with fibers whose surface was previously modified with
a chemical agent [33]. Another important point is the sensitivity of PLA to the processing method.
Changes in crystallinity may occur for different applied cooling rates and shear stresses levels,
causing a great variability of the mechanical properties [34, 35].
This work aims to provide a comparison on the processing (see figure VI-1) and aging methods
used for PLA and its composites realized with 20 wt % of Miscanthus giganteus (MIS) fibers. Two
kinds of chemical treatment of fibers were used: the first one was based on the grafting of PLA to
vegetal fibers in the presence of DCP (method A, figure VI-1) and the second one on the grafting of
Chapter VI
194
PLA to the fibers previously impregnated with PMMS (method B, figure VI-1). These specimens
were realized using different techniques and they were compared to composites realized with raw
fibers, as well as with the reference pure PLA matrix.
One of the main purposes of this work was to investigate the effect of three processing methods,
such as compression molding with (MC) and without mixing (C, only used for the neat PLA matrix)
and extrusion and injection molding (EI) on the thermal, mechanical and physical properties of neat
PLA and PLA/MIS composites, in which fibers were raw or modified using peroxide and siloxane as
reactants. The second purpose of this work was to understand the long-term behavior of the neat
matrix and its biocomposites under the combined effect of temperature, UV and humidity,
establishing relations between the aging conditions and the global mechanical properties of the final
materials. To this aim an accelerated photo-aging in the presence of oxygen at 47 ± 5°C and 50% of
humidity was carried out for a total time of 500 hours. This study intends to be a systematic and
rigorous investigation of processing and accelerated aging effects on PLA and its composites. The
profound knowledge of the existing relationships between mechanical strength and changes in the
macromolecular structure of the polymer will allow us to determine the optimal process to be used
for the preparation of future composite materials and the optimal life conditions of these types of
composites.
Chapter VI
195
Figure VI-1. Manufacturing methods of PLA-based composites.
Chapter VI
196
VI-2. MATERIALS AND METHODS
VI-2.1 MATERIALS
The poly(lactic acid) (PLA) used for these experiments was the Ingeo2003D purchased by
NatureWorks (USA). This grade was recommended by the producer for the extrusion process and
packaging applications. The polymer has a MFR of 6 g/10 min at 210°C and 2.16 kg load and a
density of 1.24 g/cm3. Miscanthus giganteus (MIS) was provided by Miscanplus (France). It came
from a spring crop roughly chopped and subsequently milled and riddled with a 500 μm mesh sieve.
Poly(mercaptopropyl)methylsiloxane (PMMS) was purchased from Abcr GmbH & Co. (Germany).
The dicumyl peroxide (DCP) at 98% was provided by Sigma Aldrich.
VI-2.2 CHEMICAL TREATMENT OF MISCANTHUS GIGANTEUS FIBERS
Two different reactants were used to treat the surface of vegetal fibers. In the first method, the
surface of Miscanthus giganteus fibers was modified using the PMMS as chemical agent. Fibers were
impregnated in a solution 40 g/l of PMMS in dichloromethane for one hour. More precisely 20 g of
PMMS were solubilized in 500 ml of dichloromethane and then 20 g of fibers were added to the
solution and stirred at 200 rpm. After impregnation, fibers were filtrated and dried in atmospheric
conditions until weight reached a constant value. At the end of the procedure, fibers coated with
PMMS had an average weight gain of around 27% (cf. method B in figure VI-1).
The second method consists in an impregnation of the dried fibers in a solution 8 mg/ml of DCP
in acetone. Fibers (a total amount of 8 g) were stirred for 30 minutes at 20 rpm in a solution containing
880 mg of DCP solubilized in 110 ml of acetone. They were then dried statically before the
preparation of composites (cf. method A in figure VI-1).
VI-2.3 COMPOUNDING WITH INTERNAL MIXER AND MANUFACTURE OF COMPOSITES
BY COMPRESSION MOLDING
Before processing, PLA pellets and raw fibers were dried at 80°C under vacuum for 24 hours
in order to remove moisture. PLA is very sensible to hydrolysis and as recommended by the producers
the moisture content before processing must be less than 0.025%. Matrix and fibers were mixed for
10 minutes using a Brabender W 50 EHT internal mixer operating at 180°C and 50 rpm. The
compounding consisted of two steps. At first the polymer pellets were melted in the internal mixer.
Chapter VI
197
After a decrease in the torque value was observed, 20 wt% of fibers, chemically treated or not, were
added little by little in order to prevent clustering of fibers. The mixing was continued for 10 minutes
for all composites except for those prepared using fibers modified with DCP. For the latter, in order
to avoid the crosslinking of the matrix within the Brabender, the mixing time was set to 5 minutes.
After mixing, all the blends realized, were dried at 80°C under vacuum for 24 hours and then they
were compressed to 1 mm thick plates. During the compression molding, the blends were heated at
200°C for 7 minutes. Two different steps were applied, the first one with a pressure of 20 kg/cm2 for
10 minutes and the second one at 40 kg/cm2 for 5 minutes. Mold and samples were cooled down to
room temperature with a water cooling system. All specimens were kept in a room with controlled
temperature and humidity (23° C and 50% RH) for at least 48 hours prior further testing. In alternative
to this procedure, PLA pellets were directly compressed after drying using the same conditions. The
objective was to evaluate the influence of the mixing and of the intermediary drying on the mechanical
properties of PLA alone. The mixing and compression and the simple compression will be indicated
from now with the letters MC and C respectively. Relevant parameters used are listed in the table VI-
1.
VI-2.4 COMPOUNDING WITH A TWIN-LAB EXTRUDER AND MANUFACTURE OF
SPECIMENS BY INJECTION MOLDING
PLA and raw fibers were dried at 80°C under vacuum for 24 hours before processing. Polymers
pellets and treated or untreated fibers were mixed using a lab-scale twin-screw extruder (Minilab
Thermo Scientific Haake). The experiments were performed at 180°C with a screw speed of 50 rpm.
The retention time for the pure matrix was of 1 minute; this time was increased to 2 minutes in order
to well disperse fibers into the matrix. After recirculation, the extruded molten material was
transferred and shot in a micro-injection unit (MiniJet Thermo Scientific Haake) operating at 210°C
at a fixed injection pressure for 30 seconds. A maintenance pressure, lower than that during the phase
of injection, was applied for other 30 seconds. The pressures values were adapted to the viscosity of
the molten blends in order to fill completely the mold during the injection molding. Specimens of
standard dimensions were then obtained and stored for 48h before testing. This method will be
indicated from now by the letters EI and relevant parameters are also listed in table VI-1.
Chapter VI
198
* Variable values depending on the viscosity of the blend
Table VI-1. Processing parameters for the three processing methods: TM (Melt temperature); rpm
Qualitative changes in crystallinity due to the process and to the aging were evaluated using
infrared spectroscopy on samples of neat PLA and its composites. All spectra were recorded using a
TENSOR27 Bruker apparatus equipped with an attenuated internal reflection accessory using a
diamond crystal (Digi Tech DLATGS Detector, 32 scans, 4 cm-1) in the range 500-4000 cm-1.
Chapter VI
202
VI-3.5 SIZE EXCLUSION CHROMATOGRAPHY (SEC)
The changes in molecular characteristics were obtained by size exclusion chromatography
(SEC) equipped with a refractive Index detector (Shodex) and a light scattering detector (Wyatt dawn
8+). The calibration of SEC equipment was based on polystyrene standards. All analyses were
performed in THF as the eluent at a flow rate of 1 ml*min-1. The PLA solutions in THF (10 mg*ml-
1) were prepared and analyzed. Results were treated using Astra V software. At the end of data
treatment, the molar mass and the polydispersity index were evaluated.
VI-3.6 SCANNING ELECTRON MICROSCOPY (SEM)
The morphological appearance of tensile fractured surfaces of specimens was investigated
using a Merlin Zeiss scanning electron microscopy. Samples were sputter-coated with a thin layer of
palladium in a Cressington 208 HR sputter-coater. Images were recorded with an acceleration voltage
of 10keV and at different magnifications. Different zones of specimens, with particular attention to
the interface fiber/matrix, were observed in order to have information about the effect of processing
and aging on the cohesion of fibers to matrix.
VI-4. RESULTS AND DISCUSSIONS: PART I. EFFECT OF
PROCESSING ON THE PROPERTIES OF PLA AND PLA-BASED
COMPOSITES
VI-4.1 INFLUENCE OF PROCESSING ON THE CHARACTERISTICS OF PLA EVALUATED
BY FTIR, XRD, SEC AND DSC
In this work different processing methods (see figure VI-1) already described in paragraph VI-
2.3 and VI-2.4 were used to realize specimens of neat PLA and PLA/MIS composites. This matrix is
very sensitive to the processing conditions [34, 35] and for this reason it seems necessary to
investigate the effect of processing on the microscopic structure of PLA. At first, infrared
spectroscopy analysis (FTIR) was used to detect qualitative changes in the crystallinity structure. The
principal band assignments for neat PLA were identified according to the literature data [37] and they
are listed in more details in table VI-3. Once recorded, spectra were normalized using the peak at
1454 cm-1, corresponding to the methyl group of PLA. This peak was chosen because it doesn’t vary
Chapter VI
203
significantly after chemical modification or processing. Specimens of neat PLA realized by different
processing were analyzed and spectra were recorded (figure VI-3). Extruded and injected PLA
specimens (EI) showed a decrease in C=O ester and in the C-O peaks whereas mixed and compressed
ones (MC) showed an increase in the same bands. Evident changes in the zone between 725 and 955
cm-1, which is related to the crystalline zone of PLA that are present for PLA (C) and PLA (MC)
samples as showed by the zoom of these zones in figure VI-4. However, these results provide only
qualitative information about changes in the crystalline structure of PLA.
ν (cm-1
) in literature [32, 37, 38] ν (cm-1
) in this work Attribution
3504 - νOH
2995 2995 νCH3
2945 2945 νCH3
1754 1747 νC=O
1450 1454 δCH3
1382 1382 δCH
1361 1358 δCH
1263 1261 νCOC
1193 1180 νCOC
1100 1080 νCOC
1045 1042 δC-OH
Table VI-3. Typical bands assignment for PLA.
Chapter VI
204
Figure VI-3. FTIR-ATR spectrum of PLA realized by compression (C), mixing and compression
(MC) and extrusion and injection (EI). Normalization at 1454 cm-1 assigned to δCH3.
Figure VI-4. FTIR-ATR spectra of PLA processed in different ways in the zones 1650-1850 cm-1
and 750-1350 cm-1. Normalization at 1454 cm-1 assigned to δCH3.
Other analyses, such as XRD and DSC analyses can show more precisely a change in the
crystalline structure of PLA. From literature, it is known that PLA presents one peak at 2θ = 16.4°
corresponding to the 110 reflections and two smaller peaks at 19.1° and 32° corresponding to planes
Chapter VI
205
010 and 203, respectively, in the orthorhombic lattice [39]. XRD of neat PLA specimens realized in
different ways were performed and diffractograms were compared in figure VI-5. PLA (C) and PLA
(MC) showed a typical amorphous behavior, while the PLA (EI) showed peaks typical of the
crystalline structure located at 17.2°. The difference between these XRD results is most certainly
induced by the different processing conditions used in each case. The compression molding didn’t
favor the formation of orderly polymer chains, thus inhibiting the development of polymeric crystals.
On the contrary, shear stresses applied during the extrusion or injection molding processes is likely
to cause an increase in crystallinity degree.
Figure VI-5. XRD of PLA (C) (black curve), PLA (MC) (blue curve) and PLA (EI) (red curve).
The results obtained by XRD and FTIR were confirmed by thermal analysis (see table VI-4).
Sheet of neat matrix realized in 3 different ways showed a slight decrease in TM (from 152°C to
149°C) and also an important increase in crystallinity degree from 2% for the PLA (C) (sample 1) to
19% for the PLA (MC) (sample 2) and 32% for the PLA (EI) (sample 3). Processing methods such
as extrusion or injection molding in which high shear stresses are applied are able to enhance the
crystallization of PLA. The almost completely amorphous nature of PLA (C) (sample 1) could be
explained by two distinct raisons. First of all, all specimens realized by mixing and compression were
dried twice: before mixing and between the two processing steps. In all cases drying was carried out
10 15 20 25 30 35 40
PLA(C)
Inte
nsit
y (a
.u.)
2theta (°)
PLA(EI)
PLA(MC)
Chapter VI
206
at a temperature above the Tg of the polymer (80°C for 24 hours). This intermediate drying causes a
change in the color of matrix from transparent to white (images are not reported here), the latter
occurrence suggesting an increase in crystallinity. Specimens of PLA (C) were not dried a second
time, being the dried granules directly compressed. In order to demonstrate that the temperature has
a role in the change of the crystalline structure of the polymer, specimens of PLA (C) were annealed
for 24 hours at 70°C (Tg +10°C). In this case a slight increase in crystallinity from 2 to 7% was
observed. In a second thermal cycle, temperature was increased to 100°C (Tg + 40°C) and the same
samples were reheated for 24 hours. In this case, the crystallinity degree finally observed was of 21%
The results, presented in table VI-5, show that the thermal history of the polymer plays a role on its
ability to crystallize and that the molecular movements of the polymer chains are favored by higher
temperatures. Secondly, at high compression pressure the crystallization of PLA can be prevented,
despite the low cooling rate.
The composites PLA80MIS20 (samples 4, 5) showed no significant changes in the degree of
crystallinity, while those realized in the presence of DCP (samples 6, 7) showed a decrease in TM
from 151°C (sample 6) to 147°C (sample 7), but not in the percentage of crystallinity, showing that
for these composites changes in crystallinity concerned the dimensions of crystals that became
smaller due to the extrusion and injection processing (See figure VI-6). Comparing the PLA (MC)
(sample 2) with the composite obtained in the same conditions (sample 4), an increase in crystallinity
was observed for the composites (from 19% to 25%). This result could be explained by the formation
of trans-crystalline zones formed around the fibers as showed in previous works [17, 40]. The same
comparison for the materials realized by injection molding (samples 3 and 5) showed an opposite
trend, indicating that fibers in this case did not act as nucleation points.
Chapter VI
207
Figure VI-6. DSC curves for PLA80MIS20 (DCP) (sample 6 and 7).
Sample Method
TM
[°C]
ΔHM
[J/g]
Tg
[°C]
XC
[%]
- Virgin PLA - 152 29 61 31
1 PLA C 151 2 61 2*
2 PLA MC 152 18 61 19
3 PLA EI 149 30 61 32
4 PLA80
MIS20
MC 151 19 61 25
5 PLA80
MIS20
EI 151 22 61 29
6 PLA80
MIS20
(DCP) MC 151 21 61 28
7 PLA80
MIS20
(DCP) EI 147 20 59 27
*The value of this point has been clarified in the table VI-5.
Table VI-4. Effect of process on the thermal properties of neat PLA and its composites.
120 140 160 180
6
151°C
Hea
t flo
w (
endo
up)
T (°C)
PLA80
MIS20
(DCP) (EI)
PLA80
MIS20
(DCP) (MC)
147°C
7
Chapter VI
208
Sample T1 [°C] t
1 [h] T
2 [°C] t
2 [h] Xc [%]
PLA (C) - - - - 2
PLA (C) 70 24 - - 7
PLA (C) 70 24 100 24 21
Table VI-5. Crystallinity degree of PLA(C) after heating at 70°C and 100°C for 24h.
The sensibility to moisture of PLA is a well-known problem affecting the properties of this
matrix in particular during the processing step. For this reason SEC analysis was also used to detect
all changes in molar mass (Mn) and polydispersity index (PI) of PLA samples realized by different
methods and the results are showed in table VI-6. The polydispersity index shows a little increase
from 1.2 for a virgin PLA to 1.4 for the PLA (MC/EI) (samples 2, 3). A decrease in Mn for specimens
of PLA (EI) (sample 3) is also visible. In general a decrease in molar mass occurred for specimen
subjected to high shear stresses, indicating that the processing methods have an direct impact not only
on the reduction of fibers aspect ratios (values not reported in this chapter but shown in Chapter III),
but also on the degradation of polymer chains.
Reference Sample PI Mn [g/mol]
- Virgin PLA 1.2 136000
1 PLA (C) 1.4 105000
2 PLA (MC) 1.3 111500
3 PLA (EI) 1.4 98300
Table VI-6. Molar masses (Mn) and polydispersity index (PI) of PLA realized by different
processing methods.
Chapter VI
209
VI-4.2 EFFECT OF PROCESSING ON THE MECHANICAL PROPERTIES OF NEAT PLA AND
PLA-BASED COMPOSITES
The mechanical properties, which are of fundamental importance in this study, were evaluated
through tensile tests on specimens realized by different processing methods already described and
resumed in table VI-2. In general, the addition of vegetal fibers caused an increase in elastic modulus
and a decrease in elongation at break due to the reinforcing effect of fibers as showed in previous
works [17, 41, 42]. In our case we observed an important increase in Young Modulus from 3500 MPa
(sample 2) to 5194 MPa for the composite reinforced with 20 wt % of fibers (sample 4). The value
obtained is higher than that obtained by other researchers for the same compositions and
reinforcement type, the latter reaching values of 2422 MPa. Moreover, if compared to
poly(propylene), values obtained are much higher (1270 MPa) [41].
The weak adhesion between fibers and matrix, with a consequent inability to transfer stress at
the interface between the two phases, was suggested by the decrease in final strength from neat PLA
(samples 1, 2, 3) to all composites realized (samples 4, 5, 6, 7, 8 and 9) independently from the
production method (figure VI-7). This decrease is more evident in the case of fibers modified with
PMMS indicating that this type of fibers modification didn’t have the expected result on PLA. PMMS
is a more ductile polymer than PLA, but its presence in this case is not sufficient to improve the
adhesion fibers/matrix as showed for example in other works in which a strong increase in mechanical
properties were found for poly(ε-caprolactone) (PCL)-based composites [43].
Comparing the processing methods, an increase in final strength and at the same time a decrease
in Young Modulus occurred for specimens realized by extrusion and injection molding. The increase
in final strength could be explained by the fact that shear stresses applied during extrusion and
injection molding enhance the crystallinity of PLA [35, 44, 45] . The DSC analyses showed in the
previous paragraph are a further confirmation of this result. Moreover, virgin PLA constituted by
extruded granules have the same crystallinity of extruded and injected samples. At the same time, the
degradation of the polymer matrix suggested by SEC analysis might explain the decrease in Young
Modulus.
Torque values and temperature profiles reported in figure VI-A1 (appendix VI-7A), showed
that a mixing time of ten minutes is sufficient to homogenize fibers and matrix for all composites
realized (torque and temperature profiles reach a constant value) except for composites 6 which tests
were stopped at five minutes in order to avoid the cross-linking of the matrix in the Brabender mixer.
Actually, in the case of fibers modified with DCP (samples 6, 7, 8 and 9), the expected result
was an increase in elongation at break and in final strength due to the presence of DCP as showed in
Chapter VI
210
previous works [43, 46, 47]. This increase is essentially due to an improved adhesion between the
reinforcement and the matrix that allows the material to resist to a higher stress.
However, in this study, results suggested that DCP had a negative effect on the mechanical
properties of composite, resulting in no significant change in final strength and in a decrease in Young
Modulus. Similar results were also found elsewhere [34]. In order to understand if this trend is
correlated to the DCP quantity, we tried to increase DCP content from 2.2 to 5 wt %. However, the
formed product had a totally crumbly texture (see figure VI-B1 in Appendix VI-7B) and it was
impossible to use the compression molding technique to obtain convenient specimens.
Despite PLA being an aliphatic polyester such as PCL and PHBHV, the grafting in the presence
of DCP is less efficient. In all cases DCP creates radicals able to abstract a hydrogen in the
macromolecular chain, promoting grafting, but in the case of PLA β-scission reactions may occur
explaining in this way the poor mechanical results obtained. Notwithstanding this remark, figure VI-
7 shows that these composites represent a good compromise between high Young Modulus and good
final strength. For this reason, in the next section focusing on the aging of these materials, only
specimens of PLA80MIS20 prepared with and without DCP will be taken into account. These results
were than compared to those obtained for the neat matrix. Referring to the latter, no difference in
terms of mechanical results were found for samples of neat PLA (MC) and PLA (C) (table VI-B1 in
appendix VI-7B).
Actually, one of the aims of this study is to find the best processing method in terms of rapidity,
minor cost and low impact on polymer structure and properties. The above results concerning the neat
matrix suggests that PLA can be easily processed by direct compression of granules. This procedure
allows to optimize time, reducing the degradation of the polymer matrix. However, the direct
compression can’t be used for the realization of biocomposites for which a homogenization step
(mixing or extrusion) is necessary. Although mixing and compression molding method results in
polymers with low degree of crystallinity and lower final strength, it has several advantages such as
the rapidity and the absence of orientation effect of the fibers, resulting in a more isotropic material.
Moreover this process is considered as less aggressive due to lower shear stresses applied during
mixing, resulting in a minor reduction of the fibers length (aspect ratio not reported in this work). For
all these positive features in the next section all composites subjected to certain aging conditions were
prepared by this processing technique.
Chapter VI
211
Figure VI-7. Young Modulus vs Final strength for mixed and compressed (■) and extruded and
injected (o) specimens.
VI-4.3 ANALYSIS OF FRACTURE SURFACE BY SEM
The effect of different processing can be also evaluated by SEM images recorded on the cross
section of samples after traction tests, focusing the attention on the general appearance of the matrix
and on the interface fiber/matrix. The failure type and the orientation of fibers into the continuous
phase can be evaluated. Figure VI-8 shows the comparison between a composite with 20 wt % of
fibers realized by extrusion and injection molding (EI) (figure VI-8 A) and the same composite
realized by mixing and compression molding (MC) (figure VI-8 B).
The compressed samples showed a typical brittle failure, while injected samples showed a
plastic failure. In all cases fibers were pulled out from the matrix indicating that the adhesion
fiber/matrix was poor. In the case of compressed samples it seems that the adhesion of the fibers to
the matrix is better than that of injected samples. Moreover the figures show also the different
dispersion of fibers in the continuous phase, due to the different processing techniques used. As could
be expected, compressed samples seem more isotropic than the injected ones in which an orientation
of the fibers in the direction of the material molten flux is firstly due to the extrusion and then to the
injection molding. The anisotropy and isotropy of injected and compressed samples respectively were
also verified by visual observation on the different samples (images not reported in this work).
Chapter VI
212
Figure VI-8. SEM images of PLA80MIS20 realized by extrusion and injection molding (A) and by
mixing and compression molding (B).
Chapter VI
213
VI-5. RESULTS AND DISCUSSIONS: PART II. EFFECT OF AGING ON
THE PROPERTIES OF PLA AND PLA-BASED COMPOSITES
VI-5.1 EFFECT OF AGING ON THE CRYSTALLIZATION BEHAVIOR AND DEGRADATION
OF PLA EVALUATED BY FTIR, DRX, DSC AND SEC
In this section the effect of UV, temperature, oxygen and humidity on the properties of PLA
and its composites were described. When UV are used at ambient temperature and in the absence of
humidity no change in the polymer structure was detected using FTIR, XRD and DSC analyses.
Spectra, diffractograms and thermograms of PLA (C) (sample 1’’’ in table VI-2) and PLA80MIS20
(MC) (sample 4’’’ in table VI-2) before and after aging are perfectly superimposed. These results
suggest that a UV exposure time of 250 hours has no effect on the crystallinity of PLA and its
composites in the absence of humidity and high temperature.
For this reason, a photo-oxidative aging was then carried out at 47 ± 5°C and 50% of humidity.
Accordingly to the literature [48] a new band should appear at 921 cm-1 indicating the presence of
alpha crystals. In our case, we didn’t observe this effect on the neat matrix. However, the band at 921
cm-1 appears for all composites after 250 hours of aging. Composites showed also the decrease in
C=O band, confirming that the hydrolysis of esters bonds can be favored in the presence of humidity
at high temperatures. Moreover the C=O ester bonds at 1747 cm-1 shift to 1754 cm-1 and two C=O
distributions are clearly visible after aging (figure VI-C1 appendix VI-7C). These results suggest that
the properties of neat PLA are not greatly affected under mild aging conditions, while those of
composites changes in the same conditions. More precisely, below the glass transition temperature,
the movements of the chains are limited and water cannot diffuse easily in the matrix. On the contrary,
the presence of hydrophilic and hygroscopic fibers favored the absorption of water in the blend and
the consequent hydrolysis of the matrix.
To support FTIR analysis, XRD was used also in this case to evaluate changes in the crystalline
structure of PLA and its composites due to the aging. Figure VI-C2 in the appendix VI-7C showed a
comparison between diffractograms in the range 2theta = 5-35° for a PLA (C) and a PLA80MIS20
(MC) before and after aging. The comparison revealed an important result: when UV radiation
occurred on the neat matrix for relative short time at low temperature, no changes were detected in
the crystalline structure. On the other hand, the presence of fibers caused in the same conditions a
change in the crystalline structure, the latter going from almost completely amorphous before aging
Chapter VI
214
to semicrystalline after aging. The crystalline peaks of PLA (17°, 19° and 29°) and crystalline
cellulose (22.7°) appeared after aging, showing both a change in the crystalline structure of the
polymer and in that of lignocellulosic fibers. The parameters of the orthorhombic crystalline lattice
were evaluated after XRD analysis. This procedure showed an increase of the lattice volume in the
case of composites after aging from 0.465 nm3 to 0.527 nm3.
The combined effect of temperature, UV and humidity was also studied using DSC analysis. The neat
matrix PLA (C) showed an increase in crystallinity from 2 (sample 1) to 18% after aging (sample 1’).
The sensitivity of PLA to humidity combined with high temperature, together with the almost
amorphous nature of PLA (C), favored changes in crystalline structure. Composites realized with raw
fibers did not show significant change in the crystallinity degree. On the contrary, most relevant
changes were found for the composites PLA80MIS20 (DCP) in which the accelerated aging caused a
decrease in Tg from 61°C to 56°C and in TM from 151°C to 142°C for samples 6 and 6’ respectively
as showed in figure VI-9. All the thermal results are resumed in table VI-7.
Reference Sample Aging time
[h]
TM
[°C]
ΔHf
[J/g]
Tg
[°C]
Xc
[%]
1 PLA (C) NA 151 2 61 2
1’ PLA (C) 250h 151 17 61 18
1’’ PLA (C) 500h 151 13 61 14
4 PLA80
MIS20
(MC) NA 151 19 61 25
4’ PLA80
MIS20
(MC) 250h 152 21 61 28
4’’ PLA80
MIS20
(MC) 500h 152 19 61 25
6 PLA80
MIS20
(DCP) (MC) NA 151 21 61 28
6’ PLA80
MIS20
(DCP) (MC) 250h 142 20 56 27
6’’ PLA80
MIS20
(DCP) (MC) 500h 144 21 59 28
Table VI-7. Effect of UV (λ<280nm), temperature (47±5°C) and humidity (50% RH) on neat PLA,
on composite PLA80MIS20 with and without DCP.
Chapter VI
215
Figure VI-9. DSC curves for PLA80MIS20 (DCP) specimens not aged (black curve), aged with UV
(λ<280nm) for 250h (red curve) and for 500h (bleu curve) at 47±5°C and 50% of humidity.
VI-5.2 EFFECT OF AGING ON THE MECHANICAL PROPERTIES OF NEAT PLA AND ITS
COMPOSITES
In a general case fracture will initiate from a given defect when the applied stress intensity
factor, KI, exceeds a critical value KIC, which is the material’s fracture toughness. In this study, the
stress intensity factor of PLA decreased in two cases. The first one was when vegetal fibers were
added to the mix and the second one after 250 hours of UV aging at 32°C. These results showed the
reduced ability of the composite to resist crack initiation and propagation (Table VI-8). The weak
interfacial adhesion between the two phases caused microvoids and microflows in the composites. In
this context each fiber acts as a discontinuity initiating cracks and guiding their propagation [49].
This phenomenon increases during aging.
Reference Sample Aging type KI [MPa*m^0.5]
1 PLA (C) NA 3.40 ± 0.34
4 PLA80
MIS20 (MC) NA 1.84 ± 0.10
1’’’ PLA (C) UV 2.44 ± 0.17
4’’’ PLA80
MIS20 (MC) UV 1.34 ± 0.24
Table VI-8. Stress intensity factor (KI) values for PLA (C) and PLA80MIS20 (MC) not aged (NA)
and aged for 250 hours with UV (λ<280nm) at 32°C in a dried environment.
Chapter VI
216
Secondly, an accelerated aging was conducted at 47 ± 5°C and 50% of humidity under UV in
order to understand the effect of temperature and humidity on the mechanical properties of PLA and
its composites. After aging an increase in Young Modulus can be observed for all composites. The
materials became more brittle as showed in figure VI-10. For the composites PLA80MIS20 (MC) and
PLA80MIS20 (DCP) (MC) a strong drop in final strength can be also observed (figure VI-11). The
neat matrix is not greatly affected by the aging conditions also in this case. All these effects could be
explained by the moisture absorption attributed mainly to vegetal fibers. The swelling and shrinking
caused by hydration and dehydration caused a decrease in the interfacial interaction with consequent
deterioration of the mechanical properties. The highest reduction in final strength occurred for
composites realized with DCP. For these composites a yellowish color is noted on the surface of aged
samples (images not reported in this work). This last observation might suggest the deterioration of
lignin as showed in different works [50, 51]. In particular, many groups present in the lignin structure
are able to absorb daylight, acting as preferred sites for photochemical oxidation reactions. Although
this effect can be noticed also for composites with raw fibers, probably the deterioration process is
accelerated by the presence of unreacted DCP present in the processed materials [52]. Moreover,
according to literature, acetophenone, a decomposition product of DCP, can form radicals due to the
absorption of UV light under 300 nm, favoring the composites degradation [53].
Figure VI-10. Young Modulus (E) for neat matrix (■), PLA80MIS20 (MC) (●) and
PLA80MIS20(DCP) (MC) (▲) after 250h and 500h of UV (λ<280nm) at 47±5°C and 50% of
humidity.
0
2000
4000
6000
8000
10000
12000
5000
E (
MPa
)
Time (h)
250
Chapter VI
217
Figure VI-11. Final strength for neat matrix (■), PLA80MIS20 (MC) (●) and PLA80MIS20 (DCP)
(MC) (▲) after 250h and 500h of UV (λ<280nm) at 47±5°C and 50% of humidity.
VI-5.3 EFFECT OF AGING EVALUATED BY SEM IMAGES
As showed in the previous paragraphs, the effect of aging on the chemical structure of
composites, in particular at temperatures higher than the ambient one, combined with UV and
humidity is more important for the composites than for the neat matrix. Among all composites
realized, those in which DCP is present showed a rapidly degradation. For this reason SEM images
were recorded on the cross section of composites realized with raw fibers and fibers modified with
DCP before and after aging, in order to show any eventual change in the polymer structure. Figure
VI-12 confirmed the results obtained previously. In the case of fibers modified with DCP, the
appearance of fibers surface after aging is not the same; the literature reports that at UV light under
300 nm, which correspond exactly to our case, the formation of sub products during the reaction, such
as acetophenone [53] can occur. However in our case we believe that this change might be due to the
presence of unreacted DCP that at 47°C could continue to crosslink the matrix, forming these peculiar
polymer structures on the surface of fibers.
0
10
20
30
40
50
60
70
500 0
Fina
l str
engt
h (M
Pa)
250
Time (h)
Chapter VI
218
Figure VI-12. SEM images of PLA80MIS20 (A) PLA80MIS20 (DCP) (C) not aged and PLA80MIS20
(B) PLA80MIS20 (DCP) (D) after aging (UV (λ<280nm) at 47±5°C for 250h at 50% humidity).
Chapter VI
219
VI-6. CONCLUSIONS AND PERSPECTIVES
In this work the effect of different chemical modifications, processing methods and aging
conditions were studied on PLA and PLA-based composites. The conditions adopted for processing,
in particular the cooling type and the shear stress applied level, have a great impact on the crystallinity
of the polymer, changing the mechanical properties of the final materials. All these changes were
detected using different analyses.
At a first glance, mixing and compression molding seems to be the most rapid and simple
process, and at the same time the less aggressive way to manufacture this type of composites.
However, it seems also that resulting polymers structure might be affected, resulting in an almost
completely amorphous structure. Moreover, the great advantages described about mixing and
compression molding are in contrast with certain mechanical properties, typically the final strength,
which is higher in the case of extruded and injected samples and which is the fundamental parameters
that have to be taken into account when a chemical treatment of fibers is applied. It is believed that a
change in process parameters or secondary heat treatments could yield a different crystalline structure
but this will have to be confirmed by further investigations.
In our case, the chemical modification of vegetal fibers surface adopted did not have a
significant impact on the mechanical properties of the composites, when compared with results for
PCL and PHBHV described in the previous chapters. This fact suggests that probably PLA needs a
different chemical treatment before compounding with modified fibers. The dependency of
crystallinity, mechanical properties and macromolecular changes on aging conditions confirmed that
the tensile properties can be associated with the crystallization of PLA and with the decrease in molar
mass. Humidity associated to high temperature and UV accelerate the degradation process, in
particular for composites modified with DCP indicating the residual presence of unreacted peroxide
which could start various reactions during aging.
Although chemical modification proposed in this work did not give the expected results,
composites PLA/MIS realized with raw fibers showed good mechanical properties with a Young
Modulus and a tensile strength higher than some fibers-reinforced traditional plastics, such as
polypropylene (PP)/MIS composites [54, 55]. The mechanical properties of the materials proposed
here remain higher than those obtained with PP also after different aging conditions. These facts
suggest that, acting on processing parameters it will be possible to create a defined PLA-based
Chapter VI
220
composite with specific mechanical characteristics and crystallinity that can in the future substitute
the traditional plastics.
However, the improvements in mechanical properties might be counterbalanced by a greater
sensitivity of the resulting composite to ageing, unless the stability of the latter is improved. At
present, it would seem that work in this direction might aim at reducing the effect caused by the
hydrophilic nature of the reinforcing fibers.
Chapter VI
221
VI-7. APPENDIX
VI-7A. TORQUE AND TEMPERATURE PROFILES FOR PLA AND PLA-BASED
COMPOSITES
Figure VI-A1. Torque and Temperature profiles vs Time for neat PLA and PLA/MIS composites
realized with raw or modified fibers.
Chapter VI
222
VI-7B. PROPERTIES OF PLA-BASED COMPOSITES
Sample Method E
[MPa]
σr
[MPa]
σmax
[MPa] εr
PLA C 3707± 22 57 ± 0.54 63 ± 0.23 0.07 ± 0.03
PLA MC 3510 ± 30 56 ± 2.14 61 ± 0.86 0.06 ± 0.03
Table VI-B1. Effect of mixing step on the mechanical properties of neat PLA: compressed
granules (C) and mixed and compressed granules (MC).
Figure VI-B1. Texture of composites PLA80MIS20 at 2.2% DCP (on the left) and 5% DCP
(on the right).
Chapter VI
223
VI-7C. CHARACTERIZATION OF PLA AND ITS COMPOSITES AFTER AGING
Figure VI-C1. Effect of UV, temperature and humidity on the carbonyl ester group and on the
crystalline zone (700-950 cm-1) for neat PLA, composite PLA80MIS20 and PLA80MIS20 (DCP).
Figure VI-C2. Diffractograms of PLA(C) (on the left) and PLA80MIS20 (MC) (on the right) before
(black curves) and after aging (red curves).
Chapter VI
224
VI-8. REFERENCES
1. Vink, E.T.H. et al., Applications of life cycle assessment to NatureWorks™ polylactide (PLA)
production. Polymer Degradation and Stability 80(3), p. 403-419 (2003). 2. Auras, R. et al., An Overview of Polylactides as Packaging Materials. Macromolecular Bioscience
4(9), p. 835-864 (2004). 3. Lim, L.T. et al., Processing technologies for poly(lactic acid). Progress in Polymer Science 33(8), p.
820-852 (2008). 4. Bajpai, P.K. et al., Development and characterization of PLA-based green composites. Journal of
Thermoplastic Composite Materials 27(1), p. 52-81 (2012). 5. Oh, J.K., Polylactide (PLA)-based amphiphilic block copolymers: synthesis, self-assembly, and
biomedical applications. Soft Matter 7(11), p. 5096-5108 (2011). 6. Ignatius, A.A. et al., In vitro biocompatibility of bioresorbable polymers: poly(L, DL-lactide) and
poly(L-lactide-co-glycolide). Biomaterials 17(8), p. 831-839 (1996). 7. Kim, K. et al., Control of degradation rate and hydrophilicity in electrospun non-woven poly(d,l-
lactide) nanofiber scaffolds for biomedical applications. Biomaterials 24(27), p. 4977-4985 (2003). 8. Gruber, P. et al., Polylactides. ‘NatureWorksTM PLA’, in Biopolymers. Polyesters III. Applications
and Commercial Products, Y. Doi and A. Steinbuchel, Editors. Weinheim: Wiley-VCH. (2002), p. 235-250.
9. Bhatia, A. et al., Compatibility of biodegradable poly (lactic acid)(PLA) and poly (butylene succinate)(PBS) blends for packaging application. Korea-Australia Rheology Journal 19(3), p. 125-131 (2007).
10. Nishino, T. et al., Kenaf reinforced biodegradable composite. Composites Science and Technology 63(9), p. 1281-1286 (2003).
11. Finkenstadt, V.L. et al., Poly(lactic acid) green composites using oilseed coproducts as fillers. Industrial Crops and Products 26(1), p. 36-43 (2007).
12. Cheng, S. et al., Mechanical and thermal properties of chicken feather fiber/PLA green composites. Composites Part B: Engineering 40(7), p. 650-654 (2009).
13. Yu, T. et al., Preparation and properties of short natural fiber reinforced poly(lactic acid) composites. Transactions of Nonferrous Metals Society of China 19, p. s651-s655 (2009).
14. Huda, M.S. et al., Effect of fiber surface-treatments on the properties of laminated biocomposites from poly(lactic acid) (PLA) and kenaf fibers. Composites Science and Technology 68(2), p. 424-432 (2008).
15. Ochi, S., Mechanical properties of kenaf fibers and kenaf/PLA composites. Mechanics of Materials 40(4), p. 446-452 (2008).
16. Tokoro, R. et al., How to improve mechanical properties of polylactic acid with bamboo fibers. Journal of Materials Science 43(2), p. 775-787 (2008).
17. Bourmaud, A. et al., Investigations on mechanical properties of poly(propylene) and poly(lactic acid) reinforced by miscanthus fibers. Composites Part A: Applied Science and Manufacturing 39(9), p. 1444-1454 (2008).
18. Yu, T. et al., Effect of fiber surface-treatments on the properties of poly(lactic acid)/ramie composites. Composites Part A: Applied Science and Manufacturing 41(4), p. 499-505 (2010).
19. Bledzki, A.K. et al., Mechanical properties of PLA composites with man-made cellulose and abaca fibres. Composites Part A: Applied Science and Manufacturing 40(4), p. 404-412 (2009).
20. Graupner, N. et al., Natural and man-made cellulose fibre-reinforced poly(lactic acid) (PLA) composites: An overview about mechanical characteristics and application areas. Composites Part A: Applied Science and Manufacturing 40(6), p. 810-821 (2009).
21. Bleach, N.C. et al., Effect of filler type on the mechanical properties of self-reinforced polylactide–
calcium phosphate composites. Journal of Materials Science: Materials in Medicine 12(10), p. 911-915 (2001).
22. Ikada, Y. et al., Biodegradable polyesters for medical and ecological applications. Macromolecular Rapid Communications 21(3), p. 117-132 (2000).
23. Dorgan, J.R. et al., Polylactides: properties and prospects of an environmentally benign plastic from renewable resources. Macromolecular Symposia 175(1), p. 55-66 (2001).
Chapter VI
225
24. Baley, C. et al., Etat de l'art sur les matériaux composites biodégradables. Revue des composites et des matériaux avancés 14(2), p. 135-166 (2005).
25. Zandvliet, C. et al., Proposition of an Accelerated Ageing Method for Natural Fibre/Polylactic Acid Composite. Journal of The Institution of Engineers (India): Series D 96(2), p. 151-158 (2015).
26. Ndazi, B.S. et al., Characterization of hydrolytic degradation of polylactic acid/rice hulls composites in water at different temperatures. Express Polymer Letters 5(2) (2011).
27. Li, S. et al., Further investigations on the hydrolytic degradation of poly (DL-lactide). Biomaterials 20(1), p. 35-44 (1999).
28. Zhang, X. et al., Morphological behaviour of poly(lactic acid) during hydrolytic degradation. Polymer Degradation and Stability 93(10), p. 1964-1970 (2008).
29. Badía, J.D. et al., Assessing the MALDI-TOF MS sample preparation procedure to analyze the influence of thermo-oxidative ageing and thermo-mechanical degradation on poly (Lactide). European Polymer Journal 47(7), p. 1416-1428 (2011).
30. Gupta, M.C. et al., Thermal oxidative degradation of poly-lactic acid. Colloid and Polymer Science 260(3), p. 308-311 (1982).
31. Rasselet, D. et al., Oxidative degradation of polylactide (PLA) and its effects on physical and mechanical properties. European Polymer Journal 50, p. 109-116 (2014).
32. Copinet, A. et al., Effects of ultraviolet light (315 nm), temperature and relative humidity on the degradation of polylactic acid plastic films. Chemosphere 55(5), p. 763-773 (2004).
33. Islam, M.S. et al., Influence of accelerated ageing on the physico-mechanical properties of alkali-treated industrial hemp fibre reinforced poly(lactic acid) (PLA) composites. Polymer Degradation and Stability 95(1), p. 59-65 (2010).
34. Semba, T. et al., The effect of crosslinking on the mechanical properties of polylactic acid/polycaprolactone blends. Journal of Applied Polymer Science 101(3), p. 1816-1825 (2006).
35. Wang, J. et al., Shear-induced enhancements of crystallization kinetics and morphological transformation for long chain branched polylactides with different branching degrees. 6, p. 26560 (2016).
36. Fischer, E.W. et al., Investigation of the structure of solution grown crystals of lactide copolymers by means of chemical reactions. Kolloid-Zeitschrift und Zeitschrift für Polymere 251(11), p. 980-990 (1973).
37. Gardette, M. et al., Photooxidation of polylactide/calcium sulphate composites. Polymer Degradation and Stability 96(4), p. 616-623 (2011).
38. Liu, X. et al., Kinetics of thermo-oxidative and thermal degradation of poly(d,l-lactide) (PDLLA) at processing temperature. Polymer Degradation and Stability 91(12), p. 3259-3265 (2006).
39. Abdelwahab, M.A. et al., Thermal, mechanical and morphological characterization of plasticized PLA–PHB blends. Polymer Degradation and Stability 97(9), p. 1822-1828 (2012).
40. Sawpan, M.A. et al., Improvement of mechanical performance of industrial hemp fibre reinforced polylactide biocomposites. Composites Part A: Applied Science and Manufacturing 42(3), p. 310-319 (2011).
41. Ragoubi, M. et al., Effect of corona discharge treatment on mechanical and thermal properties of composites based on miscanthus fibres and polylactic acid or polypropylene matrix. Composites Part A: Applied Science and Manufacturing 43(4), p. 675-685 (2012).
42. Oksman, K. et al., Natural fibres as reinforcement in polylactic acid (PLA) composites. Composites Science and Technology 63(9), p. 1317-1324 (2003).
43. Rodi, E.G. et al., Functionalization of Miscanthus by Photoactivated Thiol–Ene Addition to Improve Interfacial Adhesion with Polycaprolactone. ACS Sustainable Chemistry & Engineering 4(10), p. 5475-5482 (2016).
44. Fang, H. et al., Shear-Induced Nucleation and Morphological Evolution for Bimodal Long Chain Branched Polylactide. Macromolecules 46(16), p. 6555-6565 (2013).
45. Wang, J. et al., More Dominant Shear Flow Effect Assisted by Added Carbon Nanotubes on Crystallization Kinetics of Isotactic Polypropylene in Nanocomposites. ACS Applied Materials & Interfaces 7(2), p. 1364-1375 (2015).
46. Luo, S. et al., Interfacial Improvements in a Green Biopolymer Alloy of Poly(3-hydroxybutyrate-co-3-hydroxyvalerate) and Lignin via in Situ Reactive Extrusion. ACS Sustainable Chemistry & Engineering 4(6), p. 3465-3476 (2016).
Chapter VI
226
47. Sapieha, S. et al., Dicumyl peroxide-modified cellulose/LLDPE composites. Journal of Applied Polymer Science 41(9-10), p. 2039-2048 (1990).
48. Meaurio, E. et al., Infrared Spectrum of Poly(l-lactide): Application to Crystallinity Studies.
Macromolecules 39(26), p. 9291-9301 (2006). 49. Afrifah, K.A. et al., Fracture toughness of poly(lactic acid)/ ethylene acrylate copolymer/wood-flour
composite ternary blends. Polymer International 62(7), p. 1053-1058 (2013). 50. Hon, D.N.-S. et al., Wood and cellulosic chemistry, revised, and expanded. CRC Press (2000). 51. Heitner, C., Light-Induced Yellowing of Wood-Containing Papers, in Photochemistry of
Lignocellulosic Materials. American Chemical Society , p. 2-25 (1993). 52. Dan R., Visakh P. M., Photochemical Behavior of Multicomponent Polymeric-based Materials.
Springer International Publishing (2016). 53. Snijders, E.A. et al., Effect of dicumyl peroxide crosslinking on the UV stability of ethylene-
propylene-diene (EPDM) elastomers containing 5-ethylene-2-norbornene (ENB). Polymer Degradation and Stability 89(3), p. 484-491 (2005).
54. Chegdani, F. et al., Fiber type effect on tribological behavior when cutting natural fiber reinforced plastics. Wear 332, p. 772-779 (2015).
55. Murdy, R.C. et al., An in-depth analysis of the physico-mechanical properties imparted by agricultural fibers and food processing residues in polypropylene biocomposites. AIP Conference Proceedings 1664(1), (2015).
227
228
Conclusions and perspectives
229
Conclusions and perspectives This conclusion represents both a synthesis of the information presented in the course of
this study and an overview on the future perspectives. All the considerations and principal
results presented in the different chapters will guide the discussion towards possible
applications and extensions of this work.
The objective of the first chapter was to give the reader the basic concepts related to the
biocomposites world and a global overview of the potential matrixes and fibers, focusing
progressively the attention on the principal processing methods and chemical modification of
fibers used, which constitute in a certain manner one of the focus point of this work. The
materials were treated taking into account both the macroscopic characteristics such as their
mechanical and thermal properties and their microstructure by using a micromechanical
approach. This part allowed us to choice three aliphatic biodegradable polyesters as matrixes,
more precisely poly(caprolactone) (PCL), poly(3-hydroxybutyrate-co-3-hydroxyvalerate)
(PHBHV) and poly(lactic acid) (PLA) and Miscanthus giganteus fibers as reinforcement.
Actually, the experimental part was divided in several chapters that focuses on the
biocomposites realized with these matrixes.
The aim of the second chapter was to propose an innovative chemical modification of
vegetal fibers based on the thiol-ene reaction on the unsaturated bonds of lignin in the presence
of peroxides to improve the adhesion matrix/fibers, solving by this way problems related to the
hydrophilic character of the fibers, this last being incompatible with the hydrophobic one of the
matrix. This part allows to a strong improvement in the mechanical properties of PCL/MIS
biocomposites, demonstrating in this way not only the importance to add a reinforcement to the
matrix, but also the efficiency of this method and its applicability to other biopolyesters.
However, the non-renewable origin of PCL and its low thermal resistance led us to the
investigation of other matrixes, most innovative and with a great potential.
For this reason, the third chapter focused on the PHBHV/MIS biocomposites, starting
from the effect of the content of fibers on the mechanical properties of this matrix. This study
highlighted the advantages and the limits to use a vegetal reinforcement; the use of too much
less fibers content results in composites with no great interest from an industrial point of view.
At the same time the use of too much high fibers is limited from the processing adopted,
Conclusions and perspectives
230
resulting in a poor dispersion and formation of aggregates, these last formed also due to the lack
adhesion fiber/matrix. The analytical model of Mori-Tanaka used to predict the elastic behavior
of the biocomposites showed promising results for fibers imaged as cylinder aligned in the
direction of the stress applied and at the same time showed various limits, including the
assumptions of perfect contact and of heterogeneity in fibers dimensions. For these several
reasons, the investigation of the effect of fibers dimensions and pathway was the focus of the
fourth chapter. 2D and 3D finite element analyses were conducted to study the sensibility of
the models to fibers dimensions and orientation in the matrix. The results demonstrated that 3D
models better approximate the elastic behavior of the composite. Moreover, the transmission of
the stress depends on the fibers pathway and content in the matrix. In this context, composites
with aligned fibers induced less stress localization and are more rigid than the others. This result
reveals that biocomposites for application in which high performance materials are required
have to be realized using other processing methods able to control the orientation of fibers.
The fifth chapter intended to be a sort of synthesis of the previous two, in which the effect
of fibers dimension was coupled with a reactive extrusion initiated by peroxides in order to
improve the mechanical properties of the PHBHV-based composites. The study highlighted
two different phenomena occurring in the biocomposites: the cross-linking of the matrix on one
side and the grafting of fibers to matrix on the other side. This result constituted the starting
point for the implementation of a numerical model in which the aim was not only to find a
model that can predict the elastic properties of the biocomposite, but also to predict the gel
fraction formed in the blend after the reactive process. Although the promising and innovative
results obtained with PHBHV, its high cost which great limits its use to a very large scale, led
us to the investigation of a more economic matrix in which the effect of process and the long
term behavior of the material can be studied.
The last chapter was then dedicated to the economical PLA and its composites. The study
showed that the processing method and more precisely the thermal treatment had a great impact
on the mechanical properties of the biocomposites and also on the crystallinity of the neat
matrix. Moreover, the photo-oxidative aging of the PLA-based composites showed a general
embrittlement of the material with the time, this last being more important for composites
modified with peroxides. The composites manufactured in this last chapter exhibited an
extraordinary elastic modulus and final strength when manufactured by mixing and
compression molding, maintaining good properties also after aging. These promising results
Conclusions and perspectives
231
demonstrated the feasibility to realize economical biocomposites able to concur with traditional
plastics reinforced with glass fibers.
The presentation of the macroscopic characteristics of the biocomposites manufactured
in this work highlighted not only their dependence from the processing methods, but also from
their microstructure. We exposed the limits of some analytical and numerical models in the
third and fourth chapters. Nevertheless, microscopic techniques associated to these models
seem a promising way for the identification of a model able to predict the elastic properties of
the biocomposites. Although, the engine of this work has been that to find an equilibrium
between the simplicity of the model and the not simplistic description of the reality, the
complexity of this last has constrained us to make some assumptions. Starting from this point,
it seems logic that in order to have more precise information about the microstructure, other
techniques should to be used such as micro-tomography. By this methods, the real images of
any sample could be used for the implementation of more realistic finite element models.
The systematic association of numerical models to the practical realization of the
materials seems to be a good method in order to obtain information on the relations existing
between macro-properties and microstructure. Therefore, the interdisciplinarity of this work
seems to be a good starting point for the concrete realization of biocomposites based on
vegetable fiber in the near future. The wide choice of matrixes and fibers will allow us to create
composites suitable in the most diverse fields, from that of construction to niche sector for the