HAL Id: cea-02509185 https://hal-cea.archives-ouvertes.fr/cea-02509185 Submitted on 16 Mar 2020 HAL is a multi-disciplinary open access archive for the deposit and dissemination of sci- entific research documents, whether they are pub- lished or not. The documents may come from teaching and research institutions in France or abroad, or from public or private research centers. L’archive ouverte pluridisciplinaire HAL, est destinée au dépôt et à la diffusion de documents scientifiques de niveau recherche, publiés ou non, émanant des établissements d’enseignement et de recherche français ou étrangers, des laboratoires publics ou privés. Influence of the slag content on the hydration of blended cement S. Stephant, L. Chomat, A. Nonat, T. Charpentier To cite this version: S. Stephant, L. Chomat, A. Nonat, T. Charpentier. Influence of the slag content on the hydration of blended cement. ICCC 2015 - 14th International Congress on the Chemistry of Cement, Oct 2015, Beijing, China. cea-02509185
Transcript
HAL Id: cea-02509185https://hal-cea.archives-ouvertes.fr/cea-02509185
Submitted on 16 Mar 2020
HAL is a multi-disciplinary open accessarchive for the deposit and dissemination of sci-entific research documents, whether they are pub-lished or not. The documents may come fromteaching and research institutions in France orabroad, or from public or private research centers.
L’archive ouverte pluridisciplinaire HAL, estdestinée au dépôt et à la diffusion de documentsscientifiques de niveau recherche, publiés ou non,émanant des établissements d’enseignement et derecherche français ou étrangers, des laboratoirespublics ou privés.
Influence of the slag content on the hydration of blendedcement
S. Stephant, L. Chomat, A. Nonat, T. Charpentier
To cite this version:S. Stephant, L. Chomat, A. Nonat, T. Charpentier. Influence of the slag content on the hydration ofblended cement. ICCC 2015 - 14th International Congress on the Chemistry of Cement, Oct 2015,Beijing, China. �cea-02509185�
Influence of the slag content on the hydration of blended cement
Stephant S.1, Chomat L.1, Nonat A.2, Charpentier T.3 1. CEA, DEN, DPC, SECR, Laboratoire d’Étude du Comportement des Bétons et des Argiles,
F-91191 Gif-sur-Yvette, France. 2. Laboratoire Interdisciplinaire Carnot de Bourgogne, UMR 6303 CNRS-Université de Bourgogne,
F-21078 Dijon Cedex, France. 3. CEA, IRAMIS, NIMBE, CEA/CNRS UMR 3685 Laboratoire Structure et Dynamique par Résonance Magnétique,
F-91191 Gif-sur-Yvette, France. Abstract Slag is increasingly used for replacing a part of clinker. The addition of slag modifies the hydration process and so the physico-chemical properties (such as porosity, transport properties…) of cementitious materials. Indeed the evolution of the physico-chemical properties are determined by the hydration kinetics of the anhydrous phases and the composition of the hydrated phases. The hydration process of slag blended cement is still under investigation due to the complex interactions between clinker and slag. The aim of this work is to link the evolution of slag blended cement properties (such as bound water, chemical shrinkage, mineralogy, porosity) to the hydration state. The latter was defined by the degree of hydration of the cementitious material. For this study, three commercial cements with variable amounts of the same slag (0%; 61%; 80%) were considered. Cement paste samples hydrated from one week to one year were characterized. 29Si MAS NMR experiments were performed in order to quantify the consumption of the anhydrous phases. A degree of hydration of clinker, slag and cement could be deduced from these experiments. The results are compared with the evolution of the bound water content (measure by thermogravimetric analysis which is strongly correlated to the global degree of hydration). For each measurement of the degree of hydration, the porosity was determined (total free water porosity measurement) and the mineralogy was described (thermogravimetric analysis (TGA) and X-ray diffraction (XRD)). Measurement of the degree of hydration shows that the slag used in this study is less reactive than other slags which are characterized in the literature. On the one hand the low reactivity of slag explains why the chemical shrinkage and bound water are much more important for a Portland cement than for slag blended cement. On the other hand, for fully hydrated cement, the chemical shrinkage and bound water are more important for slag blended cement than for Portland cement. The consumption of portlandite by the hydration of slag is less important than its production by the clinker even after one year of hydration. The slag degree of hydration is too low to underline an impact of the slag hydration on the porosity and the bound water content. A simplified hydration model, based on mass balance, was applied to determine the mineralogical composition of hydrated slag blended cement according to a specific degree of hydration. Stoichiometric equations used in this model were based on the hydrates compositions as detected by XRD or available in the literature. The model considers the consumption of portlandite by the hydration of slag and the incorporation of aluminum in the C-S-H. The results are used to estimate a volume of chemical shrinkage and bound water. The model has given promising results concerning the porosity and chemical shrinkage estimation. However the portlandite content predicted by the model is too low when it is compared to experimental measurements. Originality Few studies describe the hydration of slag blended cement accounting for aspects such as mineralogy, physico-chemical properties (water repartition, chemical shrinkage) and structural properties (porosity). The results of the literature are strongly dependent on the used slag. It is therefore essential to consider all the aforementioned aspects in a same study to implement a complete hydration balance. This is done in this work linking them together in a model of hydration. Keywords: Hydration; slag blended cement; degree of hydration; hydration product; modeling
1 Corresponding author: [email protected], Tel +33-0169085938, Fax +33- 0169088441
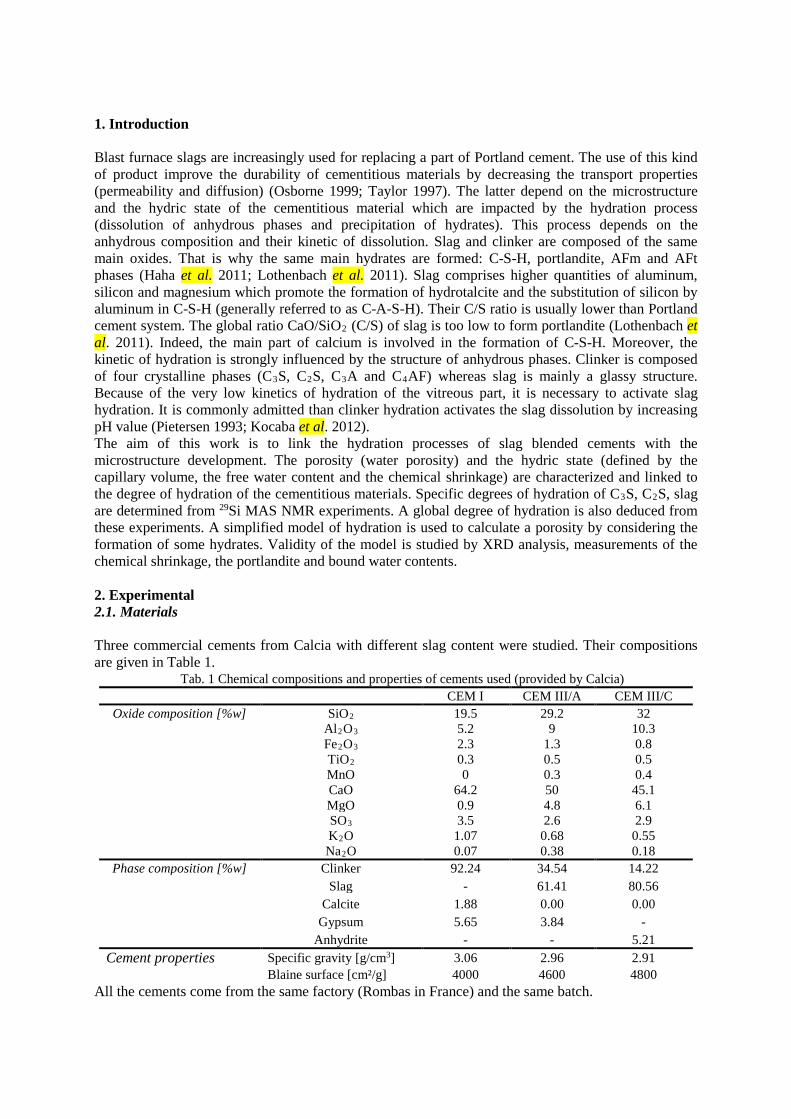
1. Introduction Blast furnace slags are increasingly used for replacing a part of Portland cement. The use of this kind of product improve the durability of cementitious materials by decreasing the transport properties (permeability and diffusion) (Osborne 1999; Taylor 1997). The latter depend on the microstructure and the hydric state of the cementitious material which are impacted by the hydration process (dissolution of anhydrous phases and precipitation of hydrates). This process depends on the anhydrous composition and their kinetic of dissolution. Slag and clinker are composed of the same main oxides. That is why the same main hydrates are formed: C-S-H, portlandite, AFm and AFt phases (Haha et al. 2011; Lothenbach et al. 2011). Slag comprises higher quantities of aluminum, silicon and magnesium which promote the formation of hydrotalcite and the substitution of silicon by aluminum in C-S-H (generally referred to as C-A-S-H). Their C/S ratio is usually lower than Portland cement system. The global ratio CaO/SiO2 (C/S) of slag is too low to form portlandite (Lothenbach et al. 2011). Indeed, the main part of calcium is involved in the formation of C-S-H. Moreover, the kinetic of hydration is strongly influenced by the structure of anhydrous phases. Clinker is composed of four crystalline phases (C3S, C2S, C3A and C4AF) whereas slag is mainly a glassy structure. Because of the very low kinetics of hydration of the vitreous part, it is necessary to activate slag hydration. It is commonly admitted than clinker hydration activates the slag dissolution by increasing pH value (Pietersen 1993; Kocaba et al. 2012). The aim of this work is to link the hydration processes of slag blended cements with the microstructure development. The porosity (water porosity) and the hydric state (defined by the capillary volume, the free water content and the chemical shrinkage) are characterized and linked to the degree of hydration of the cementitious materials. Specific degrees of hydration of C3S, C2S, slag are determined from 29Si MAS NMR experiments. A global degree of hydration is also deduced from these experiments. A simplified model of hydration is used to calculate a porosity by considering the formation of some hydrates. Validity of the model is studied by XRD analysis, measurements of the chemical shrinkage, the portlandite and bound water contents. 2. Experimental 2.1. Materials Three commercial cements from Calcia with different slag content were studied. Their compositions are given in Table 1.
Tab. 1 Chemical compositions and properties of cements used (provided by Calcia) CEM I CEM III/A CEM III/C
All the cements come from the same factory (Rombas in France) and the same batch.
The cement pastes were prepared according to the standard procedure EN 196-6 (Anon 2012). The water/binder volume ratio was 1.25 for all the cement. The samples were cured in solution where the concentrations of calcium, potassium and sodium were fixed to be equal to that of the pore solution. These concentrations were measured after extraction of the poral solution at 1 month of hydration. Samples were characterized after 7, 28, 180 (6 months) and 365 (1 year) days of hydration. 2.2. Method 29Si magic-angle spinning (MAS) NMR experiments were performed in order to determine the quantity of unhydrated clinker and slag (Brunet et al. 2010; Skibsted et al. 1993; Skibsted et al. 1995). Before crushing the sample, the hydration was stopped by the freeze drying method. 29Si MAS NMR spectra were collected with a Bruker Avance 300 WB (7.05 T) spectrometer using a Bruker 4mm (outer diameter of the ZrO2 rotors) CPMAS probe at a spinning frequency of 10 kHz. A recycle delay of 2s was employed (no change in lineshape were observed for a longer delay of 20s). The spectra were fitted using an in-house made software developed by Charpentier (Charpentier 1998). The fitting procedure is detailed in the next section. A specific degree of hydration is calculated according to:
∝i=Ait
Ait =0 (Equation 1)
With αi the specific degree of hydration of the phase “i”, Ai the line area of the phase “i” when the cement is anhydrous (t=0) or hydrated (t). A global degree of hydration of the cement could be deduced:
∝i=∑ ∝i × xini∑ xini
(Equation 2)
Where xi is the molar quantity of the phase “i”. Thermogravimetric analysis (STA 409 PC LUXX, Netzsch) was used to estimate the quantities of portlandite and chemically bound water. The protocol used was similar to the one described in Villain et al. 2007. The sample is dried under a flow of nitrogen for 3 days before being heated up to 1250 °C (heating rate: 10 °K/min). The mass losses measured from 105 °C to 550 °C and from 420 °C to 550 °C were respectively associated to the bound water (Hornain 2007) and portlandite (Villain et al. 2007) content. The mass losses were normalized to the mass at 550 °C in order to determine a percentage of bound water and portlandite. The chemical shrinkage was measured by casting 20 g of paste in a 50 ml bottle filled with distilled water and connected to a pipette (0.5 ml). Air dissolved in the water was removed under vacuum for 2 hours. The surface of exchange was 12 cm² and the paste thickness was 1 cm. The temperature was regulated through immersion of the device in a water bath at 25 °C. X-ray diffraction data were collected with a ANalytical X’Pert PRO MPD diffractometer device. The X-ray tube used a CuKα radiation. The detector is an X’Celerator. Samples are cut and polished with ethanol (in order to remove the possible carbonated layer formed on the surface of the sample during the cutting process) before to be analyzed. Cement paste were scanned from 5 to 70° during 20 minutes. Free water porosity was determined according to the procedure of Hornain 2007. P = Mair− Mdry
Mair+ Mwater (Equation 3)
Where Mair and Mwater is the mass of the sample in air and in water when it is saturated, Mdry, the mass of dried sample at 65 °C. At this temperature, evaporation of the bound water is limited (Zhang & Scherer 2011).
3. Results and Discussion
3.1. Measure of the degree of hydration
3.1.1 Fitting procedure 29Si NMR MAS experiments are used to follow the relative quantity of each silicon phases (C3S, C2S, slag and C-S-H).
The fitting procedure of the spectra is based on the work of Brunet et al. (Brunet et al. 2010): i) three peaks are attributed to C3S (encompassing the 18 peaks of monoclinic C3S and the 9 peaks of triclinic C3S (Skibsted et al. 1995)) with an intensity ratio of 1 / 0.5 / 3; ii) C2S and silicon tetrahedra of C-S-H (Figure 1) are each described with a single peak;
Figure 1 : Si tetrahedron in C-S-H (Haas 2012)
iii) Si[Q2(1Al)] tetrahedra (Si[Q2] which is link to an aluminum tetrahedron) are considered as well.
The Figure 2 shows the spectra obtained for the CEM I and CEM III/C cement. CEM III/A spectra are not shown because they are very similar to CEM III/C.
Figure 2 : Variation of the 29Si MAS NMR spectra of the CEM I and CEM III/C cements with hydration
durations
The anhydrous phases of CEM I cement are characterized by chemical shift values between -65 ppm and -75 ppm. This signal is due to the presence of C3S and C2S. In hydrated samples, the decrease in C3S and C2S content and the formation of several other peaks between -76 ppm and -88 ppm can be noticed. The latter correspond to the C-S-H. (Murgier et al. 2004; Skibsted et al. 1995; Warren & Biscce 1938). Slag contribution is characterized by a single broad line between −70 ppm and -90 ppm (Brunet et al. 2010; Andersen et al. 2003; Murgier et al. 2004). We can note that the chemical shift of slag is mingled with the one of clinker and hydrates signal, making the decomposition of slag blended cement more tricky. NMR parameters (chemical shift, full width at half maximum and Gaussian/Lorentzian ratio) of clinker and hydrates were therefore determined from the CEM I cement spectra. Only the hydrated samples were used in this study because peak shapes of clinker in the anhydrous cement were observed to be different. Other authors underline this modification at the early stage of hydration (Brunet et al. 2010).
Contrary to the work of Brunet et al., a second peak is added for describing the C2S contribution in order to have a realistic description of its hydration (this second peak is necessary in order to better account for the lineshape of the C2S resonance). The ratio between the two peaks of C2S is 4.5. We also consider that:
- Si[Q1] = ½ Si[Q2], - ½ Q2 = Q2B.
Tab. 2 shows the NMR parameters used in this study. For all the spectra decomposition of hydrated cement paste, the same parameter values are used within +/- 0.3 ppm.
Tab. 2 Fitting parameters used in the analysis of the 29Si MAS NMR spectra.
Phases C3S C2S Slag C-S-H
Q1 Q2B Q2(1Al) Q2
Chemical shift (top of the peak) (ppm) -69.3 -75.6 -73.6
-70.9 -71.0 -78.1 -78.5 -82 -80.6 -84.4
Full width at half maximum (ppm) 1.4 1.4 1.7
0.5 1.3 4.3 1.6 1.4 1.4 1.4
Gaussian/Lorentzian ratio 0.3 0.3 0.3
0.1 0.4 7.4 0.2 0.1 0.3 0.5
Intensity ratio 3
0.5 1
1 4.5 - - - - -
Chemical shift values are in good agreement with the literature (Murgier et al. 2004; Skibsted et al. 1995; Brunet et al. 2010). For example, the chemical shift of the Si[Q1] tetrahedra could varies between -77 ppm (Murgier et al. 2004) and -79.5 ppm (Brunet et al. 2010). For slag blended cement, the same NMR parameters were used. Two peaks are added for describing the contribution of (Tab. 2):
- Slag. (δiso = -78.1 ppm), - Aluminum (Q2
(1Al)) of C-A-S-H. Brunet et al. found a chemical shift at -75.8 ppm for the slag. The difference with our model is certainly due to the composition and the structure of the slag. Figure 3 shows two examples of spectra decomposition.
Figure 3 : Example of decomposition of 29Si MAS NMR spectra of the CEM I and CEM III/C cement after 1 year of hydration
3.1.2. Evolution of the degree of hydration
It is necessary to know the degree of hydration of C3A and C4AF in order to determine the global degree of hydration. The decomposition of 27Al MAS NMR spectra has not yet been performed. C3A is known to be very reactive contrary to C4AF. This is why, we consider that C3A have the same degree of hydration than C3S and that C4AF has no reacted. Figure 4 represents the evolution of the specific and the global degrees of hydration of the three cements.
Figure 4 : Evolution of the specific and global degree of hydration
C3S and C2S react quickly in the first day of hydration before slowing down. This is mainly attributed to the decrease of the reactive surface (Scrivener & Nonat 2011). The degree of hydration of C2S is probably overestimated since it is very close to the one of C3S. Indeed, previous experiments showed that the C3S hydration limits the hydration of C2S (Brunet et al. 2010; Scrivener & Nonat 2011). This overestimation is probably due to the difficulty of describing the C2S contribution on 27Si MAS NMR spectra. We can note that the degree of hydration of belite decrease with the slag content. Kocaba already underlined this observation (Kocaba 2009).After one year of hydration, C3S and C2S are almost fully hydrated. On the opposite, slag hydration is more gradual because it needs to be activated for reacting. Moreover, it could be noticed that solution is probably oversaturated compared to the solubility of the slag because of the Alite hydration. Alite dissolution should so prevent slag reaction. It could be noticed that the degree of hydration of slag increase with the clinker percentage. This observation can be related to the amount of alkaline in the clinker. To conclude, the higher clinker quantity, the higher pH value and easier the slag reaction (Lothenbach et al. 2011).
3.2. Evolution of the mineralogy and the structure of cement paste The mineralogy of cement paste was studied by XRD experiments. The Figure 5 illustrates the XRD patterns which are obtained after one year of hydration.
Figure 5 : Diffraction pattern of the CEM I, CEM III/A and CEM III/C cement hydrated during 1 year
After one year of hydration, C3S, C2S and C3A were only detected in the CEM I cement. The low content of clinker in slag blended cement could explain this observation. Cement pastes were composed of the same main hydrated phases: C-S-H, portlandite, ettringite and monocarboaluminate. Hydrotalcite and monosulfoaluminate were also detected in the slag blended cement. These phases are commonly observed in slag blended cement (Taylor et al. 2010). The slag used in this work has a global ratio CaO/SiO2 of 1.2. This value is too low to form C-S-H with a C/S ratio higher than 1.5. That is why, portlandite initially formed should be dissolved during the slag hydration. The evolution of the portlandite and bound water content, determined by TGA, according to the global degree of hydration is presented on Figure 6.
Figure 6: Evolution of the bound water content (A/), portlandite content (B/)
Whatever the cement type is, the bound water content increase with the global degree of hydration. These evolutions are due to the anhydrous dissolution and to the hydrates formation. These values decrease with the slag content because of its low reactivity. It is worth noting that the degree of hydration of slag is probably too low to underline an impact of this coumpound on the bound water
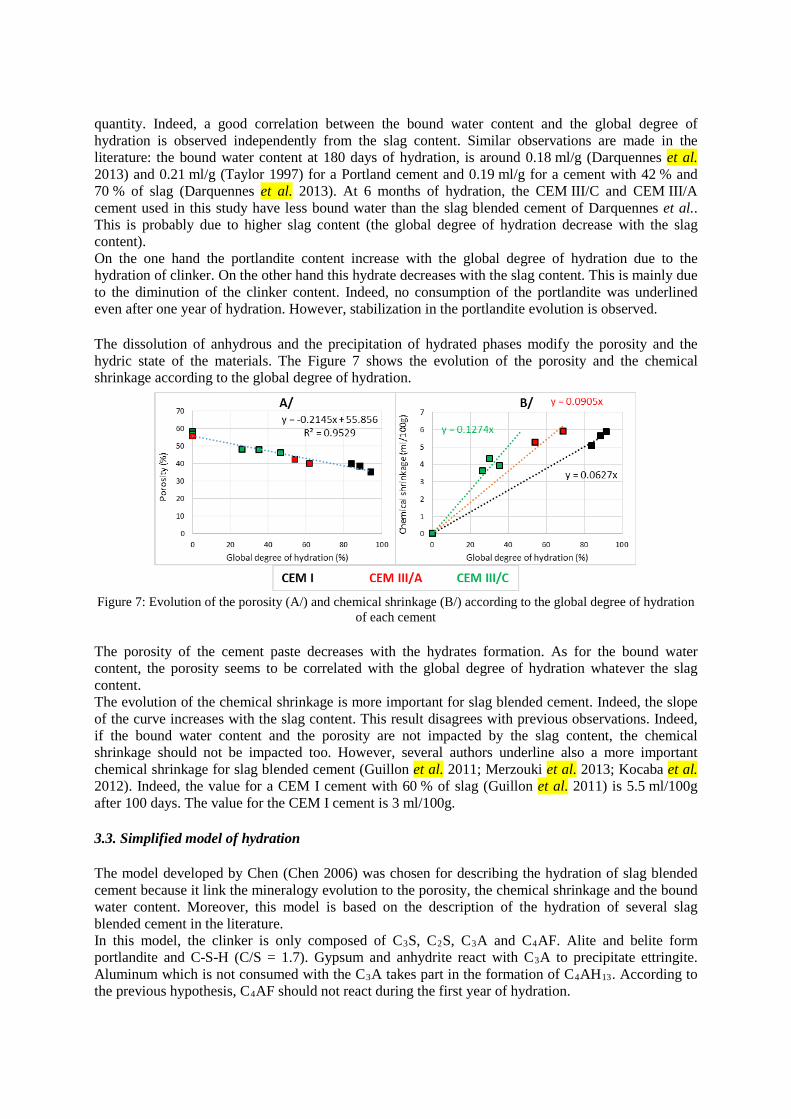
quantity. Indeed, a good correlation between the bound water content and the global degree of hydration is observed independently from the slag content. Similar observations are made in the literature: the bound water content at 180 days of hydration, is around 0.18 ml/g (Darquennes et al. 2013) and 0.21 ml/g (Taylor 1997) for a Portland cement and 0.19 ml/g for a cement with 42 % and 70 % of slag (Darquennes et al. 2013). At 6 months of hydration, the CEM III/C and CEM III/A cement used in this study have less bound water than the slag blended cement of Darquennes et al.. This is probably due to higher slag content (the global degree of hydration decrease with the slag content). On the one hand the portlandite content increase with the global degree of hydration due to the hydration of clinker. On the other hand this hydrate decreases with the slag content. This is mainly due to the diminution of the clinker content. Indeed, no consumption of the portlandite was underlined even after one year of hydration. However, stabilization in the portlandite evolution is observed. The dissolution of anhydrous and the precipitation of hydrated phases modify the porosity and the hydric state of the materials. The Figure 7 shows the evolution of the porosity and the chemical shrinkage according to the global degree of hydration.
Figure 7: Evolution of the porosity (A/) and chemical shrinkage (B/) according to the global degree of hydration
of each cement The porosity of the cement paste decreases with the hydrates formation. As for the bound water content, the porosity seems to be correlated with the global degree of hydration whatever the slag content. The evolution of the chemical shrinkage is more important for slag blended cement. Indeed, the slope of the curve increases with the slag content. This result disagrees with previous observations. Indeed, if the bound water content and the porosity are not impacted by the slag content, the chemical shrinkage should not be impacted too. However, several authors underline also a more important chemical shrinkage for slag blended cement (Guillon et al. 2011; Merzouki et al. 2013; Kocaba et al. 2012). Indeed, the value for a CEM I cement with 60 % of slag (Guillon et al. 2011) is 5.5 ml/100g after 100 days. The value for the CEM I cement is 3 ml/100g. 3.3. Simplified model of hydration The model developed by Chen (Chen 2006) was chosen for describing the hydration of slag blended cement because it link the mineralogy evolution to the porosity, the chemical shrinkage and the bound water content. Moreover, this model is based on the description of the hydration of several slag blended cement in the literature. In this model, the clinker is only composed of C3S, C2S, C3A and C4AF. Alite and belite form portlandite and C-S-H (C/S = 1.7). Gypsum and anhydrite react with C3A to precipitate ettringite. Aluminum which is not consumed with the C3A takes part in the formation of C4AH13. According to the previous hypothesis, C4AF should not react during the first year of hydration.
For the slag, only the main oxides are considered (SiO2, Al2O3, CaO, MgO, SO3). SO3, MgO, SiO2 form respectively ettringite, hydrotalcite and C-S-H. In this model, all the C-S-H has the same C/S ratio. The latter is deduced from the quantity of silicon and from the total calcium content available from the clinker (portlandite) and slag. Moreover, only C-S-H from slag could incorporate aluminum. The quantity of the latter is deduced from the global C/S ratio and from the equation of Richardon (Richardson 1999): S/C = 0.4277 + 4.732 A/C (Equation 4) The residual aluminum forms C4AH13. A new global C/S is then deduced by considering the quantity of calcium used by C4AH13. It could be noticed that C4AH13 was not detected by the XRD experiments. In the opposite, monosulfoaluminate was detected but it is not considered in this model. The formation of these phases is strongly dependent on the aluminum and magnesium content in slag. This simplification should not strongly impact the final results. Indeed, in a first approximation it could be considered that the bound water content and the molar volume are similar to all the AFm phases. For examples, the molar volume of C4AH13, monosulfoaluminate and hemicarboaluminate are respectively 274 cm3/mol, 285 cm3/mol and 308 cm3/mol (Balonis 2010). From the specific degree of hydration, it is possible to determine, the volume of each phases, the bound water content, the chemical shrinkage and the porosity. The bound water content and the molar volume used for each phase are represented in the Tab. 3.
Tab. 3 Water content (phase equilibrate with a relative humidity of 80%) and molar volume for anhydrous and hydrated phases (Balonis 2010; Chen 2006)
With : ρC-S-H the density of C-S-H. The equation is deduced by considering the density of a C1.7-S-H1.2 (dried at 105°C) and C1.7-S-H3.2 (in a saturated environement).
MC-S-H, MCaO, MAl2O3, MSiO2 the molar mass of C-S-H, free lime, aluminum oxide and silicon C/S, A/S, H/S the molar ratio CaO/SiO2, Al2O3/SiO2 and H2O/SiO2 of C-S-H. Figure 8 illustrates the evolution (volume) of cement, hydrates, capillary water and the chemical shrinkage with respect to time. In order to check the validity of the model, experimental measurements of porosity, portlandite and chemical shrinkage are added to this figure.
Figure 8 : Application of the model for the three cement and comparison with the experimental results. The “Chemical shrinkage – exp” and the “capillary volume – exp” are obtained by subtracting the experimental value of chemical shrinkage and capillary volume (deduced from the porosity measurements) of the volume of cement paste.
The measurement of the bound water content which is previously presented could not be introduced in this model. Indeed, to measure the bound water content, the samples are died at 105°C whereas all the data in Tab. 3 are defined for the samples equilibrated at 80 % relative humidity. The porosity measurements are in agreement with the results of the model. A maximum difference of 10% was observed. The portlandite content of CEM I is underestimated by the model (20 % of difference). This gap is probably due to the fact that the hydration of C4AF is not considered in this study. In the model of Chen, the hydration of C4AF forms portlandite and hydrogarnet (C6AFS2H8). With a 50 % hydration degree of the C4AF, the difference with the experimental value is under 10 %. The difference between the portlandite measurements and the model values increases with the slag content. The evolution of the chemical shrinkage for the CEM I cement is in accordance with the experimental results. However, a difference of 50 % can be noted at the beginning of the hydration. The gap is under 10 % after 180 days of hydration. This description could be improved by:
- The measurements of the specific degrees of hydration of each anhydrous phase. 27Al MAS NMR experiments should enable the degree of hydration of C3A and C4AF to be estimated.
- Determining the quantity of Si[Q2(1Al)]. Quantitative analyses of the aluminum content will be
made in order to estimate the quantity of aluminum in the C-S-H. - Studying the Portland cement hydrated 1 hour. This low time of hydration will probably allow
a more accurate determination of the anhydrous peak parameters. - Considering an incongruent dissolution of the slag. The first result of the 27Al NMR
experiments show a higher degree of hydration for the aluminum part of slag with respect to the silicon part of slag. This phenomenon was already observed in the literature (Dron & Brivot 1980; Regourd et al. 1983; Brunet et al. 2010)
- The hypothesis made regarding the stoichiometric equation. In this study, the formation of C4AH13 is considered whereas this phase was not observed by XRD. The accuracy of the model should be improved by only considering the observed phases.
- The incertitude about the molar volume (mainly for the C-S-H and C-A-S-H). The molar volumes of these phases have a big impact on the results since they are the main compound in hydrated cement. The ratio H/S of C-S-H calculated by the model could be check by the measurements of bound water content in equilibrated samples at 80 % relative humidity. A ratio H/S of 1.3 (instead of 2.1) reduce the difference between the experimental results and the
model. According to Brouwers (Brouwers 2004), this ratio H/S is closed to the one of a C-S-H dry at 105 °C.
- Methodology to measure portlandite content. According to the temperatures which are attributed to the portlandite decomposition, a gap of 2 % could be observed on the measure for a same sample. Moreover, the variability between two samples could achieve 20 %.
The model could be completed by adding a kinetic law of hydration for each phase. These laws will be fitted according to the NMR experiments. 4. Conclusions The influence of slag hydration in blended cement on the microstructure and the mineralogy was studied. Global and specific degrees of hydration were deduced from 29Si NMR experiments. The hydration rate of slag is less important than the one of clinker. The chemical shrinkage and the bound water content decrease, while the porosity increase with the slag content because of the low reactivity of this compound. The degree of hydration of slag is probably too low to observe an impact of the slag dissolution on the porosity and the bound water content. The main phases of cementitious materials are observed: C-S-H, portlandite, clinker, ettringite and monosulfoaluminate. No consumption of the portlandite content was observed during the slag hydration even after one year of hydration. A simplified model of hydration is used to describe the hydration of slag blended. The results of the model are in agreement with the experimental measurements of the porosity and the chemical shrinkage. However, there are important discrepancy with the portlandite and water content. These differences are mainly due to the hypothesis made about the stoichiometric equations and the molar volume of the hydrates (especially the C-S-H). Acknowledgements The authors acknowledge the financial support provided by AREVA and CEA. References Andersen, M.D., Jakobsen, H.J. & Skibsted, J., 2003. Incorporation of aluminum in the calcium silicate hydrate
(C-S-H) of hydrated portland cements: a high-field 27Al and 29Si MAS NMR investigation. Inorganic Chemistry, 42(7), pp.2280–2287.
Anon, 2012. Norme EN 196-6 - Méthode d’essai des ciments : Détermination de la finesse.
Balonis, M., 2010. The Influence of Inorganic Chemical Accelerators and Corrosion Inhibitors on the Mineralogy of Hydrated Portland Cement Systmes. University of Aberdeen Aberdeen, UK.
Brouwers, H.J.H., 2004. The work of Powers and Brownyard revisited: Part 1. Cement and Concrete Research, 34(9), pp.1697–1716.
Brunet, F. et al., 2010. Characterization by solid-state NMR and selective dissolution techniques of anhydrous and hydrated CEM V cement pastes. Cement and Concrete Research, 40(2), pp.208–219.
Charpentier, T., 1998. Résonance magnétique nucléaire haute-résolution sur les noyaux quadripolaires dans les solides. Thèse de l’Université Paris XI.
Chen, W., 2006. Hydration of slag cement: theory, modeling and application. S.l.: Thèse de l’Université de Twente.
Darquennes, A., Espion, B. & Staquet, S., 2013. How to assess the hydration of slag cement concretes? Construction and Building Materials, 40, pp.1012–1020.
Dron, R. & Brivot, F., 1980. Approche du Problème de la Réactivité du Laitier Granule. In 7th International Congress on the Chemistry of Cement. Paris: Editions Septima.
Guillon, E., Termkhajornkit, P. & Chen, J.J., 2011. Analysis of chemical shrinkage experiments on blended cement paste via a coupled thermodynamic/kinetic hydration model. In Proceedings of 13th International Congress on the Chemistry of Cement. Madrid.
Haas, J., 2012. Etude expérimentale et modélisation thermodynamique du système CaO-SiO2-(Al2O3)-H2O. Thèse de l’Université de Bourgogne.
Haha, M.B. et al., 2011. Influence of slag chemistry on the hydration of alkali-activated blast-furnace slag — Part I: Effect of MgO. Cement and Concrete Research, 41(9), pp.955–963.
Hornain, H., 2007. GranDuBé: grandeurs associées à la durabilité des bétons, Presses des Ponts.
Kocaba, V., 2009. Development and Evaluation of Methods to Follow Microstructural Development of Cementitious Systems Including Slags. Thèse de l’École polytechnique fédérale de Lausanne.
Kocaba, V., Gallucci, E. & Scrivener, K.L., 2012. Methods for determination of degree of reaction of slag in blended cement pastes. Cement and Concrete Research, 42(3), pp.511–525.
Lothenbach, B., Scrivener, K. & Hooton, R.D., 2011. Supplementary cementitious materials. Cement and Concrete Research, 41(12), pp.1244–1256.
Merzouki, T. et al., 2013. Contribution to the modeling of hydration and chemical shrinkage of slag-blended cement at early age. Construction and Building Materials, 44, pp.368–380.
Murgier, S., Zanni, H. & Gouvenot, D., 2004. Blast furnace slag cement: a 29Si and 27Al NMR study. Comptes Rendus Chimie, 7(3–4), pp.389–394.
Osborne, G.J., 1999. Durability of Portland blast-furnace slag cement concrete. Cement and Concrete Composites, 21(1), pp.11–21.
Pietersen, H.S., 1993. Reactivity of fly ash and slag in cement. Technische Universiteit Delft.
Regourd, M. et al., 1983. Blast-furnace slag hydration. Surface analysis. Cement and Concrete Research, 13(4), pp.549–556.
Richardson, I.G., 1999. The nature of C-S-H in hardened cements. Cement and Concrete Research, 29(8), pp.1131–1147.
Scrivener, K.L. & Nonat, A., 2011. Hydration of cementitious materials, present and future. , pp.651–665.
Skibsted, J., Henderson, E. & Jakobsen, H.J., 1993. Characterization of Calcium Aluminate Phases in Cements by 27Al MAS NMR Spectroscopy. Inorganic Chemistry, 32, p.1013.
Skibsted, J., Jakobsen, H.J. & Hall, C., 1995. Quantification of calcium phases in Portland cements by 29 Si MAS NMR spectroscopy. Journal of the Chemical Society, p.4423.
Taylor, H.F.W., 1997. Cement chemistry, London: T. Telford.
Taylor, R., Richardson, I.G. & Brydson, R.M.D., 2010. Composition and microstructure of 20-year-old ordinary Portland cement–ground granulated blast-furnace slag blends containing 0 to 100% slag. Cement and Concrete Research, 40(7), pp.971–983.
Villain, G., Thiery, M. & Platret, G., 2007. Measurement methods of carbonation profiles in concrete: Thermogravimetry, chemical analysis and gammadensimetry. Cement and Concrete Research, 37(8), pp.1182–1192.
Warren, B.E. & Biscce, J., 1938. The Structure of Silica Glass by X-Ray Diffraction Studies *. Journal of the American Ceramic Society, 21(2), pp.49–54.
Zhang, J. & Scherer, G.W., 2011. Comparison of methods for arresting hydration of cement. Cement and Concrete Research, 41(10), pp.1024–1036.