30
Influence of Thermal Maturity on Organic Shale Microstructure Mark E. Curtis Oklahoma Shale Gas and Oil Workshop November 20, 2013 1 100 nm

Influence of Thermal Maturity on
Organic Shale Microstructure
Mark E. Curtis
Oklahoma Shale Gas and Oil
Workshop
November 20, 2013
1
100 nm

Outline
• Probing the Nanoscale.
• Microstructure of shales in the wet and dry gas windows.
• Microstructure of shales in the oil window
– Woodford
– Bakken
– Avalon
• Conclusions
2
Driving Forces For Understanding Microstructure
• Historically attention focused on gas shales but economic pressures have led to focus on liquids-rich plays.
• Microstructure of shale will control both storage and transport of hydrocarbons.
― Pore sizes/shapes/number
― Pore habits
― Pore connectivity
• Thermal maturity tied to hydrocarbon generation and should have an influence on the structure of the organic matter.
• Want to know what are the key factors that control the microstructure and will this allow us to start to make predictions about storage and transport.
3

Scale of Small Stuff
4 DNA
~2-1/2 nm diameter
Natural Stuff Manmade Stuff
MicroElectroMechanical devices 10 -100 mm wide
Red blood cells Pollen grain
Fly ash ~ 10-20 mm
Atoms of silicon spacing ~tenths of nm
Head of a pin 1-2 mm
Quantum corral of 48 iron atoms on copper surface positioned one at a time with an STM tip
Corral diameter 14 nm
Human hair ~ 10-50 mm wide
Red blood cells with white cell
~ 2-5 mm
Ant ~ 5 mm
Dust mite
200 mm
ATP synthase
~10 nm diameter Nanotube electrode
Carbon nanotube ~2 nm diameter
Nanotube transistor
Th
e M
icro
wo
rld
0.1 nm
1 nanometer ( nm)
0.01 mm
10 nm
0.1 mm
100 nm
1 micrometer (mm)
0.01 mm
10 mm
0.1 mm
100 mm
1 millimeter (mm)
1 cm
10 mm 10-2 m
10-3 m
10-4 m
10-5 m
10-6 m
10-7 m
10-8 m
10-9 m
10-10 m
Vis
ible
Th
e N
an
ow
orl
d
1,000 nanometers =
Infr
ared
Ult
ravi
ole
t
Mic
row
ave
So
ft x
-ray
1,000,000 nanometers =
Zone plate x-ray “lens” Outermost ring spacing
~35 nm
Office of Basic Energy Sciences Office of Science, U.S. DOE Version 03-05-02
Mic
rost
ruct
ure
of
Org
anic
Sh
ale
s
Bacteria
Viruses
p
h
electrons @ 200 kV v ~ 0.7c λ~ 2.5 pm
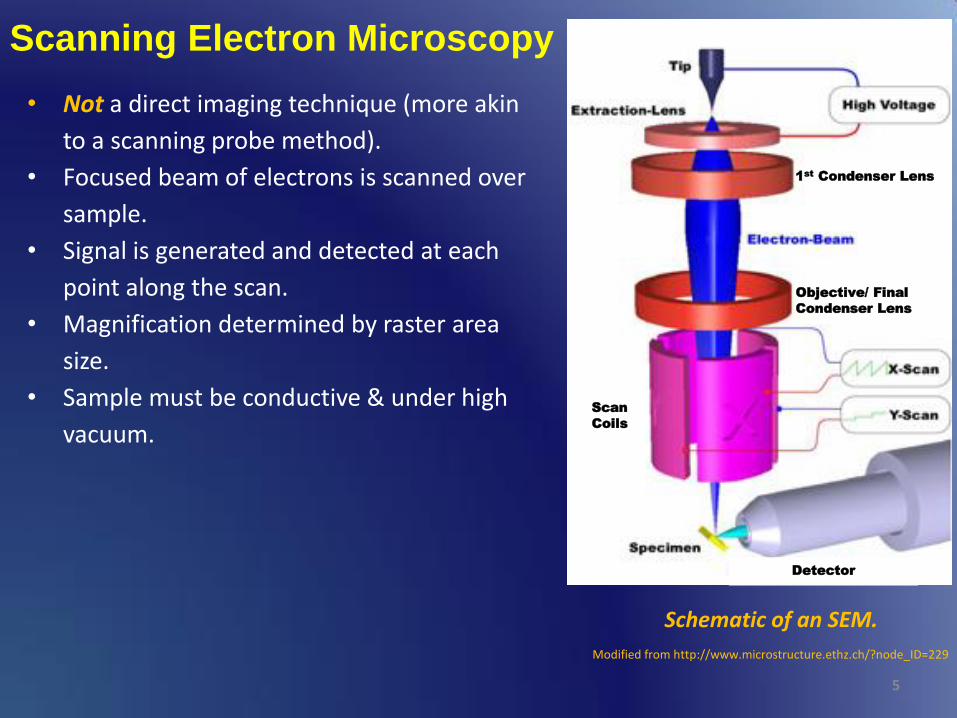
Scanning Electron Microscopy
• Not a direct imaging technique (more akin
to a scanning probe method).
• Focused beam of electrons is scanned over
sample.
• Signal is generated and detected at each
point along the scan.
• Magnification determined by raster area
size.
• Sample must be conductive & under high
vacuum.
Modified from http://www.microstructure.ethz.ch/?node_ID=229
Schematic of an SEM.
5
1st
Condenser Lens
Objective/ Final
Condenser Lens
Scan
Coils
Detector
B
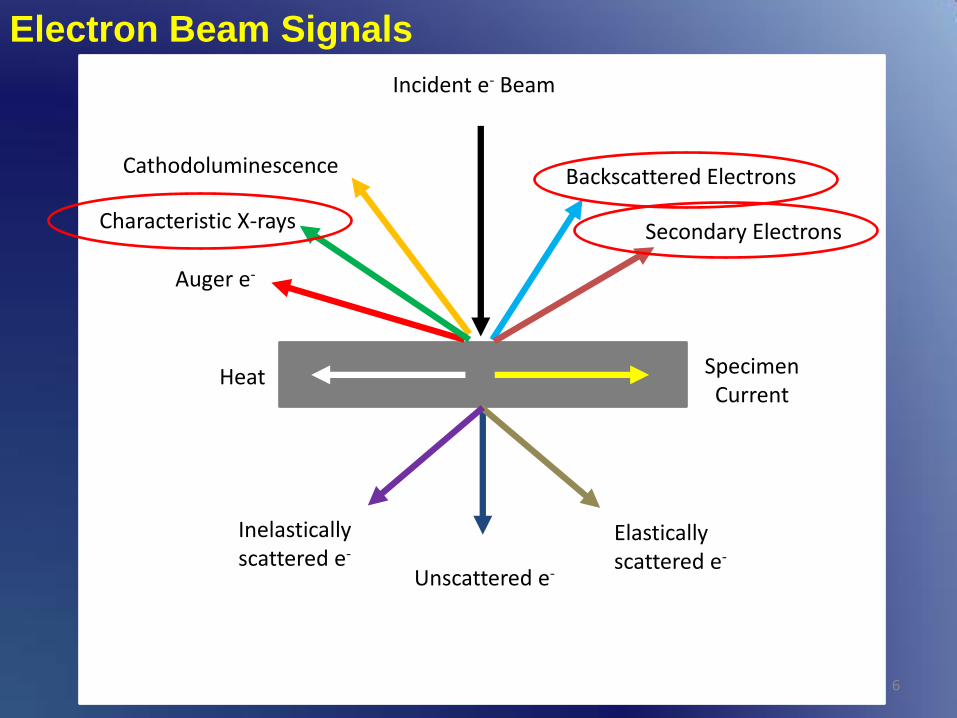
Electron Beam Signals
6
Incident e- Beam
Auger e-
Cathodoluminescence
Characteristic X-rays
Backscattered Electrons
Secondary Electrons
Heat Specimen Current
Unscattered e-
Elastically scattered e-
Inelastically scattered e-
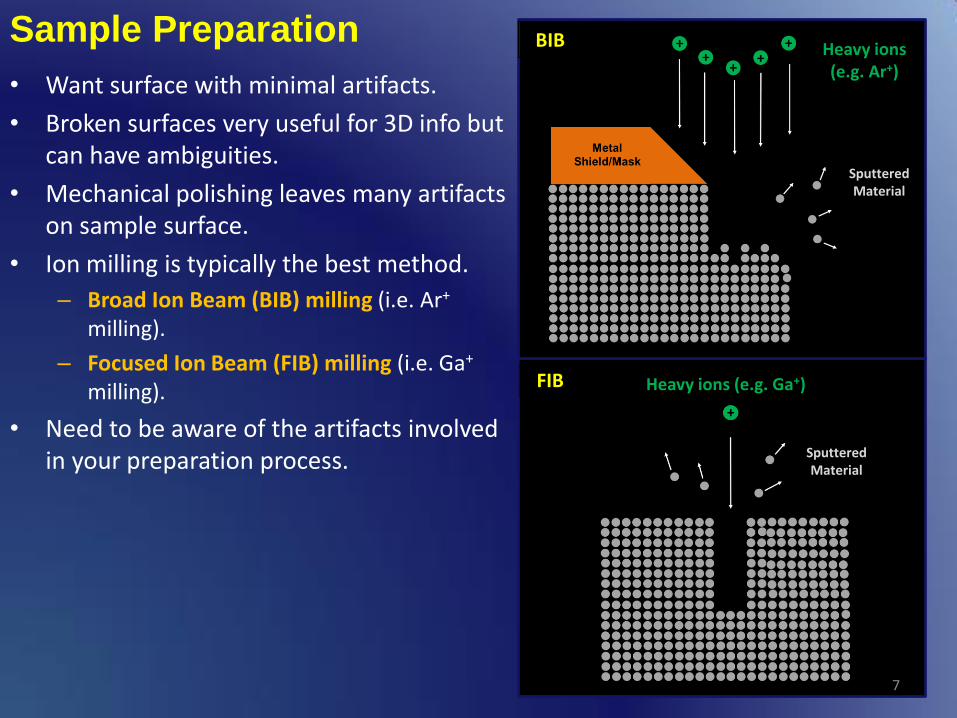
Sample Preparation
• Want surface with minimal artifacts.
• Broken surfaces very useful for 3D info but can have ambiguities.
• Mechanical polishing leaves many artifacts on sample surface.
• Ion milling is typically the best method.
– Broad Ion Beam (BIB) milling (i.e. Ar+ milling).
– Focused Ion Beam (FIB) milling (i.e. Ga+ milling).
• Need to be aware of the artifacts involved in your preparation process.
7
BIB
FIB
Heavy ions (e.g. Ar+)
Heavy ions (e.g. Ga+)
Sputtered Material
Sputtered Material
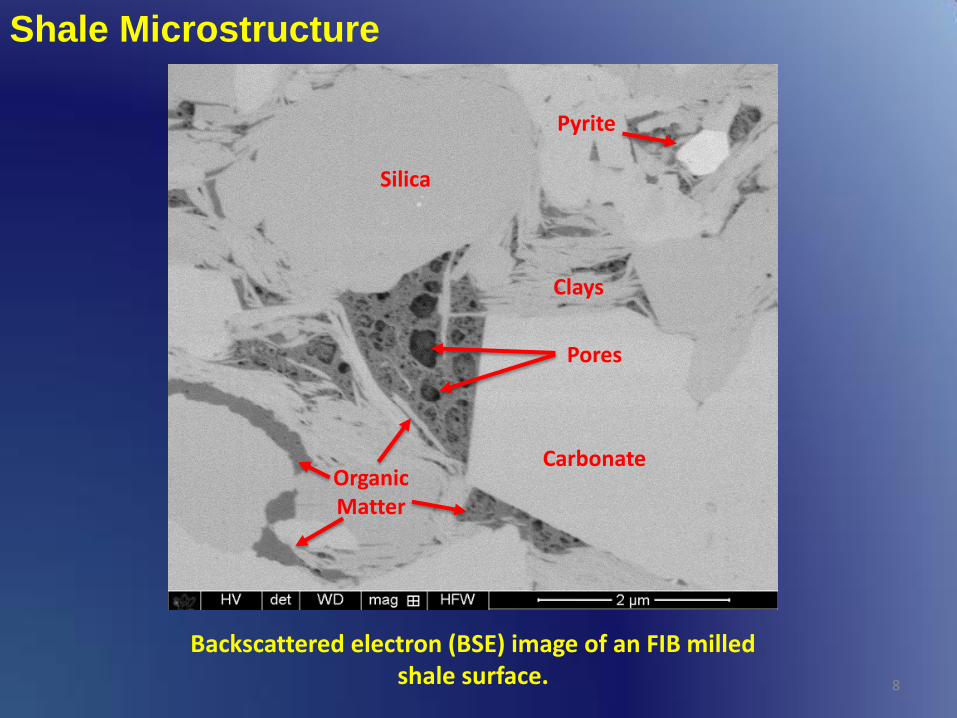
Shale Microstructure
8
Carbonate
Clays
Silica
Organic Matter
Pores
Pyrite
Backscattered electron (BSE) image of an FIB milled shale surface.
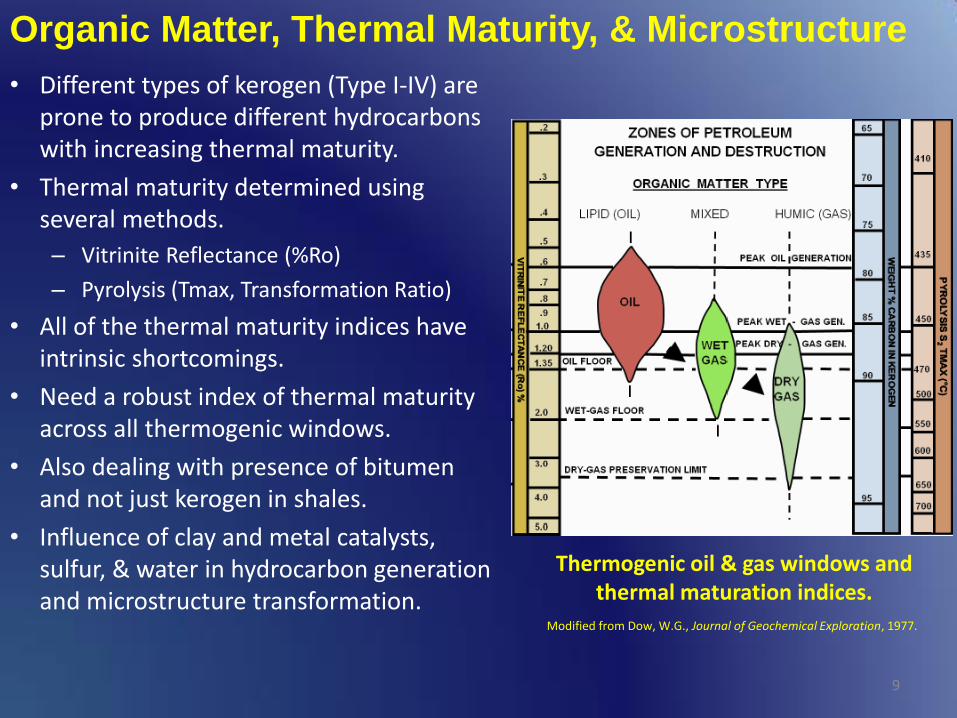
Organic Matter, Thermal Maturity, & Microstructure
• Different types of kerogen (Type I-IV) are prone to produce different hydrocarbons with increasing thermal maturity.
• Thermal maturity determined using several methods.
– Vitrinite Reflectance (%Ro)
– Pyrolysis (Tmax, Transformation Ratio)
• All of the thermal maturity indices have intrinsic shortcomings.
• Need a robust index of thermal maturity across all thermogenic windows.
• Also dealing with presence of bitumen and not just kerogen in shales.
• Influence of clay and metal catalysts, sulfur, & water in hydrocarbon generation and microstructure transformation.
9
Thermogenic oil & gas windows and thermal maturation indices.
Modified from Dow, W.G., Journal of Geochemical Exploration, 1977.
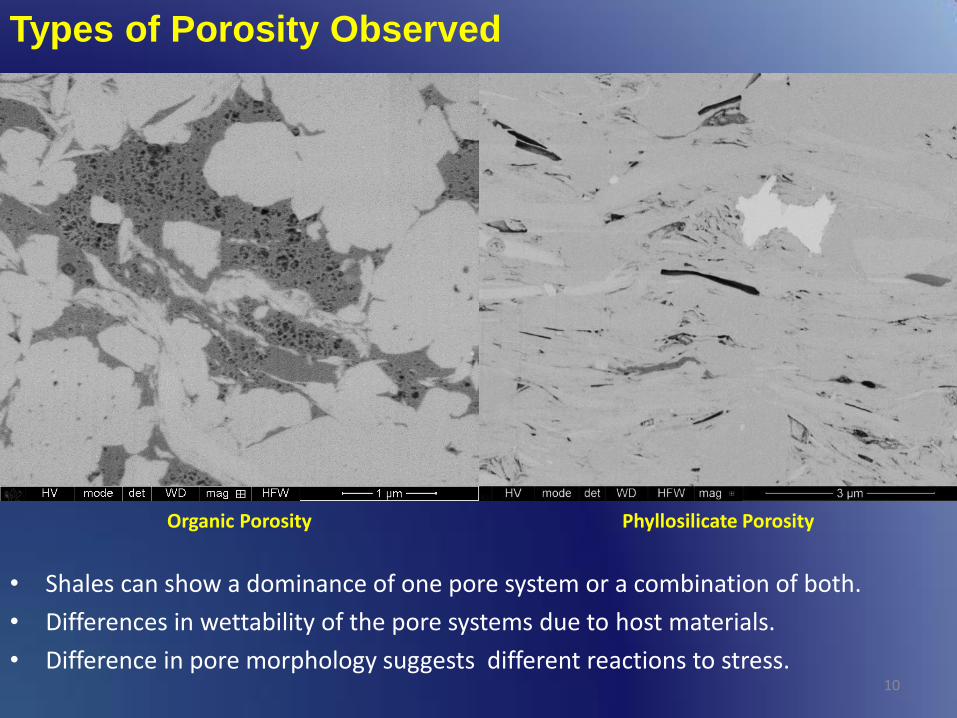
Types of Porosity Observed
10
Organic Porosity Phyllosilicate Porosity
• Shales can show a dominance of one pore system or a combination of both.
• Differences in wettability of the pore systems due to host materials.
• Difference in pore morphology suggests different reactions to stress.

• STEM imaging of organic matter shows it to have a nebulous structure. • Organic networks show high degree of connectivity in 3D FIB/SEM tomography. • Together these raise the possibility of connected pathway for flow through the
organic matter. • Eventually must connect up to a fracture. • In systems with both organic porosity and inorganic matrix porosity, need to
determine whether flow is predominantly in series or parallel.
11
Importance of Organic Porosity
3D reconstruction of shale microstructure
Organic network: 93.6% is a single
connected network
ADF STEM image of organic matter in shale
Curtis et al., SPE144391, 2011

3D Pore Size Distributions
12
Pores
Curtis, M.E. et al., AAPG Bulletin, 2012.
Large pores dominate the volume but the small pores may limit the radius of connected pathways!
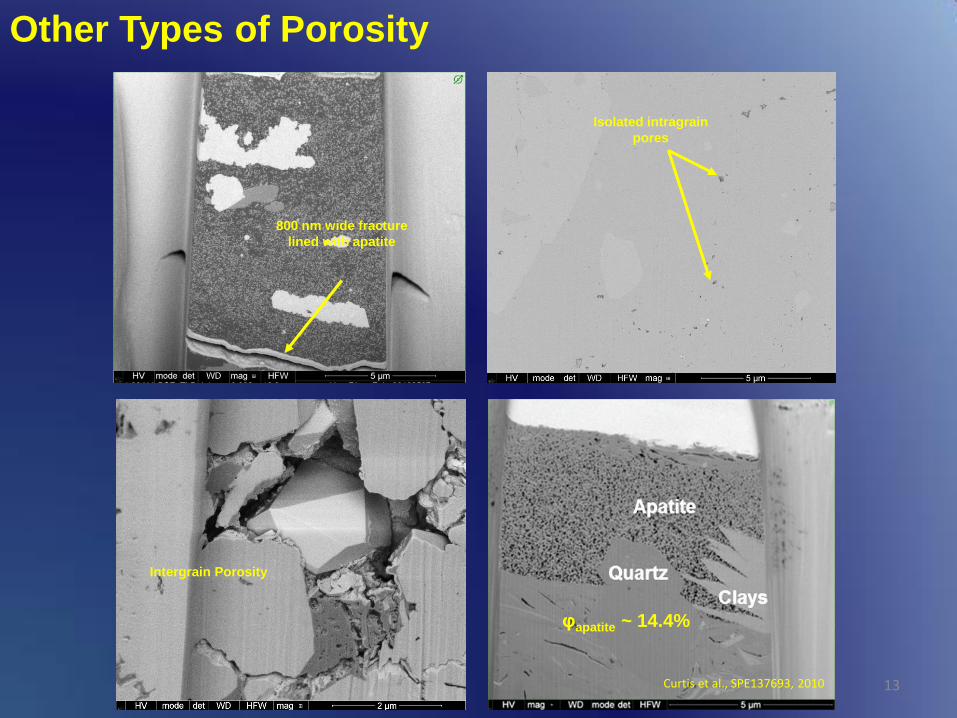
Other Types of Porosity
13
φapatite ~ 14.4%
800 nm wide fracture
lined with apatite
Isolated intragrain
pores
Intergrain Porosity
Curtis et al., SPE137693, 2010

Microstructure in Wet & Dry Gas Windows
Organic Pores
Inorganic Pores
14 Curtis, M.E. et al., URTeC, 2013.

Microstructure in the Oil Window
Note the complete lack of porosity in the organic matter. Some cracks can be seen
on the edge of the organic matter between it the inorganic grains.
Possible that pores destroyed due to further compaction.
Curtis, M.E. et al., International Journal of Coal Geology, 2012.
Curtis et al., SPE164540, 2013 15
Woodford Shale Bakken Shale
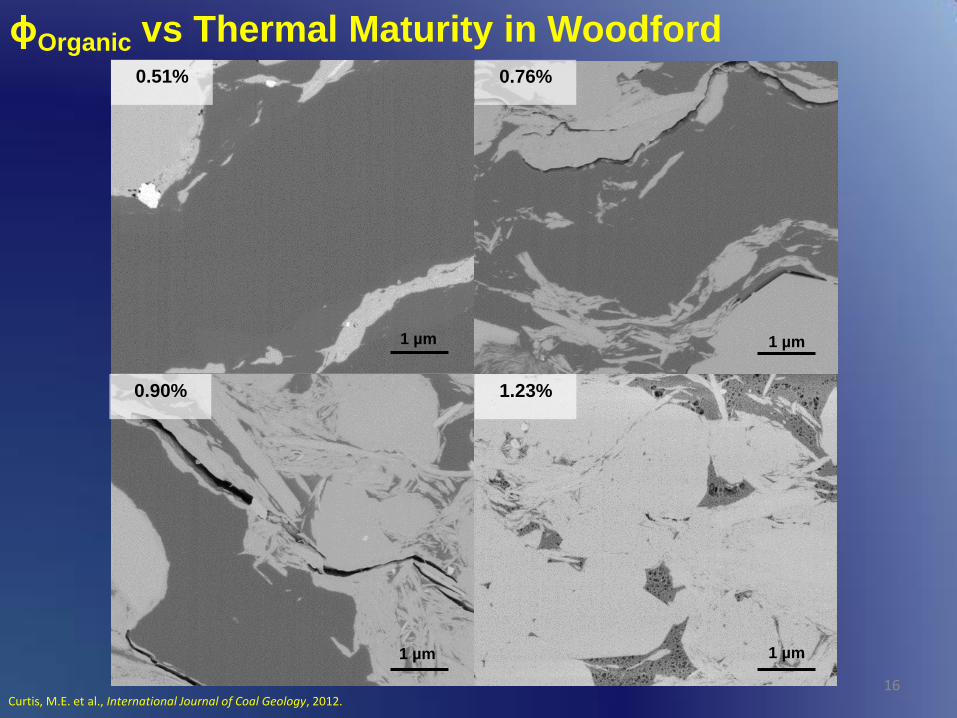
ϕOrganic vs Thermal Maturity in Woodford
16
0.51% 0.76%
0.90% 1.23%
1 µm 1 µm
1 µm 1 µm
Curtis, M.E. et al., International Journal of Coal Geology, 2012.
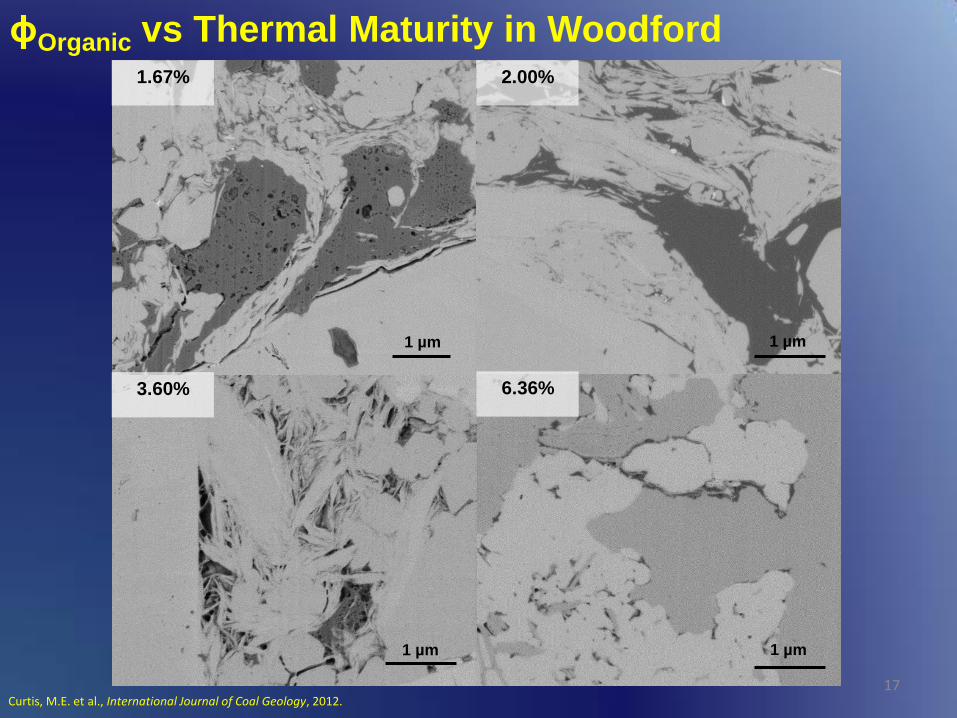
ϕOrganic vs Thermal Maturity in Woodford
17
1.67% 2.00%
3.60% 6.36%
1 µm 1 µm
1 µm 1 µm
Curtis, M.E. et al., International Journal of Coal Geology, 2012.
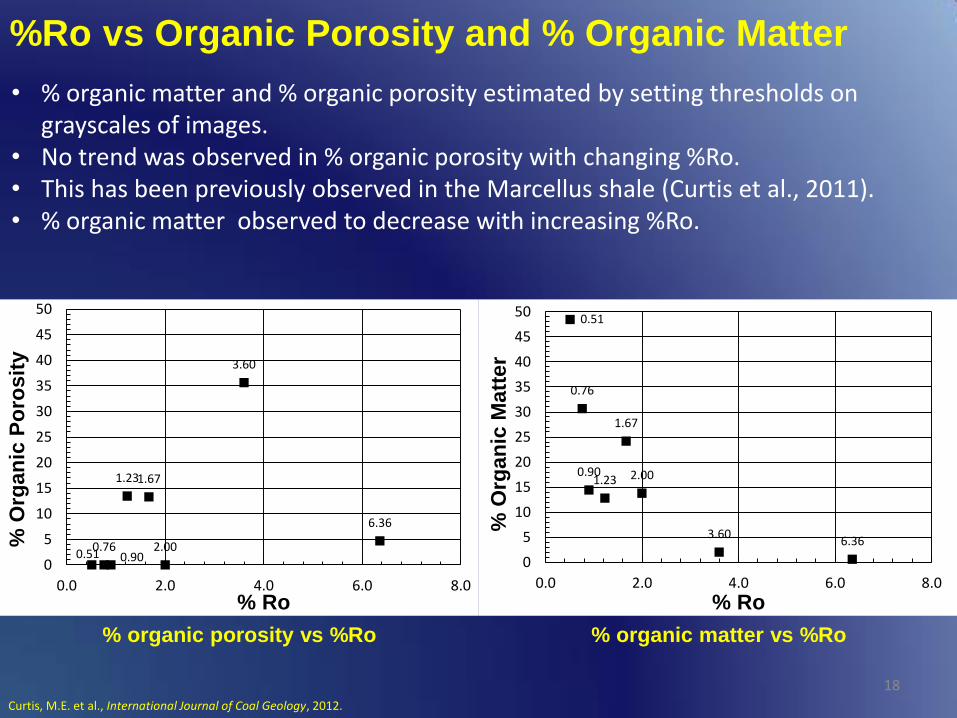
%Ro vs Organic Porosity and % Organic Matter
18
• % organic matter and % organic porosity estimated by setting thresholds on grayscales of images.
• No trend was observed in % organic porosity with changing %Ro. • This has been previously observed in the Marcellus shale (Curtis et al., 2011). • % organic matter observed to decrease with increasing %Ro.
% organic porosity vs %Ro
0.51
0.76
0.90 1.23
1.67
2.00
3.60 6.36
0
5
10
15
20
25
30
35
40
45
50
0.0 2.0 4.0 6.0 8.0
% O
rga
nic
Ma
tte
r
% Ro
0.51 0.76
0.90
1.23 1.67
2.00
3.60
6.36
0
5
10
15
20
25
30
35
40
45
50
0.0 2.0 4.0 6.0 8.0
% O
rgan
ic P
oro
sit
y
% Ro
% organic matter vs %Ro
Curtis, M.E. et al., International Journal of Coal Geology, 2012.
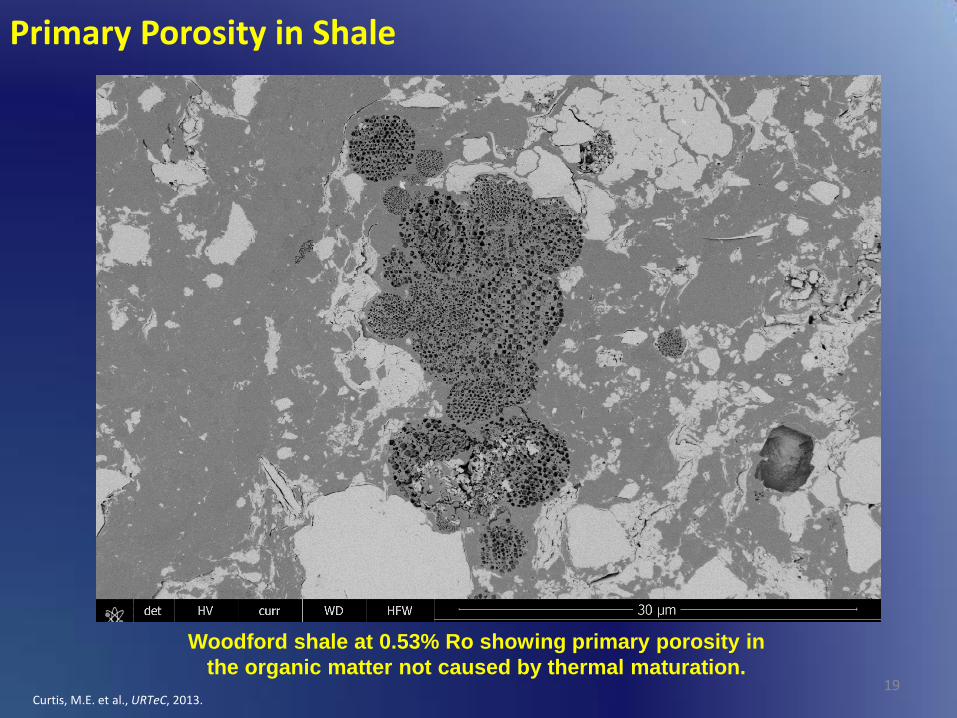
Primary Porosity in Shale
Woodford shale at 0.53% Ro showing primary porosity in
the organic matter not caused by thermal maturation.
19 Curtis, M.E. et al., URTeC, 2013.

Incomplete Porosity Formation
Woodford shale at 1.4 %Ro showing non-uniform
porosity formation in the organic matter. This suggests
that something in addition to thermal maturity (e.g. type
of organic matter) is controlling organic pore formation.
Curtis, M.E. et al., International Journal of Coal Geology, 2012.
20
Shales in the Oil Window
21
• Oil window samples show a general lack of porosity in the organic matter.
• Fits idea that secondary organic matter nanoporosity is a result of gas generation (Bernard et al., 2012; Loucks et al., 2009; Schieber, 2010).
• Lack of porosity presents a problem for storage and transport in the shales known to produce oil.
– In the case of Bakken, oil is stored in middle porous dolomite layer.
– Need to focus attention on porosity in inorganic matrix which could have significant storage.
– Possibility that there are thinly stacked layers of source & storage in shales below the log scale.
– Question still remains how does oil get to these layers.
– Are there pores below the resolution of the microscope and how significant is this population?

22
Avalon Shale Microstructure
2 Wells ~ 1 mile apart
*Samples courtesy the Mewbourne Oil Company
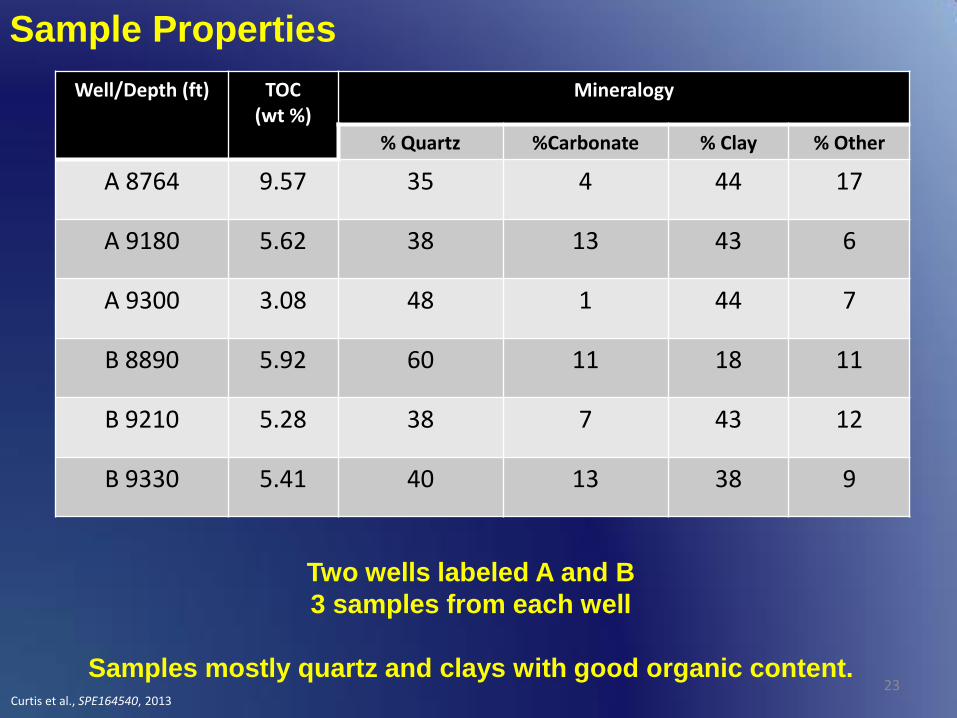
Sample Properties
23
Well/Depth (ft) TOC (wt %)
Mineralogy
% Quartz %Carbonate % Clay % Other
A 8764 9.57 35 4 44 17
A 9180 5.62 38 13 43 6
A 9300 3.08 48 1 44 7
B 8890 5.92 60 11 18 11
B 9210 5.28 38 7 43 12
B 9330 5.41 40 13 38 9
Two wells labeled A and B
3 samples from each well
Samples mostly quartz and clays with good organic content. Curtis et al., SPE164540, 2013

Pyrolysis Results
24
Pyrolysis indicates that the kerogen is type III.
Indicates thermal maturity of well B is slightly
greater than A, but unfortunately the error bars
overlap. May explore FTIR to better determine
the thermal maturity of each well.
Well No. of Samples
Depth range
(ft)
Ave.Tmax (°C)
% Ro equiv.
S1/(S1+S2)
A 10 8840-9334
435 ± 3 0.67 0.21
B 20 8640-9440
439 ± 4 0.75 0.26
Curtis et al., SPE164540, 2013
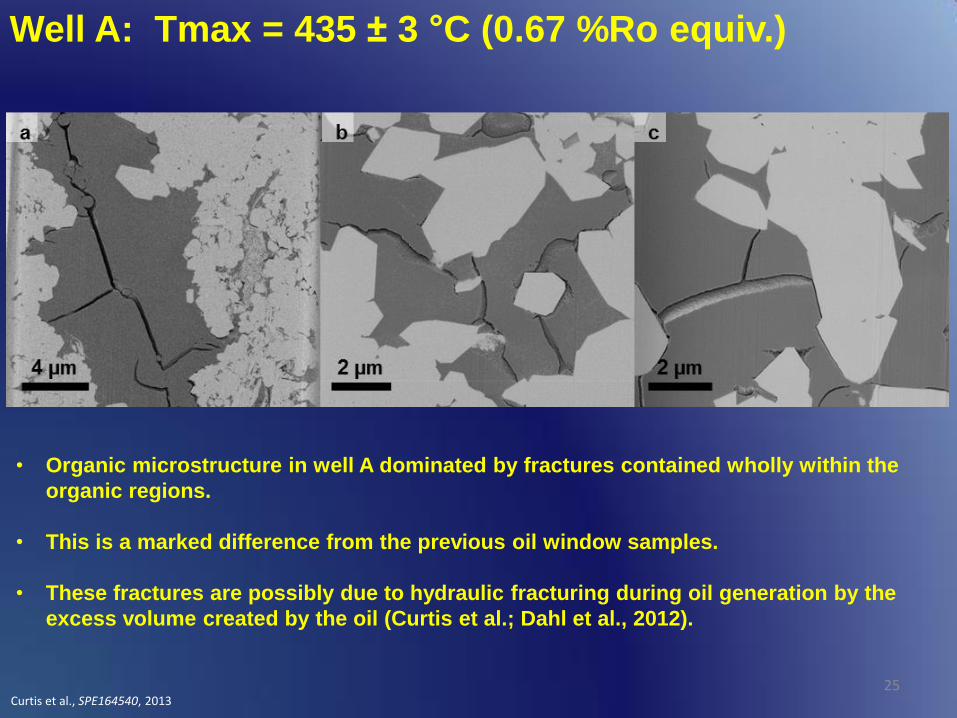
Well A: Tmax = 435 ± 3 °C (0.67 %Ro equiv.)
25
• Organic microstructure in well A dominated by fractures contained wholly within the
organic regions.
• This is a marked difference from the previous oil window samples.
• These fractures are possibly due to hydraulic fracturing during oil generation by the
excess volume created by the oil (Curtis et al.; Dahl et al., 2012).
Curtis et al., SPE164540, 2013
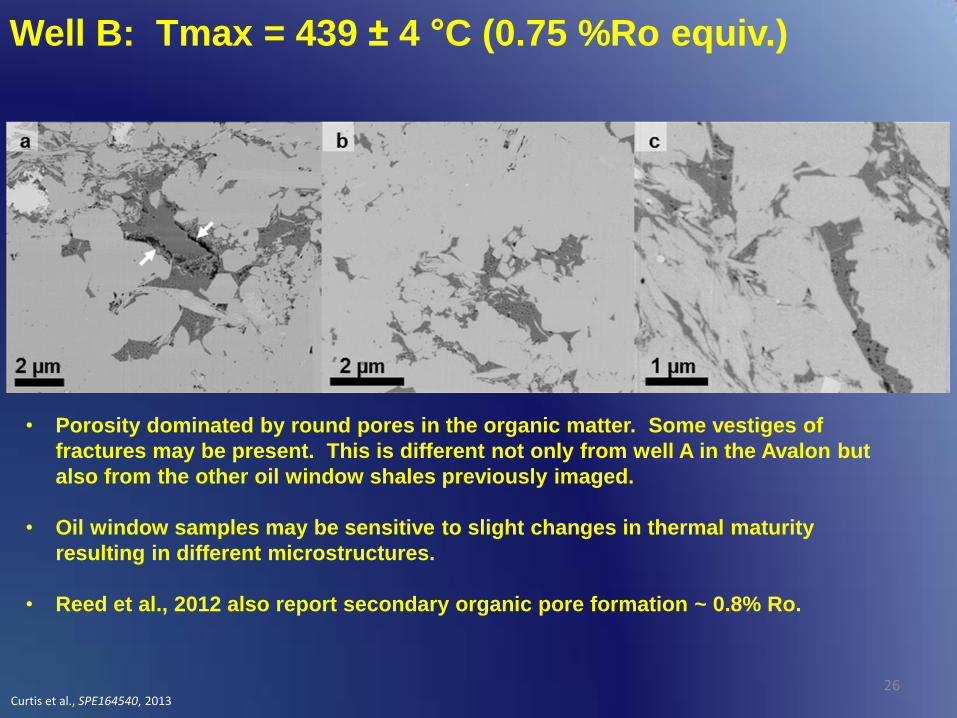
Well B: Tmax = 439 ± 4 °C (0.75 %Ro equiv.)
• Porosity dominated by round pores in the organic matter. Some vestiges of
fractures may be present. This is different not only from well A in the Avalon but
also from the other oil window shales previously imaged.
• Oil window samples may be sensitive to slight changes in thermal maturity
resulting in different microstructures.
• Reed et al., 2012 also report secondary organic pore formation ~ 0.8% Ro.
Curtis et al., SPE164540, 2013 26

EDS of Organic Matter
27
Organic region from well A found to contain sulfur. The organic regions from other
samples investigated showed no sulfur content.
Curtis et al., SPE164540, 2013
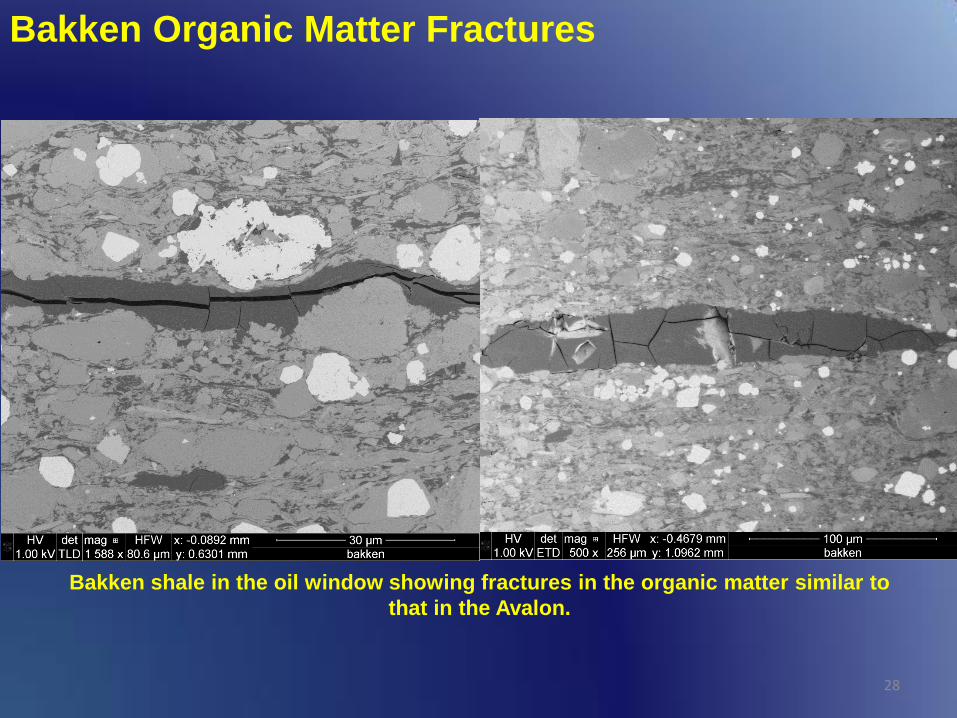
Bakken Organic Matter Fractures
28
Bakken shale in the oil window showing fractures in the organic matter similar to
that in the Avalon.
Conclusions
• Wet and dry gas window samples have organic matter dominated by nanoporosity. Few exceptions have been found.
• Not all organic matter regions within a shale show the same microstructure at a given thermal maturity suggesting other factors (e.g. organic matter type) complicate porosity development.
• Oil window samples exhibit a complex microstructure in the organic matter that is as of yet hard to predict.
– Many oil window samples have no form of porosity in the organic matter. Need to look for storage areas in the inorganic matrix.
– Fractures dominate the structure of organic matter of oil window samples from an Avalon shale well whereas ~ 1 mile away round pores in the organic matter dominate.
– Differences in microstructure of organic matter between the two Avalon may be due to slight differences in thermal maturity but results are inconclusive.
29

Acknowledgements
30
• Thanks to Dr. Carl Sondergeld & Chandra Rai (University of Oklahoma).
• Thanks to Gary Stowe & Jeremy Jernigen (University of Oklahoma).
• Thanks to Brian Cardott at the OGS for providing some of the Woodford samples and performing some of the vitrinite reflectance measurements.


