Research Report DCSF-RR048 Effective Pre-school and Primary Education 3-11 Project (EPPE 3-11) Pam Sammons $ , Kathy Sylva + , Edward Melhuish # , Imran Siraj-Blatchford*, Brenda Taggart* and Stephen Hunt* $ University of Nottingham, +University of Oxford # Birkbeck, University of London *Institute of Education, University of London Influences on Children’s Attainment and Progress in Key Stage 2: Cognitive Outcomes in Year 6
Transcript
Research Report DCSF-RR048
Effective Pre-school and Primary Education 3-11 Project (EPPE 3-11)
Pam Sammons$, Kathy Sylva+, Edward Melhuish#, Imran Siraj-Blatchford*, Brenda Taggart* and Stephen Hunt* $University of Nottingham, +University of Oxford #Birkbeck, University of London *Institute of Education, University of London
Influences on Children’s Attainment and Progress in Key Stage 2:
Cognitive Outcomes in Year 6
Effective Pre-school and Primary Education 3-11 Project (EPPE 3-11)
Influences on Children’s Attainment
and Progress in Key Stage 2: Cognitive Outcomes in Year 6
Pam Sammons$, Kathy Sylva+, Edward Melhuish#
Iram Siraj-Blatchford*, Brenda Taggart* and Stephen Hunt*
$University of Nottingham, +University of Oxford+, #Birkbeck, University of London
ACKNOWLEDGEMENT The EPPE 3-11 project is a major longitudinal study funded by the DCSF. The research would not be possible without the support and co-operation of the six Local Authorities (LAs) and the many pre-school centres, primary schools, children and parents participating in the research. We are particularly grateful to Wesley Welcomme for his contribution in preparing this report.
Contents Page Number
Executive Summary i
Introduction 1 Aims 2
Methods 2
Structure of Report and Analyses 3
Section 1: Characteristics of the Sample at the end of Year 6 5 Cognitive assessments 9
Associations between children‟s attainments in different outcomes and over time 10
Differences in attainment for different groups of children 10 Gender 10
Ethnicity and language 10
Parents‟ qualification level 12
Socio-economic status (SES) and eligibility for free school meals (FSM) 13
Special educational needs (SEN) 15
Multiple Disadvantage 15
Early years Home Learning Environment (HLE) 15
Pre-school 16
Primary school academic effectiveness 17
Section 2: Children’s Cognitive Attainments at the End of Year 6 in Primary School: The Impact of Different Child, Family and Home Learning Environment (HLE)
Characteristics 19
Child measures 22
Gender 22
Birth weight 22
Family size 22
Early developmental problems 22
EAL and Ethnicity 22
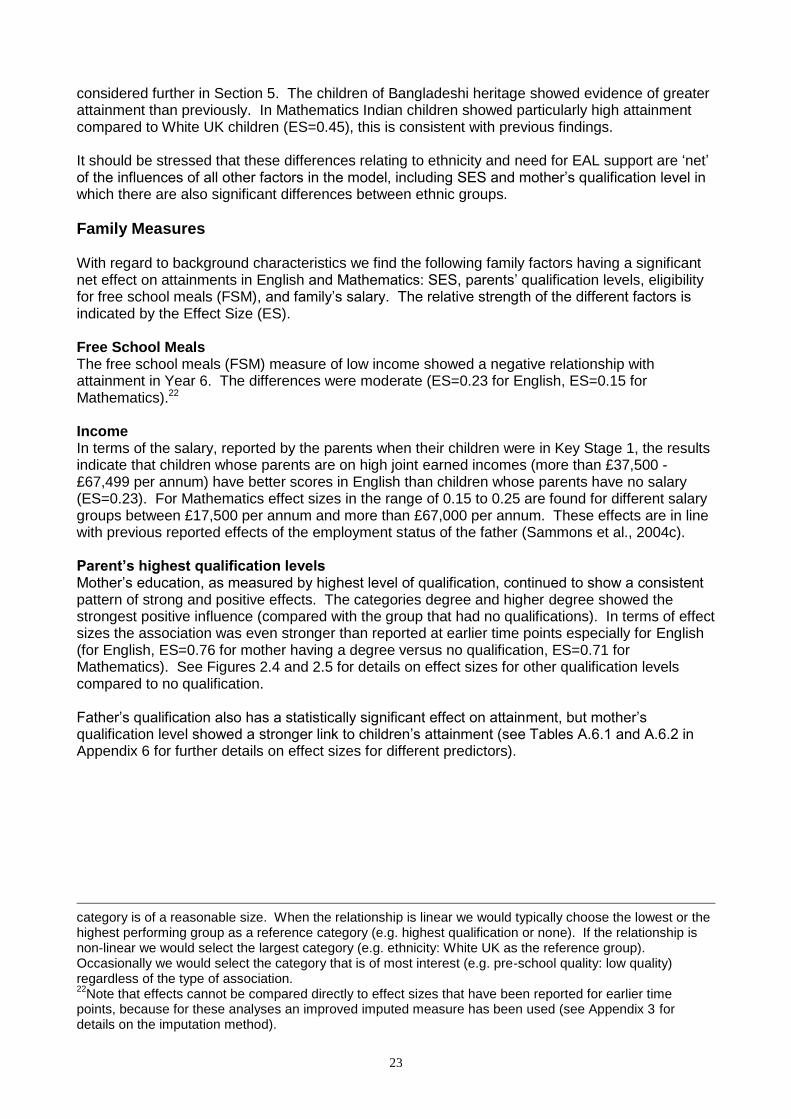
Family Measures 23
Free School Meals 23
Income 23
Parent‟s highest qualification levels 23
Early years Home Learning Environment (HLE) Measures 25
Key Stage 1 Home Learning Environment (HLE) 27
Neighbourhood „influence‟ 27
Summary of Background Influences 28
Section 3: Exploring the Impact of Background Factors on Children’s Cognitive
Attainments in Year 6 Compared to Year 2 29
Child Measures 29
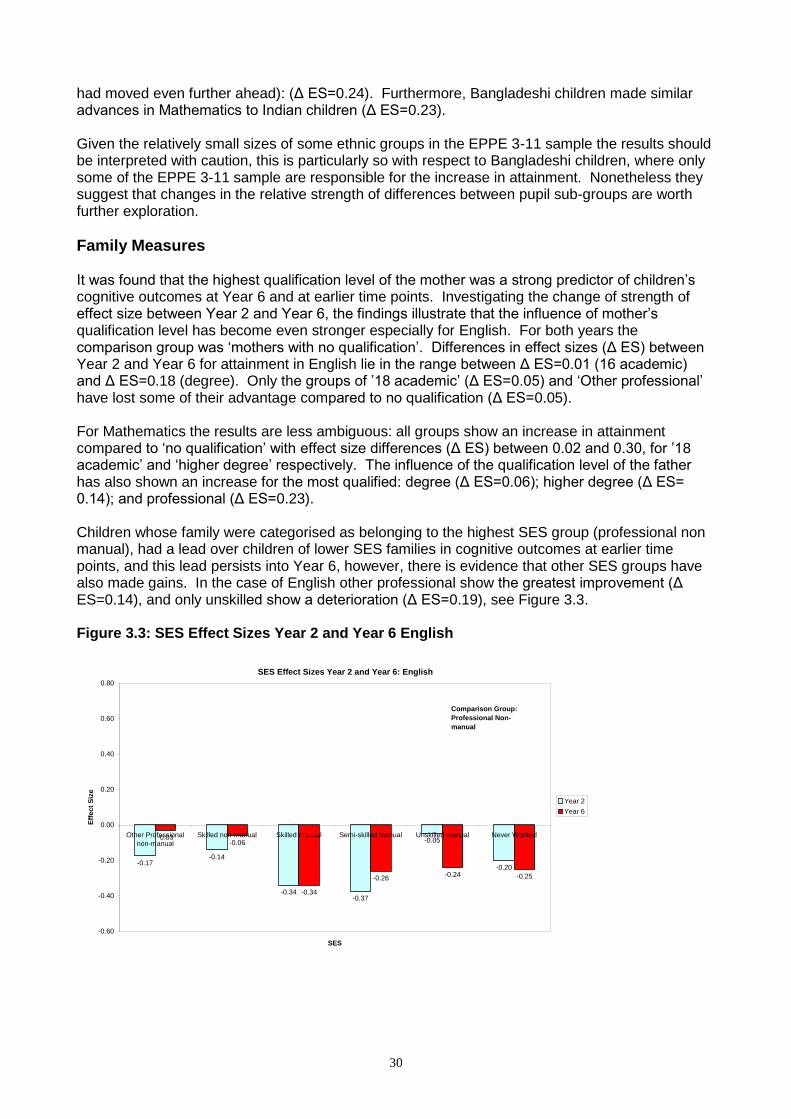
Family Measures 30
Early years Home Learning Environment (HLE) Measures 31
Section 4: Children’s Cognitive Attainments at the end of Year 6 in Primary School:
The Impact of Pre-school and Primary School 34
The impact of pre-school experience on Year 6 attainment 34
The impact of pre-school attendance, duration of pre-school experience and type of pre-school 35
The impact of pre-school centre quality 36
The impact of pre-school centre effectiveness 37
Different pre-school effects for different groups of children 39
The combined impact of pre-school experience and Early years Home Learning Environment (HLE) 39
Early years HLE and Pre-school attendance 39
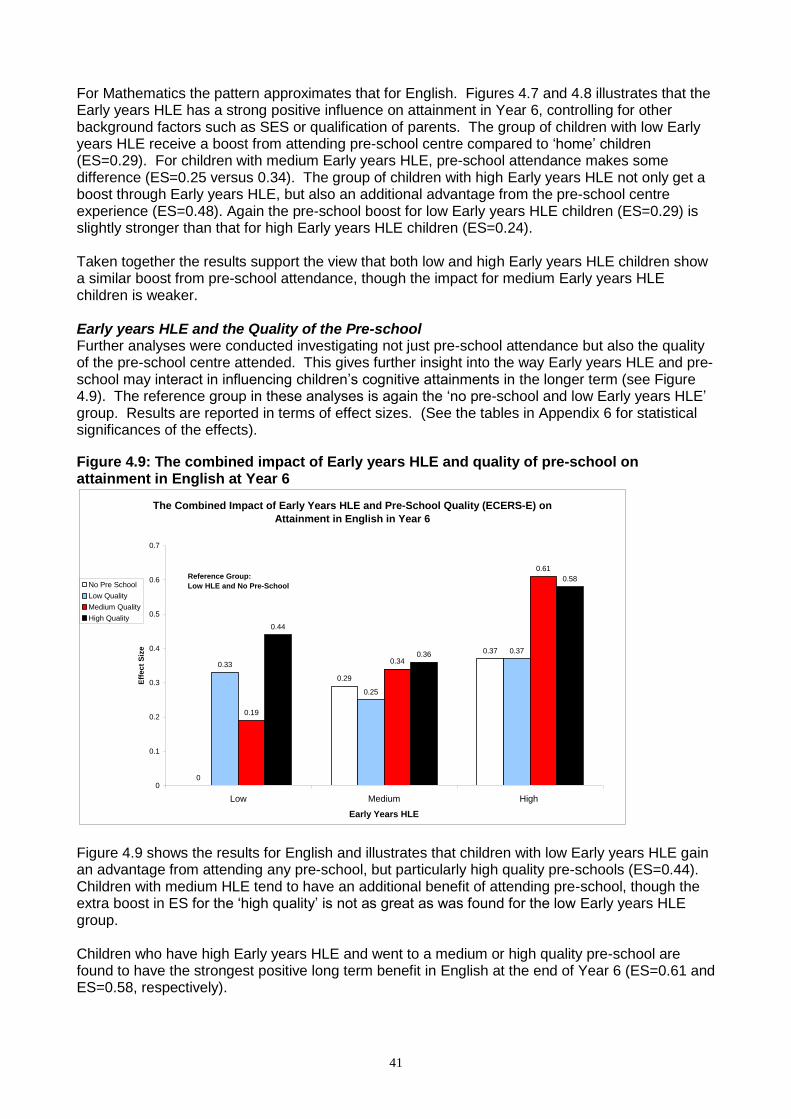
Early years HLE and the Quality of the Pre-school 39
Early years HLE and Pre-school Effectiveness 41
Multiple disadvantage and the impact of pre-school experience 43
Parents‟ qualification level and the impact of pre-school experience 44
The impact of primary school effectiveness 45
Different influences of primary school effectiveness for different groups of children 49
Multiple disadvantage and the impact of primary school effectiveness 49
Parents‟ qualification level and the impact of primary school effectiveness 49
The combined impact of pre-school experience and primary school effectiveness 50
The combined impact of pre-school effectiveness and primary school effectiveness 51
Mobility during pre-school and primary school 53
Summary of Pre- and Primary School Influences 55
Section 5: Exploring Relative Cognitive Progress across Key Stage 2 between Year
2 and Year 6 of Primary School Education 56
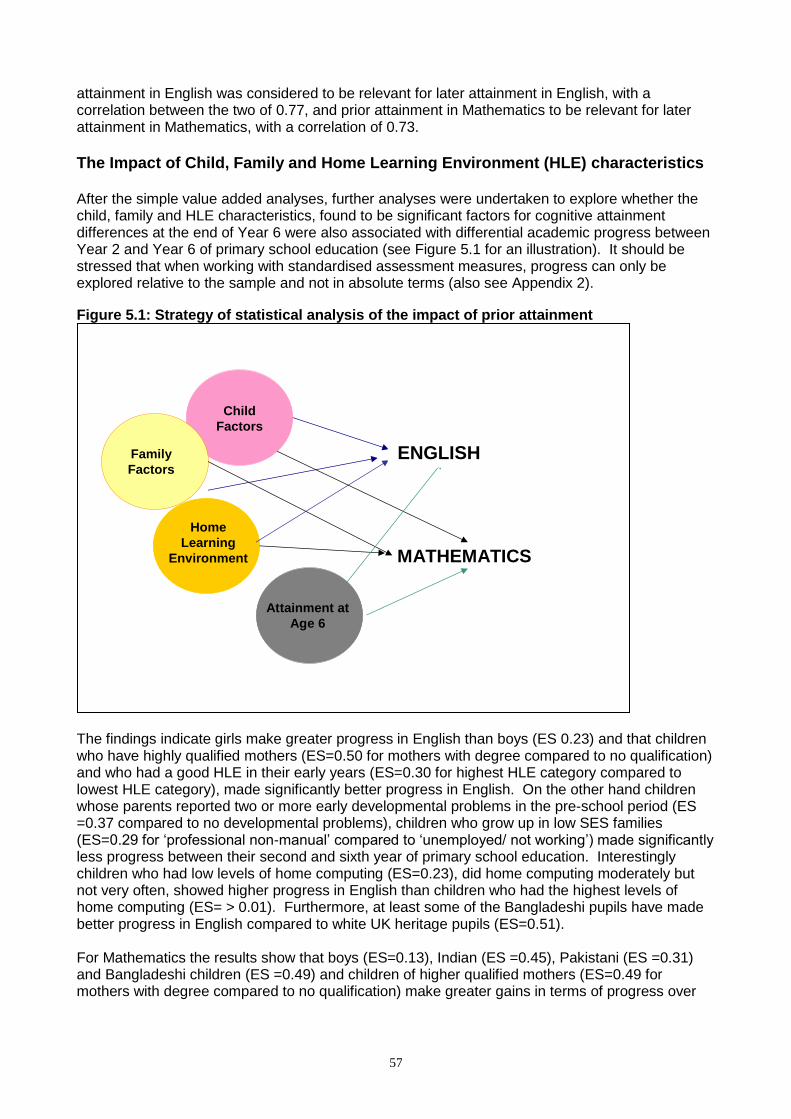
The Impact of Child, Family and Home Learning Environment (HLE) characteristics 57
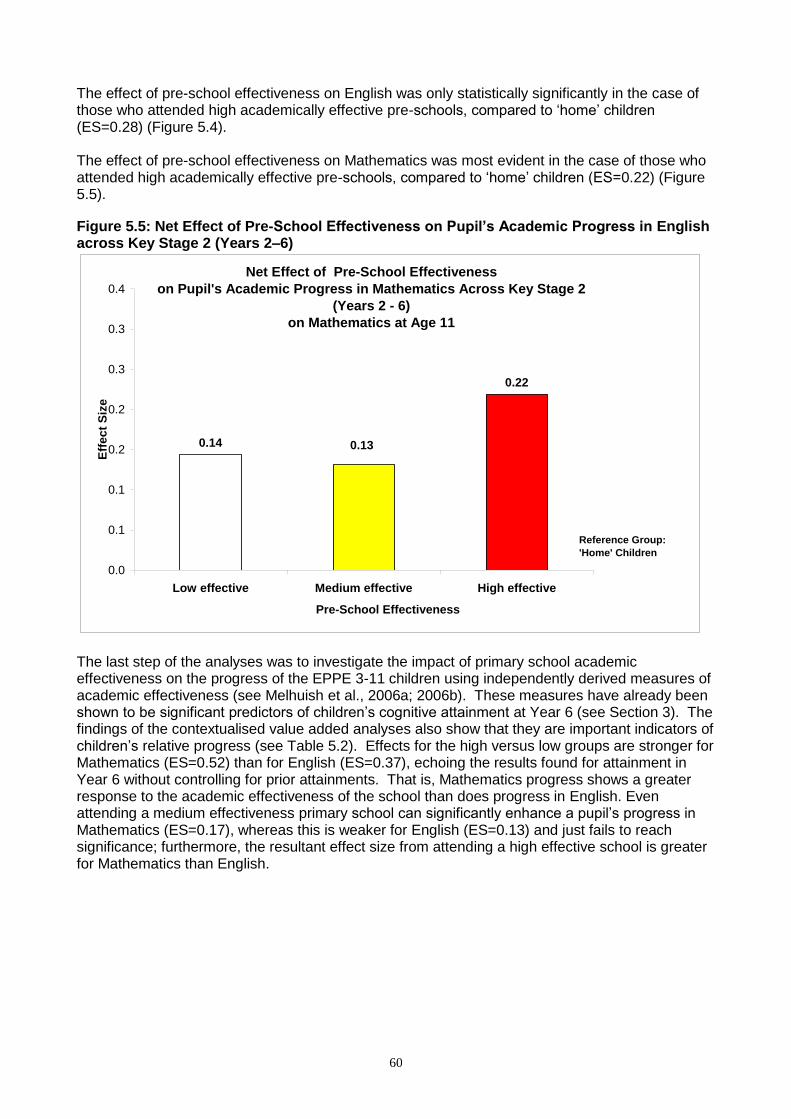
The Impact of Pre- and Primary School Experience 58
Section 6: Summary and Conclusions 62
The Impact of Child, Family and HLE characteristics 62
Educational influences 63
Implications 66
References 68
Appendix 1: EPPE Technical Papers in the series 72
Appendix 2: How accurate are the current measures as indicators of progress in
primary education? 74
Appendix 3: EPPE 3-11 imputation of missing data 78
Appendix 4: Raw differences in attainment in English and Mathematics at the end
of Year 6 79
Appendix 5: Details of Selected Measures used in the EPPE 3-11 81
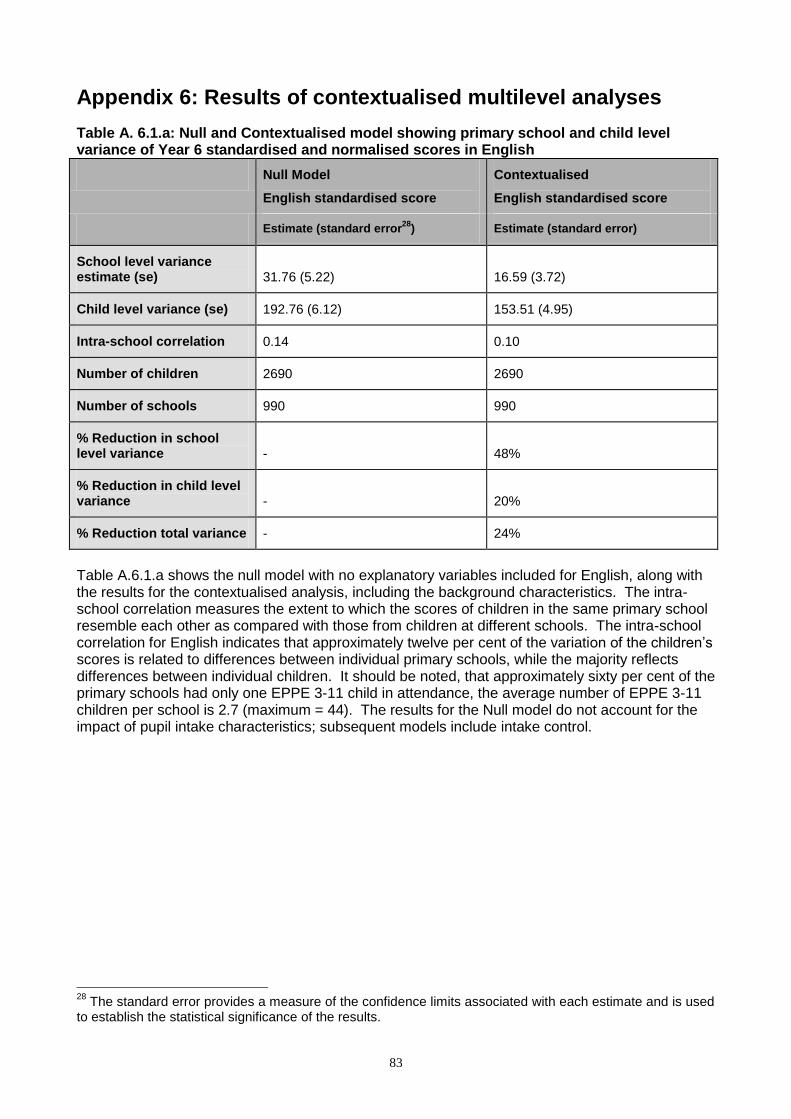
Appendix 6: Results of contextualised multilevel analyses 83
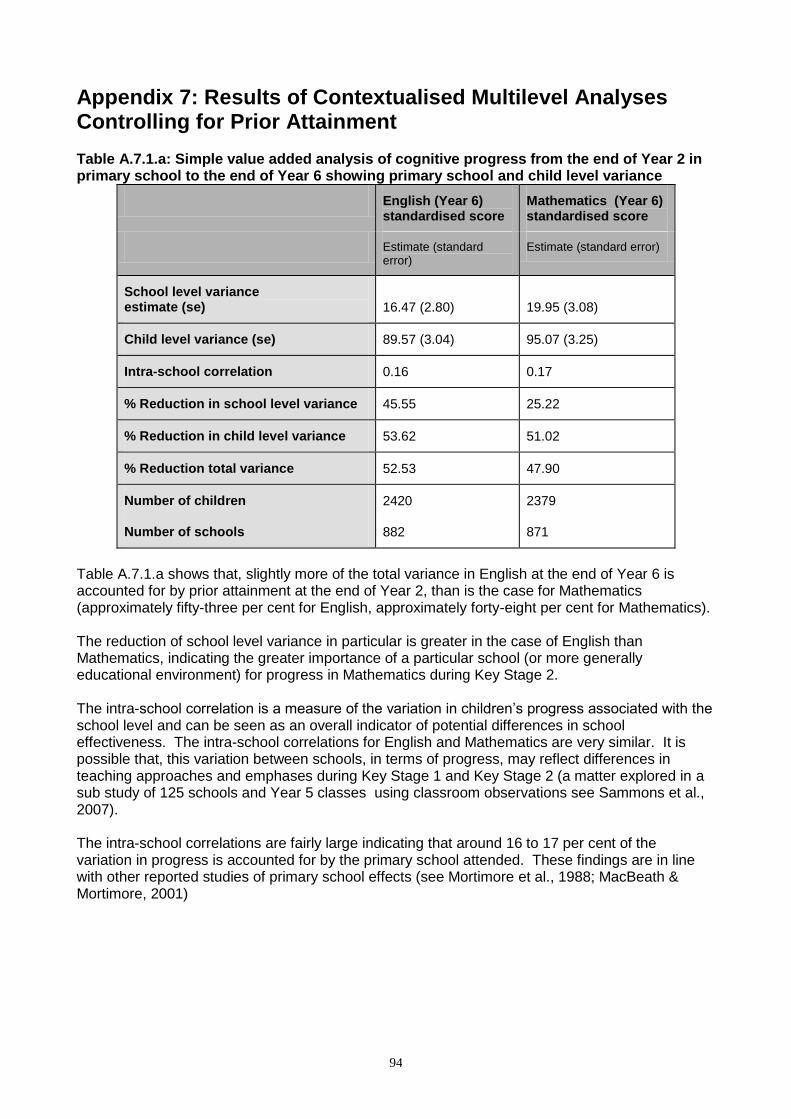
Appendix 7: Results of Contextualised Multilevel Analyses Controlling for Prior
Attainment 94
Glossary of terms 100
i
Executive Summary The report presents the results of analyses related to the primary school phase of a major longitudinal study investigating the influence of pre-school and primary school on children‟s development (EPPE 3-11) in England. Specifically, this report is concerned with children‟s cognitive attainments at the end of Year 6 when the children were aged eleven, and their academic progress from the age of seven to eleven: Key Stage 2. The findings also extend and develop the findings from previous earlier ages. A report on children‟s social/behavioural development throughout this period will be published separately (Sammons et al., forthcoming). Originally the study began as the Effective Provision of Pre-school Education (EPPE) project: a pre-school sample was recruited to the study at age 3 years and followed to the age of seven - the end of Key Stage 1 (Year 2) in primary school. An additional „home‟ sample of children (who had not attended pre-school) was recruited at the start of primary school. The EPPE 3-11 project is an extension of this initial research and follows the same sample (pre-school and „home‟ children) to the end of primary schooling at age 11 years plus. Throughout, the research has been based on an educational effectiveness design and mixed methods approach (Sammons et al., 2005; Siraj-Blatchford et al., 2006). This is done in order to investigate child, family and home influences on developmental outcomes so that the relative importance of specific background influences can be studied in relation to the strength of pre-school and primary school factors. EPPE 3-11 has gathered a wide range of data on children‟s development, child, family, home learning environment (HLE), and pre-school characteristics. Additional value added measures of primary schools derived from multilevel statistical analyses of National assessment data for all primary schools in England (Melhuish et al., 2006a; 2006b) are also used to provide independent indicators of the academic effectiveness1 of primary schools. These are used to complement the measures of quality2 and effectiveness3 for pre-school settings. It is therefore possible to explore both pre-school and primary school influences on children‟s outcomes in Year 6. Standardised measures of National assessments in English4 and Mathematics have been used to provide measures of children‟s educational outcomes in Year 2 and again in Year
1 Independent indicators of primary school academic effectiveness were obtained from the analysis of National assessment data for several cohorts across all primary schools in England. Mean value added scores of school academic effectiveness across the years 2002 to 2004 were calculated for each primary school in England and then extracted for schools attended by children in the EPPE 3-11 sample. These value added measures provide indicators of a school‟s academic effectiveness in terms of National assessment performance.
2 Quality was measured for each pre-school centre using the aggregate score from the ECERS-E (see Glossary) across scores for the curricular activities of Literacy, Numeracy, and Science/knowledge of the world, and on Diversity of provision for children of different abilities, gender and cultures (Sylva et al., 1999).
3 Pre-school academic effectiveness: Measures of the effectiveness of individual pre-school centres were derived from value added models of the EPPE 3-11 children‟s actual progress during the pre-school period, controlling for prior attainment and pupil‟s background characteristics (Sammons et al., 2004a). That is, children‟s cognitive progress was analysed from age 3 to rising 5 years. These analyses provided measures of pre-school academic effectiveness.
4 “English” - the English National Assessment test at Key Stage 2 (KS2) is a combined measure of tests in writing, spelling and reading (via comprehension).
ii
6. The sample included 2701 children for whom English and/or Mathematics data were available at these two time points drawn from over 950 primary schools. The aims of the research were to:
Investigate any association between children‟s cognitive attainments at the end of Key Stage 2 (Year 6, age 11) and background child, family and home learning environment (HLE) characteristics.
Compare predictors of attainment in Key Stage 1 and 2.
Model children‟s current cognitive attainment in Year 6, and their progress over Key Stage 2.
Identify and investigate any persisting influence of pre-school attendance, and type of pre-school attended (against those who did not attend pre-school – the „home‟ sample).
Explore the influence of pre-school experience, particularly in terms of quality and academic effectiveness on later cognitive outcomes.
Examine the combined impact of the Home Learning Environment (HLE) and pre-school characteristics.
Investigate the influence of primary school academic effectiveness on cognitive attainment and progress, when child, family and home learning environment (HLE) characteristics have been taken into account.
Investigate the combined effect of pre-school experience and primary school experience on cognitive attainments.
Assess whether the impact of pre and primary school differs for more and less disadvantaged children.
The impact5 of child, family and Early years home learning environment (HLE) Throughout the research children are grouped by individual child, family and home learning environment (HLE) factors, such as ethnicity, Socio-Economic Status (SES) and the Home Learning Environment (HLE) (Melhuish et al., 2008), this allows variations in average attainment scores to be identified by sub-groups (e.g. by gender or ethnicity). Consequently, those children for whom there is an apparent attainment gap in English and / or Mathematics can be identified, along with factors that are significant predictors of academic attainment and/ or progress. The principal statistical approach employed involves contextualised multilevel analysis designed to identify the unique (net) contribution of specific factors, such as ethnicity, to variation in children‟s attainments at the end of Year 6, while controlling other background factors such as age, gender, and SES. Therefore, it can be established whether any apparent difference in attainment is associated with certain characteristics (such as ethnicity, is actually attributable to other socio-economic and demographic factors, such as SES or qualifications of parents). Key findings are reported later in this Summary. This approach was undertaken with respect to both Year 6 and earlier Year 2 attainment data, allowing the net effects of different characteristics to be assessed and compared between Year 2 and Year 6. These analyses sought to establish the extent of any changes in the influence of individual background factors, particularly the Early years home learning environment (HLE), while young children move through primary school
5 Note that throughout the report the term “impact” is meant in it‟s statistical sense, referring to statistically significant predictors and their effect sizes in predicting attainment. It does not imply causality.
iii
(see Section 2). A more detailed exploration of the influence of the HLE investigates interactions between Early years HLE and pre-school effects (Section 4).6
Educational Influences
The study also investigated the combined net effects of pre-school experience and the academic effectiveness of the primary school, exploring whether „home‟ children or pupils who attended less effective pre-schools benefited to a greater extent than other children if they subsequently went on to attend a more academically effective primary school. A further question addressed whether high quality or high effective pre-school experience provides a protective effect if children subsequently attended a primary school low on academic effectiveness (see Section 3). Additional value added analyses investigated pupils‟ academic progress from the end of Year 2 to the end of Year 6 of primary school. The assessments at the end of Year 2 provided the baseline measures against which to explore relative gains in English and Mathematics over time (see Section 4). The importance of educational experiences in shaping outcomes at age 11 years has been highlighted by the Year 6 analyses (Sections 3 and 4). Pre-school influences remain evident even after six years of full-time primary school. Although the research shows that attending a pre-school compared with not attending a pre-school predicts significantly better outcomes in the longer term, both the quality and the effectiveness of the pre-school setting are also found to be predictive of later cognitive outcomes. In general low quality pre-school does not seem to improve children‟s later attainment at the end of Year 6 in primary school, whereas medium and especially high quality and effective pre-school experience is associated with longer term benefits for the development of academic ability, particularly in Mathematics. The combined influences of pre-school and primary school effects are also examined. For „home‟ children (the no pre-school group), there is strong evidence that the academic effectiveness of the primary school attended helps to reduce the attainment gap compared with children who attended pre-school. „Home‟ children who went to a less academically effective primary school show the lowest attainment at age 11 when controlling for other background influences. For those „home‟ children who attended a highly academically effective primary school, there is a particular boost to Mathematics attainment in comparison with those who attended a low effectiveness primary school. In addition, where children attended a high quality or more effective pre-school in their early years, this seems to act as a protective factor if they subsequently attended a less academically effective primary school. Key findings
The key findings are reported in terms of the three main sets of influences studied: child/family/home learning environment (HLE) and neighbourhood effects, evidence of continuing pre-school effects, and the contribution of the primary school attended. 6 Earlier results for this sample in Year 5 identified the size and nature of the equity gap in achievement and how it changes at different points in children‟s pre-school and school careers. This informed the Government‟s Equalities Review (EPPE 3-11 Team., 2007), a broad ranging enquiry into the nature and influences that shape social inequality in Britain, and highlighted the importance of children‟s educational and early years experiences.
iv
Child, Family and home learning environment (HLE) background effects
The overall influence of background factors is generally weaker in Year 6 compared to Year 2 for attainment in both English and Mathematics. This is likely to reflect increased primary school and peer group influences.
Gender has become more important: girls outperform boys in English and boys outperform girls in Mathematics.
Parents‟ (especially mothers‟) highest qualification levels, although weaker in Year 6, is a key predictor of attainment, as is low birth weight, need for support with English as an additional language (EAL), early developmental problems (as reported by parents at the start of the study), socio-economic status (SES) and father‟s qualification level.
The Early years home learning environment (HLE) remains one of the most important background factors relating to a child‟s attainment in English and Mathematics.
Key Stage 1 HLE shows some predictive power: high levels of one-to-one child-parent interaction have a negative impact on attainment in both English and Mathematics, while high levels of home computing has a negative impact on English. In both cases the child‟s activities may effectively be being replaced, e.g. being read to rather than reading; playing computer games rather than reading.
Neighbourhood: there was no evidence of the neighbourhood exerting an independent influence on attainment or progress, but a moderate association was found between poor attainment in Mathematics and parental perceptions of an „unsafe‟ neighbourhood, which is likely to be an expression of social disadvantage.
Pre-school effects
In general attending a pre-school compared with not attending (the „home‟ children) has a positive effect on children‟s outcomes in English and Mathematics at the end of Year 6.
Attainment in both English and Mathematics in Year 6 was enhanced by pre-school quality. In both cases the higher the level of quality, the greater the level of attainment. Similarly, pre-school effectiveness (defined in terms of promoting young children‟s outcomes in Early number concepts) again showed a positive influence on later attainment, and was particularly influential for outcomes in Mathematics.
Those children who attended low quality pre-schools no longer show a significant cognitive benefit in attainment after six years in primary school, i.e. their scores are not significantly different from those of the „home‟ children. The same is true for those who attended medium quality pre-schools, but only in the case of English. This is a change from previous findings, reported at age 5 years, which showed that all pre-school experience had positive effects, regardless of the quality.
v
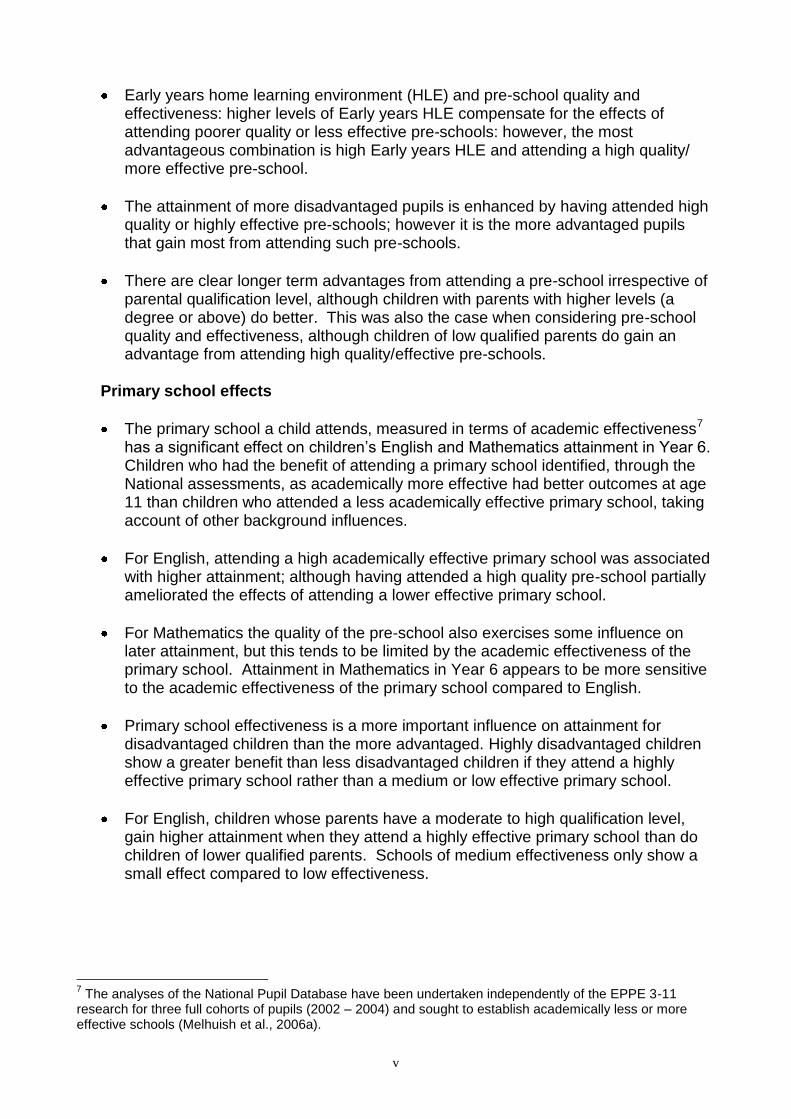
Early years home learning environment (HLE) and pre-school quality and effectiveness: higher levels of Early years HLE compensate for the effects of attending poorer quality or less effective pre-schools: however, the most advantageous combination is high Early years HLE and attending a high quality/ more effective pre-school.
The attainment of more disadvantaged pupils is enhanced by having attended high quality or highly effective pre-schools; however it is the more advantaged pupils that gain most from attending such pre-schools.
There are clear longer term advantages from attending a pre-school irrespective of parental qualification level, although children with parents with higher levels (a degree or above) do better. This was also the case when considering pre-school quality and effectiveness, although children of low qualified parents do gain an advantage from attending high quality/effective pre-schools.
Primary school effects
The primary school a child attends, measured in terms of academic effectiveness7 has a significant effect on children‟s English and Mathematics attainment in Year 6. Children who had the benefit of attending a primary school identified, through the National assessments, as academically more effective had better outcomes at age 11 than children who attended a less academically effective primary school, taking account of other background influences.
For English, attending a high academically effective primary school was associated with higher attainment; although having attended a high quality pre-school partially ameliorated the effects of attending a lower effective primary school.
For Mathematics the quality of the pre-school also exercises some influence on later attainment, but this tends to be limited by the academic effectiveness of the primary school. Attainment in Mathematics in Year 6 appears to be more sensitive to the academic effectiveness of the primary school compared to English.
Primary school effectiveness is a more important influence on attainment for disadvantaged children than the more advantaged. Highly disadvantaged children show a greater benefit than less disadvantaged children if they attend a highly effective primary school rather than a medium or low effective primary school.
For English, children whose parents have a moderate to high qualification level, gain higher attainment when they attend a highly effective primary school than do children of lower qualified parents. Schools of medium effectiveness only show a small effect compared to low effectiveness.
7 The analyses of the National Pupil Database have been undertaken independently of the EPPE 3-11
research for three full cohorts of pupils (2002 – 2004) and sought to establish academically less or more effective schools (Melhuish et al., 2006a).
vi
For Mathematics the primary school effectiveness is especially important for children whose parents have a low qualification level. Of these children, compared to those who attended low effective primary schools, children who attended highly or medium academically effective primary schools have significantly higher average Mathematics scores at Year 6.
The combined impact of pre-school quality and primary school effectiveness indicates that for English the quality of the pre-school can compensate for attending a less effective primary school. For Mathematics, the better the quality of pre-school, the higher the attainment, and the more academically effective the primary school, the higher the attainment.
The combined impact of pre-school effectiveness and primary school effectiveness indicates that for both English and Mathematics attending a highly effective pre-school can compensate for later attending a low effective primary school: although attending a highly academically effective pre-school and primary school was clearly most advantageous.
Progress from Year 2 to Year 6
The analysis of children‟s progress in English and Mathematics over KS2 also points to the influence of children‟s background characteristics, although these factors have a weaker effect on value added progress than on attainment at any given time point. Continued pre-school influences related to quality and effectiveness are evident on pupil‟s progress in KS2 suggesting that pre-school influence not only operates by providing an initial boost to attainment levels, but also helps promote progress (possibly by fostering children‟s capacity to learn and their motivation).
Children who attended more academically effective primary schools also made more progress across KS2. This again confirms the importance of the overall effectiveness of each primary school on children‟s educational progress as well as on attainment levels. The school effects are stronger for progress in Mathematics (in line with findings in other educational effectiveness studies, see Teddlie & Reynolds 2000).
The results indicate that the combined influence of attending a better (higher quality
and high academically effective) pre-school and a more academically effective primary school can give a significant boost to children‟s later cognitive outcomes at age 11 years, especially for Mathematics. These effects are similar in size to the impact of having a mother with a high qualification level (degree rather than none).
Implications
The research presented here demonstrates the extent to which individual child, family and home learning environment (HLE) background factors continue to be significant predictors of children‟s academic attainment and progress in Key Stage 2, and the way such influences change over time. This is relevant to the monitoring of equity in education, and to policies that seek to raise standards, reduce the equity gap and promote inclusion.
vii
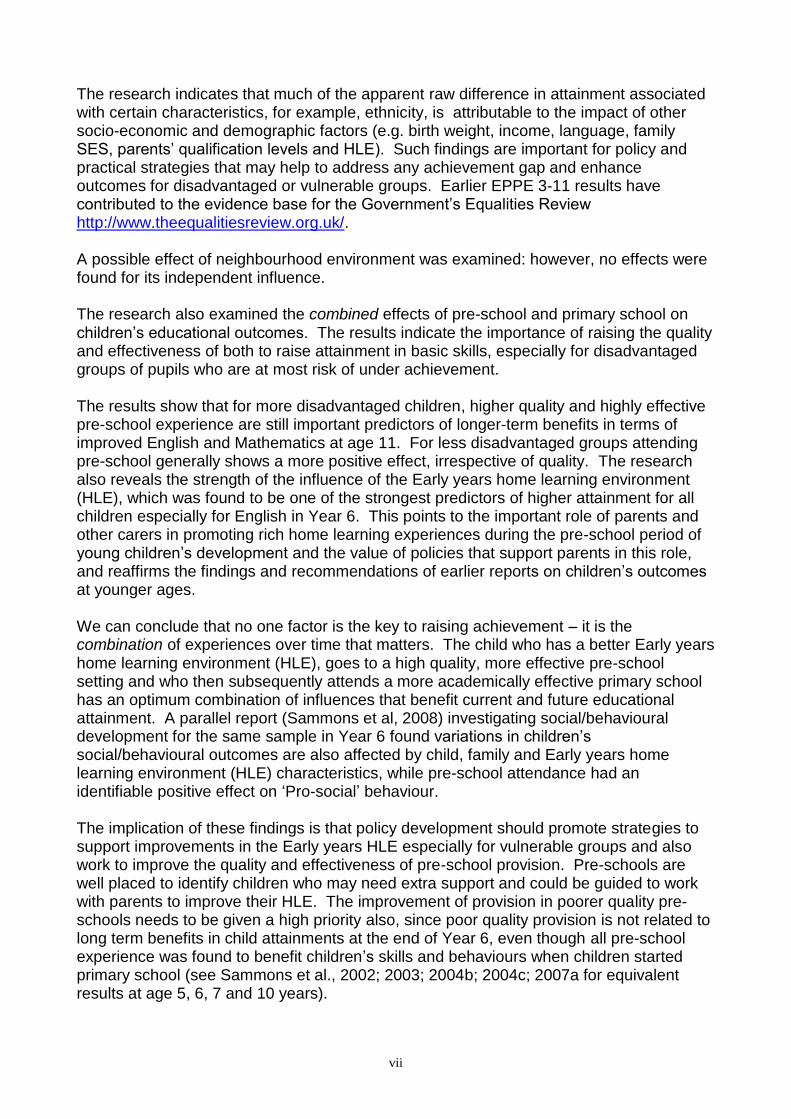
The research indicates that much of the apparent raw difference in attainment associated with certain characteristics, for example, ethnicity, is attributable to the impact of other socio-economic and demographic factors (e.g. birth weight, income, language, family SES, parents‟ qualification levels and HLE). Such findings are important for policy and practical strategies that may help to address any achievement gap and enhance outcomes for disadvantaged or vulnerable groups. Earlier EPPE 3-11 results have contributed to the evidence base for the Government‟s Equalities Review http://www.theequalitiesreview.org.uk/. A possible effect of neighbourhood environment was examined: however, no effects were found for its independent influence. The research also examined the combined effects of pre-school and primary school on children‟s educational outcomes. The results indicate the importance of raising the quality and effectiveness of both to raise attainment in basic skills, especially for disadvantaged groups of pupils who are at most risk of under achievement. The results show that for more disadvantaged children, higher quality and highly effective pre-school experience are still important predictors of longer-term benefits in terms of improved English and Mathematics at age 11. For less disadvantaged groups attending pre-school generally shows a more positive effect, irrespective of quality. The research also reveals the strength of the influence of the Early years home learning environment (HLE), which was found to be one of the strongest predictors of higher attainment for all children especially for English in Year 6. This points to the important role of parents and other carers in promoting rich home learning experiences during the pre-school period of young children‟s development and the value of policies that support parents in this role, and reaffirms the findings and recommendations of earlier reports on children‟s outcomes at younger ages.
We can conclude that no one factor is the key to raising achievement – it is the combination of experiences over time that matters. The child who has a better Early years home learning environment (HLE), goes to a high quality, more effective pre-school setting and who then subsequently attends a more academically effective primary school has an optimum combination of influences that benefit current and future educational attainment. A parallel report (Sammons et al, 2008) investigating social/behavioural development for the same sample in Year 6 found variations in children‟s social/behavioural outcomes are also affected by child, family and Early years home learning environment (HLE) characteristics, while pre-school attendance had an identifiable positive effect on „Pro-social‟ behaviour. The implication of these findings is that policy development should promote strategies to support improvements in the Early years HLE especially for vulnerable groups and also work to improve the quality and effectiveness of pre-school provision. Pre-schools are well placed to identify children who may need extra support and could be guided to work with parents to improve their HLE. The improvement of provision in poorer quality pre-schools needs to be given a high priority also, since poor quality provision is not related to long term benefits in child attainments at the end of Year 6, even though all pre-school experience was found to benefit children‟s skills and behaviours when children started primary school (see Sammons et al., 2002; 2003; 2004b; 2004c; 2007a for equivalent results at age 5, 6, 7 and 10 years).
In addition, improving the academic effectiveness of primary schools is important particularly for disadvantaged groups, since attending a more academically effective primary school matters more to these children‟s outcomes at age 11. The finding that social/behavioural development as well as English and Mathematics can be boosted by academically effective primary schools has important implications for the achievement of the Every Child Matters agenda. This shows that the promotion by schools of better academic outcomes does not compete with better social/behavioural development (a point discussed further in the Report to the Equalities Review, EPPE 3-11 Team. 2007). The finding that primary school academic effectiveness is a more significant influence for disadvantaged pupils (especially those who did not go to pre-school) is highly relevant for social inclusion and raising standards. The analyses of children‟s National assessment results in Year 6 were broadly parallel to those reported for attainment and progress measured by independent standardised NFER tests conducted in Year 5 (a year with less focus on preparation for the high stakes „SATs‟ period). The stability in findings across Years 5 and 6 using different assessments provides further confidence in their robustness. In particular, the findings point to the continued influence of pre-school experiences, the importance of the Early years HLE, and the importance of the academic effectiveness of the primary school a child attends. Taken together these findings lead to the conclusion that reducing the achievement gap for the most disadvantaged groups (compared to other children) will require concerted and complementary actions to (1) strengthen the Early years home learning environment (HLE), (2) ensure high quality pre-school and (3) ensure effective primary schooling: all three will be needed, since improvements to any one in isolation is not enough to optimise outcomes (Hurry and Sylva., 2007; Sylva et al., 2008).
1
Introduction EPPE 3-11 is a large-scale longitudinal study funded by the Department for Children, Schools and Families (DCSF), originally designed to investigate what kinds of early childhood provision are most „effective‟ in promoting young children‟s development during pre-school. Subsequent aims were to explore whether any pre-school effects continue to influence children during primary school and to examine primary school influences. Initially the project tracked children from pre-school, or the start of primary school, to the end of Key Stage 1 of primary school (age 7 plus years). Measures of the quality of 141 pre-school centres were recorded from five regions across England. The centres were representative of six types of provision: nursery classes, playgroups, local authority day nurseries, private day nurseries, nursery schools and integrated centres [i.e. combined centres that integrate education and care] (see Sammons et al., 2002; 2003). Results of analyses of children‟s outcomes in Key Stage 1 are reported by Sammons et al. (2004b; 2004c), and during Key Stage 2 (Year 5) by Sammons et al., (2007a; 2007b).8 An extension to the original EPPE pre-school study has tracked the same children‟s development to the end of Key Stage 2 (age 11). This second phase was designed to explore continuing pre-school influences as well as to investigate the effects of primary school. EPPE 3-11 was the first study of pre-schools in Europe to adopt an educational effectiveness design based on sampling children in a range of different pre-school settings (centres) and used statistical approaches (multilevel modelling) that enable the identification of individual pre-school centre and school effects. Around the age of 3 years (at entry to a target pre-school in the randomly selected sample or at their third birthday for children who had already entered provision at a younger age), children were assessed and their parents interviewed. They were then followed up at entry to primary school. In this way it has been possible to explore variations between centres in the value they added to children‟s cognitive progress and social/behavioural development. The first phase of the research explored whether different types of pre-school settings differed in their impacts and effectiveness. It also identified variations between different pre-school centres in children‟s cognitive progress and social/behavioural development. The current report focuses on children‟s developmental progress to the end of Key Stage 2 using National assessment measures of cognitive attainment in English and Mathematics taken at two time points Year 2 (age 7+) and Year 6 (age 11+). It explores the impact of a wide variety of child, parent and family factors, including aspects of the Early years home learning environment (HLE). This information was provided by parents during the years of pre-school and aspects of the later HLE during Key Stage 1 of primary school. The EPPE 3-11 study uses a mixed methods approach (combining qualitative and quantitative methods) and an educational effectiveness design, including detailed statistical analyses of effectiveness and in-depth case studies of individual pre-school centres (Sammons et al., 2005; Siraj-Blatchford et al., 2006). This report is based on statistical analyses for a sample of 2701 children for whom valid cognitive data was collected at the end of Year 6. This represents eighty nine per cent of the children in the EPPE 3-11 sample for whom valid baseline data was collected on cognitive attainment at entry to primary school at age 5 and an increase of 1.2 per cent of the EPPE 3-11 sample for whom valid data was collected on cognitive attainment at the end of Year 2. This report focuses on children‟s attainment at the end of Year 6 and also measures their progress from the end of Year 2 to the end of Year 6 in primary school. Further analyses of children‟s
8 Full details of the original EPPE study are provided in a series of Technical Papers (see Appendix 1).
2
social/behavioural development and attitudes to school in Year 6 will be reported in further Research Reports.
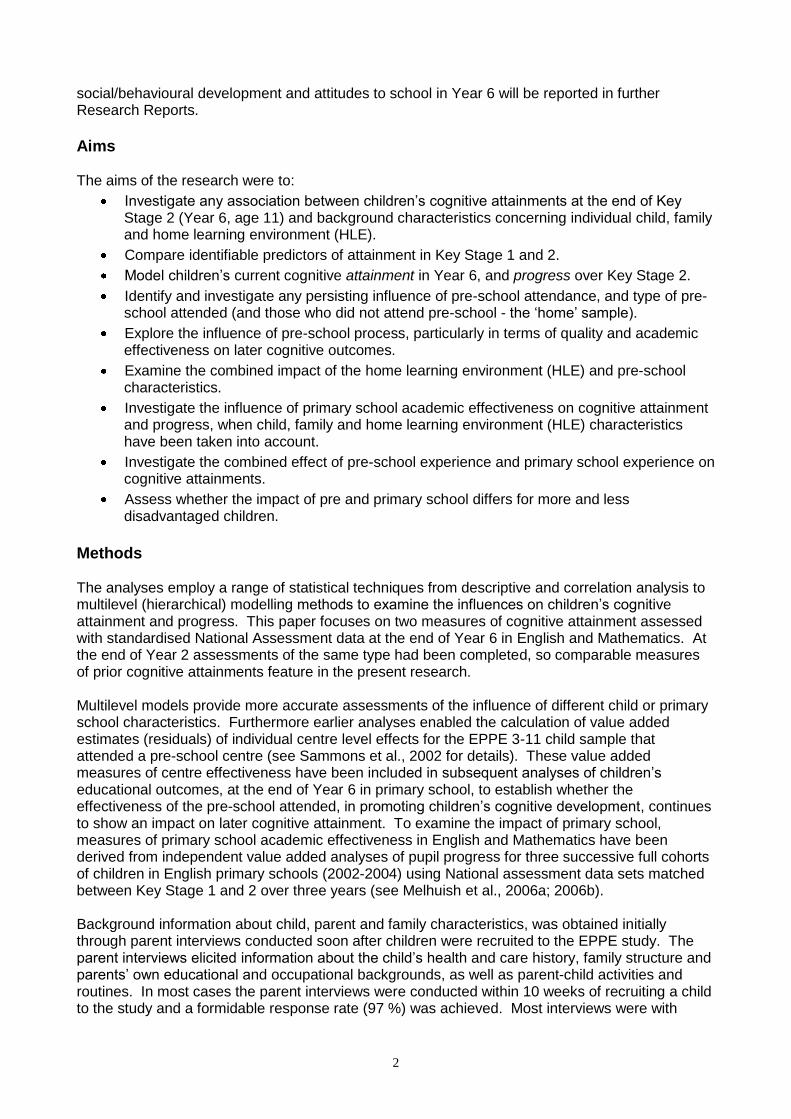
Aims The aims of the research were to:
Investigate any association between children‟s cognitive attainments at the end of Key Stage 2 (Year 6, age 11) and background characteristics concerning individual child, family and home learning environment (HLE).
Compare identifiable predictors of attainment in Key Stage 1 and 2.
Model children‟s current cognitive attainment in Year 6, and progress over Key Stage 2.
Identify and investigate any persisting influence of pre-school attendance, and type of pre-school attended (and those who did not attend pre-school - the „home‟ sample).
Explore the influence of pre-school process, particularly in terms of quality and academic effectiveness on later cognitive outcomes.
Examine the combined impact of the home learning environment (HLE) and pre-school characteristics.
Investigate the influence of primary school academic effectiveness on cognitive attainment and progress, when child, family and home learning environment (HLE) characteristics have been taken into account.
Investigate the combined effect of pre-school experience and primary school experience on cognitive attainments.
Assess whether the impact of pre and primary school differs for more and less disadvantaged children.
Methods The analyses employ a range of statistical techniques from descriptive and correlation analysis to multilevel (hierarchical) modelling methods to examine the influences on children‟s cognitive attainment and progress. This paper focuses on two measures of cognitive attainment assessed with standardised National Assessment data at the end of Year 6 in English and Mathematics. At the end of Year 2 assessments of the same type had been completed, so comparable measures of prior cognitive attainments feature in the present research. Multilevel models provide more accurate assessments of the influence of different child or primary school characteristics. Furthermore earlier analyses enabled the calculation of value added estimates (residuals) of individual centre level effects for the EPPE 3-11 child sample that attended a pre-school centre (see Sammons et al., 2002 for details). These value added measures of centre effectiveness have been included in subsequent analyses of children‟s educational outcomes, at the end of Year 6 in primary school, to establish whether the effectiveness of the pre-school attended, in promoting children‟s cognitive development, continues to show an impact on later cognitive attainment. To examine the impact of primary school, measures of primary school academic effectiveness in English and Mathematics have been derived from independent value added analyses of pupil progress for three successive full cohorts of children in English primary schools (2002-2004) using National assessment data sets matched between Key Stage 1 and 2 over three years (see Melhuish et al., 2006a; 2006b). Background information about child, parent and family characteristics, was obtained initially through parent interviews conducted soon after children were recruited to the EPPE study. The parent interviews elicited information about the child‟s health and care history, family structure and parents‟ own educational and occupational backgrounds, as well as parent-child activities and routines. In most cases the parent interviews were conducted within 10 weeks of recruiting a child to the study and a formidable response rate (97 %) was achieved. Most interviews were with
3
children‟s mothers, and usually took place at the child‟s pre-school centre, although for some working parents the interviews were conducted over the phone. Subsequently parents were asked to complete a questionnaire concerning further information about child, parent and family characteristics when the children were at primary school during Key Stage 1 (KS1). Details were sought regarding any change in background information (in employment, income, family structure, number of siblings etc.) as well as information on aspects of the home learning environment (HLE) in Key Stage 1 (KS1). Telephone surveys were used to follow up hard to reach groups using the same questionnaire schedule. The corrected response rate9 obtained was eight-one per cent (very high for a survey study).
Structure of Report and Analyses This report is divided into six sections. The first provides background information concerning the characteristics of the EPPE 3-11 sample and investigates whether particular groups of pupils show differences in their cognitive attainments at the end of primary school education. The attainment differences reported in Section 1 are „raw‟ univariate attainment differences, whereas the effects reported in later sections are „net‟ effects. The second section examines the extent to which different child, family and home learning environment (HLE) background characteristics account for variations in children‟s English and Mathematics attainments. The „net‟ influence of different background factors on children‟s attainments is explored using statistical techniques. Further analyses are used to identify the unique (net) contribution of particular characteristics to variation in children‟s cognitive outcomes, while other influences are controlled. Thus, for example, the influence of family Socio-Economic Status (SES) is established while taking into account the influence of mother‟s qualification level, income, ethnicity, birth weight, HLE etc. Results are reported in effect sizes (ES), a statistical measure of the relative strength of different predictors. It is of policy interest to establish the nature and strength of such background influences individually and collectively, as they are relevant to issues of equity and social inclusion. The third section describes the extent of change in the influence of the different background factors while young children progress through primary school. Children‟s cognitive outcomes in English and Mathematics had been assessed using similar National assessments taken toward the end of Year 2 (age 7). Contextualised multilevel models were used to estimate the „net‟ impact of different background factors on cognitive attainments in both Year 2 and Year 6. Effect sizes for the different factors were calculated and a comparison between the two years was made in terms of the relative strength of influence measured by changes in the ES over the four years. This section therefore addresses the question as to whether the cognitive attainment gaps found for different groups of children have remained the same or altered between Year 2 and Year 6. The fourth section examines the influence of pre-school and primary school experience on cognitive outcomes at the end of Year 6. In the first phase of the earlier EPPE research it was shown that pre-school experience gave children a better start to school, in terms of higher cognitive attainments and improved social/behavioural outcomes. Lack of pre-school experience, particularly for more vulnerable groups of young children, was found to be a further disadvantage (Sammons et al., 2002; 2003). The effect of pre-school attendance was, in these analyses, supplemented with measures of pre-school centre influence, namely the observed quality of pre-school provision (measured by the ECERS-E scale) and centre effectiveness (measured by value added residual estimates based on cognitive progress during the pre-school period). These additional features were further tested to explore any continuing effect of pre-school at the end of
9 Between the initial assessment at entry to pre-school and the Reception assessment 139 children were lost from the study (moved abroad or could not be traced). The response rate is based on the corrected sample at entry to primary school of 3032 children.
4
Year 6 in primary school. This section also addresses the question of differential pre-school effects for different groups of children. Further analyses sought to explore the predictive influence of measures of primary school academic effectiveness10 and children‟s later cognitive outcomes in Year 6. In addition, analyses also explored whether certain groups of children benefit more (are more sensitive to) the academic effectiveness of the primary school they attended than other children. The last part of Section 4 deals with the combined impact of different characteristics of pre-school experience (quality and effectiveness) and primary school academic effectiveness. Section 5 presents results of analyses that were conducted to explore children‟s academic progress from the end of Year 2 at primary school to the end of Year 6. Value added multilevel analyses of EPPE3-11 children‟s cognitive progress across Key Stage 1 and Key Stage 2 have been conducted, these analyses control for prior attainment (at the end of Year 2) in analysing progress over time. They are used to complement the contextualised models of attainment to establish how far background factors and educational measures of pre- and primary schools also predict progress across Key Stage 2. The final section summarises the results drawing together the main findings and conclusions.
10
These were value added academic effectiveness measures for primary schools that were calculated independently using National assessment data for all primary schools in England linking KS1 and KS2 results) (Melhuish et al., 2006a; 2006b).
5
Section 1: Characteristics of the sample at the end of Year 6
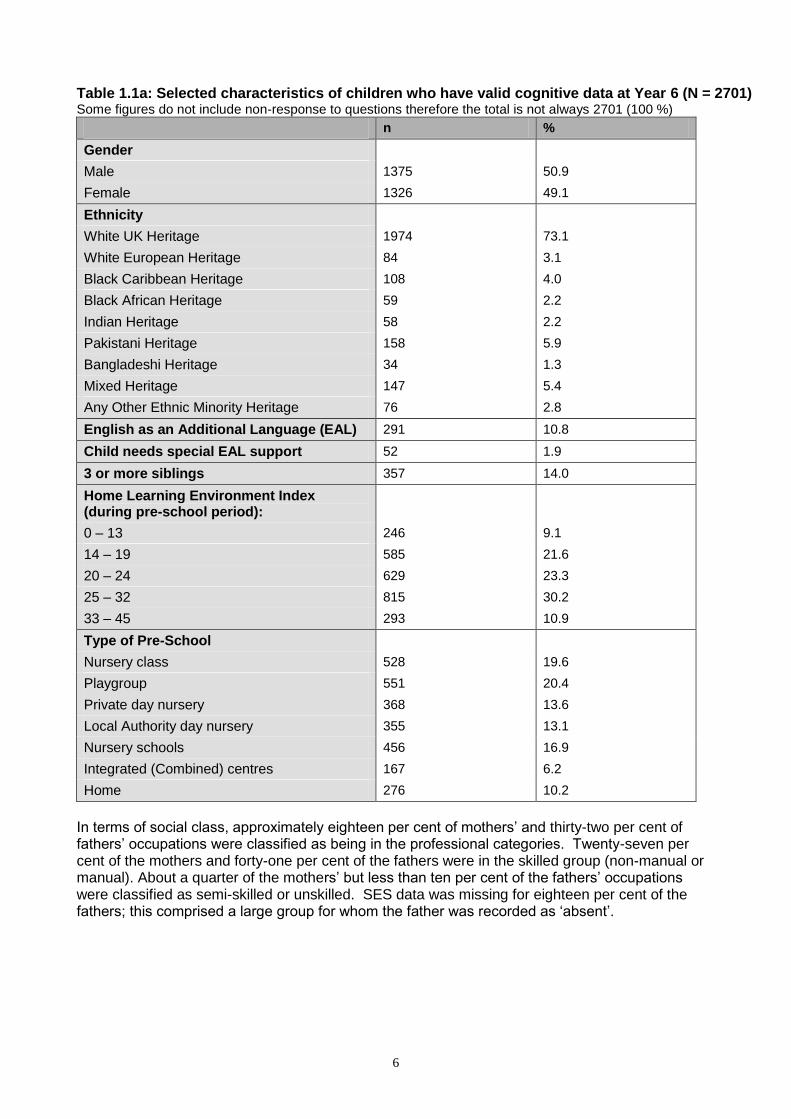
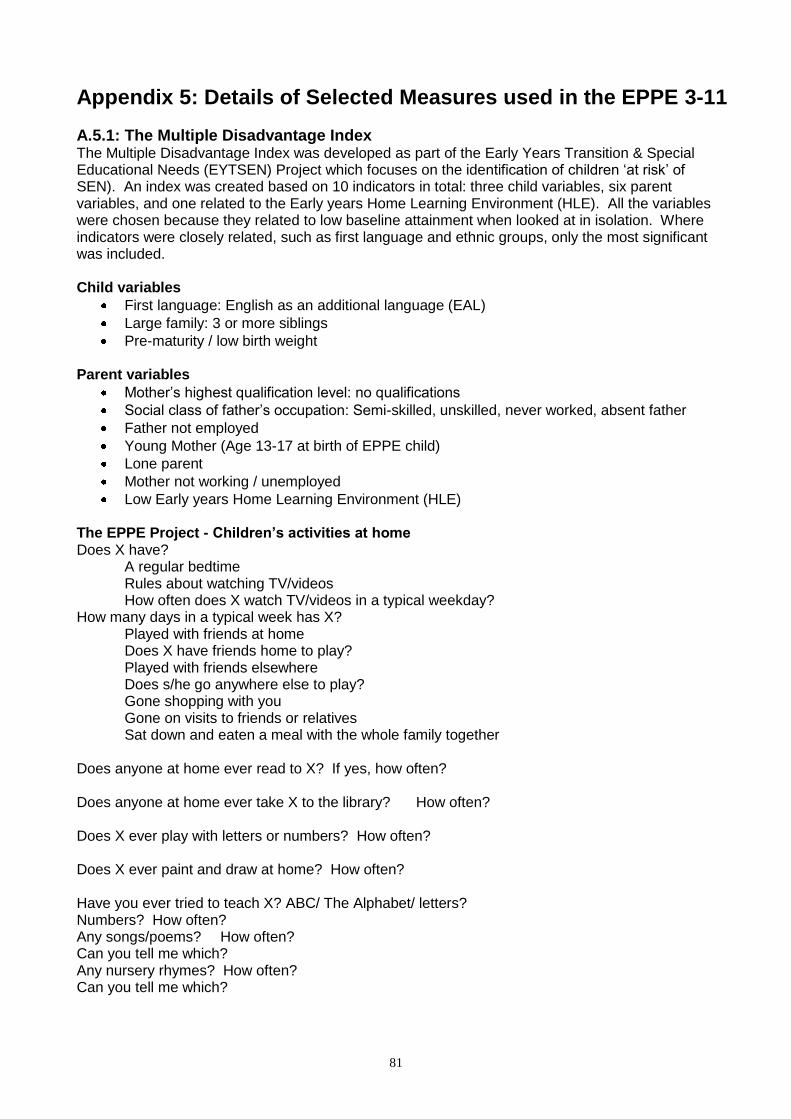
The research design used to recruit the sample for the original EPPE study is described in detail in EPPE Technical Paper 1 (Sylva et al., 1999). In summary, six English Local Authorities (LAs) in five regions participated in the research with children drawn from six main types of pre-school provision: nursery classes, playgroups, private day nurseries, Local Authority (LA) day nurseries, nursery schools and integrated (i.e. combined centres that integrate education and care) centres. In order to enable comparison of centre and type of provision effects the project was designed to recruit 500 children, 20 in each of 20-25 centres, from the various types of provision. In some LAs certain forms of provision were less common and other forms more typical. Within each LA, centres of each type were selected by stratified random sampling and, due to the small size of some centres in the project (i.e. rural playgroups) more of these centres were sampled than originally proposed, bringing the centre sample total to 141 centres. In all 2,857 children in the pre-school sample were tracked to entry to reception. An additional sample of 315 „home‟ children (those who had not attended a pre-school setting) was recruited at entry to primary school, for comparison with those who had attended a pre-school setting, bringing the total sample to 3,172. Since the start of the study 11 years ago, the EPPE children have been assessed in their cognitive and social/behavioural development at various time points. This report refers to two time points at which children completed cognitive assessments: at the end of Year 2 (age 7) and at the end of Year 6 (age 11). The assessments at these two time points are judged to be most comparable, because cognitive attainment was assessed with the same type of tests; National assessments that adhere to the content of the national curriculum covered in English primary schools test in Reading and Mathematics (see Appendix 2). This section provides descriptive statistics for the sample at the end of Year 6. Details of the main findings of the analyses conducted on children‟s attainments and progress up to the end of Key Stage 1 (Year 2) can be found in Technical paper 11 (Sammons et al., 2004b) and results for Year 5 in Sammons et al. (2007a; 2007b). Tables 1.1a to 1.1c provide a brief summary of the characteristics of the EPPE 3-11 sample at the end of Year 6 for whom any cognitive outcome data (National assessment data in English and / or Mathematics) were collected (N = 2,690, and N = 2701 respectively). Fifty-one per cent of the children are boys and forty-nine per cent are girls. In terms of ethnicity children of White UK heritage made up seventy three per cent of the sample. Eleven per cent of the children had English as an additional language (EAL) although, the proportion of children who still needed support because of having EAL was smaller at the end of Year 6 (1.9 %). With respect to family structure, fourteen per cent of the children lived in large families (defined as those with 3 or more siblings). Table 1.1a also shows the distribution of the Early years home learning environment (HLE) index which is a combined measure of aspects of the quality of the home learning environment in the early years (see Appendix 5 and Melhuish et al., 2008). A number of measures collected at the entry to study from the parent interview provided an indication of aspects of the HLE in the early years. These are based on the frequency of engagement in specific activities involving the child such as, teaching the alphabet, reading to the child, listening to the child read, taking the child to the library etc. (as reported by the parents at interview). Table 1.1a shows that forty-one per cent of the children in the sample belong to the two highest HLE categories indicating that the Early years HLE was good or very good for these children while nine per cent had very low HLE scores. In all 276 children (10.2% of the total current sample) had not attended any type of pre-school (the „home‟ group) before entering primary school.
6
Table 1.1a: Selected characteristics of children who have valid cognitive data at Year 6 (N = 2701) Some figures do not include non-response to questions therefore the total is not always 2701 (100 %)
n %
Gender
Male 1375 50.9
Female 1326 49.1
Ethnicity
White UK Heritage 1974 73.1
White European Heritage 84 3.1
Black Caribbean Heritage 108 4.0
Black African Heritage 59 2.2
Indian Heritage 58 2.2
Pakistani Heritage 158 5.9
Bangladeshi Heritage 34 1.3
Mixed Heritage 147 5.4
Any Other Ethnic Minority Heritage 76 2.8
English as an Additional Language (EAL) 291 10.8
Child needs special EAL support 52 1.9
3 or more siblings 357 14.0
Home Learning Environment Index (during pre-school period):
0 – 13 246 9.1
14 – 19 585 21.6
20 – 24 629 23.3
25 – 32 815 30.2
33 – 45 293 10.9
Type of Pre-School
Nursery class 528 19.6
Playgroup 551 20.4
Private day nursery 368 13.6
Local Authority day nursery 355 13.1
Nursery schools 456 16.9
Integrated (Combined) centres 167 6.2
Home 276 10.2
In terms of social class, approximately eighteen per cent of mothers‟ and thirty-two per cent of fathers‟ occupations were classified as being in the professional categories. Twenty-seven per cent of the mothers and forty-one per cent of the fathers were in the skilled group (non-manual or manual). About a quarter of the mothers‟ but less than ten per cent of the fathers‟ occupations were classified as semi-skilled or unskilled. SES data was missing for eighteen per cent of the fathers; this comprised a large group for whom the father was recorded as „absent‟.
7
Table 1.1b: Selected characteristics of children who have valid cognitive data at Year 6 (n =2701) Some figures do not include non-response to questions therefore the total is not always 2,701 (100 %)
n %
Social-economic status (SES) of Mother (during Key Stage 1 or earlier):
Professional Non Manual 99 4.1
Other Professional Non manual 325 13.5
Skilled Non Manual 393 16.3
Skilled Manual 268 11.1
Semi-Skilled 473 19.6
Unskilled 82 3.4
Unemployed / Not working 770 32
Social-economic status (SES) of Father (during Key Stage 1 or earlier):
Professional Non Manual 222 11.1
Other Professional Non manual 425 21.2
Skilled Non Manual 271 13.5
Skilled Manual 733 27.1
Semi-Skilled 119 5.9
Unskilled 42 2.1
Unemployed / Not working 189 9.4
Professional Non Manual 444 -
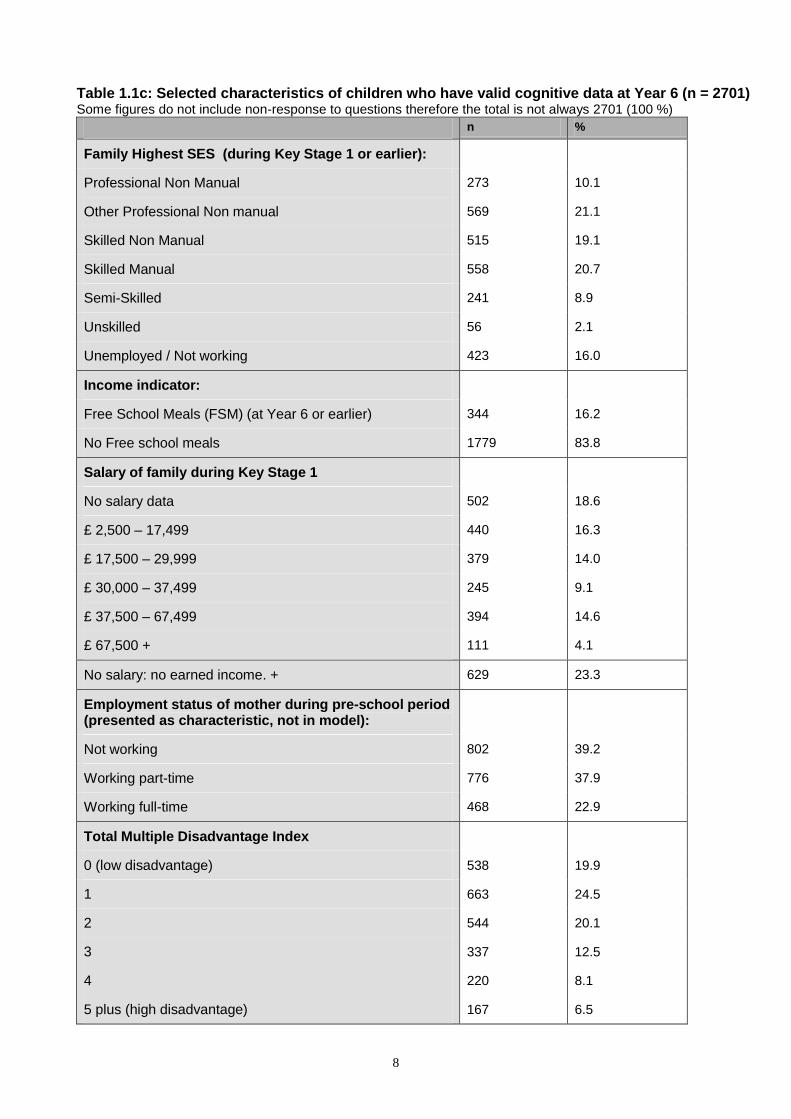
Table 1.1c shows the details on the combined family SES measure with over thirty per cent of families being in the highest (professional) two categories and sixteen per cent being unemployed/not working. Sixteen per cent of the children were eligible for free school meals (FSM) at Year 6 (or at an earlier time point, if no information was available for Year 6), while thirty-five per cent of the children were growing up in families whose annual salary was recorded as less than £17, 500 or had no earned income in KS1 when the data was gathered. An index of multiple disadvantage11 was created in the original EPPE research. (Sammons et al., 2002) Table 1.1c indicates that twenty per cent were identified as showing low levels of disadvantage, and seven per cent of the children were recorded as highly disadvantaged – that is, with a score on 5 or more factors associated with poorer educational outcomes, and another eight per cent scored on 4 factors. In general, only a small proportion of pupils had missing data (< 5 %) even for the measures of social background, which is a result of the procedures for tracking children and good relations with parents and primary schools leading to high response rates, as well as regular data quality checks of the EPPE 3-11 data management team. Somewhat higher proportions of missing values occur for income-related variables like salary, at twenty-three per cent, and the eligibility for free school meals (FSM), at twenty-one per cent, which is also an additional low income indicator. A higher proportion of missing values for these kinds of measures is a typical response pattern also found in other survey studies.12
11
The index combines poor child, family and home learning characteristics associated individually with lower attainment such as low birth weight, low family SES etc. For further details on the factors in the index see Appendix 5.
12 To prevent loss of sample size for further analyses missing values for number of siblings, FSM and SES where imputed using „the last observation carried forward‟ method. Please see Appendix 3 for a description of this imputation method. Family SES was calculated by combining mother‟s and father‟s occupational categories and recording the higher of the two (family SES data was missing for 2.1 % of the sample after imputation of missing values).
8
Table 1.1c: Selected characteristics of children who have valid cognitive data at Year 6 (n = 2701) Some figures do not include non-response to questions therefore the total is not always 2701 (100 %)
n %
Family Highest SES (during Key Stage 1 or earlier):
Professional Non Manual 273 10.1
Other Professional Non manual 569 21.1
Skilled Non Manual 515 19.1
Skilled Manual 558 20.7
Semi-Skilled 241 8.9
Unskilled 56 2.1
Unemployed / Not working 423 16.0
Income indicator:
Free School Meals (FSM) (at Year 6 or earlier) 344 16.2
No Free school meals 1779 83.8
Salary of family during Key Stage 1
No salary data 502 18.6
£ 2,500 – 17,499 440 16.3
£ 17,500 – 29,999 379 14.0
£ 30,000 – 37,499 245 9.1
£ 37,500 – 67,499 394 14.6
£ 67,500 + 111 4.1
No salary: no earned income. + 629 23.3
Employment status of mother during pre-school period (presented as characteristic, not in model):
Not working 802 39.2
Working part-time 776 37.9
Working full-time 468 22.9
Total Multiple Disadvantage Index
0 (low disadvantage) 538 19.9
1 663 24.5
2 544 20.1
3 337 12.5
4 220 8.1
5 plus (high disadvantage) 167 6.5
9
Cognitive assessments To take account of development and age, the study uses different assessment instruments for cognitive outcomes at different time points:
Year 2: National Assessment Key Stage 1: English and Mathematics
Year 6: National Assessment Key Stage 2: English and Mathematics National assessment data were collected for the sample at the end of Year 2 and Year 6. Test levels were collected at both time points. However, National assessment test levels only amount to ordinal categories: they place pupils‟ into a few ranked attainment groups: Year 2: 6 groups from working towards level 1, level 1, through 2c, 2b, 2a to level 3; Year 6: 6 groups from working towards level 1, level 1 through to level 6. Consequently in addition to test levels, data were also collected on children‟s individual test scores within levels. This allowed the creation of more finely differentiated outcome measures (which are referred to here as decimalised levels) for the multilevel analysis. For children who scored highly enough to attain a valid level for the National assessment test taken, their decimalised score was calculated as follows:
Decimalised score = level of test achieved + {(raw score - lowest valid raw score for corresponding level) / highest valid raw score possible for the level}
Furthermore, to ensure comparability over time, an internal age standardisation and normalisation procedure was applied to the decimalised data. This procedure takes account of age effects within one school year: hence age of pupil does not feature as a significant predictor of attainment / progress although included in the models. The scores presented in this paper are internally standardised to a mean of 100 and a standard deviation of 15. Therefore all children scoring better than 100 at a certain time point are scoring at or above the attainment level expected for their chronological age (belong to the upper half of the sample of that assessment, controlling for age effects). Due to the use of internally standardised attainment scores, the scores can only be used to investigate the progress or improvement of certain groups of children relative to the total EPPE 3-11 sample, but cannot be used to show absolute progress over time. In Appendix 2 further details on the decimalisation, standardisation and normalisation procedure, as well as on the interpretation, of such scores are provided.
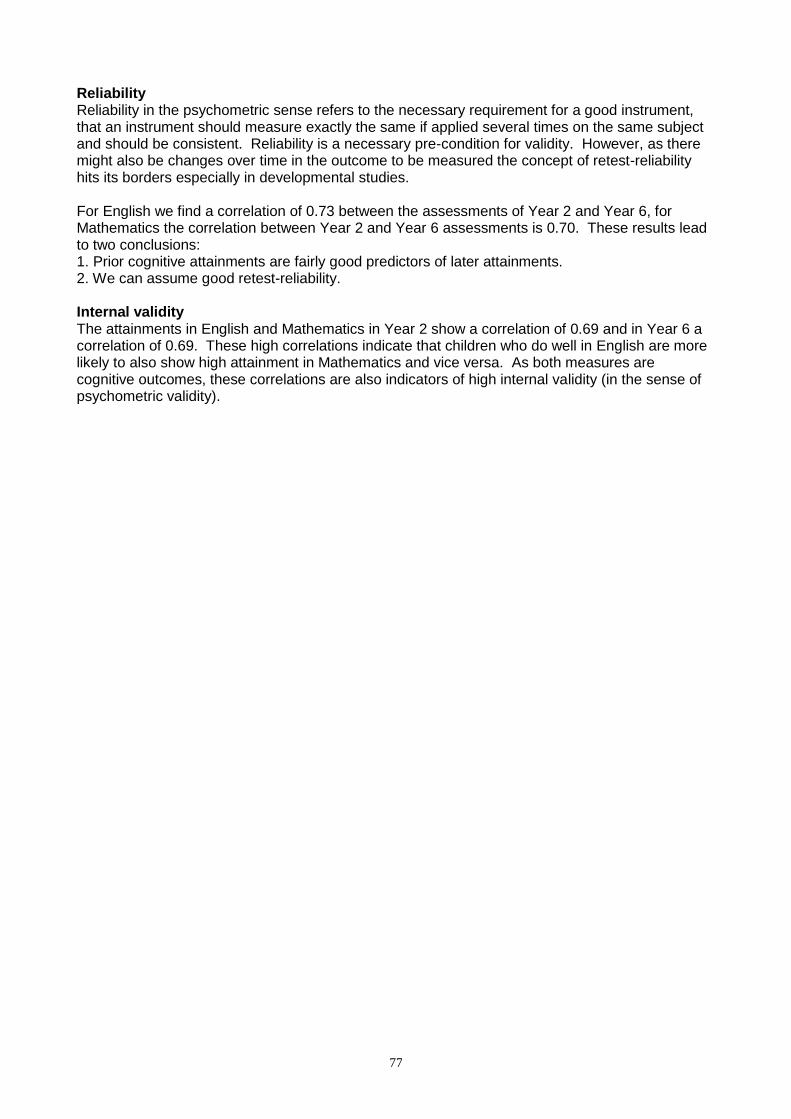
Associations between children’s attainments in different outcomes and over time Correlations can be used to explore associations between children‟s attainments in different outcomes and over time.13 Children‟s attainments in the Year 6 assessments were strongly positively correlated (r=0.69), indicating those who do well in English generally also do well in Mathematics at the end of Year 6, while those who score poorly on one also tend to do poorly in the other. The correlation between English and Mathematics scores at the end of Year 2 was the same (r=0.69, not shown in Table 1.2). The cognitive attainments are not only highly associated with each other but also show moderate to high correlations with prior attainments (see Table 1.2). A particularly strong relationship is found for attainment in English in Year 2 and Year 6 (r=0.73), while attainment in Mathematics is also strongly correlated between Years 2 and 6 (r=0.70).
13
A correlation is a measure of statistical association that ranges from + 1 to -1.
10
Table 1.2: Correlations between children’s standardised cognitive outcomes and with prior assessments
Year 6 Year 6
Assessment English Mathematics
Year 6 Mathematics 0.693 (n = 2664) ###
Year 2
English 0.729 (n = 2420) 0.646 (n =2425)
Mathematics 0.570 (n = 2425) 0.696 (n = 2379)
At this stage the high correlations between cognitive assessments at different time points, indicate that the assessments are measuring similar aspects of attainment suggesting that the measures are likely to be reliable indicators of abilities over time. The impact of earlier attainments as predictors for later attainments will be explored in more detail in Section 5. Of particular interest will be the „net‟ influence of child, background and home learning environment (HLE) characteristics at Year 6, when controlling for prior attainments of the children, as this will indicate whether some groups make more or less progress relative to others during KS2.
Differences in attainment for different groups of children Significant differences in cognitive attainments related to various child, family and home learning environment (HLE) characteristics have been reported at entry to pre-school (age 3 plus), later at entry to primary school (rising 5 years), at the end of Year 1 (age 6), at the end of Year 2 (age 7) and at the end of Year 5 (age 10). These characteristics were also predictors (but were less strongly associated) of different aspects of the social/behavioural development of the children. In this section differences in cognitive attainments at the end of Year 6 for different groups of children (i.e. gender groups, ethnicity groups, etc.) are explored. The findings at the end of Year 6 are broadly in line with the earlier reported findings (see Sammons et al., 2004b; 2004c; 2007). It is important to stress that these „raw‟ reported differences, in average results for different pupil groups, do not control for the influence of any other variables. This means, for example, if we are looking at the size of differences between individual ethnic groups, these differences could also be due, at least in part, to SES and language differences between the ethnic groups. Section 2 of this report provides more detailed statistical analyses of these patterns using multilevel models to explore the „net‟ contribution of different factors and reports the relevant effect sizes, controlling for other factors. It will also address the issue of change of „net‟ contribution of different factors over time in terms of effect sizes14. Gender At younger ages girls had been found to score more highly in cognitive attainments. At the end of Key Stage 2 (Year 6), this pattern of results was found for English scores, but no longer for Mathematics scores, where boys have a higher average score.
Table 1.3: Gender differences on Children’s score on the EPPE Year 6 cognitive outcomes
All Boys Girls
n Mean SD n Mean SD n Mean SD
English 2690 100.00 15.00 1360 97.76 14.55 1330 102.29 15.02
Effect sizes (ES) are a statistical measure of the relative strength of different predictors.
11
Ethnicity and language At the end of Year 6 we find that children of Pakistani heritage have particularly low attainment in English and Mathematics, a mean of 93.3 (see Figures 1.1 and 1.2), which is consistent with previous years‟ (e.g. Year 2 a mean of 90.6). Children of Bangladeshi heritage, however, have noticeably improved scores - recording a mean of 92.2 by the end of Year 2, but a mean of 98.3 by the end of Year 6. The Mathematics mean score for children of Indian heritage (104.2) is clearly above that of other groups. All these differences need to be interpreted with caution due to the small numbers of some ethnic minorities; this is particularly so for the Bangladeshi group with only 35 members. The rest of this section will provide further insight in to differences in cognitive attainments for certain minority groups over the years.
Figure 1.1: Cognitive attainment at Year 6 by ethnic groups: English
Raw Attainment by Ethnic Group: English
97.4100.7 99.6 97.9
102.0
93.3
98.3100.7 100.6
0
20
40
60
80
100
120
140
White
European
Black
Carribean
Black African Any Other Indian Pakistani Bangladeshi Mixed Race White UK
Mea
n (
Sta
nd
aris
ed S
core
)
N=84 N=107 N=59 N=77 N=57 N=158 N=35 N=146 N=1964
Figure 1.2: Cognitive attainment at Year 6 by ethnic groups: Mathematics
Raw Attainment by Ethnic Group: Mathematics
99.2 98.8 97.5 98.4
104.5
94.2 95.898.7
100.7
0
20
40
60
80
100
120
140
White
European
Black Carribean Black African Any Other Indian Pakistani Bangladeshi Mixed Race White UK
Mea
n (
Sta
nd
aris
ed S
core
)
N=108 N=84 N=59 N=76 N=58 N=158 N=34 N=147 N=1974
As might be expected, children‟s attainment in English differs strongly by mother tongue, with children with English as an Additional Language (EAL) still attaining lower scores on average (M= 96.0) than non EAL children (M = 100.5). However, at the end of Year 6 the need for EAL support distinguishes most clearly between lower and higher attainers. When looking at the whole sample, children who need such support in Year 6 have an average English score of only 88.8, whereas children without need of such support have an average of 97.0. Children also show a very similar pattern of attainments in Mathematics related to the mother tongue, and the attainment gap is
12
almost as strong as for English (Means: EAL=96.6, non-EAL=100.4, EAL support needed ES=89.6, No EAL support needed ES=100.5). It should be noted, that the group “No EAL support needed” includes children for whom English is the first language and EAL children who do not require support. The differences in average attainments are illustrated in Figures 1.3 and 1.4.15
Figure 1.3: Cognitive attainment at Year 6 by Mother Tongue: English
Raw Attainment by Mother Tongue: English
100.596.0
88.8
100.5
0
20
40
60
80
100
120
140
1
Mea
n (
Sta
nd
ard
ised
Sc
ore
)
English EAL EAL needed EAL not needed
N = 2393 N = 294 N = 53 N = 2170
Figure 1.4: Cognitive attainment at Year 6 by Mother Tongue: Mathematics
Raw Attainment by Mother Tongue: Mathematics
100.496.6
89.6
100.5
0
20
40
60
80
100
120
140
1
Mean
(S
tan
dard
ised
Sco
re)
English EAL EAL needed EAL not needed
N = 2407 N = 291 N = 52 N = 2175
Parents’ qualification level Mother‟s highest qualification level was shown to be a powerful predictor of attainment at earlier time points in the EPPE 3-11 research (entry to pre-school, at entry to primary school, end of Year 1, end of Year 2 and end of Year 5). In Year 6 this measure was still found to be highly significant. Figures 1.5 and 1.6 show attainment in English and Mathematics by mother‟s highest qualification level; the small group of children whose mothers have a higher degree show an average English score of 112.2 and an average Mathematics score of 113.0. Children of mothers with a degree
15
Appendix 4 provides tables with means, standard deviations and group sizes for the group differences illustrated by charts in the main body.
13
are also far above average (Means: English=111.4, Mathematics=111.2). The lowest attainment is seen for children whose mothers have no qualifications (Means: English=92.6, Mathematics=93.3). If you analyze the differences in attainment by father‟s highest qualification level you find the same pattern of results, although the association is slightly less powerful.
Figure 1.5: Cognitive attainment at Year 6 by mother’s qualification level: English
Raw Attainment by Mother's Qualifications: English
92.6
100.2 99.5104.0
111.4 112.2
106.7
0
20
40
60
80
100
120
140
Mother's Qualification
Me
an
(S
tan
da
rdis
ed
Sc
ore
)
None Vocational 16 academic 18 academic Degree or equivalent Higher degree Other Professional
N = 562 N = 388 N = 998 N = 211 N = 283 N = 87 N = 39
Figure 1.6: Cognitive attainment at Year 6 by mother’s qualification level: Mathematics
Raw Attainment by Mother's Qualifications: Mathematics
93.3
98.8 99.5103.9
111.2 113.0
106.6
0
20
40
60
80
100
120
140
Mother's Qualification
Mea
n (
Sta
nd
ard
ised
Sc
ore
)
None Vocational 16 academic 18 academic Degree or equivalent Higher degree Other Professional
N = 566 N = 390 N = 1002 N = 211 N = 284 N = 88 N = 39
Socio-economic status (SES) and eligibility for free school meals (FSM) Large attainment differences occur in English and Mathematics related to the socio-economic status (SES) of the family as found in the study of cognitive attainment measures at previous time points (entry to pre-school, entry to primary school, end of Year 1, end of Year 2 and end of Year 5). Family SES is measured by the highest of mother‟s or father‟s current or most recent employment status and showed a significant association with children‟s attainment levels at the
14
end of Year 6. Children whose parents are in high SES (professional non-manual) employment have the highest average scores of any SES group, while children whose parents are unemployed or unskilled have the lowest average score (Figures 1.7 and 1.8). Although SES differences are marked they are smaller than those related to parents‟ qualification levels. Figure 1.7: Cognitive attainment at Year 6 by Family SES: English
Raw Attainment by SES: English
94.4 94.4 96.0 95.5
101.1105.7
109.3
0
20
40
60
80
100
120
140
Family SES
Mean
(S
tan
dard
ised
Sco
re)
Unemployed Unskilled Semi skilled Skilled manual Skilled non-manual Other professional Professional non-manual
N = 275 N = 567 N = 514 N = 556 N = 238 N = 54 N = 429
Figure 1.8: Cognitive attainment at Year 6 by Family SES: Mathematics
Raw Attainment by SES: Mathematics
94.8 93.395.6 96.6
100.2104.9
110.8
0
20
40
60
80
100
120
140
1
Mea
n (
Sta
nd
ard
ised
Sc
ore
)
Unemployed Unskilled Semi skilled Skilled manual Skilled non-manual Other professional Professional non-manual
N = 273 N = 569 N = 515 N = 558 N = 241 N = 56 N = 432
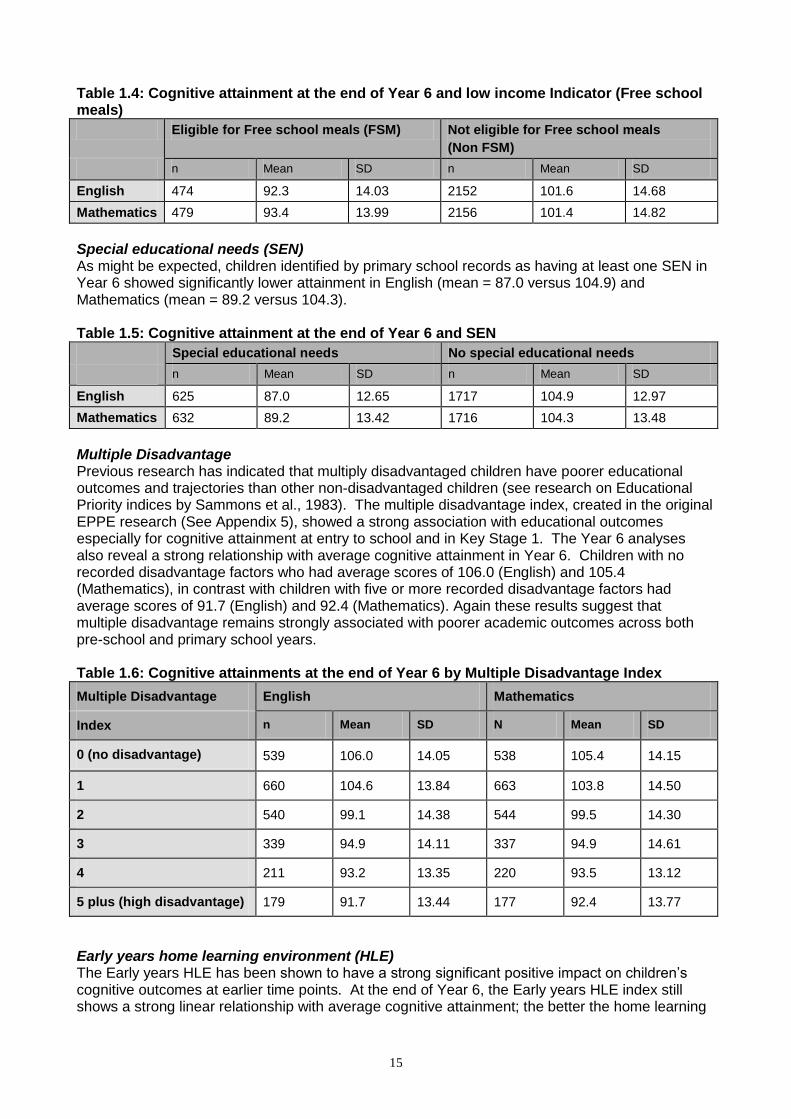
A child‟s eligibility for free school meals (FSM) provides an indicator of low family income (although it is recognised that not all children take up their entitlement). Table 1.4 shows that children who are reported to be eligible to receive free school meals (FSM) have lower average attainment on cognitive assessments compared to less disadvantaged families. The attainment gap is slightly larger for English than for Mathematics. This pattern of results is in line with that found at younger ages, indicating that social disadvantage continues to show a statistically significant association with attainment. Section 3 of this report will give further insight into the changing influence of different child, family and HLE characteristics over the years.
15
Table 1.4: Cognitive attainment at the end of Year 6 and low income Indicator (Free school meals)
Eligible for Free school meals (FSM) Not eligible for Free school meals
(Non FSM)
n Mean SD n Mean SD
English 474 92.3 14.03 2152 101.6 14.68
Mathematics 479 93.4 13.99 2156 101.4 14.82
Special educational needs (SEN) As might be expected, children identified by primary school records as having at least one SEN in Year 6 showed significantly lower attainment in English (mean = 87.0 versus 104.9) and Mathematics (mean = 89.2 versus 104.3). Table 1.5: Cognitive attainment at the end of Year 6 and SEN
Special educational needs No special educational needs
n Mean SD n Mean SD
English 625 87.0 12.65 1717 104.9 12.97
Mathematics 632 89.2 13.42 1716 104.3 13.48
Multiple Disadvantage Previous research has indicated that multiply disadvantaged children have poorer educational outcomes and trajectories than other non-disadvantaged children (see research on Educational Priority indices by Sammons et al., 1983). The multiple disadvantage index, created in the original EPPE research (See Appendix 5), showed a strong association with educational outcomes especially for cognitive attainment at entry to school and in Key Stage 1. The Year 6 analyses also reveal a strong relationship with average cognitive attainment in Year 6. Children with no recorded disadvantage factors who had average scores of 106.0 (English) and 105.4 (Mathematics), in contrast with children with five or more recorded disadvantage factors had average scores of 91.7 (English) and 92.4 (Mathematics). Again these results suggest that multiple disadvantage remains strongly associated with poorer academic outcomes across both pre-school and primary school years. Table 1.6: Cognitive attainments at the end of Year 6 by Multiple Disadvantage Index
Multiple Disadvantage English Mathematics
Index n Mean SD N Mean SD
0 (no disadvantage) 539 106.0 14.05 538 105.4 14.15
1 660 104.6 13.84 663 103.8 14.50
2 540 99.1 14.38 544 99.5 14.30
3 339 94.9 14.11 337 94.9 14.61
4 211 93.2 13.35 220 93.5 13.12
5 plus (high disadvantage) 179 91.7 13.44 177 92.4 13.77
Early years home learning environment (HLE) The Early years HLE has been shown to have a strong significant positive impact on children‟s cognitive outcomes at earlier time points. At the end of Year 6, the Early years HLE index still shows a strong linear relationship with average cognitive attainment; the better the home learning
16
environment during the early years, the better the child‟s attainment at Year 6 (see Figures 1.9 and 1.10). The difference is similar to that for family SES. Figure 1.9: Cognitive attainment at Year 6 by Early years HLE index: English
Raw Attainment by Early Years HLE: English
94.892.6
96.699.3
102.5
109.7
0
20
40
60
80
100
120
140
1
Mea
n (
Sta
nd
ard
ised
Sc
ore
)
Unknown 0-13 14-19 20-24 25-32 33-45
N = 132 N = 247 N = 576 N = 625 N = 813 N = 284
Figure 1.10: Cognitive attainment at Year 6 by Early years HLE index: Mathematics
Raw Attainment by Early Years HLE: Mathematics
95.8 95.097.3
99.6101.8
107.4
0
20
40
60
80
100
120
140
1
Mea
n (
Sta
nd
ard
ised
Sc
ore
)
Unknown 0-13 14-19 20-24 25-32 33-45
N = 133 N = 246 N = 585 N = 629 N = 815 N = 293
Pre-school In previous analyses (start of primary school, at the end of Year 1, Year 2) results showed beneficial effects of attending a pre-school on cognitive outcomes compared with not attending a pre-school. At the end of Year 6, children who attended pre-school still have higher average scores in the cognitive tests than children who did not go to pre-school (see Figure 1.11).
17
Due to the very different characteristics of the „home‟ group (disadvantaged children are over-represented in this group) and very different characteristics of children who went to different types of pre-school, these raw differences need to be interpreted with considerable caution. Further analyses are required to separate the „net‟ pre-school effects from those related to background factors. Section 4 investigates the impact of attendance, quality and effectiveness of pre-school in more detail, controlling for the influence of differences in children‟s background characteristics. Figure 1.11: Cognitive attainment at Year 6 by pre-school attendance: English and Mathematics
Raw Attainment by Pre-School Attendence: English and
Mathematics
100.9 100.8
92.5 92.7
0
20
40
60
80
100
120
140
English Mathematics
Mea
n (
Sta
nd
ard
ised
Sc
ore
)
Pre-School
No Pre-School
N = 2417 N = 2425N = 273 N = 276
Primary School Academic Effectiveness Value added academic effectiveness measures for primary schools were calculated using National assessment data for all primary schools in England linking Key Stage 1 and Key Stage 2 results; separate indicators were calculated for the different core curriculum subjects English, Mathematics and Science (Melhuish et al., 2006a; 2006b). These measures are thus independently derived and based on full national pupil cohorts. They provide indicators of the academic success of the school in promoting its pupils‟ progress in the three core curriculum subjects for three consecutive years (2002-2004). The relationship between value added effectiveness in English and the English outcomes of the EPPE 3–11 children, as well as the relationship between value added effectiveness in Mathematics and the Mathematics outcomes of the EPPE 3–11 children, was investigated. Table 1.7 illustrates that the overall academic success of the school is related to average cognitive outcomes for the EPPE 3-11 sample. Children who went to a low effective primary school had an average of 99.4 in English and 98.7 in Mathematics, whereas children who went to a highly effective primary school had an average of 103.4 in English and 103.3 in Mathematics in Year 6. Analyses presented in Section 4 estimates the degree of influence exercised by primary school effectiveness, when other influencing factors are controlled. It also addresses whether some groups of children‟s educational outcomes are more affected by their primary school‟s academic effectiveness than others?
18
Table 1.7: Cognitive attainments at the end of Year 6 by primary school effectiveness
Primary School Effectiveness
English Mathematics
n Mean SD N Mean SD
Low 376 99.4 14.08 418 98.7 14.68
Medium 1578 100.1 15.23 1544 100.4 14.98
High 241 103.4 14.62 243 103.3 14.92
It is not appropriate to explore any continuing influence of pre- or primary school on subsequent educational outcomes at the end of Year 6 unless proper statistical control is made of the influence of intake differences in terms of significant child, family and HLE characteristics. The next section therefore examines the net influence of different child, family and HLE characteristics in contextualised multilevel statistical models, which identify and separate the various influences simultaneously. The additional „net‟ influence of pre-school experience and primary school experience are then explored for the whole EPPE 3-11 sample and for relevant sub-groups.
19
Section 2: Children’s Cognitive Attainments at the End of Year 6 in Primary School: The Impact of Different Child, Family and Home Learning Environment (HLE) Characteristics This section presents the results of contextualised multilevel analyses establishing the pattern of relationships between various child, family and HLE characteristics and children‟s cognitive attainments at the end of Year 6. Background details concerning children‟s earlier childcare experiences, health, family and HLE during the pre-school period were obtained from parental interviews conducted when children entered the EPPE study and a parent questionnaire which was completed by the parents when children were in Key Stage 1 of primary school education. As potentially influencing background factors the following measures are available and have been used in the analyses:
Child factors (i.e. gender, birth weight, number of siblings, early developmental problems, early behavioural problems, mother tongue, ethnicity),
Family factors (i.e. socio-economic status [SES], parent‟s qualification levels, family income16),
Home learning environment (HLE) in the early years (parents reported how often they read to the child, teach the child the alphabet, play with letters & numbers, teach songs & nursery rhymes, paint & draw etc.) before starting primary school,
Parental activities during Key Stage 1 such as the frequency of reading to the child, taking the child out to educational visits, computing activities, play, etc. (see Appendix 5 for details of these measures).
Figure 2.1: Strategy of statistical analysis of background influences
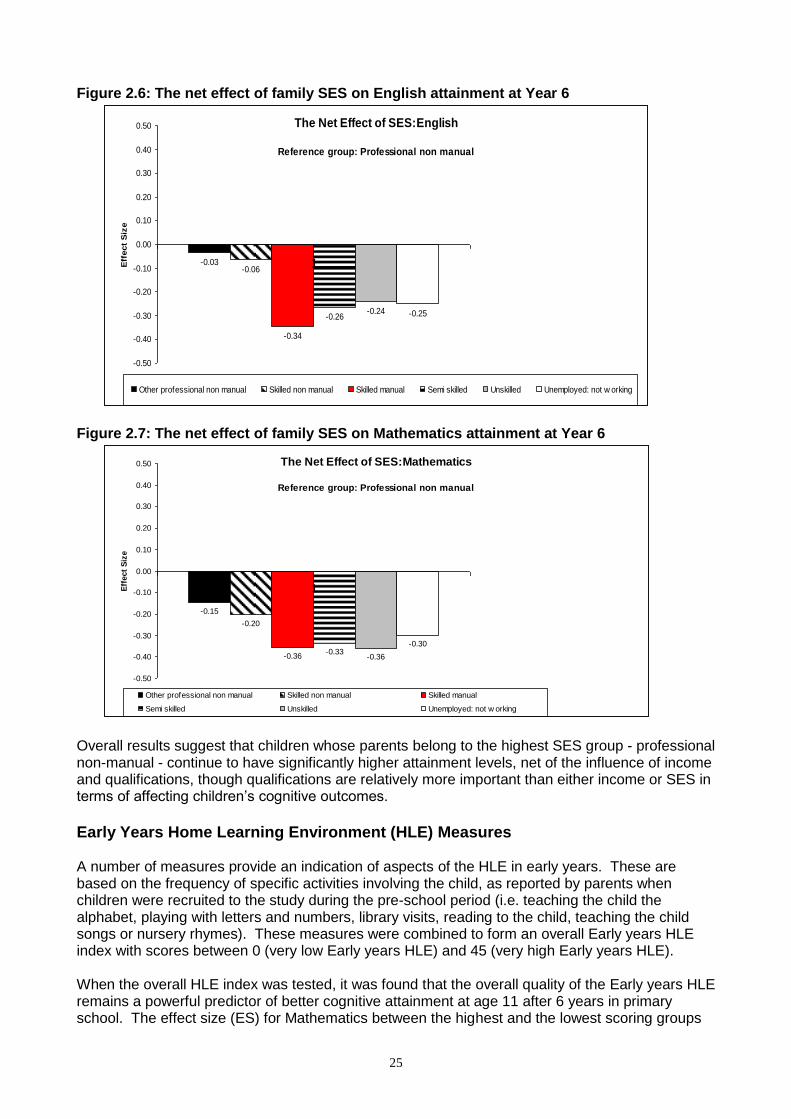
16
Marital status over time (from parents‟ initial recruitment when the child was aged about 3 years old to First Parent Questionnaire when the child was approximately 6 years old) was also included in initial analysis but did not prove significant.
Child
Factors
Family
Factors
Home
Learning
Environment
READING
MATHEMATICS
ENGLISH
20
Figure 2.1 illustrates the strategy of statistical analysis. The analyses investigated whether the associations between cognitive attainments and child, family and HLE characteristics remain statistically significant when children reach the end of Year 6 of primary school education17. The analysis of the influence of child, family and HLE characteristics on cognitive outcomes is an important step as only on this basis, is it possible to separately identify and quantify the „net‟ influence of pre-school and primary school education, which will be explored in Section 4. The extent of differences in standardised assessment results attributable to a child‟s background is also of considerable policy interest, given the equity implications for later progress at school. The „net‟ effects of particular child, family and HLE characteristics reported in this section were derived by contextualised multilevel analyses and therefore take into account any clustering related to the primary school attended.
A range of explanatory variables related to child, family and HLE characteristics were added in contextualised analyses. The results are reported in Tables A.6.1.a and A.6.2.a, Appendix 6. A large number of potentially influential factors of early childhood and family background have been tested in the models for cognitive outcomes, including gender, SES, mother‟s qualification level, and Early years HLE and Key Stage 1 HLE. The results show the proportion of total variance in Year 6 academic attainment that is accounted for by such predictors. Overall background factors account for around twenty four per cent of the total variance in English attainment, for Mathematics the proportion is slightly lower at around twenty per cent. These findings are in accord with other studies of school effectiveness that tend to show background factors are somewhat more important predictors for English than for Mathematics particularly during in the primary years (Scheerens & Bosker, 1997). Tables A.6.1.a and A.6.2.a, show that the proportion of variance at the child level accounted for by child, family and HLE factors is somewhat higher for English than Mathematics, twenty and fifteen per cent respectively. Whilst this represents a significant proportion, it is apparent that the majority of the variation in individual children‟s attainment at the end of Year 6 (age 11) is not attributable to factors such as gender, ethnicity, mother language or SES etc. A larger proportion of the school level variance is accounted for by children‟s background characteristics; reflecting the importance of pupil intake factors in interpreting differences in overall attainment between schools and pointing to the limitations of using league tables of schools‟ raw results to assess school performance (see discussions by Sammons, 1996). EPPE 3-11 has previously reported on the impact of background factors at earlier time points in primary school education (see Sammons et al., 2004b; 2004c for details). At the end of Year 2, where National assessment data was used for cognitive attainment, a similar but slightly greater proportion of the child level variance was accounted for by the same background factors18. This is consistent with the claim that the relative importance of background characteristics reduces as children move through school (Sammons et al., 1993). Further analyses were also conducted concerning the influence of individual background factors in Year 2 compared to Year 6, and the results show that some background factors increased in their impact on cognitive attainment whereas others reduced. These results are reported in Section 3. The net influence of different child, family and HLE characteristics is summarised below. The „net‟ influence of different child, family HLE characteristics is illustrated in Figures 2.2 and 2.3. In addition to the factors, the effect sizes (ES) for the single factors are given19. An effect size is a statistical measure representing the strength of the single effect. An ES of 0.2 can be seen as representing a moderate influence while a relatively strong influence would be an ES of 0.5 plus. Appendix 6 gives full details of the multilevel estimates for each factor found to be statistically significant (Tables A.6.1.b and A.6.2.b). 17
It should be noted that all the analyses also accounted for associations between the predictors which could have been illustrated by additional arrows. For simplicity these arrows are not shown in figure 2.1. 18
With the exception of family salary and parental activities during Key Stage 1, as this information was not available at the point analyses were undertaken. 19
For factors where more than one category showed a significant effect (e.g. mother‟s qualification or Early years HLE) the effect size of the most representative category is shown in figures 2.2 and 2.3. Details on effect sizes for other categories can be found in figures on the next pages.
21
Figure 2.2: Factors with significant ‘net’ effect on attainment in English at the end of Year
Figure 2.3: Factors with significant ‘net’ effect on attainment in Mathematics at the end of Year 6
Factor
Mathematics: Factors with significant ‘net’ effect at the end of Year 6
Gender Birth weight Ethnic groups Need for EAL support Developmental problems Parents’ qualification Socio-Economic Status Free School Meals Early years HLE KS1 HLE
0.19 Boys show higher attainment than girls.
Effect Size Description
Higher Early years HLE =higher attainment. Moderate personal interaction better than high higher attainment
Normal birth weight higher than low/ very low.
Indian heritage higher than children of White UK heritage
Early developmental problems = predictor of low attainment.
Need for EAL support = predictor of low attainment.
0.48
0.45
0.64
0.15
Higher qualified parent = higher attainment.
Higher SES=higher attainment.
Eligible for FSM = negative predictor
0.71
0.36
0.15
0.42
0.17
Factor
English: Factors with significant ‘net’ effect at the end of Year 6
Gender Birth weight Ethnic groups Need for EAL support Developmental problems Parents’ qualification Socio-Economic Status Free School Meals Early years HLE KS1 HLE
0.29 Girls show higher attainment than boys.
Effect Size Description
Higher Early years HLE = higher attainment. Lower home computing better than high & Lower personal interaction better than high
Normal birth weight higher than very low.
Only White European heritage lower than children of White UK heritage
Early developmental problems = predictor of low attainment.
Need for EAL support = predictor of low attainment.
0.47
0.17
0.59
0.23
Higher qualified parent = higher attainment.
Higher SES=higher attainment.
Eligible for FSM = negative predictor
0.76
0.34
0.23
0.70
0.18
22
Child Measures Examining the association between child factors and attainment in English at Year 6, we find that gender, birth weight, ethnicity, the need for EAL support and early developmental problems are found to be statistically significant predictors, age is not a significant predictor because the outcomes have been normalised to take account of age differences (see Section 1). Their relative strength is shown by the ES in Figure 2.2. For Mathematics at the end of Year 6 the following child characteristics are found to have significant net effect: gender, birth weight, early development problems, ethnicity and need for EAL support. Their relative strength is shown by the ES in Figure 2.3. Gender Gender differences in favour of girls were identified for English (ES=0.29). This result is in line with results at earlier time points. At earlier time points, girls also showed significantly higher attainments in Mathematics than boys. However, boys now tend to show higher attainment than girls in Mathematics, with a lower effect size compared to that associated with girls for English, but still significant: (ES=0.19). Birth weight Children with very low birth weight had significantly lower attainments in English (ES=0.47) and Mathematics (ES=0.48) in Year 6 than children with normal birth weight20. This is in line with findings at earlier time points, with the effect stronger for Mathematics than for English. Family size At earlier ages, children from larger families (with 3 or more siblings) showed significantly lower attainment in English but not in Mathematics. In the present analysis this measure is no longer significant: no longer are children from larger families doing significantly worse in English. Early developmental problems Children whose parents reported early developmental problems at the beginning of the pre-school phase of the study showed lower attainment in English in Year 6 than children where no early developmental problems were reported (one developmental problem: ES=0.24, more than one developmental problems: ES=0.38). Early developmental problems also had a significant influence on attainments in Mathematics in Year 6, as opposed to early health problems which had previously proved significant. In terms of early development problems for Mathematics one developmental problem: ES=0.15, more than one developmental problems: ES=0.32). EAL and Ethnicity Children who still needed support because they have English as an additional language had decreased in number since Year 5, from 94 to 64 but the same trend is evident: they showed lower average attainment in English (ES=0.59) and Mathematics (ES=0.64) than those who did not need such support. It is particularly interesting that the „net‟ effect of EAL support is stronger for outcomes in Mathematics than in English. This may be because EAL support is more often targeted at English but not at Mathematics in primary schools. For ethnic groups21, the relationships (in comparison with children of White UK heritage) indicated no difference amongst the groups, although as has been noted in the previous section and will be
20
Babies born weighing 2500 grams or less are defined as below normal birth weight: foetal infant classification is below 1000 grams, very low birth weight is classified as 1001-1500 grams and low birth weight is classified as 1501-2500 grams (Scott & Carran, 1989). 21
Any category of a predictor variable can be used as a reference group. The overall calculations (e.g. model‟s variance, model fit, etc.) are not affected by the choice of reference group; the absolute differences (in terms of effect size) between the different categories of the predictor variable also remain the same. The statistical models show the relative differences between categories in relation to the outcome measure. We select the category as a reference group that would show the pattern of association between the predictor variable and the outcome measure in the clearest possible way, the only restriction that the reference
23
considered further in Section 5. The children of Bangladeshi heritage showed evidence of greater attainment than previously. In Mathematics Indian children showed particularly high attainment compared to White UK children (ES=0.45), this is consistent with previous findings. It should be stressed that these differences relating to ethnicity and need for EAL support are „net‟ of the influences of all other factors in the model, including SES and mother‟s qualification level in which there are also significant differences between ethnic groups.
Family Measures With regard to background characteristics we find the following family factors having a significant net effect on attainments in English and Mathematics: SES, parents‟ qualification levels, eligibility for free school meals (FSM), and family‟s salary. The relative strength of the different factors is indicated by the Effect Size (ES). Free School Meals The free school meals (FSM) measure of low income showed a negative relationship with attainment in Year 6. The differences were moderate (ES=0.23 for English, ES=0.15 for Mathematics).22 Income In terms of the salary, reported by the parents when their children were in Key Stage 1, the results indicate that children whose parents are on high joint earned incomes (more than £37,500 - £67,499 per annum) have better scores in English than children whose parents have no salary (ES=0.23). For Mathematics effect sizes in the range of 0.15 to 0.25 are found for different salary groups between £17,500 per annum and more than £67,000 per annum. These effects are in line with previous reported effects of the employment status of the father (Sammons et al., 2004c). Parent’s highest qualification levels Mother‟s education, as measured by highest level of qualification, continued to show a consistent pattern of strong and positive effects. The categories degree and higher degree showed the strongest positive influence (compared with the group that had no qualifications). In terms of effect sizes the association was even stronger than reported at earlier time points especially for English (for English, ES=0.76 for mother having a degree versus no qualification, ES=0.71 for Mathematics). See Figures 2.4 and 2.5 for details on effect sizes for other qualification levels compared to no qualification. Father‟s qualification also has a statistically significant effect on attainment, but mother‟s qualification level showed a stronger link to children‟s attainment (see Tables A.6.1 and A.6.2 in Appendix 6 for further details on effect sizes for different predictors).
category is of a reasonable size. When the relationship is linear we would typically choose the lowest or the highest performing group as a reference category (e.g. highest qualification or none). If the relationship is non-linear we would select the largest category (e.g. ethnicity: White UK as the reference group). Occasionally we would select the category that is of most interest (e.g. pre-school quality: low quality) regardless of the type of association. 22
Note that effects cannot be compared directly to effect sizes that have been reported for earlier time points, because for these analyses an improved imputed measure has been used (see Appendix 3 for details on the imputation method).
24
Figure 2.4: The net effect of mother’s qualification on English attainment at the end of Year 6
The Net Effect of Mother's Qualification:English
Reference group: None
0.24 0.23
0.40
0.76
0.660.61
0.00
0.10
0.20
0.30
0.40
0.50
0.60
0.70
0.80
0.90
1.00
1
Eff
ect
Siz
e
Vocational 16 Academic 18 academic Degree or equivalent Higher degree Other Professional
Figure 2.5: The net effect of mother’s qualification on Mathematics attainment at the end of Year 6
The Net Effect of Mother's Qualification:Mathematics
Reference group: None
0.15
0.23
0.39
0.71 0.71
0.55
0.00
0.10
0.20
0.30
0.40
0.50
0.60
0.70
0.80
0.90
1.00
1
Eff
ect
Siz
e
Vocational 16 Academic 18 academic Degree or equivalent Higher degree Other Professional
In terms of parents‟ highest social class of occupation (family SES), compared with „professional non-manual‟, all other categories were associated with lower attainment levels for both English and Mathematics. Statistically significant lower attainment was found for children whose parents belong to the groups „skilled non manual‟, „skilled manual‟ „semi-skilled‟ „unskilled‟ and „unemployed‟ in Mathematics. In English the category „skilled manual‟, „semi-skilled‟, „unskilled‟ and „unemployed‟ were associated with significantly lower attainment. Results in terms of effect sizes are illustrated in Figures 2.6 and 2.7. Effect sizes can be quantified in the range between -0.03 and -0.34 for English outcomes, and between -0.15 and -0.36 for attainment in Mathematics.
25
Figure 2.6: The net effect of family SES on English attainment at Year 6
The Net Effect of SES:English
Reference group: Professional non manual
-0.03-0.06
-0.34
-0.26-0.24 -0.25
-0.50
-0.40
-0.30
-0.20
-0.10
0.00
0.10
0.20
0.30
0.40
0.50
1Eff
ect
Siz
e
Other professional non manual Skilled non manual Skilled manual Semi skilled Unskilled Unemployed: not w orking
Figure 2.7: The net effect of family SES on Mathematics attainment at Year 6
The Net Effect of SES:Mathematics
Reference group: Professional non manual
-0.15
-0.20
-0.36-0.33
-0.36
-0.30
-0.50
-0.40
-0.30
-0.20
-0.10
0.00
0.10
0.20
0.30
0.40
0.50
1Eff
ect
Siz
e
Other professional non manual Skilled non manual Skilled manual
Semi skilled Unskilled Unemployed: not w orking
Overall results suggest that children whose parents belong to the highest SES group - professional non-manual - continue to have significantly higher attainment levels, net of the influence of income and qualifications, though qualifications are relatively more important than either income or SES in terms of affecting children‟s cognitive outcomes.
Early Years Home Learning Environment (HLE) Measures A number of measures provide an indication of aspects of the HLE in early years. These are based on the frequency of specific activities involving the child, as reported by parents when children were recruited to the study during the pre-school period (i.e. teaching the child the alphabet, playing with letters and numbers, library visits, reading to the child, teaching the child songs or nursery rhymes). These measures were combined to form an overall Early years HLE index with scores between 0 (very low Early years HLE) and 45 (very high Early years HLE). When the overall HLE index was tested, it was found that the overall quality of the Early years HLE remains a powerful predictor of better cognitive attainment at age 11 after 6 years in primary school. The effect size (ES) for Mathematics between the highest and the lowest scoring groups
26
on the Early years HLE index was ES=0.42 „net‟ of other child and family factors, while for English the ES=0.69 (see Figures 2.8 and 2.9). At earlier time points the impact of learning experiences at home on attainment in Mathematics were found to be slightly stronger, and still the results illustrate the continued importance of these experiences. A high Early years HLE rather than a low one has a similar positive effect on outcomes at Year 6 to having a mother with a degree versus one with no qualification. It should be noted that there are only modest correlations (r=0.33) between Early years HLE and qualification level. Figure 2.8: The net effect of Early years HLE on English attainment at Year 6
The Net Effect of Early Years HLE:English
Reference group: 0 - 13
0.150.20
0.34
0.69
0.00
0.10
0.20
0.30
0.40
0.50
0.60
0.70
0.80
0.90
1.00
1
HLE Index (Pre-School)
Eff
ect
Siz
e
14-19 20-24 25-32 33-43
Figure 2.9: The net effect of family SES on Mathematics attainment at Year 6
The Net Effect of Early Years HLE:Mathematics
Reference group: 0 - 13
0.05
0.11
0.18
0.42
0.00
0.10
0.20
0.30
0.40
0.50
0.60
0.70
0.80
0.90
1.00
1
HLE Index (Pre-School)
Eff
ect
Siz
e
14-19 20-24 25-32 33-43
27
Key Stage 1 Home Learning Environment (HLE) As the learning environment at home during the pre-school period was shown to have a strong impact on children‟s academic attainments during pre-school, parents were again surveyed during Key Stage 1 (KS1) about their interactions with their EPPE 3-11 child at home via a parent questionnaire. They reported on activities such as the frequency of reading to/ with the child, taking the child out on educational visits, computing activities, sport activities, dance, etc. It should be noted that the KS1 HLE measures were collected by questionnaire survey rather than interview and thus the data may be slightly less reliable than the measure of Early years HLE collected via face-to face-interviews. The single aggregate Early years HLE measure was arrived at after a series of iterations, see Melhuish et al., 2008a. The individual KS1 HLE measures have been aggregated to form four factors representing different parental activities during KS1: Home computing, One-to-one interaction, Expressive Play and Enrichment Outings (see Appendix 5). These factors were tested with respect to their influence on cognitive attainments at the end of Year 6 (age 11). The models continued to control for the impact of the Early years HLE as this remained the stronger predictor even when KS1 HLE measures were included. The relation between Early years HLE and Home computing at KS1 is quite weak: the correlation between the two measures failed to reach significance, rho=0.03. The relationship between Early years HLE and One-to one interaction was significant but still modest: rho=0.17. Home computing was not significantly associated with differences in children‟s attainment in Mathematics Taking previous findings into account the reference group here was very high levels of One-to-one interaction. In terms of English the results indicate that very high scores on the One-to-one interaction factor are associated with lower attainment in English at the end of Year 6, when compared to any other amount of interaction (ES=0.17 for low; 0.18 for moderate, and moderate to high). This effect might be explained by the fact that a lot of parental involvement during Key Stage 1 (when the data was gathered) is indicative of poor reading skills and therefore that the child received more parental support, even to the extent of replacing the child‟s efforts to read themselves. On the other hand, children who scored low on this factor were not read to a lot by their parents during Key Stage 1, probably due to the fact that they were already good readers and read on their own. Interestingly very high One-to-one interaction in Key Stage 1 (compared to low) was also associated with lower attainment in Mathematics (ES=0.08 for low; 0.14 for moderate, and 0.17 for moderate to high). High levels of home computing23 (compared to all other amounts) are associated with significantly low attainment in English (ES=0.17 for low; 0.17 for moderate, and 0.05 for moderate to high). Presumably this is because very high levels of home computing may replace or displace reading, for example, as an out of school activity, and may involve lesser learning opportunities if high levels involve non–educational games.
Neighbourhood ‘influence’ In addition to the items covering HLE, child and family background further measures of neighbourhood environment were introduced into the model in Year 6. These consisted of the Index of Multiple Deprivation, and two parental perception measures; estimates of their neighbourhood‟s safety and degree of social cohesion (social interaction with neighbours). The inclusion of these measures is designed to test whether, in addition to the family background variables, the „quality‟ of the neighbourhood, variously measured, exerts any independent influence on children‟s cognitive outcomes.
23
Playing on the computer or using the computer in educational ways.
28
The first of these, the Index of Multiple Deprivation (IMD), is a nationwide index combining weighted measures or levels of: crime; barriers to housing; living environment; education & skills training; health deprivation & disability; employment and income. The greater the IMD score, the greater the level of deprivation. The index is divided into Local Authority (LA) and Super Output Areas (SOA), where SAOs are defined as areas smaller than wards, frequently nested in wards, and of broadly consistent population size. For the purposes of analysis the 2004 IMD scores were assigned to each child on the basis of their pre-school home address (using postcode) being used to identify the appropriate SOA (for further details of the IMD see: The English Indices of Deprivation 2004: Summary (revised), 2007). The latter two measures (estimates of the safety of the neighbourhood and degree of social cohesion) were derived from questions answered by parents when their children were in Key Stage 1. The IMD score assigned to each child was the IMD score associated with each child‟s initial postcode on entry to the EPPE 3-11 study. The results indicated for both English and Mathematics a non-significant effect of IMD (p > 0.05), ES -0.09 for English and ES= -0.05 for Mathematics. Only in the case of Mathematics do any of the items prove significant: both low-medium (ES=0.15; Mathematics mean score=101.60) and medium-high (ES=0.15; mean=101.70) estimates of neighbourhood safety showed a significant positive association with attainment compared with low estimates of neighbourhood safety (mean=97.13) and high estimates of neighbourhood safety only just failed to reach significance (ES=0.14; mean=102.85). The issue of neighbourhood effects and whether this measure can be treated as an environmental measure are considered in the Discussion.
Summary of Background Influences The contextualised multilevel models tested the net impact of different child, parent and HLE measures while controlling for all other measures simultaneously and thus provide rigorous and conservative estimates of statistical significance for specific background characteristics. It does not imply that measures are not of educational or policy importance if they are not statistical predictors after control for other, related measures. For example SES is itself related to mother‟s educational qualification level and income and to other aspects such as birth weight. Likewise, measures of the HLE are inter-related and related to other measures such as gender of the child. The contextualised model shows which set of measures, taken together, provides the best set of predictors of children‟s attainment and which measures show a specific impact over other influences. It thus helps to tease out the strongest predictors (see the earlier Figures 2.2 and 2.3 for a summary of the effect sizes). This is important in identifying the nature of the equity gap in achievement for different pupil groups and thus can help to inform policy makers of the relative importance of different sources of influence. The contextualised analyses show the strength of background influences on young children‟s cognitive attainments at the end of Year 6 of primary school education (age 10). Nonetheless, the models reveal that, taken together, background characteristics are less strongly associated with individual variation in English and Mathematics attainment in Year 6 (in terms of percentage of variance accounted for) than they were with similar cognitive outcome measures at the end of Year 2. This does not imply that certain individual background factors might not have stronger influence than they used to have. Overall mother‟s qualification level, Early years HLE and need for EAL support show the strongest net effects. The general pattern is likely to reflect the impact of other influences such as attending school for a significant proportion of time, as well as variations between individual schools in their effectiveness, and also the growing influence of the child‟s peer group.
29
Section 3: Exploring the Impact of Background Factors on Children’s Cognitive Attainments in Year 6 Compared to Year 2 This section presents the main results of multilevel contextualised models that have been conducted to compare the net effects of child, family factors and Early years home learning characteristics on cognitive outcomes in Year 2 compared to Year 6. The change of net impact of different influencing factors reveals whether certain groups of children that showed lower attainment at the end of Year 2 have fallen further behind or begun to catch up by the end of Year 6. It also explores whether certain groups of children have further improved compared to the average in terms of their cognitive attainments during KS2. The same set of predictors was tested as potential influencing factors on outcomes in English and Mathematics at Year 2 and Year 6. Comparisons were made on the basis of the effect sizes of the individual predictors. In the following description of the results rather than using absolute effect sizes, differences in effect sizes between Year 2 and Year 6 (Δ ES) are presented to indicate the extent of change in the impact of different background factors on cognitive attainment. The Δ ES are presented without an algebraic sign, but the direction of change is explained in the text.
Child Measures The gender gap in English is the same in both years with girls showing higher attainment than boys, a difference which has increased by Year 6 (Δ ES=0.09). In Mathematics the difference is the reverse with boys out performing girls in Year 6 (Δ ES=0.04). Figure 3.1: Gender Effect Sizes Year 2 and Year 6: English
Gender Effect Sizes Year 2 and Year 6: Reading
0.2
0.29
0
0.05
0.1
0.15
0.2
0.25
0.3
0.35
0.4
Girls
Girls
Eff
ect
Siz
e
Year 2
Year 6
Comparison Group:
Boys
Figure 3.2: Gender Effect Sizes Year 2 and Year 6: Mathematics
Gender Effect Sizes Year 2 and Year 6: Mathematics
0.15
0.19
0
0.05
0.1
0.15
0.2
0.25
Boys
Eff
ect
Siz
e
Year 2
Year 6
Comparison Group:
Girls
In both years children with very low birth weight showed lower cognitive outcomes than children who had normal birth weight: for both English (Δ ES=0.22) and Mathematics Δ ES=0.12) the gap has increased by the end of Year 6. With regard to mother tongue the effect of „needing EAL support‟ has decreased for English (Δ ES=0.13). Children who need EAL support are still showing significantly lower attainment in English but the gap to those children who do not need EAL support has become smaller. In the case of Mathematics there‟s no change between the two time points, and children in need of EAL support are still doing significantly worse than those who do not need EAL support. For ethnicity, we find that Bangladeshi children have made the greatest advance compared to White UK children by Year 6 (Δ ES=0.25) in English. Other ethnic groups have, compared to White UK children, stayed at the same level in English. For Mathematics Indian children at Year 2 had higher scores than White UK children, and by Year 6 this difference had increased (i.e. they
30
had moved even further ahead): (Δ ES=0.24). Furthermore, Bangladeshi children made similar advances in Mathematics to Indian children (Δ ES=0.23). Given the relatively small sizes of some ethnic groups in the EPPE 3-11 sample the results should be interpreted with caution, this is particularly so with respect to Bangladeshi children, where only some of the EPPE 3-11 sample are responsible for the increase in attainment. Nonetheless they suggest that changes in the relative strength of differences between pupil sub-groups are worth further exploration.
Family Measures It was found that the highest qualification level of the mother was a strong predictor of children‟s cognitive outcomes at Year 6 and at earlier time points. Investigating the change of strength of effect size between Year 2 and Year 6, the findings illustrate that the influence of mother‟s qualification level has become even stronger especially for English. For both years the comparison group was „mothers with no qualification‟. Differences in effect sizes (Δ ES) between Year 2 and Year 6 for attainment in English lie in the range between Δ ES=0.01 (16 academic) and Δ ES=0.18 (degree). Only the groups of ‟18 academic‟ (Δ ES=0.05) and „Other professional‟ have lost some of their advantage compared to no qualification (Δ ES=0.05). For Mathematics the results are less ambiguous: all groups show an increase in attainment compared to „no qualification‟ with effect size differences (Δ ES) between 0.02 and 0.30, for ‟18 academic‟ and „higher degree‟ respectively. The influence of the qualification level of the father has also shown an increase for the most qualified: degree (Δ ES=0.06); higher degree (Δ ES= 0.14); and professional (Δ ES=0.23). Children whose family were categorised as belonging to the highest SES group (professional non manual), had a lead over children of lower SES families in cognitive outcomes at earlier time points, and this lead persists into Year 6, however, there is evidence that other SES groups have also made gains. In the case of English other professional show the greatest improvement (Δ ES=0.14), and only unskilled show a deterioration (Δ ES=0.19), see Figure 3.3. Figure 3.3: SES Effect Sizes Year 2 and Year 6 English
SES Effect Sizes Year 2 and Year 6: English
-0.17-0.14
-0.34-0.37
-0.05
-0.20
-0.03-0.06
-0.34
-0.26-0.24 -0.25
-0.60
-0.40
-0.20
0.00
0.20
0.40
0.60
0.80
Other Professional
non-manual
Skilled non-manual Skilled manual Semi-skilled manual Unskilled manual Never Worked
SES
Eff
ect
Siz
e
Year 2
Year 6
Comparison Group:
Professional Non-
manual
31
However, in Mathematics the only group to show gains over the period compared to the highest SES group is other professional show the greatest improvement (Δ ES=0.05), all the other groups show a widening of the gap that was already present by Year 2, see Figure 3.4. Figure 3.4: SES Effect Sizes Year 2 and Year 6 Mathematics
SES Effect Sizes Year 2 and Year 6: Mathematics
-1.00
-0.80
-0.60
-0.40
-0.20
0.00
0.20
0.40
0.60
0.80
Other Professional
non-manual
Skilled non-manual Skilled manual Semi-skilled manual Unskilled manual Never Worked
SES
Eff
ect
Siz
e
Year 2
Year 6
Comparison Group:
Professional Non-
manual
Looking at eligibility for free school meals (FSM), the findings illustrate that the impact has become stronger in Year 6 for attainment in English (Δ ES=0.08) but slightly attenuated in Mathematics (Δ ES=0.04).
Early Years Home Learning Environment (HLE) Measures The quality of the Early years HLE was found to be a very important factor for academic outcomes at the end of Year 2, however, while still a strong predictor by the end of Year 6, in the case of English, its influence had decreased: controlling for all the other background variables and compared to the lowest level of HLE the next lowest level Δ ES=0.12; compared to the same group the highest level of HLE Δ ES=0.09, see Figure 3.5. Figure 3.5: Early years HLE Effect Sizes Year 2 and Year 6 English
Early Years HLE Effect Sizes Year 2 and Year 6: English
0.26
0.38
0.52
0.78
0.15
0.20
0.34
0.69
0.00
0.10
0.20
0.30
0.40
0.50
0.60
0.70
0.80
0.90
HLE 14-19 HLE 20-24 HLE 25-32 HLE 33-44
HLE
Eff
ect
Siz
e
Year 2
Year 6
Comparison Group: Lowest
Early Years HLE 0-13
32
Mathematics, the same pattern was evident: controlling for all the other background variables and compared to the lowest level of HLE the next lowest level Δ ES=0.14; compared to the same group the highest level of HLE Δ ES=0.09, see Figure 3.6. Figure 3.6: Early years HLE Effect Sizes Year 2 and Year 6 Mathematics
Figures 3.7 and 3.8 summarize the extent of any change in effects. Taken together it appears that, for English more than Mathematics, the attainment gap related to some of the key background measures has further increased. Figure 3.7: The impact of child, family factors and HLE on English at Year 6 compared to
Year 2
English: Effect Sizes – Age 11 compared to Age 7
Gender Birth weight Ethnic groups Need of EAL support Developmental problems Parents’ qualification SES FSM Early years HLE
stronger Girls show higher attainment in both years.
Effect is now … Description
The Early years HLE still shows a strong positive effect on attainment, but slightly weaker than at Year 2.
Effect of birth weight has increased.
Little change from Year 2.
Effect of early developmental problems has increased.
Effect of need of EAL support has decreased.
stronger
similar
weaker slightly
weaker
Children of less well educated parents have fallen further behind.
Gap between children of families with different SES has slightly decreased.
Gap between children eligible for FSM and not eligible for FSM has increased.
stronger
slightly weaker
stronger
slightly
weaker
Early Years HLE Effect Sizes Year 2 and Year 6: Mathematics
0.19
0.28
0.35
0.56
0.05
0.11
0.18
0.42
0.00
0.10
0.20
0.30
0.40
0.50
0.60
HLE 14-19 HLE 20-24 HLE 25-32 HLE 33-44
HLE
Eff
ect
Siz
e
Year 2
Year 6
Comparison Group: Lowest
Early Years HLE 0-13
33
Figure 3.8: The impact of child, family factors and HLE on Mathematics at Year 6 compared to Year 2
Mathematics: Effect Sizes – Age 11 compared to Age 7
Gender Birth weight Ethnic groups Need of EAL support Developmental problems Parents’ qualification SES FSM Early years HLE
stronger Boys show higher attainment than girls now.
Effect is now … Description
The Early years HLE still shows a strong positive effect on attainment, but slightly weaker than at Year 2.
Effect of birth weight has increased.
Children who don‟t need EAL support have still higher scores than those with need.
Indian children continue to improve.
Effect of early developmental problems has slightly decreased.
stronger
similar
slightly weaker
slightly weaker
Children of less well educated parents have fallen further behind.
Gap between children of families with different SES has slightly decreased.
Gap between children eligible for FSM and not eligible for FSM has decreased.
stronger
slightly weaker
slightly weaker
slightly weaker
34
Section 4: Children’s Cognitive Attainments at the end of Year 6 in Primary School: The Impact of Pre-school and Primary School The contextualised analyses provide important evidence concerning the strength of background influences on young children‟s cognitive attainment at the end of Year 6. They illustrate that a range of child, parent and HLE factors continue to show a both statistically and educationally significant relationship with cognitive outcomes echoing earlier outcomes at entry to primary school and at the end of Year 2. Nonetheless these findings show that the overall impact of background factors on outcomes in English and Mathematics appears to be reducing while children move through primary school. These results are in line with the results of other studies which have tracked children over their time in primary school and found reduced variation accounted for by background variables the older the children get (i.e. Mortimore, 1998; Sammons et al., 1993). It is necessary to take account of such background influences before attempting to identify the impact of other factors such as any continuing effects of pre-school attendance or the effectiveness of primary school. An important feature of the original EPPE findings for the pre-school period relate to the positive impact of the pre-school centre experience on children‟s cognitive attainment at school entry and for the pre-school sample also on progress and developmental gains during the pre-school period up to Year 2 of primary school at age 7 years. Given the consistency of findings, that pre-school experience gave children a better start to school (see previous EPPE Technical Papers: Sammons et al., 2002: 2003), and evidence of persistence of effects (though at a more modest level) at subsequent assessments (ages 6, 7 and 10) an important aim of the Year 6 analyses is to establish whether there is evidence of any continuing pre-school influence at the end of primary schooling at age of 11 years. On the other hand, the children have already spent 6 years full time education in primary school, so one could expect that the academic effectiveness of the primary school attended has a major impact on children‟s cognitive attainment and progress. Another EPPE 3-11 aim therefore investigates the influence of primary school academic effectiveness as well as the combined influence of pre- and primary school on young children‟s cognitive attainments at the end of Year 6. A further major interest of the analyses was to explore whether pre-school experience and primary school effectiveness have different influences on different groups of children such as disadvantaged children or children of less qualified parents (the concept of differential effects or benefits). This section presents results of contextualized multilevel modelling analyses that have been used to investigate the described research questions.
The Impact of Pre-school Experience on Year 6 Attainment Five aspects of pre-school experience were considered to explore whether pre-school centre experience shows any continuing effect on Year 6 cognitive attainment: attendance at a pre-school centre compared to no pre-school, type of pre-school centre, duration, quality and effectiveness. In a further sub-section the combined impact of Early years HLE and pre-school experience is also investigated (see Figure 4.1 for an illustration of the analysis strategy). The presentation of these complex results focuses on effect sizes and charts that are also easy to understand by those not familiar with advanced statistical modelling. Further details on estimates and their standard errors for the predictors in the final models can be found in Appendix 6 (Tables A.6.3 – A.6.21).
35
Figure 4.1: Strategy of statistical analysis of net pre-school effects
The Impact of Pre-School Attendance, Duration of Pre-School Experience and Type of Pre-School In Year 6, there are significant net effects on attainment in English and Mathematics for the most basic indicator: attendance at a pre-school centre compared to no pre-school, ES=0.22 and ES=0.26, respectively. The impact of pre-school attendance is consistent with findings for Year 2. However, analysis of cognitive data in Year 5 did not identify any impact of pre-school attendance per se; however it is important to note that the sample of no pre-school (home) children available for Year 6 analysis, as opposed to Year 5, increased from 237 to 276, while the total sample itself increased by almost 150 individuals. It is possibly due to the reduced sample size available for Year 5 analysis (where schools conducted additional assessments for the research rather than the National assessments studied in Year 6 ) that an effect related to pre-school versus no pre-school was not identified (as a larger sample facilitates the identification of smaller effects), in contrast to the Year 6 results. The general pre-school effect identified above can be further explained by particular features of the pre-schools themselves. Further significant differences were found for English in relation to type of pre-school attended, as opposed to none: Nursery Class (ES=0.10); Playgroup (ES=0. 22); Private day nurseries (ES=0.28); Local authority day nurseries (ES=0.20); Nursery School (ES=0.35); and Combined Centres (ES=0.18). All showed significant differences except Nursery Classes and Combined Centres. When compared to Private Day Nursery of those children who went to pre-school only children who attended Nursery classes had poorer attainment (ES=0.18). A broadly similar pattern was evident for Mathematics: Nursery Class (ES=0.20); Playgroup (ES= 0.26); Private day nurseries (ES=0.31); Local authority day nurseries (ES=0.28); Nursery Schools (ES=0.30); and Combined Centres (ES=0.22). All showed significant differences except Combined Centres. When compared to Private day nurseries of those children who went to pre-school no children had poorer attainment. Moderate to strong effects at entry to primary school (age 5) and in Years 1 and 2 (ages 6 and 7 respectively) were identified for duration (in months) of children‟s pre-school experience. At the
Child
Factors
Family
Factors
Home
Learning
Environment
READING
MATHEMATICS
Pre-School
ENGLISH
36
end of Year 6 duration (in months of attendance) of pre-school in terms of English proved statistically significant for each of the measured time periods, as opposed to no pre-school, with the exception of the greatest duration - Over 36 months, although the ES was comparable: Months 0-12 (ES=0.23); Months 12-24 (ES=0.20); Months 24-36 (ES=0.24); Months Over 36 (ES=0.20). In terms of Mathematics each time period proved statistically significant when compared to „no pre-school‟: Months 0-12 (ES=0.28); Months 12-24 (ES=0.24); Months 24-36 (ES=0.26); Months Over 36 (ES=0.32). In contrast to earlier findings there was no clear trend in terms of longer duration of pre-school necessarily showing an advantage, supporting the conclusion that, controlling for background, the main difference in effect relates to a significant advantage to attending pre-school versus not attending. The Impact of Pre-school Centre Quality Results at earlier time points pointed to the positive impact of higher quality pre-school provision on cognitive outcomes. Analyses divided the sample into groups of children whose pre-school experience could be classified as ranging from no quality (i.e. the „home‟ group, approximately 10% of the sample) through low (15%), medium (52%) and high quality (23%), based on individual pre-school centres‟ ECERS-E scores – this being a measure of the educational quality of the pre-school setting. The results in Year 6 indicate that there are statistically significant differences in attainment in both English and Mathematics between the „home‟ children and both the medium and high quality groups. In terms of English the experience of high quality pre-school provision shows a positive impact on attainment at the end of Year 6 (ES=0.29) compared to the experience of a „home‟ children (see Figure 4.2), although attending a medium quality centre also had a significant impact (ES=0.22). The difference between „home‟ children and those children who went to a low quality pre-school were not significantly worse (no statistically significant differences)
Figure 4.2: The impact of quality of pre-school on attainments in English and Mathematics at Year 6
0.12
0.22
0.29
0.12
0.26
0.34
0.00
0.10
0.20
0.30
0.40
0.50
Low Quality Medium Quality High Quality
English
Mathematics
Net Effect of Quality (ECERS-E) of Pre-School
on English and Mathematics at Age 11
Eff
ec
t S
ize
Reference Group:
Home Children
In terms of Mathematics the effects for both medium and high quality provision compared to „home‟ children are stronger than for English, and both are statistically significant, ES=0.26 and ES=0.34, respectively (see Figure 4.2). Again children who stayed at home had the lowest ES but the results were not statistically significant different to those in low quality pre-school centre group.
37
However, comparing the „home‟ children and the low and medium quality pre-school groups to the „high quality‟ group for both English and Mathematics indicated that both „home‟ children and low quality group performed significantly worse: English „home‟ children: ES=0.29; low quality group ES= 0.17; Mathematics „home‟ children: ES=0.34; low quality group ES=0.21. We can conclude that for both English and Mathematics attending a high quality pre-school is associated with significantly enhanced attainment compared to no pre-school or low quality pre-school, and for Mathematics medium quality pre-schools are also associated with enhanced attainment: the ES are comparable in size to the effects of gender and eligibility for FSM, for comparison. The Impact of Pre-school Centre Effectiveness The value added analysis of the cognitive attainment of children who attended a pre-school, controlling for their prior attainment at entry to the study and background influences, produced estimates of pre-school centre effectiveness (value added residuals which measure relative gains over the pre-school period compared to those predicted by the multilevel model). For details of these analyses, see Sammons et al. (2002). Examples of more and of less effective centres were found within each type of provision. For this reason, in tracking the potential continuing influence of pre-school on later attainment at age 11, residual measures of pre-school centre effectiveness were analysed in the same way as those adopted for the study of pre-school observed quality. In order to establish whether the effectiveness of the pre-school setting attended shows any continuing impact on later attainment up to the end of KS2, further multilevel analyses were conducted on the Year 6 English and Mathematics outcomes. In these analyses pre-school centre effectiveness, in terms of promoting young children‟s progress in Pre-Reading, was tested as a potential predictor for later English attainment and pre-school centre effectiveness, in terms of promoting young children‟s progress in Early number concepts, was tested as a predictor for later Mathematics attainment.
Figure 4.3: The impact of pre-school effectiveness (Pre-Reading) on attainment in English at Year 6: ‘home’ children as reference group
0.20
0.25
0.22
0.0
0.1
0.1
0.2
0.2
0.3
0.3
0.4
Low Medium High
Net Effect of Pre-School Effectiveness (Pre-Reading)
on English at Age 11
Eff
ect
Siz
e
Pre-School Effectiveness
Reference Group:
'Home' Children
Controlling for child, family and HLE influences, the results indicate that measures of centre effectiveness still show a positive „net‟ impact on children‟s attainment in both English and Mathematics at Year 6 (see Figures 4.3 - 4.6).
38
Figure 4.4: The impact of pre-school effectiveness (Pre-Reading) on attainment in English at Year 6„: children at low effective schools as reference group
-0.19
0.070.03
-0.3
-0.2
-0.1
0.1
0.2
0.3
0.4
Home Children Medium High
Net Effect of Pre-School Effectiveness (Pre-Reading)
on English at Age 11
Eff
ect
Siz
e
Pre-School Effectiveness
Reference Group:
Low Effectiveness
In terms of English attainment, compared to „no pre-school‟, children who went to low medium or highly effective pre-schools have significantly higher attainment (see Figure 4.4). The same analysis was re-run but the low effectiveness pre-school group replaced the „home‟ children as comparison group: this allowed any differences in the impact of differing degrees of effectiveness to be gauged. Figure 4.5 shows that for English the differences are minor, further they do not reach significance, only the „„home‟ children‟ – who have lower attainment - differ significantly (ES=-0.19).
Figure 4.5: The impact of pre-school effectiveness (early number concepts) on attainment in Mathematics at Year 6: ‘home’ children as reference group.
0.24
0.40
0.21
-0.1
0.1
0.2
0.3
0.4
0.5
0.6
Low Medium High
Net Effect of Pre-School Effectiveness (Early Numbers)
on Mathematics at Age 11
Eff
ec
t S
ize
Pre-School Effectiveness
Reference Group:
'Home' Children
For Mathematics compared to „no pre-school‟, children who went to low, medium or high effective pre-schools have significantly higher attainment (Figure 4.5). However, when comparison is made
39
with low pre-school effectiveness, the „home‟ children have significantly lower scores (ES=-0.25), and the high effectiveness group have significantly higher scores (ES=0.16) (Figure 4.6). Figure 4.6: The impact of pre-school effectiveness (early numbers concepts) on attainment in Mathematics at Year 6: children at low effective schools as reference group.
-0.25
0.16
-0.05
-0.4
-0.3
-0.2
-0.1
0.1
0.2
0.3
0.4
0.5
0.6
Home Children Medium High
Net Effect of Pre-School Effectiveness (Early Numbers)
on Mathematics at Age 11
Eff
ect
Siz
e
Pre-School Effectiveness
Reference Group:
Low Effectiveness
Different Pre-school Effects for different Groups of Children A topic of particular interest is whether the pre-school experience has different effects on particular groups of children, specifically those groups of children who are more vulnerable to risk of low attainment. In terms of this risk key features identified as having considerable impact on attainment are the children‟s Early years HLE, the level of their parents, and particularly mother‟s, qualifications, and those children with greatest level of multiple disadvantage. Each of these is considered in the following section in terms of pre-school attendance, pre-school quality, and pre-school effectiveness. The Combined Impact of Pre-school Experience and Early Years Home Learning Environment (HLE) Given that the present analyses described above have already demonstrated modest effects for the quality and effectiveness of pre-school experience and strong effects for the Early years HLE on later academic attainments, their joint effects were investigated. For this analysis the Early years HLE index was regrouped into three categories representing low, medium and high Early years HLE. Early years HLE and Pre-school Attendance Figure 4.7 shows the combined effect of Early years HLE and pre-school attendance (yes/no), the reference group for these analyses is „no pre-school and low Early years HLE‟.
40
Figure 4.7: The combined impact of Early years HLE and pre-school on English attainment at Year 6
The Combined Impact of Early Years HLE and Pre-School: English
0
0.29
0.37
0.27
0.33
0.57
0
0.1
0.2
0.3
0.4
0.5
0.6
Low Medium High
Early Years HLE
Eff
ect
Siz
e
No Pre-School
Pre-SchoolReference Group: Low HLE and No
Pre-school
Figure 4.7 shows, for English, the positive effect of a good Early years HLE for the „home‟ children. Children who did not go to pre-school and who scored medium or high on the HLE index show a moderate benefit, ES=0.29 and ES=0.37 respectively, compared to the home-children with low HLE. However, when comparing these two groups of „home‟ children to the equivalent pre-school children (those who had moderate and high Early years HLE scores) the benefits of attending pre-school are clearly apparent: the pre-school children with moderate and high Early years HLE scores having effects sizes of 0.33 and 0.57 respectively. Furthermore, children with low Early years HLE tend to benefit from pre-school attendance ES=0.27 compared to „home‟ children. Children with high Early years HLE and pre-school experience also show the largest positive effects, ES=0.57. Interestingly the difference in ES between the low Early years HLE group who did or did not attend pre-school (ES=0.27) is slightly larger than the difference in ES between the high Early years HLE group who did or did not attend pre-school (ES difference 0.20).. Therefore going to pre-school makes the same difference to children‟s outcomes whether they‟ve got a low or a high Early years HLE. Figure 4.8: The combined impact of Early years HLE and pre-school on Mathematics attainment at Year 6
The Combined Impact of Early Years HLE
and Pre-School: Mathematics
0.00
0.250.24
0.29
0.34
0.48
0.00
0.10
0.20
0.30
0.40
0.50
0.60
Low Medium High
Early Years HLE
Eff
ect
Siz
e
no pre-school
pre-school
Reference Group:
Low HLE and No Pre-School
41
For Mathematics the pattern approximates that for English. Figures 4.7 and 4.8 illustrates that the Early years HLE has a strong positive influence on attainment in Year 6, controlling for other background factors such as SES or qualification of parents. The group of children with low Early years HLE receive a boost from attending pre-school centre compared to „home‟ children (ES=0.29). For children with medium Early years HLE, pre-school attendance makes some difference (ES=0.25 versus 0.34). The group of children with high Early years HLE not only get a boost through Early years HLE, but also an additional advantage from the pre-school centre experience (ES=0.48). Again the pre-school boost for low Early years HLE children (ES=0.29) is slightly stronger than that for high Early years HLE children (ES=0.24). Taken together the results support the view that both low and high Early years HLE children show a similar boost from pre-school attendance, though the impact for medium Early years HLE children is weaker. Early years HLE and the Quality of the Pre-school Further analyses were conducted investigating not just pre-school attendance but also the quality of the pre-school centre attended. This gives further insight into the way Early years HLE and pre-school may interact in influencing children‟s cognitive attainments in the longer term (see Figure 4.9). The reference group in these analyses is again the „no pre-school and low Early years HLE‟ group. Results are reported in terms of effect sizes. (See the tables in Appendix 6 for statistical significances of the effects).
Figure 4.9: The combined impact of Early years HLE and quality of pre-school on attainment in English at Year 6
The Combined Impact of Early Years HLE and Pre-School Quality (ECERS-E) on
Attainment in English in Year 6
0
0.29
0.37
0.33
0.25
0.37
0.19
0.34
0.61
0.44
0.36
0.58
0
0.1
0.2
0.3
0.4
0.5
0.6
0.7
Low Medium High
Early Years HLE
Eff
ect
Siz
e
No Pre School
Low Quality
Medium Quality
High Quality
Reference Group:
Low HLE and No Pre-School
Figure 4.9 shows the results for English and illustrates that children with low Early years HLE gain an advantage from attending any pre-school, but particularly high quality pre-schools (ES=0.44). Children with medium HLE tend to have an additional benefit of attending pre-school, though the extra boost in ES for the „high quality‟ is not as great as was found for the low Early years HLE group. Children who have high Early years HLE and went to a medium or high quality pre-school are found to have the strongest positive long term benefit in English at the end of Year 6 (ES=0.61 and ES=0.58, respectively).
42
Again the „Home‟ children and those attending low quality provision also benefit from high Early years HLE, with comparable net effect sizes of 0.37 respectively. However their boost is not as great as that for low Early years HLE children who went to high quality pre-school. Children who went to low quality pre-school with high Early years HLE (ES=0.37) are still doing better than children who went to low quality pre-school and had low (ES=0.33) or medium (ES=0.25) Early years HLE. These findings underline the importance of the quality of the pre-school centre for promoting English attainment and also the importance of Early years HLE. Figure 4.10: The combined impact of Early years HLE and quality of pre-school on attainment in English at Year 6
The Combined Impact of Early Years HLE and Pre-School Quality (ECERS-E) on
Attainment in Mathematics in Year 6
0
0.25 0.25
0.29 0.290.27
0.23
0.36
0.54
0.51
0.38
0.51
0
0.1
0.2
0.3
0.4
0.5
0.6
0.7
Low Medium High
Early Years HLE
Eff
ect
Siz
eNo Pre School
Low Quality
Medium Quality
High Quality
Reference Group:
Low HLE and No Pre-School
Figure 4.10 shows that for Mathematics, the pattern of results again approximates that found for English, and again indicates positive effects. We find that children with low Early years HLE are doing best at the end of Year 6 if they previously attended a high quality pre-school and the effect is quite strong (ES=0.51) compared to „no pre-school and low HLE‟. Children with medium Early years HLE show smaller, but not inconsiderable long term effects of pre-school, with the effect sizes increasing gently in a linear fashion as the quality of the pre-school improves: compared to „no pre-school and low Early years HLE‟ ES are 0.29, 0.36 and 0.38 for low, medium and high quality pre-school. Further, children with medium Early years HLE who did not attend pre-school also tend to show better results than children who stayed at home and experienced low Early years HLE (ES=0.25). In contrast, high Early years HLE children show greater benefit from medium and high quality pre-school for later mathematics results (ES for medium quality = 0.54, ES=for high quality = 0.51 compared to ES=0.25 for „high Early years HLE and no pre-school‟) when compared to the low Early years HLE and no pre-school. For high Early years HLE children the impact of medium quality pre-school is more positive than for the low Early years HLE group. The interactions suggest that the benefits of the pre-school-experience appear to be mediated by the quality of Early years HLE experienced by children.
43
Early years HLE and Pre-school Effectiveness We also investigated the issue of differential pre-school effects on Early years HLE and pre-school centre effectiveness. Figure 4.11: The combined impact of Early years HLE and effectiveness of pre-school on attainment in English at Year 6
The Combined Impact of Early Years HLE and Pre-School Effectiveness (Pre-Reading)
on Attainment in English in Year 6
0
0.29
0.36
0.240.22
0.56
0.28
0.36
0.56
0.3
0.36
0.59
0
0.1
0.2
0.3
0.4
0.5
0.6
0.7
Low Medium High
Early Years HLE
Eff
ect
Siz
eNo Pre School
Low Effective
Medium Effective
High Effective
Reference Group:
Low HLE and No Pre-School
Results for English taken together show a clear trend: compared to low Early years HLE and no pre-school all other combinations show a sustained benefit on later attainment in Year 6, the effect sizes tend to increase in terms of both Early years HLE score and pre-school effectiveness. Figure 4.12: The combined impact of Early years HLE and effectiveness of pre-school on attainment in Mathematics at Year 6
The Combined Impact of Early Years HLE and Pre-School Effectiveness (Early
Numbes) on Attainment in Mathematics in Year 6
0
0.25 0.25
0.31
0.28
0.52
0.23
0.35
0.43
0.57
0.4
0.67
0
0.1
0.2
0.3
0.4
0.5
0.6
0.7
Low Medium High
Early Years HLE
Eff
ect
Siz
eNo Pre School
Low Effective
Medium Effective
High Effective
Reference Group:
Low HLE and No Pre-School
44
Figure 4.12 shows the results for Mathematics, which are similar to those for English: although the differences tend to be more pronounced, the beneficial effects tend to increase in terms of both Early years HLE score and pre-school effectiveness. Children who have a low Early years HLE obtain most advantage from attending pre-schools that were highly effective in promoting young children‟s progress in Early number concepts (ES=0.57), as opposed to for medium (ES=0.23) or low effective pre-schools (ES=0.31). In the case of children with medium Early years HLE attainment also shows a steady if modest increase along with the effectiveness of the pre-school. The children who show the greatest attainment boost are those children who have high Early years HLE - when compared to with those with lower Early years HLE but who attend pre-schools of equivalent effectiveness. Consistent with this the children that do better than any other group have both high Early years HLE and attended highly effective pre-schools (ES=0.64). These children not only benefit from the high level of their Early years HLE, but get an additional boost from attending a more effective pre-school. In the case of both English and Mathematics these findings are in broad accord with those on quality reported earlier in this section.24 Multiple disadvantage and the impact of pre-school experience For the following analyses two disadvantage groups were developed: children with no or just one recorded disadvantage (46% of the sample) and children with two or more disadvantages (48% of the sample, note that approx 6% of the sample do not have a score on the Multiple disadvantage index due to missing values). With respect to differential pre-school effects we find for English attainment at Year 6 that just attending a pre-school centre compared with not, irrespective of quality or effectiveness of the pre-school centre, still has a positive effect for the less disadvantaged children (ES=0.31), but not significantly so, nor approaching significance, for those children with more disadvantages (ES=0.14). In Mathematics, however, the results show the same pattern for less disadvantaged children for attending a pre-school (ES=0.30), but also a significant if smaller positive effect of attending any pre-school compared with not attending for the more disadvantaged children (ES=0.20). The results once again indicate that the quality of the pre-school centre (measured by ECERS-E) remains important. Compared to the group of highly disadvantaged children who attended a low quality pre-school centre, only the low disadvantaged children who attended medium or high quality pre-schools show significantly better English attainment at the end of Year 6, (ES=0.21 and ES=0.29, respectively). The highly disadvantaged children who attended medium and high quality pre-schools did have more positive English attainment than the high disadvantage/ low quality pre-school group, but this was not significantly greater (ES=0.03 and ES=0.06, respectively). The „home‟ children, regardless of degree of disadvantage, tended to do worse than those highly disadvantaged children who attended a low quality pre-school, but not significantly so: ES=-0.09 and ES=-0.10. For Mathematics the distinction between low and high disadvantage breaks down when compared to the high disadvantage/ low quality pre-school group: in this case both low and high disadvantaged children who attended medium quality pre-schools (ES=0.25 and ES=0.18, respectively), and low and high disadvantaged children who attended high quality pre-schools (ES=0.33 and ES=0.21, respectively) had significantly greater attainment in Year 6 than the high disadvantage/ low quality pre-school group. As was the case with respect to English, the „home‟ children, regardless of degree of disadvantage, tended to do worse than those high disadvantaged children who attended a low quality pre-school, but not significantly so: ES=-0.12 and ES=-0.04.
24
It should be noted that pre-school quality is a factor found to help predict pre-school effectiveness, although it does not account for all the variation in effectiveness amongst the 141 centres in the sample (Sammons et al., 2002).
45
With respect to the effectiveness of the pre-school centre, there is a similar distinction between English and Mathematics attainment: compared to highly disadvantaged children at low effectiveness pre-schools it is only those low disadvantaged children at medium or high effectiveness schools that show greater attainment in English (ES=0.20 and ES=0.22, respectively). In contrast, only those children who attended high effective pre-schools, regardless of degree of disadvantage, have greater attainment in Mathematics, when compared to high disadvantaged children who attended low effective pre-schools (ES=0.30 for low disadvantaged children, and ES=0.25 for high disadvantaged children). These results provide some support for the view that higher quality and more effective pre-schools can provide some long term boost for more disadvantaged groups, but specifically in the case of Mathematics, attainment in which is typically more sensitive to quality and effectiveness rating of pre-school than English. For English it is the less disadvantaged children that seem to benefit more from attending high quality and high effective pre-schools. These distinctions aside it is possible to conclude that pre-school generally gives a long term boost especially higher quality and more effective pre-school. In all cases the results do not indicate that pre-school by itself can overcome the influence of background, rather than better early years experiences (defined by observed quality and measured effectiveness) can help ameliorate the negative impact of disadvantage. The results regarding disadvantage are however less clear cut than those relating to Early years HLE reported above where the compensatory impact of better pre-school experiences is more strongly evident. Parents’ qualification level and the impact of pre-school experience For these analyses the sample was divided into two groups by the highest qualification level of the parents. Low qualified parents in these analyses are defined as parents whose highest qualification level is none or 16 academic or vocational (56% of the sample). Vice versa, in the more highly qualified group at least one parent has any higher qualification (40%, approx 4% have missing values). With regard to the effect of past pre-school attendance, attending a pre-school continues to make a significant difference for later attainment in English at Year 6 for children of both more highly qualified parents (ES=0.36), and of low qualified parents (ES=0.11). For Mathematics similar results are found: children of more highly qualified parents gain more advantage from attending any pre-school (ES=0.46), irrespective of quality or effectiveness than children of less qualified parents (ES=0.17) who do not have significantly greater attainment than the comparison group of low qualified parent and no pre-school. In terms of pre-school quality, for later English attainment, the results indicate that it is only the children of more highly qualified parents, regardless of pre-school quality, that have statistically significantly greater attainment compared with children of low qualified parents who did not attend pre-school. Compared to this group children with low qualified parents at low quality pre-schools had lower attainment (ES=0.02) than children with highly qualified parents at low quality pre-schools (ES=0.26). This pattern is repeated for those who attended medium quality pre-schools: children with low qualified parents (ES=0.09) and those with highly qualified parents (ES=0.38). It‟s also repeated for those who attended high quality pre-schools: children with low qualified parents (ES=0.21) and those with highly qualified parents (ES=0.33). Children of more highly qualified parents who did not attend pre-school, however, show lower attainment levels than children of low qualified parents who did not attend pre-school, although the difference fails to reach significance (ES=-0.22), and due to the small numbers in this group it‟s not possible to make a reliable comparison. These results indicate again that the qualification levels of the children‟s parents remain a strong predictor of better English attainment in the long term.
46
The results for Mathematics indicate that attainment in this subject is more sensitive to pre-school quality. The children of highly qualified parents, regardless of pre-school quality, have significantly greater attainment compared to „home‟ children with low qualified parents, as do children of low qualified parents, who attended high quality pre-school. Compared to children with low qualified parents who did not attend pre-school children with low qualified parents who attended low quality pre-school had very similar levels of attainment (ES=0.02). Children with highly qualified parents who attended low quality pre-school differed substantially (ES=0.32). This is also the case for those who attended medium quality pre-schools: children with low qualified parents had lower attainment (ES=0.16) than those with highly qualified parents (ES=0.44). Children with low qualified parents who attended high quality pre-school (ES=0.28) do better, while children with highly qualified parents who attended high quality pre-schools have a yet stronger boost (ES=0.44). Children of highly qualified parents who did not attend pre-school show lower attainment levels than children of low qualified parents who did not attend pre-school, although not significantly so (ES=-0.11). In terms of Mathematics the long term effects of pre-school quality are again evident, regardless of parents‟ level of qualification but only those with earlier high quality pre-school experience do better than might be expected from their parents‟ qualification group. The effectiveness of the pre-school displays the same patterns of effects on later attainment as were found for pre-school quality for both English and Mathematics. Compared to children with low qualified parents who did not attend pre-school. In the case of English only the children of more highly qualified parents, regardless of pre-school effectiveness, had significantly greater attainment than the low qualified/ no pre-school group. Compared to children with low qualified parents who did not attend pre-school, those children with low qualified parents who attended low quality pre-schools had relatively lower attainment (ES=0.12) than children with highly qualified parents who attended low quality pre-schools (ES=0.27). This is also the case for those who attended medium quality pre-schools: children with low qualified parents had lower attainment (ES=0.12) than those with highly qualified parents (ES=0.39). Again it holds for children with low qualified parents who attended high quality pre-schools (ES=0.15) and children with highly qualified parents who attended high quality pre-schools (ES=0.44). Children of more highly qualified parents who did not attend pre-school, however, show lower attainment levels than children of low qualified parents who did not attend pre-school, although not significantly so (ES=-0.22). The results for Mathematics indicate that attainment in this subject is more sensitive to pre-school effectiveness: although the children of highly qualified parents, regardless of pre-school effectiveness, have significantly greater attainment compared with „home‟ children with low qualified parents, as do children of low qualified parents, who attended high effectiveness pre-schools (ES=0.32) . Compared to „home‟ children with low qualified parents children with low qualified parents who attended low effectiveness pre-schools had lower attainment (ES=0.20) than children with highly qualified parents who also attended low effectiveness pre-schools (ES=0.41). This is also the case for those who attended medium effectiveness pre-schools: children with low qualified parents had lower attainment (ES=0.11) than those with highly qualified parents (ES=0.40). Again it holds for children with low qualified parents who attended high effectiveness pre-schools (ES=0.32) and children with highly qualified parents who attended high effectiveness pre-schools (ES=0.56). Children of highly qualified parents who did not attend pre-school show lower attainment levels than children of low qualified parents who did not attend pre-school, although not significantly so (ES=-0.10). This is due to the small size of the group producing results that are not reliable. Children of low qualified parents benefit especially from highly effective pre-school but not particularly from medium or low effective pre-schools. Children of highly qualified parents achieve
47
higher attainment in Mathematics at the end of Year 6 if they had any pre-school experience irrespective of the effectiveness of the pre-school but, none the less gain the greatest advantage from attending high effectiveness pre-schools. The findings in this section indicate that pre-school seems to benefit the less disadvantaged groups more than the disadvantaged in the longer term. However, despite the comparative lack of benefit for the more disadvantaged children there is some evidence that the quality and effectiveness of pre-school attended remains a significant influence on later attainment in Year 6. Overall the predictive power seems to be stronger for Mathematics than for English. Low quality or low effective pre-schools seem to be associated with poorer outcomes in the long term, as does not attending pre-school. In terms of the „at risk‟ groups the following findings were made: Children with Low Early years HLE Children with low Early years HLE show a considerable benefit from attending a pre-school, as opposed to not attending one for both English and Mathematics. Children with low Early years HLE derive greatest advantage by attending a high quality pre-school, rather than a medium or low quality pre-school in terms of both English and Mathematics. For children with low Early years HLE greatest advantage is realised by attending a high effective pre-school, rather than medium or low effective for both English and Mathematics. Children with Multiple Disadvantages Children with a large number of disadvantages do not gain any great advantage form attending a pre-school in terms of reading but do in terms of mathematics. There is a clear benefit for those with greatest levels of disadvantage from attending a higher quality pre-school in mathematics. Similarly, the highly disadvantaged children benefit from attending highly effective pre-schools, but again only in terms of mathematics. Children with low qualified parents Children with low qualified parents show only a slight benefit from attending a pre-school for both Reading and Mathematics; in terms of attainment in Reading the quality of the pre-school has little impact on children of low qualified parents. Attainment in mathematics is more sensitive to quality and children of low qualified parent benefit from attendance at high quality pre-schools. The same pattern holds for pre-school effectiveness.
The Impact of Primary School Effectiveness
A large number of schools in the EPPE 3-11 sample are attended by only one EPPE 3-11 child (see Section 2) therefore we cannot calculate individual primary school effects from the EPPE 3-11 sample data set. Instead other independent measures of the academic effectiveness of the primary school attended have been derived and are incorporated in multilevel models in this section to explore the influence of the primary school attended on promoting the academic attainments of the EPPE 3-11 children as is demonstrated in this section. Analyses were conducted on the EPPE 3-11 data to establish the net impact of primary school academic effectiveness on cognitive outcomes without taking into account any characteristics of pre-school experience in the first instance (but all the other relevant background characteristics, see Figure 4.13 for an illustration of the strategy of statistical analyses). The value added effectiveness measures for primary schools were calculated using National assessment data for all primary schools in England linking Key Stage 1 and Key Stage 2 results, and separate indicators were calculated for the different core curriculum subjects English, Mathematics and Science
48
(Melhuish et al., 2006a; 2006b). These measures are thus independently derived and provide a measure of the academic success of the primary school in promoting its pupils‟ academic progress. The school‟s value added effectiveness in English was modelled as a potential predictor for EPPE 3-11 children‟s English outcomes in Year 6, and the school‟s value added effectiveness in Mathematics as a potential predictor for the sample‟s outcomes in Mathematics.
Figure 4.13: Strategy of statistical analysis of net primary school effects
From these analyses we conclude that the academic effectiveness of the primary school attended has a significant influence on EPPE3-11 children‟s longer term cognitive development (see Figure 4.14). It makes an identifiable and separate contribution to children‟s later attainment at Year 6, after controlling for child, family and HLE influences. Figure 4.14: The impact of primary school on attainments in English and Mathematics at Year 6.
The Net Impact of Primary School Effectiveness: English and
Mathematics in Year 6
0.07
0.15
0.24
0.38
0.00
0.05
0.10
0.15
0.20
0.25
0.30
0.35
0.40
0.45
0.50
English Mathematics
Eff
ect
Siz
e
Medium
High to Very High
Reference Group:
Low Effectiveness
Child
Factors
Family
Factors
Home
Learning
Environment
READING
MATHEMATICS
Primary
School
ENGLISH
49
Children who attended a very highly, highly or medium effective primary school in terms of Mathematics have significantly better scores in Mathematics than children who attended a low effective primary school. The ES for the high to very high effective schools is 0.38 for Mathematics, larger than that attributable to gender or eligibility for FSM, for example. Children who attended a very highly or highly effective primary school in terms of English also have better English attainment at the end of Year 6 than children who attend a low effective primary school, although the difference is less marked (ES=0.24)25 Different influences of primary school effectiveness for different groups of children In this part of the report the analyses explore any differential influences of primary school academic effectiveness on children‟s cognitive attainments at Year 6. Two measures of disadvantage are examined one being the Multiple disadvantage index and the second the highest qualification level of the parents. Multiple disadvantage and the impact of primary school effectiveness For the following analyses two disadvantage groups were developed: representing less and more disadvantaged children as described previously. For attainment in English the results illustrate that the academic effectiveness of the primary school in English is relatively more important for the disadvantaged than for the less disadvantaged children. Compared to a low effective primary school, disadvantaged children show higher attainment when they go to a highly effective primary school (ES=0.25) but not if they attend a medium effective school (ES=-0.05). By contrast, for less disadvantaged children there seems to be little difference whether they go to a medium effective (ES=-0.03) or to a high effective (ES=-0.03) school compared to a low effective one.26 The effectiveness of the primary school also shows differential effects on attainment in Mathematics in relation to how disadvantaged children are in terms of the Multiple disadvantage index. Children with no or just one disadvantage tend to benefit from highly effective primary schools (ES=0.14) but not that much from medium effective schools (ES=0.06) compared with a low effective primary school. By contrast, more disadvantaged children show substantially higher attainment when they attend a highly effective (ES=0.43) or medium effective (ES=0.24) primary school compared to a low effective one. This demonstrates that primary school effectiveness is relatively more important as an influence on pupils‟ attainments at Year 6 for children who are more disadvantaged. Parents’ qualification level and the impact of primary school effectiveness For these analyses, again, the sample has been divided into two groups according to the highest qualification level of the parents. Investigating the differential impact of primary school effectiveness, for English children of less qualified parents do not seem to differ in their attainment from medium or high academic effective primary schools compared to low effective ones (ES for medium effective = -0.07, ES for highly effective = 0.06). But children of moderate to highly qualified parents have higher attainment scores when they attend a highly effective primary school (ES=0.27). Medium effectiveness only shows a small effect compared to low effectiveness (ES=0.06). Results for attainment in Mathematics in Year 6 lead to different interpretations. In Mathematics, the primary school effectiveness is especially important for those whose parents have low qualification levels. Compared to those who attended low effective primary schools, children who
25
These findings are broadly in line with those reported in terms of independent NFER assessments made in Year 5 for the same sample 26
Children with missing primary school effectiveness scores show higher attainment in the group of advantaged children. The scores of these children are very likely not available because they attend private schools.
50
went to highly (ES=0.44) or medium academically effective (ES=0.35) primary schools have significantly higher average Mathematics scores at Year 6. The relative effectiveness of the primary school is also important for children of parents with moderate or higher qualifications, but the effect sizes 0.26 (highly effective) and 0.10 (medium effective) are not as strong as those identified for children with less qualified parents. Overall taken together these findings are in line with other educational effectiveness research which indicates that school effectiveness varies more in subjects such as Mathematics, and that disadvantaged children are more susceptible to school effects (Scheerens & Bosker 1997).
The combined impact of pre-school experience and primary school effectiveness Given that EPPE 3-11 has demonstrated both the importance of certain characteristics of pre-school experience and the impact of primary school effectiveness for long lasting positive effects on later cognitive attainments, their joint effects were investigated. We sought to establish whether going to a high quality or more effective pre-school had a protective influence if a child went on to a less effective primary school, and whether „home‟ children, or those who went to a less effective or low quality pre-school, did better later if they went to a more effective primary school. We combined the two measures pre-school quality (according to the ECERS-E score of the pre-school) and primary school effectiveness and incorporated them in the same model - controlling for background factors - to explore any joint effects of pre-school and primary school. Results for English and Mathematics are shown in Figures 4.15 and 4.16. Due to smaller numbers to obtain a clearer picture, medium and high effective primary schools were grouped together. In both cases (English and Mathematics) the reference group is no pre-school and low effective primary school.
Figure 4.15: The combined impact of pre-school quality and primary school effectiveness on attainment in English at Year 6.
The Combined Impact of Pre-School Quality and Primary School
Effectiveness: English Year 6
0
-0.11
-0.06
0.12
-0.13
-0.03
0.07
0.23
-0.3
-0.2
-0.1
0
0.1
0.2
0.3
No Pre School Low Medium High
Pre-School Quality
Eff
ect
Siz
eVery Low / LowEffective
Medium / High /Very HighEffective
Primary School Effectiveness
Reference group:
No pre-school and Very Low / Low
Effectiveness
Figure 4.15, illustrates for English that children who did not attend any pre-school centre perform poorly even if they go to a medium / high academic effective primary school later on (ES=-0.13). Furthermore, children who attended a low quality pre-school centre show no benefit from a medium or highly effective primary school. For the group of children who attended a medium quality pre-school centre it is only those that also attended a medium/high effective primary school
51
that show enhanced attainment, and even this is small (ES=0.07). Of those who attended pre-schools of high quality both groups benefit, but those at medium/ high effective primary schools benefit most ES=0.23). The contrast between the low quality/high effectiveness group (ES=0.12) and medium quality and high effectiveness group (ES=0.07) indicates that the quality of the pre-school can compensate for the possible adverse influence of attending a lower effectiveness primary school. These findings indicate English is sensitive to extra-school influences, like the home environment. Figure 4.16 shows a clear pattern of results: the better the quality of pre-school the higher the attainment, and the more academically effective the primary school the higher the attainment. Children who did not attend pre-school gain a particularly strong benefit from attending a more academically effective primary school. Children who went to a low or medium quality pre-school centre and low effective primary school later on are still doing better than those children who did not have any pre-school experience and went to a low effective primary school. Children who went to high quality pre-school are doing particularly well, even if they went to a low quality primary school later on (again indicative of an apparent compensatory effect). For children who went to a high quality pre-school centre and a medium/high effective primary school, we find an additive effect. These children are doing best at the end of Year 6 controlling for the influence of all other background factors. Primary school effectiveness has greatest positive influence on those children who did not attend pre-school, or attended a low quality pre-school. Figure 4.16: The combined impact of pre-school quality and primary school effectiveness on attainment in Mathematics at Year 6.
The Combined Impact of Pre-School Quality and Primary School
Effectiveness:Mathematics Year 6
0
0.29
0.41
0.6
0.430.45
0.56
0.67
0
0.1
0.2
0.3
0.4
0.5
0.6
0.7
0.8
No Pre School Low Medium High
Pre-School Quality
Eff
ect
Siz
e
Very Low / LowEffective
Medium / High /Very High Effective
Primary School Effectiveness
Reference group:
No pre-school and Very Low / Low
Effectiveness
The combined impact of pre-school effectiveness and primary school effectiveness In addition to the analyses of the individual impact of pre- and primary school academic effectiveness, these two measures were taken together and incorporated in the same model so that the combined effects could be studied. We sought to establish whether going to a more effective pre-school had a protective influence if a child went on to a less effective primary school, and whether „home‟ children or those who went to a less effective pre-school centre did better later if they went to a more effective primary school. Results for English and Mathematics are
52
presented in Figures 4.17 and 4.18. The reference group for these analyses are children with no pre-school experience who attended a low academically effective primary school. Figure 4.17: The combined impact of pre- and primary school effectiveness on attainment in English at Year 6.
The Combined Impact of Pre-School and Primary School
Effectiveness: English in Year 6
0
-0.07-0.09
0.23
-0.15
0.04
0.07
0.14
0.2
0.43
0.20.22
-0.2
-0.1
0
0.1
0.2
0.3
0.4
No Pre School Low Medium High
Pre-School Effectiveness
Eff
ect
Siz
e
Low Effective
Medium Effective
High Effective
Primary School Effectiveness
Reference group:
No pre-school and Low
Effectiveness
Figure 4.18: The combined impact of pre- and primary school effectiveness on attainment in Mathematics at Year 6.
The Combined Impact of Pre-School and Primary School
Effectiveness: Mathematics in Year 6
0
0.4
0.35
0.83
0.41
0.530.51
0.680.65
0.9
0.71
0.83
0
0.1
0.2
0.3
0.4
0.5
0.6
0.7
0.8
0.9
1
No Pre School Low Medium High
Pre-School Effectiveness
Eff
ect
Siz
e
Low Effective
Medium Effective
High Effective
Primary School Effectiveness
Reference group:
No pre-school and Low
Effectiveness
Figures 4.17 and 4.18 shows clearly for both English and Mathematics that in the case of those children who attended high academic effective pre-schools, children have comparable levels of attainment regardless of the academic effectiveness of the primary school they attend. This, however, does not hold for children who attended lower effective pre-schools: in such cases there is a clear gradation of attainment by primary school academic effectiveness.
53
Mobility during pre-school and primary school Exploring the characteristics of children who changed schools during Key Stage 1 and 2 and how this mobility is related to children‟s cognitive and social/behavioural outcomes during Key Stage 2 are reported separately (Melhuish et al.,2008b). Here we summarise the key findings. Mobility is defined here as a change of pre-school or primary school that does not result from a school closure, amalgamation, or transfer across phases of schooling. Of the total EPPE sample (but excluding children who did not attend pre-school - the „home‟ group), more than a third of the sample (35%) changed pre-schools, seventeen percent of the sample changed schools during KS1 and about fifth of the sample (22.5%) changed schools during KS2 (Table 4.1). Table 4.1: Mobility during pre-school and primary school
EPPE sample*
Pre-school KS1 KS2
Non-mobile
Mobile Non-mobile
Mobile Non-mobile
Mobile
n % n % n % n % n % n %
Total 1848 64.7 1009 35.3 2288 83.1 465 16.9 2054 77.5 596 22.5 *excluding children who did not attend pre-school („home‟ group)
In descriptive terms a clear relation between mobility and multiple disadvantage27 at various time points can be seen, see Figure 4.19. . Figure 4.19: Average rate of mobility for different levels of multiple disadvantage
Exploring the characteristics of mobile groups at different educational time points in terms of specific background variables, rather then the multiple disadvantage index showed that there is a difference in level of social advantage, between families whose children moved between pre-school centres and those who moved in primary school. More advantaged families, defined in
27
Total Multiple Disadvantage is a single measure combining ten different variables (from the child, parent, and home level, each of which is considered to be an indicator of „risk‟.
54
terms of mother‟s highest qualification, were more likely to move during pre-school; and those eligible for free school meals (FSM) less likely to move during pre-school. Mobility during Key Stage 1 (KS1 - 5-7 years old) of primary school had the reverse characteristic: those more socially disadvantaged, in terms of being eligible for FSM and those with absent fathers, were more likely to move during KS1 than those who were more advantaged. Mobility during Key Stage 2 (KS2 - 8-11 years old) was also typified by such social disadvantage but not to the same degree as during KS1. These differences in family characteristics of mobile children in pre-school versus those mobile in primary school is illustrated in Figure 4.19. The pattern evident in Figure 4.19 shows that the more advantaged children had higher rates of pre-school mobility and lower rates in KS1. Those with the highest levels of disadvantage had the lowest rates of mobility in pre-school and the highest rates of mobility during KS1 and KS2. Children who were mobile during pre-school were more likely to come from socially advantaged families and to go on to attend a more academically effective primary school. By contrast, children who were mobile in KS1 were more likely to come from socially disadvantaged families and have been attending a primary school with a significantly lower academic effectiveness before moving school. However, changing schools in KS2 is not related to primary school academic effectiveness, therefore, the KS2 mobility group do not appear to move to go to a more or less academically effective school. Prior research has indicated that mobility is associated with lower levels of academic attainment (see for example, Machin, Telhaj & Wilson, 2006). Furthermore, Strand and Demie (2006) have found that although 7 to 11 year old pupil mobility is associated with poorer attainment, when other background factors (e.g. disadvantage) are taken into account this association is reduced, and it completely disappears when looking at progress, i.e. controlling for prior attainment. These findings suggest that it is social disadvantage rather than mobility that accounts for the lower academic attainment that has been associated with mobility as it co-varies with disadvantage rather than exerting an independent influence on academic attainment. The findings on the EPPE sample, in terms of mobility itself, are broadly consistent with previous research (Strand and Demie, 2006). Mobility, that is at least one change of school, either during pre-school or KS1 has little independent impact on cognitive outcomes, when both background and prior attainment are taken into account and when the estimate is made against a simple non-mobility group for the same period. However, mobility in the KS2 period was associated with lower levels of Mathematics attainment in KS2, after controlling for background characteristics (ES=-0.27), but not significantly so with English (ES=-0.16). Further analyses did not show that if a child changed schools during both KS1 and KS2 (4% of the sample), they had poorer cognitive outcomes in Year 6. Note, however, that from these results it is not possible to conclude whether or not KS2 mobility causes poorer cognitive outcomes; we can only show that mobility during primary school in KS2 is associated with poorer children‟s outcomes. Mobility might reflect unmeasured family characteristics that might mediate the association between mobility and social/behavioural outcomes. Possible unmeasured family characteristics that might be influential include parental personality such as being go-getting or achievement oriented or sub-cultural factors related to child achievement. Also movement might be job related, due to family breakdown, increase in family size, or to re-locate in the catchment area for a particular school. However, it is also possible that a child‟s poor cognitive progress in one school might dispose parents to move their child to another school. For a detailed description on mobility during pre-school, KS1 and KS2 please refer to the separate report (Melhuish et al., 2008b).
55
Summary of Pre- and Primary School Influences The contextualised multilevel models tested the net impact of different aspects of pre- and primary school experience while controlling for all other background measures simultaneously and thus provide rigorous and conservative estimates of statistical significance of any continuing pre-school effects on later attainment in Year 6 as well as of primary school influence. The contextualised analyses show that good pre-school experience (in terms of high quality and high effectiveness) can still make a difference to children‟s longer term cognitive attainments even after 6 years full time in primary school education. Compared to earlier time points the strength of effects have decreased to some extent as might be expected, due to the length and variation in primary school experience and also probably reflecting the growing influence of the peer group. The results also illustrated that the academic effectiveness of the primary school also matters for attainments in English and Mathematics at the end of Year 6. A high academic effective primary school seems to be especially important for those children who did not go to pre-school (the lowest attainment are for the no pre-school group who went on to a low academically effective primary school). However, low quality pre-school offers relatively little long term benefit for attainment (in contrast to previously reported findings at younger ages). On the other hand attending high quality or more effective pre-school seems to act as a moderate to strong protective factor for children who go on to attend a less academically effective primary school.
56
Section 5: Exploring Relative Cognitive Progress across Key Stage 2 between Year 2 and Year 6 of Primary School Education Young children‟s cognitive progress was investigated over the pre-school period, from age 3 years plus to primary school entry (see Sammons et al., 2002). The results were used to identify measures of pre-school centre effects, based on value added analyses, tested in earlier sections of this report in relation to attainment at the end of Year 6. Further analyses of progress were reported between Year 1 and Year 5 (Sammons et al, 2007a). In this paper we now explore academic progress from the end of Year 2 at primary school to the end of Year 6 at primary school using National assessment results as outcomes. The assessments at the end of Year 2 provide the baseline measures for these analyses of pupil progress. The results of the simple value added models control only for prior cognitive attainments at the end of Year 2 for prediction of attainments in English and Mathematics at the end of Year 6. The results indicate that slightly more of the total variance in English at the end of Year 6 is accounted for by prior attainment at the end of Year 2 than is the case for Mathematics (approximately fifty-three per cent for English, approximately forty-eight per cent for Mathematics). The results also then indicate the greater importance of a particular school (or more generally educational environment) for progress in Mathematics during Key Stage 2. (Table A.7.1.a, Appendix 7 summarises the results for English and Mathematics progress). The variation in children‟s progress associated with their school is an overall indicator of potential differences in school effectiveness. It is possible that any variation between schools, in terms of progress, may reflect differences in teaching approaches and emphases during Key Stage 1 and Key Stage 2 (a matter explored in a sub study of 125 schools and Year 5 classes using classroom observations see Sammons et al., 2006). This is a further evidence of significant variation between schools in promoting young children‟s attainment (see also Section 3) which makes the study of primary school effects on educational outcomes that EPPE 3-11 is presenting extremely relevant. The results indicate that around 16 to 17 per cent of the variation in progress is accounted for by the primary school attended. These findings are in line with other reported studies of primary school effects (see Mortimore et al., 1988; MacBeath & Mortimore, 2001) Table 5.1: Multilevel model estimates of prior attainment measures on Year 6 attainment in standardised English and Mathematics outcomes.
English (Year 6) standardised score
Mathematics (Year 6) standardised score
Estimate (se) Estimate (se)
Intercept 23.12*** (1.50) 27.01*** (1.55)
English (Year 2) standardised score 0.77*** (0.015) Not tested
Mathematics (Year 2) standardised score Not tested 0.73*** (0.015)
*** p <0.001 Table 5.1 shows estimates for the influence of cognitive attainments at the end of Year 2 measured by National Assessments for English and Mathematics at the end of Year 6. Prior
57
attainment in English was considered to be relevant for later attainment in English, with a correlation between the two of 0.77, and prior attainment in Mathematics to be relevant for later attainment in Mathematics, with a correlation of 0.73.
The Impact of Child, Family and Home Learning Environment (HLE) characteristics After the simple value added analyses, further analyses were undertaken to explore whether the child, family and HLE characteristics, found to be significant factors for cognitive attainment differences at the end of Year 6 were also associated with differential academic progress between Year 2 and Year 6 of primary school education (see Figure 5.1 for an illustration). It should be stressed that when working with standardised assessment measures, progress can only be explored relative to the sample and not in absolute terms (also see Appendix 2).
Figure 5.1: Strategy of statistical analysis of the impact of prior attainment
The findings indicate girls make greater progress in English than boys (ES 0.23) and that children who have highly qualified mothers (ES=0.50 for mothers with degree compared to no qualification) and who had a good HLE in their early years (ES=0.30 for highest HLE category compared to lowest HLE category), made significantly better progress in English. On the other hand children whose parents reported two or more early developmental problems in the pre-school period (ES =0.37 compared to no developmental problems), children who grow up in low SES families (ES=0.29 for „professional non-manual‟ compared to „unemployed/ not working‟) made significantly less progress between their second and sixth year of primary school education. Interestingly children who had low levels of home computing (ES=0.23), did home computing moderately but not very often, showed higher progress in English than children who had the highest levels of home computing (ES= > 0.01). Furthermore, at least some of the Bangladeshi pupils have made better progress in English compared to white UK heritage pupils (ES=0.51). For Mathematics the results show that boys (ES=0.13), Indian (ES =0.45), Pakistani (ES =0.31) and Bangladeshi children (ES =0.49) and children of higher qualified mothers (ES=0.49 for mothers with degree compared to no qualification) make greater gains in terms of progress over
Child
Factors
Family
Factors
Home
Learning
Environment
READING
MATHEMATICS
Attainment at
Age 6
ENGLISH ENGLISH
58
this period of primary school education. Lower, but not the lowest SES is related to relatively less progress (ES=0.22) for „professional non-manual‟ compared to „skilled non-manual‟). Interestingly children who still need EAL support in Year 6 (ES =0.38) made significantly less progress in Mathematics. This result supports the conclusion that adequate language skills are not only important for gains in language related subjects but also for progress in Mathematics. Again, children who had a very good Early years HLE also show better progress (ES=0.30), the association being as strong as it is for English. Note that effect sizes in brackets were only given for selected, most representative categories of predictor variables. Tables showing the exact estimates of the reported results and effect sizes for all the categories of the predictors can be found in Appendix 7. Additionally the three neighbourhood variables that appeared in Section 2: “Neighbourhood „influence‟” were incorporated into the progress models for both English and Mathematics, however they were not significant. Taken together the results reflect what has also been found by comparing differential effects of background factors on attainment in Year 6 and Year 2 (see Section 2). This implies the background factors have a similar relation to the pupil‟s performance whether in terms of attainment or progress.
The Impact of Pre- and Primary School Experience In addition we sought to establish whether any characteristics of pre- or primary school experience were not only predictors of academic attainment in Year 6 but also of relative academic progress between Year 2 and Year 6. There was clear evidence that attending a pre-school (irrespective of quality or effectiveness) was associated with better attainment in English and Mathematics during primary school, however, this did not translate into a predictor of better progress in either subject. Nevertheless there is evidence of the importance of pre-school quality for progress. For English, children who went to high quality pre-schools made greater progress (between Year 2 and Year 6) than children who did not go to pre-school (ES= 0.23) (Figure 5.2). Figure 5.2: Net Effect of Pre-School Quality (Pre-Reading) on Pupil’s Academic Progress in English Across Key Stage 2 (Years 2 – 6)
0.05
0.23
0.15
0.0
0.1
0.1
0.2
0.2
0.3
0.3
0.4
Low Quality Medium quality High quality
Net Effect of Pre-School Quality (Pre-Reading)
on Pupil's Academic Progress in English
Across Key Stage 2 (Years 2 - 6)
Eff
ect
Siz
e
Pre-School Effectiveness
Reference Group:
'Home' Children
59
In addition, when compared to children who had attended very low effective pre-schools we found that children who went to highly effective pre-schools made significantly better progress in English (ES=0.18), these findings are presented in Appendix 7: Table A.7.5.a. The effect of pre-school quality for progress in Mathematics was similar to that of English: it is only when compared to children who did not go to pre-school, that children who attended a high quality pre-school show greater progress (ES=0.20). Figure 5.3: Net Effect of Pre-School Quality (Early Number) on Pupil’s Academic Progress in Mathematics across Key Stage 2 (Years 2–6)
0.05
0.20
0.16
0.0
0.1
0.1
0.2
0.2
0.3
0.3
0.4
Low Quality Medium quality High quality
Net Effect of Pre-School Quality (Early Number)
on Pupil's Academic Progress in Mathematics Across Key Stage 2
(Years 2 - 6)
Eff
ect
Siz
e
Pre-School Effectiveness
Reference Group:
'Home' Children
Taken together better quality pre-school centre experience seems to provide children with a better start to primary school, and increased academic progress once they start primary school particularly in the case of English (see Sammons et al., 2004b; 2004c). Figure 5.4: Net Effect of Pre-School Effectiveness on Pupil’s Academic Progress in English across Key Stage 2 (Years 2–6)
0.22
0.28
0.10
0.0
0.1
0.1
0.2
0.2
0.3
0.3
0.4
Low effective Medium effective High effective
Net Effect of Pre-School Effectiveness
on Pupil's Academic Progress in English Across Key Stage 2
(Years 2 - 6)
Eff
ec
t S
ize
Pre-School Effectiveness
Reference Group:
'Home' Children
60
The effect of pre-school effectiveness on English was only statistically significantly in the case of those who attended high academically effective pre-schools, compared to „home‟ children (ES=0.28) (Figure 5.4). The effect of pre-school effectiveness on Mathematics was most evident in the case of those who attended high academically effective pre-schools, compared to „home‟ children (ES=0.22) (Figure 5.5).
Figure 5.5: Net Effect of Pre-School Effectiveness on Pupil’s Academic Progress in English across Key Stage 2 (Years 2–6)
0.14
0.22
0.13
0.0
0.1
0.1
0.2
0.2
0.3
0.3
0.4
Low effective Medium effective High effective
Net Effect of Pre-School Effectiveness
on Pupil's Academic Progress in Mathematics Across Key Stage 2
(Years 2 - 6)
on Mathematics at Age 11
Eff
ect
Siz
e
Pre-School Effectiveness
Reference Group:
'Home' Children
The last step of the analyses was to investigate the impact of primary school academic effectiveness on the progress of the EPPE 3-11 children using independently derived measures of academic effectiveness (see Melhuish et al., 2006a; 2006b). These measures have already been shown to be significant predictors of children‟s cognitive attainment at Year 6 (see Section 3). The findings of the contextualised value added analyses also show that they are important indicators of children‟s relative progress (see Table 5.2). Effects for the high versus low groups are stronger for Mathematics (ES=0.52) than for English (ES=0.37), echoing the results found for attainment in Year 6 without controlling for prior attainments. That is, Mathematics progress shows a greater response to the academic effectiveness of the school than does progress in English. Even attending a medium effectiveness primary school can significantly enhance a pupil‟s progress in Mathematics (ES=0.17), whereas this is weaker for English (ES=0.13) and just fails to reach significance; furthermore, the resultant effect size from attending a high effective school is greater for Mathematics than English.
61
Table 5.2: Multilevel model estimates of primary school effectiveness measures on Year 6 attainment in standardised English and Mathematics outcomes controlling for prior attainments in Year 2 and background factors
Estimate SE Effect Size
English (Year 6) standardised score
Low-Medium effective primary school (English) 0.75 0.86 0.08
Medium-High effective primary school (English) 1.22 0.72 0.13
High effective primary school (English) 3.41** 1.01 0.37
Reference Group: Low effective primary school (English)
Mathematics (Year 6) standardised score
Low-Medium effective primary school (Mathematics) 0.91 0.88 0.10
Medium effective primary school (Mathematics) 1.58* 0.74 0.17
High effective primary school (Mathematics) 4.91* 1.05 0.52
Reference Group: Low effective primary school (Mathematics)
* p< 0.05, ** p <0.01
Once again the results highlight the relevance of the academic effectiveness of the individual primary school a child attends in promoting better cognitive outcomes at Year 6, especially for Mathematics progress.
62
Section 6: Summary and Conclusions
The Impact of Child, Family and HLE characteristics The child, family and HLE measures featured in this research were constructed from self-report information gathered from an in depth interview with parents of EPPE 3-11 children on their child‟s entry to the study, and from a further questionnaire completed during Key Stage 1. These measures feature in Section 1 where average „raw‟ differences in Year 6 attainment in English and Mathematics for different sub-groups of pupils, (defined by gender, ethnic group, family SES, language etc.), are reported. This allows the identification of those groups of children for whom the attainment gap in English and Mathematics has widened or reduced during Key Stage 2 and the factors most strongly associated with enhanced or diminished progress. The child, family and HLE measures also provide the context for the multilevel modelling reported in which occupies Section 2: this approach allows individual influences to be separated from one another and to measure the extent of their impact on children‟s attainment at the end of Key Stage 2 – identifying their unique net contribution.
The analysis indicated that there are clear gender differences at the end of Year 6: girls show greater attainment and progress in English than boys; and boys show greater attainment and progress in Mathematics. These differences were evident in Year 2 for English attainment, but in terms of Mathematics boys are now doing significantly better than they were at earlier ages. Taken together the markers of disadvantage, such as SES birth weight etc. show the more disadvantaged pupils having lower attainment, and no evidence of any disadvantaged group making greater progress in either English or Mathematics, despite starting from a lower level of attainment.
Ethnicity though is not a marker of disadvantage and for at least some groups there is clear evidence of minority ethnic children making greater progress, compared to those of white UK heritage, particularly for Indians in Mathematics and at least some of the Bangladeshi / Pakistani sample in English.
The level of the children‟s Early years HLE remains a significant and strong predictor of academic attainment and progress in both English and Mathematics – higher levels predicting both higher attainment and also enhanced progress, however, it‟s predictive power is somewhat attenuated compared that of Year 2. When prior attainment is considered only those with the highest levels of Early years HLE make significantly greater progress, when compared to those with the lowest, although this is the case for both English and Mathematics. The analysis of children‟s HLE during Key Stage 1 indicates that too great a time spent involved with computer activities compared to a low exposure can negatively impact on English attainment – presumably because at a certain level it displaces or replaces reading and homework to a deleterious extent. Furthermore, moderate parent-child interaction predicts higher outcomes than higher levels in both English and Mathematics – again this might indicate a displacement of relevant cognitive orientated activity, but in this case with the parent substituting themselves for the child (reading to rather than hearing a child read, or encouraging their independent reading) and in this way perhaps reducing the child‟s learning opportunities. The level of parental qualification, particularly the mother‟s, remains, by Year 6, one of the strongest predictors of academic attainment and progress. The greater the level of qualification the greater the likelihood the parents will have the resources to supplement their child‟s education at home, and, perhaps, level of qualification indicates the value placed on educational attainment in general and their own children‟s in particular.
63
Generally the impact of background factors on attainment and progress in Year 6 is somewhat reduced when compared to Year 2: this is likely to indicate the increase influence of schools, peer groups, and neighbourhood environment as children grow older.
Educational Influences EPPE 3-11 is this first large scale longitudinal study to investigate specific pre-school and primary school influences on children‟s academic attainment and progress. There is evidence of a clear advantage, in the case of both English and Mathematics, to be gained from attending any kind of pre-school; children who attended a pre-school still had higher Year 6 attainment than those that didn‟t when controlling background characteristics, although this does not translate into greater progress across Key Stage 2 in either subject. Evidence of greater progress is only consistently found between „home‟ children and those children who attended pre-schools with higher levels of quality or effectiveness. More pointedly, when compared to the attainment of pupils in Year 6 who attended a low quality pre-school, attending a high quality pre-school was associated with higher attainment for English in Year 6; and attending a high or even a medium quality pre-school was associated with higher attainment in Mathematics. This pattern of results was not found for pre-school effectiveness: no significant advantage was found to be associated with attending a medium or high academically effective pre-school, compared to a low effective pre-school for either English or Mathematics. Any advantage associated with greater levels of effectiveness were only apparent when comparison was made to those who did not attend pre-school at all. Children with high HLE tended to be insulated from any deleterious effects of low quality or low academically effective pre-schools, at least for English. For Mathematics the quality and academic effectiveness of the pre-school had a more profound effect regardless of the level of Early years HLE, although the greatest levels of attainment were associated with pupils who had high Early years HLE and attended high quality/ academically effective pre-schools. However for children with a low Early years HLE experience there is clear evidence of an overall benefit from pre-school and especially benefits from higher quality pre-school. Considering the at risk group in terms of the more disadvantaged children we find that attending any pre-school as opposed to none had a positive benefit for both English and Mathematics results in Year 6. Yet in terms of pre-school quality and/or effectiveness it is less disadvantaged children that gain significant benefit from attending high quality and/or high academic effective pre-schools by Year 6; it is only in the case of Mathematics that attending high quality/high academically effective pre-schools have a notable positive benefit for the most disadvantaged children. In interpreting this it should be noted that the effect sizes do not suggest a bigger effect for the disadvantaged. However, because this group is most at risk the findings on the benefit of pre-school can be viewed as more important for this group in terms of attempts to combat disadvantage and improve outcomes. The impact of primary school academic effectiveness was apparent however; compared to attending low effective primary schools there was significant advantage for both attainment and progress in English associated with attending a high academically effective school. In addition, there was a significant advantage for both attainment and progress in Mathematics associated with attending either a high or medium academically effective school. This pattern was repeated when dividing the sample by level of multiple disadvantage: highly disadvantaged pupils show significantly greater attainment in English only if they attend high academically effective primary
64
schools, when compared to low academically effective primary schools. However, in the case of Mathematics, they show significantly greater attainment if they attend medium or high academically effective primary schools when compared to low academically effective primary schools. Generally then, in terms of educational effects, attainment in Mathematics is more sensitive to school influences, both pre-school and primary school, than attainment in English. It may be that there is greater variation between schools in the success in teaching Mathematics and this accounts for the stronger findings on the impact of attending an academically effective primary school in mathematics. Further study of Ofsted inspection data might throw light on this possible explanation. It is also the case that children who change schools during Key Stage 2 show poorer progress in Mathematics by the end of Key Stage 2 than non-mobile pupils; however this mobility may be a response to poorer attainment and poorer social/behavioural development, which they also show, that a source of it (Effective Pre-school and Primary Education 3-11 (EPPE 3-11) Team,2008). The introduction of the Index of Multiple Deprivation (IMD) and the neighbourhood environment measure, was not associated with anything but a fractional effect size, in either the attainment or progress models. In both cases the models contain details of parental qualification levels, family SES and HLE. These offer a more child specific measure of deprivation and elements of the home environment directly relevant to educational outcomes, than that provided by the IMD. Indeed, the HLE incorporates an element of contact with an extra home environment (visits to library). It is probable that without such child specific measures the IMD functions as a proxy. These issues are considered in Hunt et al. (forthcoming) where it is suggested that intra-family differences mediate neighbourhood effects: without being identical both family characteristics and neighbourhood characteristics can co-vary; when examined together family characteristics tend to supersede or displace the neighbourhood measure but without one being reducible to the other. However, such neighbourhood effect measures tend to become more apparent when family characteristics are compressed into a single measure (Hunt et al., forthcoming). The neighbourhood measure that did prove significant, neighbourhood safety, has a modest effect size, and stands as a measure of parental response to the neighbourhood, or perception of it, rather than a direct measure of neighbourhood characteristics, unlike the IMD. Its effect is probably due to it being a particular rendering of social advantage, those children whose parents estimated the neighbourhood as least safe had the poorest attainment levels in Mathematics, rather than it indicating the degree to which the neighbourhood has influenced the individual. Incorporating pre-school and school measures in the contextualised analysis allowed the research to address the further related questions of whether attending a high academically effective primary school could compensate for any negative academic consequences of not attending pre-school, or attending a low academically effective pre-school; and, secondly, whether having attended a high academically effective pre-school insulates the pupil against any academically deleterious effects of attending a less effective primary school (see Section 4). For Mathematics (but not English), pupils who attended a medium or high academically effective pre-school but a low academically effective primary school did significantly better than pupils who did not attend a pre-school and then went on to attend a low effective primary school. Pupils having attended a low academically effective pre-school but a medium or high academically effective primary school had significantly higher attainment by the end of Key Stage 2 in Mathematics compared to those pupils who had not attended any pre-school and subsequently attending a low academically effective primary school. There is then clear evidence of the importance of the effectiveness of the primary school in terms of pupils‟ overall attainment and progress in Key Stage 2, particularly for Mathematics.
65
Table 6.1: Summary of background factors and pre- and primary school influences on cognitive attainment at Year 6 (Only the largest effect sizes are reported; comparison group in brackets)
*The reference group for all pre-school quality and effectiveness comparisons is the ‟home‟ group. The effect sizes represent differences between the ‟home‟ group and the „high quality/effectiveness‟ group unless stated otherwise. **The effect sizes represent differences between the „home‟ group and the „low quality/effectiveness‟ group. *** The reference group for primary school is „low effectiveness‟. The effect sizes represent differences between the „low effectiveness‟ group and the „high effectiveness‟ group.
Factors English Mathematics
Child Factors
Gender (boys) 0.29 -0.19
Ethnicity (White UK heritage) 0.17 0.45
Early Developmental problems (none) -0.23 -0.15
Need of EAL support (none) -0.59 -0.64
Birth weight (normal) -0.47 -0.48
Family factors
Free school meals (FSM) (non-FSM) -0.23 -0.15
Family earned income (none) 0.26 0.25
Mother’s qualification level (none) 0.23 0.71
Father’s Qualification level (none) 0.39 0.34
Family SES (professional non-manual) -0.26 -0.36
Home Learning Environment
Early years HLE (low) 0.69 0.42
Key Stage 1 HLE (low) 0.18 0.17
Pre-school*
Attending (not attending) 0.22 0.26
Pre-school quality*
ECERS-E 0.29 0.34
ECERS-R
Pre-school effectiveness*
Early number concepts 0.40
Pre-reading 0.25
Primary School Effectiveness***
English 0.24
Mathematics 0.38
66
Implications The EPPE 3-11 research shows the significance of child, family, and HLE background factors as predictors of children‟s academic attainment and progress, and the way such influences change over time. This is relevant to the monitoring of equity in education. The research indicates that much of the apparent difference in attainment associated with certain characteristics, for example, ethnicity, is attributable to the impact of other socio-economic and demographic factors (e.g. birth weight, income, language, family SES, parents‟ qualification levels and HLE). Such findings are important in informing thinking on appropriate policy and practical strategies to address any achievement gap and enhance outcomes for disadvantaged or vulnerable groups. The project‟s previous results have contributed to the evidence base for the Government‟s Equalities Review (http://www.theequalitiesreview.org.uk/). The research also examined the combined effects of pre-school and primary school on children‟s educational outcomes. The results indicate the importance of raising the quality and effectiveness of both to raise attainment standards in Maths and English; this may be especially helpful for disadvantaged groups of pupils who are at risk of under achievement (especially those who experienced low Early years HLE). The more advantaged children show greatest benefit from high quality and highly effective pre-schools, however, the results also suggest that for more disadvantaged children, high quality and high effectiveness of the pre-school are important in obtaining long lasting benefits in terms of improved English and Mathematics outcomes. For less disadvantaged groups pre-school generally shows a more positive effect, irrespective of quality. The research also indicates the strength of the influence of Early years HLE, which is found to be one of the strongest predictors of higher attainment especially in English in Year 6. The interactions between the quality of the pre-school and Early years HLE indicating that Early years HLE is likely to moderate the influence of pre-school. Again this points to the important role of parents and other carers in providing rich home learning experiences during the sensitive pre-school period of young children‟s development. The findings also indicate that parents‟ qualification levels are important influences, more so than other measures such as income or SES. While educational influences such as better pre-school experience (quality and effectiveness) and primary school academic effectiveness can help boost children‟s overall attainment and progress especially in Mathematics, they can only ameliorate the impact of disadvantage but do not remove this. Nonetheless, there is evidence that their combined effects can be strong and on a par with some other important background factors such as mother‟s being highly qualified (degree standard or above) or high levels of Early years HLE.
We can conclude that no one factor is the key to raising achievement: it is the combination of experiences over time that matters. The child who has a better HLE, goes to a high quality, more effective pre-school setting and who then subsequently attends a more academically effective primary school has an optimum combination of influences that are likely to benefit current and future educational attainment.
Identification of the importance of combinations of influences is also apparent in the parallel research concerning the same samples social/behavioural development (Sammons et al.,2008). In terms of social/behavioural development pre-school quality in combination with, primary school effectiveness showed a significant impact on „Self-regulation‟. Children who attended a low or even medium effective primary school previously having attended a high quality pre-school provided a protective factor in terms of having higher levels of „Self-
regulation‟ at the end of Key Stage 2. Similarly, attending a high effectiveness primary school was found to benefit, in terms of higher levels of „Self-regulation‟ in Year 6, those children who either did not attend any pre-school or those who attended a low quality pre-school. The combination of high Early years HLE and attending medium or high quality pre-school seem to have a strong association with higher Self-regulation levels at the end of Key Stage 2. Also, high Early years HLE seem to be a protective factor for children who do not attend pre-school helping them achieve higher levels of „Self-regulation‟ in primary school. Similarly, attending high quality pre-school seem to protect against low Early years HLE and therefore helping children achieve higher levels of „Self-regulation‟.
The implication of these findings is that policy development should seek to promote strategies to support improvements in Early years HLE especially for vulnerable groups and also work to improve the quality and effectiveness of pre-school provision. Pre-schools are well placed to identify children who may need extra support and could be guided to work with parents to improve the HLE. The improvement of provision in poorer quality pre-schools also needs to be given a high priority, since poor quality provision does not appear to offer long term benefits in terms of better child attainments at the end of Year 6, even though any pre-school experience was found to benefit children in a wide range of skills and social behaviours at younger ages when they started primary school, and in their first year of primary school (see Sammons et al., 2002; 2003; 2004b; 2004c; 2007a; 2007b for equivalent results at age 5, 6, 7 and 10 years).
The research also indicates that the primary school attended has important consequences. Improving the academic effectiveness of primary schools is likely to be of benefit for disadvantaged groups of pupils, since we find that attending a more academically effective primary school is more critical for this group. The finding that social/behavioural development as well as English and Mathematics attainment is boosted by academically effective primary schools has important implications for the achievement of the Every Child Matters agenda; this shows that the promotion of better academic outcomes does not compete with the development of better social/behavioural development (a point discussed further in the Report to the Equalities Review, EPPE 3-11 Team., 2007). The finding that primary school academic effectiveness is a more significant influence for disadvantaged pupils (especially those who did not go to pre-school) is of particular importance to the achievement of the social inclusion as well as the raising standards agendas.
In order to help reduce the achievement gap for the most disadvantaged groups, concerted and complementary actions to strengthen the Early years HLE, and ensure good quality pre-school and primary school experiences, since improvements to any one in isolation would be insufficient to enhance outcomes. In addition, targeted interventions for children who are well behind their peers in cognitive or social/behavioural development at the start of primary school are likely to be needed to help prevent a widening of the attainment gap during Key Stage 1 and 2. Those children in need of EAL support show significantly poorer results especially in Mathematics, so ways to support Mathematics teaching for such children require further attention.
68
References Coe, R. (2002), 'What is an effect size?' Journal of the Economic & Social Research Council Teaching and Learning Programme Research Capacity Building Network, (4), 6-8. Effective Pre-school and Primary Education 3-11 (EPPE 3-11) Team. (2007), Promoting Equality in the Early Years: Report to The Equalities Review. London: http://www.equalitiesreview.org.uk. Effective Pre-school and Primary Education 3-11 (EPPE 3-11) Team. (forthcoming) Tracking Pupil Mobility over the Pre-school and Primary school Period: Evidence from EPPE 3-11. Elliot, C., with Smith, P. and McCulloch, K. (1996), British Ability Scales Second Edition (BAS II). Windsor: NFER-Nelson Publishing Company Limited. Elliot, K. and Sammons, P. (2004), 'Exploring the use of effect sizes to evaluate the impact of different influences on child outcomes: possibilities and limitations, Chapter 2 '. In K. Elliot and I. Schagen (eds), What Does it Mean? The Use of Effect Sizes in Educational Research (pp. 6-24). Slough: NFER. Glass, G. V., McGaw, B. and Smith, M. L. (1981), Meta-Analysis in Social Research. London: Sage. Harker, H. (2001), The Effects of Student Composition on School Outcomes. Paper presented at the British Educational Research Association Conference, Leeds. Harms, T., Clifford, R. M. and Cryer, D. (1998), Early Childhood Environmental Rating Scale, Revised Edition (ECERS-R). New York: Teachers College Press. Hunt, S. A. Melhuish, E. Sammons, P. Silva, K. Siraj-Blatchford, I. and Taggart, B. (forthcoming) Effect of Neighbourhood Environment on Cognitive Performance Measures: Data from the EPPE 3-11 Sample.
Hurry, J. & Sylva, K. (2007). Long term outcomes of reading interventions. Journal of Research in Reading, 30, (2), 1-22.
MacBeath, J. and Mortimore, P. (eds) (2001), Improving School Effectiveness. Buckingham: Open University Press. Machin, S., Telhaj, S. and Wilson, J. (2006), The Mobility of English School Children. London: Centre for the Economics of Education, London School of Economics. Melhuish, E., Romaniuk, H., Sammons, P., Sylva, K., Siraj-Blatchford, I. and Taggart, B. (2006a), Effective Pre-school and Primary Education 3-11 Project (EPPE 3-11): The Effectiveness of Primary Schools in England in Key Stage 2 for 2002, 2003 and 2004. Full Report. London: Institute of Education, University of London. http://www.ioe.ac.uk/schools/ecpe/eppe/eppe3-11/eppe3-11pubs.htm Melhuish, E., Romaniuk, H., Sammons, P., Sylva, K., Siraj-Blatchford, I. and Taggart, B. (2006b), Effective Pre-school and Primary Education 3-11 (EPPE 3-11): The Effectiveness of Primary Schools in England in Key Stage 2 for 2002, 2003 and 2004, Research Brief No. RBX06-06. Nottingham: DFES Publications. Melhuish, E., Sylva, K., Sammons, P., Siraj-Blatchford, I., Taggart, B. and Phan, M. (2008a), 'Effects of the Home Learning Environment and preschool center experience upon literacy and numeracy development in early primary school'. Journal of Social Issues, 64 157-188.
Melhuish, E., Sylva, K., Sammons, P., Taggart, B., Siraj-Blatchford, I., Hunt, S., Barreau, S. and Welcomme, W. (2008b), Tracking Pupil Mobility over the Pre-school and Primary School Period: Evidence from EPPE 3-11. London: Institute of Education, University of London. Mortimore, P., Sammons, P., Stoll, L., Lewis, D. and Ecob, R. (1988), School Matters: The Junior Years. Wells: Open Books. Mortimore, P. (1998), The Road to Improvement: Reflections on School Effectiveness. Lisse: Swets & Zeitlinger. Office of Population Censuses and Surveys. (1995), Classification of occupations and coding index. London: HMSO. Sammons, P., Kysel, F. and Mortimore, P. (1983), 'Educational Priority Indices: A New Perspective'. British Educational Research Journal, 9 (1), 27-40. Sammons, P., Nuttall, D. and Cuttance, P. (1993), 'Differential School Effectiveness: Results from a reanalysis of the Inner London Education Authority's Junior School Project data'. British Educational Research Journal, 19, 381-405. Sammons, P. (1996), 'Complexities in the Judgment of School Effectiveness'. Educational Research & Evaluation, 2 (2), 113-149. Sammons, P., Sylva, K., Melhuish, E. C., Siraj-Blatchford, I., Taggart, B. and Elliot, K. (2002), The Effective Provision of Pre-School Education (EPPE) Project: Technical Paper 8a - Measuring the Impact of Pre-School on Children's Cognitive Progress over the Pre-School Period. London: DFES / Institute of Education, University of London. Sammons, P., Sylva, K., Melhuish, E. C., Siraj-Blatchford, I., Taggart, B. and Elliot, K. (2003), The Effective Provision of Pre-School Education (EPPE) Project: Technical Paper 8b - Measuring the Impact of Pre-School on Children's Social/Behavioural Development over the Pre-School Period. London: DFES / Institute of Education, University of London. Sammons, P., Elliot, K., Sylva, K., Melhuish, T., Siraj-Blatchford, I. and Taggart, B. (2004a), 'The impact of pre-school on young children's cognitive attainments at entry to reception'. British Education Research Journal, 30 (5), 691-712. Sammons, P., Sylva, K., Melhuish, E. C., Siraj-Blatchford, I., Taggart, B., Elliot, K. and Marsh, A. (2004b), The Effective Provision of Pre-School Education (EPPE) Project: Technical Paper 11 - Report on the continuing effects of pre-school education at age 7. London: DFES / Institute of Education, University of London. Sammons, P., Sylva, K., Melhuish, E. C., Siraj-Blatchford, I., Taggart, B., Elliot, K. and Marsh, A. (2004c), The Effective Provision of Pre-School Education (EPPE) Project: Technical Paper 9 - Report on age 6 assessments. London: DFES / Institute of Education, University of London. Sammons, P., Siraj-Blatchford, I., Sylva, K., Melhuish, E., Taggart, B. and Elliot, K. (2005), 'Investigating the Effects of Pre-school Provision: Using mixed methods in the EPPE research'. International Journal of Social Research Methodology, 8 (3), 207-224. Sammons, P., Taggart, B., Sylva, K., Melhuish, E., Siraj-Blatchford, I., Barreau, S. and Manni, L. (2006), Effective Pre-school and Primary Education 3-11 Project (EPPE 3-11): Variations in Teacher and Pupil Behaviours in Year 5 Classrooms and Associations with School Characteristics. Full Report. London: Institute of Education, University of London. http://www.ioe.ac.uk/schools/ecpe/eppe/eppe3-11/eppe3-11pubs.htm
Sammons, P., Sylva, K., Melhuish, E. C., Siraj-Blatchford, I., Taggart, B. and Grabbe, Y. (2007a). Effective Pre-school and Primary Education 3-11 Project (EPPE 3-11): Influences on Children’s Attainment and Progress in Key Stage 2: Cognitive Outcomes in Year 5. Full Report. London: Institute of Education, University of London. http://www.ioe.ac.uk/schools/ecpe/eppe/eppe3-11/eppe3-11pubs.htm Sammons, P., Sylva, K., Melhuish, E., Siraj-Blatchford, I., Taggart, B. and Barreau, S. (2007b), Effective Pre-school and Primary Education 3-11 Project (EPPE 3-11): Influences on Children’s Attainment and Progress in Key Stage 2: Social/behavioural Outcomes in Year 5. Full Report. London: Institute of Education, University of London. http://www.ioe.ac.uk/schools/ecpe/eppe/eppe3-11/eppe3-11pubs.htm Sammons, P., Sylva, K., Melhuish, E., Siraj-Blatchford, I., Taggart, B. and Jelicic, H. (2008), Effective Pre-school and Primary Education 3-11 Project (EPPE 3-11): Influences on Children’s Attainment and Progress at the End of Key Stage 2: Social/behavioural Outcomes in Year 6. DCSF Research Report DCSF-RR049. Nottingham, DCSF Publications. Scheerens, J. and Bosker, R. (1997), The Foundations of Educational Effectiveness. Oxford: Pergamon. Scott, K. and Carran, D. (1989), 'Identification and referral of handicapped infants'. In M. C. Wang, M. C. Reynolds and H. J. Walberg (eds), Handbook of Special Education Research and Practice: Low Incidence Conditions (Vol.3) (pp. 227-241). Oxford, England: Pergamon Press. Siraj-Blatchford, I., Sammons, P., Taggart, B., Sylva, K. and Melhuish, E. (2006), 'Educational Research and Evidence-Based Policy: The Mixed-method Approach of the EPPE Project'. Evaluation of Research in Education, 19 (2), 63-82. Strand, S. and Demie, F. (2006), 'Pupil mobility, attainment and progress in primary school'. British Educational Research Journal, 32 (4), 551-568. Sylva, K., Sammons, P., Melhuish, E. C., Siraj-Blatchford, I. and Taggart, B. (1999), The Effective Provision of Pre-School Education (EPPE) Project: Technical Paper 1 - An Introduction to The Effective Provision of Pre-School Education (EPPE) Project. London: DFEE / Institute of Education, University of London. Sylva, K., Siraj-Blatchford, I. and Taggart, B. (2003), Assessing Quality in the Early Years: Early Childhood Environment Rating Scale Extension (ECERS-E): Four Curricular Subscales. Stoke on Trent, UK and Stirling, USA: Trentham Books. Sylva, K., Melhuish, E., Sammons, P., Siraj-Blatchford, I. and Taggart, B. (2004), The Effective Provision of Pre-School Education (EPPE) Project: Technical Paper 12 - The final report. London: DFES / Institute of Education, University of London. Sylva, K., Siraj-Blatchford, I., Taggart, B., Sammons, P., Melhuish, E., Elliot, K. and Totsika, V. (2006), 'Capturing Quality in Early Childhood Through Environmental Rating Scales'. Early Childhood Research Quarterly, 21, 76-92. Sylva, K., Barreau, S., Melhuish, E., Sammons, P., Siraj-Blatchford, I. and Taggart, B. (2007, April), The Relationship Between the Home Learning Environment and Educational Outcomes at age 7. Paper presented at the American Educational Researchers Association Annual Conference, Chicago, USA. Sylva K, Scott S, Totsika V, Ereky-Stevens K and Crook C (2008) Teaching parents to help their children read: a randomized controlled trial. British Journal of Educational Psychology
Teddlie, C. and Reynolds, D. (2000), The International Handbook of School Effectiveness Research. London: Routeledge Falmer. The English Indices of Deprivation 2004: Summary (revised), (2007) http://www.ccsr.ac.uk/sars/2001/indiv-cams/codebook/odpmimd.pdf. The Equalities Review. (2006), The Equalities Review: Interim Report for Consultation. http://www.theequalitiesreview.org.uk/ Tymms, P., Merrell, C. and Henderson, B. (1997), 'The First Year at School: A Quantitative Investigation of the Attainment and Progress of Pupils'. Educational Research and Evaluation, 3 (2), 101-118.
Appendix 1: EPPE Technical Papers in the series Technical Paper 1 - An Introduction to the Effective Provision of Pre-school Education (EPPE) Project ISBN: 085473 591 7 Published: Autumn 1999 Price £8.50
Technical Paper 2 - Characteristics of the Effective Provision of Pre-School Education (EPPE) Project sample at entry to the study ISBN: 085473 592 5 Published: Autumn 1999 Price £4.00
Technical Paper 3 - Contextualising EPPE: Interviews with Local Authority co-ordinators and centre managers ISBN: 085473 593 3 Published: Autumn 1999 Price £3.50
Technical Paper 4 - Parent, family and child characteristics in relation to type of pre-school and socio-economic differences. ISBN: 085473 594 1 Published: Autumn 1999 Price £4.00
Technical Paper 5 – Characteristics of the Centre in the EPPE Study: (Interviews) ISBN: 085473 595 X Published: Autumn 2000 Price £5.00
Technical Paper 6 - Characteristics of the Centres in the EPPE Sample: Observational Profiles ISBN: 085473 596 8 Published: Autumn 1999 Price £8.50
Technical Paper 6A - Characteristics of Pre-School Environments ISBN: 085473 597 6 Published: Autumn 1999 Price £8.50
Technical Paper 7 - Social/behavioural and cognitive development at 3-4 years in relation to family background ISBN: 085473 598 4 Published: Spring 2001 Price £5.00
Technical Paper 8a – Measuring the Impact of Pre-School on Children‟s Cognitive Progress over the Pre-School Period. ISBN: 085473 599 2 Published: Autumn 2002 Price £8.50
Technical Paper 8b – Measuring the Impact of Pre-School on Children‟s Social/behavioural Development over the Pre-School Period. ISBN: 085473 683 2 Published: March 2003 Price £8.50
Technical Paper 9 - Report on age 6 assessment ISBN: 085473 600 X Published: November 2004 Price £5.50
Technical Paper 10 - Intensive study of selected centres ISBN: 085473 601 8 Published: Autumn 2003 Price £11.00
Technical Paper 11 - Report on the continuing effects of pre-school education at age 7 ISBN: 085473 602 6 Published: November 2004 Price £5.50
Technical Paper 12 - The final report: Effective Pre-school Education ISBN: 085473 603 4 Published: November 2004 Price £5.50
Effective Pre-school and Primary Education 3-11 Project (EPPE 3-11): The Effectiveness of Primary Schools in England in Key Stage 2 for 2002, 2003 and 2004. Full Report. London: Institute of Education, University of London. http://www.ioe.ac.uk/schools/ecpe/eppe/eppe3-11/eppe3-11pubs.htm Published: 2006
Effective Pre-school and Primary Education 3-11 (EPPE 3-11): The Effectiveness of Primary Schools in England in Key Stage 2 for 2002, 2003 and 2004, Research Brief No. RBX06-06. Nottingham: DFES Publications. Published: 2006
Effective Pre-school and Primary Education 3-11 Project (EPPE 3-11): Influences on Children’s Attainment and Progress in Key Stage 2: Cognitive Outcomes in Year 5. Full Report. London: Institute of Education, University of London. http://www.ioe.ac.uk/schools/ecpe/eppe/eppe3-11/eppe3-11pubs.htm Published: 2007
Effective Pre-school and Primary Education 3-11 Project (EPPE 3-11) Summary Report: Influences on Children‟s Attainment and Progress in Key Stage 2: Cognitive Outcomes in Year 5. Research Report No. RR828. Nottingham: DFES Publications. Published: 2007
Effective Pre-school and Primary Education 3-11 Project (EPPE 3-11): Variations in Teacher and Pupil Behaviours in Year 5 Classrooms and Associations with School Characteristics. Full Report. London: Institute of Education, University of London. http://www.ioe.ac.uk/schools/ecpe/eppe/eppe3-11/eppe3-11pubs.htm Published: 2006
Effective Pre-school and Primary Education 3-11 (EPPE 3-11) Summary Report: Variations in Teacher and Pupil Behaviours in Year 5 Classes. Research Report No. 817. Nottingham: DFES Publications. Published: 2006
Effective Pre-school and Primary Education 3-11 (EPPE 3-11): Variations in Teacher and Pupil Behaviours in Year 5 Classes, Research Brief No. RB817. Nottingham: DFES Publications. Published: 2006
Effective Pre-school and Primary Education 3-11 Project (EPPE 3-11): Influences on Children‟s Attainment and Progress in Key Stage 2: Cognitive Outcomes in Year 5. Full Report. London: Institute of Education, University of London. http://www.ioe.ac.uk/schools/ecpe/eppe/eppe3-11/eppe3-11pubs.htm Published: 2007
Effective Pre-school and Primary Education 3-11 Project (EPPE 3-11): Influences on Children‟s Attainment and Progress in Key Stage 2: Social/behavioural Outcomes in Year 5. Full Report. London: Institute of Education, University of London. http://www.ioe.ac.uk/schools/ecpe/eppe/eppe3-11/eppe3-11pubs.htm Published: 2007
Related Publications
The Early Childhood Environment Rating Scale: Revised Edition (1998). Harms, Clifford and Cryer ISBN: 08077 3751 8 Available from Teachers College Press. Columbia University. 1234 Amsterdam Avenue. New York. NY10027 Assessing Quality in the Early Years, Early Childhood Environment Rating Scale Extension (ECERS-E): Four
Curricular Subscales (2003) Sylva, Siraj-Blatchford and Taggart (2003) Trentham Books ISBN Number: 1 85856 315 1 Price £8.99
Early Years Transition and Special Educational Needs (EYTSEN) Technical Paper 1: Special Educational Needs across the Pre-school Period. ISBN: 085473 680 8 Published; Autumn 2002 Price £8.00
EYTSEN Technical Paper 2: Special Educational Needs in the Early Primary Years: Primary school entry up to the end of Year One. ISBN: 085473 681 6
Published: Summer 2004 Price £8.00
EYTSEN Technical Paper 3: Special Educational Needs: The Parents‟ Perspective ISBN: 085473 682 4 Published: Summer 2004 Price £8.00
Effective Pre-school, Primary and Secondary Education 3-14 Project (EPPSE 3-14): What Makes a Successful Transition from Primary to Secondary School? Research Report No. DCSF-RR019. Nottingham: DFES Publications. Published: 2008
Effective Pre-school, Primary and Secondary Education 3-14 Project (EPPSE 3-14): What Makes a Successful Transition from Primary to Secondary School? Research Brief No. DCSF-RB019. Nottingham: DFES Publications. Published: 2008
Ordering information – For EPPE Publications The Bookshop at the Institute of Education. 20, Bedford Way. London WC1H OAL. Tele: 00 44 (0) 207 612 6050 Fax: 0207 612 6407 e-mail: [email protected], website: www.johnsmith.co.uk/ioe or The EPPE Office. The University of London, Institute of Education. 20 Bedford Way, London. WC1H OAL. U.K. Telephone 00 44 (0) 207 612 6219 / Fax. 00 44 (0) 207 612 6230 / e-mail [email protected]. Please Note: Prices will vary according to size of publication and quantities ordered. Visit the EPPE Website on: http://www.ioe.ac.uk/projects/eppe.
Appendix 2: How accurate are the current measures as indicators of progress in primary education? A.2.1 The measurement of cognitive attainment and the problem of the measurement of
progress In contrast to the situation in the natural sciences where we can often measure the characteristics of objects with objective and accurate measuring instruments on absolute scales, in educational studies we are faced with the problem of the measurement of complex constructs where measuring instruments have to be adjusted over time. Therefore it is easier to measure any physical characteristics like the height and weight of a child over years than to measure English, Mathematics or social/behavioural development over time. To have „good English attainment‟ means something different for a child at age 7 than for a child at age 11, whereas the meaning of „a height of 150 cm‟ remains the same over years. Cognitive ability tests have been constructed that usually consist of a set of tasks or questions that are adjusted (standardised) to the expected attainment of children at a certain age. Obviously the tests cannot be the same at different time points. Children achieve discretionary scores in these tests, which are then transformed into standardised scores which are comparable irrespective of the age. A common standardisation is the use of IQ format scores, where the mean is 100 and the standard deviation is 15. The advantage of the use of these scores is, that they are easy interpretable and comparable. This means that a child who has a score of 115 is one standard deviation above the average in this specific sample at this specific time point whilst taking age effects into account. A child that achieves a score of 85 points is one standard deviation below average. With these standardisation procedures, performance is always measured relative to the norm for the sample. This has some advantages but also some disadvantages at the same time. For example, it is fairer to children who are relatively young for their year (e.g. summer born pupils) but no longer provides a criterion referenced measure of what children have achieved in terms of specific attainment at a particular point in time. It also imposes some problems on the measurement of progress due to the lack of an absolute scale. If you look at standardised test scores of the same child at different time points, you can also only obtain progress relative to the sample. For example, if a child has a score of 100 at age 6 and age 10, this means that this child has made average progress, but not that raw attainment is the same at the two time points. Also, if a child had a score of 100 at age 6 and a score of 90 at age 10 this means, that the progress of the child was relatively less than the average of the sample as a whole, but it does not mean that this child did not make any progress at all. These facts are important to get the right interpretation on standardised cognitive test scores at different time points. A.2.2 Cognitive measures in the EPPE 3-11 study EPPE has collected various cognitive outcomes at different time points which are shown in Table A2. During the pre-school period the British Ability Scales (Elliot, Smith & McCulloch, 1996) in verbal and non-verbal measures have been used. This report focuses on progress of the children in primary school education where English and Mathematics outcomes are available for the EPPE children at the end of Year 1 (age 6), the end of Year 2 (age 7), the end of Year 5 (age 10) and at the end of Year 6 (age 11). At Year 1 and Year 5 teacher administered NFER-Nelson assessments have been used, whereas for the age of 7 and 11 National Assessment data have been collected for the sample.
75
Table A2: Cognitive outcomes in the EPPE study
Pre-School Measures at Entry to the EPPE Study
Exit from Pre-School (Entry to Reception) – Baseline
End of Reception
Year 1
Year 2
Year 5
Year 6
Age
3.0 to 4 years 3 months
rising 5 years
age 5
age 6
age 7
age 10
age 11
Verbal
BAS – Scales: Verbal Comprehension, Naming Vocabulary
BAS – Scales: Verbal Comprehension, Naming Vocabulary
BAS – Scales: Word English
Primary English standardised score (Level 1 / NFER-Nelson)
National Assessments: English, Writing (decimalised)
Primary English standardised score (Level 2/ NFER-Nelson)
National Assessments: English, Writing (decimalised)
Letter Recognition, Phonological Awareness (Pre-Reading)
Letter Recognition, Phonological Awareness, Dictation Tests
Non-Verbal
BAS – Scales: Block building, Picture Similarities
BAS – Scales: Block building, Picture Similarities, Early Number Concepts
A.2.3 National assessment data National assessments are usually reported in levels which are fairly broad and categorise children only into a small number of attainment groups. For example Mathematics 2006 there were the standard 5 groups with the following divisions: N (0-15), 2 (16-18), 3 (19-45), 4 (46-77), 5 (78-100). Level thresholds by academic year and subject were obtained from: http://www.qca.org.uk/qca_9190.aspx Within each level there can be quite a range of attainment. Therefore EPPE collected data on test scores within levels from schools which allowed the creation of more finely differentiated outcome measures (decimalised levels). Decimalisation was carried out in the following manner: Decimal level = level of test + {(raw score - lowest valid raw score for corresponding level) / highest valid raw score possible for the level}
See Sammons et al. (2004b) for further elaboration of the decimalisation procedure. However, there remain a couple of measurement issues with this type of assessment as these scores do not account for age differences (within a school class) and are not normally distributed. EPPE has undertaken standardisation and normalisation procedures to overcome this problem.
76
A.2.4 National Assessment scores: Standardisation procedures, reliability and internal validity
Figure A.2: Cognitive outcomes at Year 6
The EPPE sample (which is not UK representative but relatively underachieving due to slightly higher numbers of disadvantaged children in the sample) the manual standardisation procedure does not account for variation especially found in younger age and under average achieving groups. Therefore it has been decided to apply a complex internal age standardisation and normalisation procedure to the cognitive outcomes in Year 2 and Year 6. This resulted in approximately normally distributed outcomes which do not show a correlation with age. Figure A.2 shows the distribution of the standardised and normalised English and Mathematics scores at Year 6. The mean of the measures is 100 with a standard deviation of 15 (IQ format scores).
0
.01
.02
.03
.04
De
nsity
40 60 80 100 120 140Standardised Reading Score at Age 11
English
Mathematics
C
og
nitiv
e O
utc
om
es a
t Year 6
r = 0.69 0
.01
.02
.03
.04
De
nsity
60 80 100 120 140Standardised Mathematics Score at Age 11
77
Reliability Reliability in the psychometric sense refers to the necessary requirement for a good instrument, that an instrument should measure exactly the same if applied several times on the same subject and should be consistent. Reliability is a necessary pre-condition for validity. However, as there might also be changes over time in the outcome to be measured the concept of retest-reliability hits its borders especially in developmental studies. For English we find a correlation of 0.73 between the assessments of Year 2 and Year 6, for Mathematics the correlation between Year 2 and Year 6 assessments is 0.70. These results lead to two conclusions: 1. Prior cognitive attainments are fairly good predictors of later attainments. 2. We can assume good retest-reliability. Internal validity The attainments in English and Mathematics in Year 2 show a correlation of 0.69 and in Year 6 a correlation of 0.69. These high correlations indicate that children who do well in English are more likely to also show high attainment in Mathematics and vice versa. As both measures are cognitive outcomes, these correlations are also indicators of high internal validity (in the sense of psychometric validity).
78
Appendix 3: EPPE 3-11 imputation of missing data In order to conduct analysis on as large a sample as possible from the EPPE 3-11 data, a select number of variables were subject to „imputation‟ of values where item level data were missing, either due to item or wave non-response. The imputation methods employed as was „last observation carried forward‟. Specifically, the „last observation‟ was data from the initial EPPE parent interview, conducted when the children were in Key Stage 1, aged about three years old or in the case of most „home‟ children four years old. The variables subject to imputation used in the analyses for this report were: Sibling count; Socio-economic status (SES) of mother / father. Such data, where appropriate, was used to complete missing items from the Parent Questionnaire conducted at Key Stage 1, when the children were age 6 to 7 years old. In each case the variables in the source were comparable, in terms of scale or possible item response categories, with those in the target. This was not the case for parents‟ qualifications, and hence as yet this measure has not been subject to such imputation.
79
Appendix 4: Raw differences in attainment in English and Mathematics at the end of Year 6 Table A4.1: Cognitive attainments at the end of Year 6 by Ethnicity
English Mathematics
N Mean SD N Mean SD
White UK Heritage 1964 100.62 15.05 1974 100.75 14.77
White European Heritage 84 97.43 14.25 84 99.20 13.60
Black Caribbean Heritage 107 100.74 13.90 108 98.75 14.74
Black African Heritage 59 99.56 14.53 59 97.47 16.12
Unemployed / Not working 429 94.36 14.02 432 94.83 13.93
Table A4.6: Cognitive attainments at the end of Year 5 by Early years HLE
English Mathematics
N Mean SD N Mean SD
HLE unknown 132 94.79 15.03 133 95.83 14.94
HLE index = 0-13 247 92.58 13.56 246 95.03 14.38
14-19 579 96.62 14.33 585 97.26 14.78
20-24 625 99.31 14.03 629 99.59 14.31
25-32 813 102.51 14.75 815 101.82 14.86
33-45 294 109.73 13.70 293 107.37 14.32
81
Appendix 5: Details of Selected Measures used in the EPPE 3-11
A.5.1: The Multiple Disadvantage Index The Multiple Disadvantage Index was developed as part of the Early Years Transition & Special Educational Needs (EYTSEN) Project which focuses on the identification of children „at risk‟ of SEN). An index was created based on 10 indicators in total: three child variables, six parent variables, and one related to the Early years Home Learning Environment (HLE). All the variables were chosen because they related to low baseline attainment when looked at in isolation. Where indicators were closely related, such as first language and ethnic groups, only the most significant was included. Child variables
First language: English as an additional language (EAL)
Large family: 3 or more siblings
Pre-maturity / low birth weight
Parent variables
Mother‟s highest qualification level: no qualifications
Social class of father‟s occupation: Semi-skilled, unskilled, never worked, absent father
Father not employed
Young Mother (Age 13-17 at birth of EPPE child)
Lone parent
Mother not working / unemployed
Low Early years Home Learning Environment (HLE)
The EPPE Project - Children’s activities at home Does X have?
A regular bedtime Rules about watching TV/videos How often does X watch TV/videos in a typical weekday?
How many days in a typical week has X? Played with friends at home
Does X have friends home to play? Played with friends elsewhere
Does s/he go anywhere else to play? Gone shopping with you Gone on visits to friends or relatives Sat down and eaten a meal with the whole family together
Does anyone at home ever read to X? If yes, how often? Does anyone at home ever take X to the library? How often? Does X ever play with letters or numbers? How often? Does X ever paint and draw at home? How often? Have you ever tried to teach X? ABC/ The Alphabet/ letters? Numbers? How often? Any songs/poems? How often? Can you tell me which? Any nursery rhymes? How often? Can you tell me which?
82
The Effective Provision of Pre-School Education 1997
A.5.2: The Key Stage 1 Home Learning Environment (HLE) HLE Factors and the items loading on these factor:
• Home Computing • The Child plays on computer by themself. • Respondent plays computer games with the child. • Respondent uses computer with the child in educational ways.
• Respondent visits library with the child. • Respondent does sport/physical activity with the child. • Respondent goes on educational visits with the child.
• Parent-child one-to-one interactions at home
• Respondent plays with the child using toys/games/puzzles. • Respondent reads to the child. • Respondent listens to the child read.
• Expressive play
• The Child plays „make believe‟ or pretend games. • The Child paints/draws/makes models. • The Child enjoys dance music and movement.
83
Appendix 6: Results of contextualised multilevel analyses
Table A. 6.1.a: Null and Contextualised model showing primary school and child level variance of Year 6 standardised and normalised scores in English
Null Model
English standardised score
Contextualised
English standardised score
Estimate (standard error28
) Estimate (standard error)
School level variance estimate (se) 31.76 (5.22) 16.59 (3.72)
Table A.6.1.a shows the null model with no explanatory variables included for English, along with the results for the contextualised analysis, including the background characteristics. The intra-school correlation measures the extent to which the scores of children in the same primary school resemble each other as compared with those from children at different schools. The intra-school correlation for English indicates that approximately twelve per cent of the variation of the children‟s scores is related to differences between individual primary schools, while the majority reflects differences between individual children. It should be noted, that approximately sixty per cent of the primary schools had only one EPPE 3-11 child in attendance, the average number of EPPE 3-11 children per school is 2.7 (maximum = 44). The results for the Null model do not account for the impact of pupil intake characteristics; subsequent models include intake control.
28
The standard error provides a measure of the confidence limits associated with each estimate and is used to establish the statistical significance of the results.
84
Table A.6.1.b: English Contextualised Model (impact of child, parent, home environment and other measures on year 6 standardised English attainment) AMENDED TABLE (MARCH 2010)
Comparison Group Experimental Group Coef se z p ES Sig
Age Continuous Variable 0.02 0.07 0.34 0.73 0.00
Gender: Boys Gender: Girls 3.58 0.51 6.96 0.00 0.29 *
* = p < 0.05 Only significant predictors were kept in the model. Age was not a significant predictor for attainment in English, but
improved model fit.
85
Table A.6.2.a: Null and Contextualised model showing primary school and child level variance of Year 6 standardised and normalised scores in Mathematics
Null Model
Mathematics standardised score
Contextualised
Mathematics standardised score
Estimate (standard error29
) Estimate (standard error)
School level variance estimate (se) 26.18 (4.574) 12.07 (3.07)
Table A.6.2.a shows the null model with no explanatory variables included for mathematics along with the results for the contextualised analysis, including the background characteristics. The intra-school correlation measures the extent to which the scores of children in the same primary school resemble each other as compared with those from children at different schools. The intra-school correlation indicates that approximately fourteen per cent of the variation of the children‟s scores is related to differences between individual primary schools, while the majority reflects differences between individual children. It should be noted, that approximately sixty per cent of the primary schools had only one EPPE 3-11 child in attendance, the average number of EPPE 3-11 children per school is 2.7 (maximum = 44). The results for the Null model do not account for the impact of pupil intake characteristics; subsequent models include intake control. The figures in Table A.6.1.a and A.6.2.a indicate that the intra-school correlation for English is somewhat higher than for Mathematics after controlling for background factors. This indicates that almost ten per cent of the unexplained variation in attainment in English is associated with the school attended. For Mathematics we find a somewhat lower intra-school correlation, indicating that about seven per cent of the variance in attainment is associated with the school attended after controlling for background factors. These figures are in line with those in other educational effectiveness studies but are interpreted with caution due to the large number of primary schools with only one EPPE 3-11 child in attendance. However, it must be stressed that these results do not imply that the primary school a child attends does not matter for cognitive attainment (in terms of variance accounted for, individual background factors such as family SES also account for a relatively small percentage and in combination background factors only account for between 19 to 24% of the total variance).
29
The standard error provides a measure of the confidence limits associated with each estimate and is used to establish the statistical significance of the results.
86
Table A.6.2.b: Mathematics Contextualised Model (impact of child, parent, home environment and other measures on year 6 standardised Mathematics attainment) AMENDED TABLE (MARCH 2010)
Comparison Group Experimental Group Coef se z p ES Sig
Age Continuous Variable 0.05 0.08 0.60 0.55 0.00
Gender: Boys Gender: Girls -2.48 0.53 -4.69 0.00 -0.19 *
Need for EAL support: No EAL: Missing -0.93 0.76 -1.22 0.22 -0.07
Need for EAL support : Yes -8.28 1.96 -4.22 0.00 -0.64 *
Development Problems: None
Missing -1.32 3.68 -0.36 0.72 -0.10
At least one -1.93 0.85 -2.27 0.02 -0.15 *
More than one -4.21 2.54 -1.66 0.10 -0.32
Birth weight: Normal
Missing 2.54 2.08 1.22 0.22 0.20
Very low<=1500g -6.24 2.34 -2.67 0.01 -0.48 *
Low 1501-2500g -2.35 1.06 -2.22 0.03 -0.18 *
Ethnicity: U.K. White Heritage
White European heritage -1.20 1.52 -0.79 0.43 -0.09
Black Caribbean heritage 0.48 1.39 0.35 0.73 0.04
Black African heritage -1.08 1.86 -0.58 0.56 -0.08
Any other ethnic minority heritage 0.06 1.65 0.04 0.97 0.00
Indian heritage 5.82 1.91 3.04 0.00 0.45 *
Pakistani heritage 1.28 1.39 0.92 0.36 0.10
Bangladeshi heritage 1.15 2.42 0.47 0.64 0.09
Mixed race heritage -0.82 1.17 -0.70 0.48 -0.06
Income: None
Missing 2.25 1.74 1.30 0.19 0.17
£2,500 - £14,999 0.31 1.24 0.25 0.80 0.02
£17,500 - £29,999 2.47 1.30 1.90 0.06 0.19
£30,000 - £37,499 1.98 1.42 1.39 0.16 0.15
£37,500 - £67,499 2.82 1.38 2.05 0.04 0.22 *
£67,500 - £132,000+ 3.28 1.89 1.74 0.08 0.25
Family Socio Economic Status: Highest
Other professional non manual -1.89 1.11 -1.71 0.09 -0.15
Skilled non manual -2.65 1.25 -2.13 0.03 -0.20 *
Skilled manual -4.61 1.29 -3.56 0.00 -0.36 *
Semi skilled -4.34 1.50 -2.91 0.00 -0.33 *
Unskilled -4.67 2.19 -2.13 0.03 -0.36 *
Unemployed: not working -3.87 1.64 -2.36 0.02 -0.30 *
Missing -3.81 3.00 -1.27 0.20 -0.29
Mother‟s Qualification: None
Missing 1.00 2.21 0.45 0.65 0.08
Vocational 1.97 0.97 2.03 0.04 0.15 *
16 academic 3.04 0.79 3.83 0.00 0.23 *
18 academic 5.05 1.20 4.20 0.00 0.39 *
Degree or equivalent 9.24 1.24 7.43 0.00 0.71 *
Higher degree 9.16 1.92 4.78 0.00 0.71 *
Other professional 7.19 2.34 3.07 0.00 0.55 *
Father‟s Qualification: None
Missing 0.09 0.86 0.11 0.92 0.01
Vocational 1.22 1.05 1.16 0.25 0.09
16 academic 0.79 0.89 0.89 0.37 0.06
18 academic 1.37 1.27 1.08 0.28 0.11
Degree or equivalent 3.61 1.24 2.91 0.00 0.28 *
Higher degree 4.36 1.85 2.36 0.02 0.34 *
Other professional 0.45 2.77 0.16 0.87 0.03
Early Years Home Learning Index: Lowest
Missing 0.35 2.01 0.18 0.86 0.03
14-19 0.64 1.04 0.61 0.54 0.05
20-24 1.43 1.06 1.35 0.18 0.11
25-32 2.38 1.06 2.25 0.02 0.18 *
33-43 5.50 1.28 4.30 0.00 0.42 *
Key Stage 1Home Learning Environment
Interactions: High
Missing -0.88 1.66 -0.53 0.60 -0.07
Low 1.08 1.12 0.97 0.33 0.08
Low - Moderate 1.75 0.97 1.81 0.07 0.14
Moderate-High 2.15 0.92 2.35 0.02 0.17 *
* = p < 0.05 Only significant predictors were kept in the model. Age was not a significant predictor for attainment in English, but improved
model fit.
87
Table A.6.3 English Contextualised Model: Net impact of pre-school attendance
***Statistically significant at 0.01 level
Estimate SE Effect Size
Pre-school (compared to no pre-school)
2.71** 1.04 0.22
Table A.6.4 Mathematics Contextualised Model: Net impact of pre-school attendance **Statistically significant at 0.01 level
Estimate SE Effect Size
Pre-school (compared to no pre-school)
3.35** 1.06 0.26
Table A.6.5 English Contextualised Model: Net impact of pre-school quality measured by ECERS-E *Statistically significant at 0.05 level
Estimate SE Effect Size
Pre-school Quality (compared to Low quality)
No pre-school -1.51 1.24 -0.12
Medium quality 1.17 0.82 0.09
High quality 2.05* 0.94 0.17
Table A.6.6 Mathematics Contextualised Model: Net impact of pre-school quality measured by ECERS-E *Statistically significant at 0.05 level **Statistically significant at 0.01 level
Estimate SE Effect Size
Pre-school Quality (compared to Low Quality)
No pre-school
-1.58
1.25
-0.12
Medium quality 1.82* 0.82 0.14
High quality 2.78** 0.95 0.21
Table A.6.7 English Contextualised Model: Net impact of pre-school effectiveness (Pre-Reading) AMENDED TABLE (MARCH 2010) *Statistically significant at 0.05 level **Statistically significant at 0.01 level
Estimate SE
Effect Size
Pre-school Effectiveness (compared no pre-school)
Low effective 2.35* 1.97 0.20
Medium effective 2.51* 1.08 0.22
High effective 2.66** 1.20 0.25
88
Table A.6.8 English Contextualised Model: Net impact of pre-school effectiveness (Pre-Reading) # statistically significant at 0.05 level
Estimate SE Effect Size
Pre-school Effectiveness (compared to low effective)
No pre-school -2.34* 1.18 -0.19
Medium effective 0.37 0.77 0.03
High effective 0.83 0.91 0.07
Table A.6.9a Mathematics Contextualised Model: Net impact of pre-school effectiveness (Early number concepts) AMENDED TABLE (MARCH 2010) *Statistically significant at 0.05 level ***Statistically significant at 0.001 level
Estimate SE
Effect Size
Pre-school Effectiveness (compared no pre-school)
Low effective 3.28* 2.52 0.24
Medium effective 2.52* 1.07 0.21
High effective 4.52*** 1.2 0.40
Table A.6.9b Mathematics Contextualised Model: Net impact of pre-school effectiveness (Early number concepts) *Statistically significant at 0.05 level
Estimate SE Effect Size
Pre-school Effectiveness (compared to Low effective)
No pre-school -3.28* 1.30 -0.25
Medium effective -0.58 0.90 -0.05
High effective 2.14* 1.07 0.16
Table A.6.10 English Contextualised Model: Net combined impact of Early years HLE and pre-school *Statistically significant at 0.05 level **Statistically significant at 0.01 level ***Statistically significant at 0.001 level
Estimate SE Effect Size
Pre-school and Early years HLE (compared to „no pre-school and low HLE‟)
Early years HLE missing 1.12 2.21 0.09
Medium HLE, no pre-school 3.57 2.14 0.29
High HLE, no pre-school 4.56* 2.13 0.37
Low HLE, pre-school 3.43* 1.49 0.27
Medium HLE, pre-school 4.11** 1.55 0.33
High HLE, pre-school 7.06*** 1.53 0.57
89
Table A.6.11 Mathematics Contextualised Model: Net combined impact of Early years HLE and pre-school *Statistically significant at 0.05 level **Statistically significant at 0.01 level ***Statistically significant at 0.001 level
Estimate SE Effect Size
Pre-school and Early years HLE (compared to „no pre-school and low HLE‟)
Early years HLE missing 2.97 2.27 0.23
Medium HLE, no pre-school 3.20 2.19 0.25
High HLE, no pre-school 3.15 2.20 0.24
Low HLE, pre-school 3.83* 1.52 0.29
Medium HLE, pre-school 4.46** 1.58 0.34
High HLE, pre-school 6.27*** 1.56 0.48
Table A.6.12 English Contextualised Model: Net combined impact of Early years HLE and quality of pre-school *Statistically significant at 0.05 level **Statistically significant at 0.01 level ***Statistically significant at 0.001 level
Estimate SE Effect Size
Pre-school quality and Early years HLE (compared to „no pre-school and low HLE‟)
Early years HLE missing 1.18 2.21 0.09
Medium HLE, no pre-school 3.60 2.14 0.29
High HLE, no pre-school 4.57* 2.13 0.37
Low HLE, low quality pre-school 4.07* 1.86 0.33
Medium HLE, low quality pre-school 3.14 2.02 0.25
High HLE, low quality pre-school 4.62* 1.80 0.37
Low HLE, medium quality pre-school 2.39 1.55 0.19
Medium HLE, medium quality pre-school 4.21** 1.62 0.34
High HLE, medium quality pre-school 7.60*** 1.56 0.61
Low HLE, high quality pre-school 5.41** 1.73 0.44
Medium HLE, high quality pre-school 4.42* 1.81 0.36
High HLE, high quality pre-school 7.27*** 1.71 0.58
90
Table A.6.13 Mathematics Contextualised Model: Net combined impact of Early years HLE and quality of the pre-school *Statistically significant at 0.05 level **Statistically significant at 0.01 level ***Statistically significant at 0.001 level
Estimate SE Effect Size
Pre-school quality and Early years HLE (compared to „low HLE and no pre-school‟)
Early years HLE missing
2.99
2.26
0.23
Medium HLE, no pre-school 3.27 2.19 0.25
High HLE, no pre-school 3.22 2.19 0.25
Low HLE, low quality pre-school 3.71* 1.89 0.29
Medium HLE, low quality pre-school 3.78# 2.05 0.29
High HLE, low quality pre-school 3.54# 1.83 0.27
Low HLE, medium quality pre-school 2.94# 1.58 0.23
Medium HLE, medium quality pre-school 4.69** 1.65 0.36
High HLE, medium quality pre-school 7.06*** 1.60 0.54
Low HLE, high quality pre-school 6.57*** 1.76 0.51
Medium HLE, high quality pre-school 4.91** 1.85 0.38
High HLE, high quality pre-school 6.57*** 1.74 0.51
Table A.6.14 English Contextualised Model: Net combined impact of Early years HLE and effectiveness of pre-school (Pre-Reading) *Statistically significant at 0.05 level **Statistically significant at 0.01 level ***Statistically significant at 0.001 level
Estimate SE Effect Size
Pre-school effectiveness (Pre-Reading) and Early years HLE
(compared to „no pre-school and low HLE‟)
Early years HLE missing
1.15
2.21
0.09
Medium HLE, no pre-school 3.58 2.14 0.29
High HLE, no pre-school 4.55* 2.13 0.36
Low HLE, low effective pre-school 2.94 1.87 0.24
Medium HLE, low effective pre-school 2.71 1.91 0.22
High HLE, low effective pre-school 6.97*** 1.72 0.56
Low HLE, medium effective pre-school 3.48* 1.55 0.28
Medium HLE, medium effective pre-school 4.45** 1.62 0.36
High HLE, medium effective pre-school 7.01*** 1.58 0.56
Low HLE, high effective pre-school 3.79* 1.79 0.30
Medium HLE, high effective pre-school 4.53* 1.90 0.36
High HLE, high effective pre-school 7.31*** 1.73 0.59
91
Table A.6.15 Mathematics Contextualised Model: Net combined impact of Early years HLE and effectiveness of pre-school (Early number concepts) *Statistically significant at 0.05 level **Statistically significant at 0.01 level ***Statistically significant at 0.001 level
Estimate SE Effect Size
Pre-school effectiveness (Early number concepts) and Early years HLE (compared to „no pre-school and low HLE‟)
Early years HLE missing
2.92 2.26 0.22
Medium HLE, no pre-school 3.29 2.19 0.25
High HLE, no pre-school 3.19 2.19 0.25
Low HLE, low effective pre-school 4.02* 2.01 0.31
Medium HLE, low effective pre-school 3.65 2.26 0.28
High HLE, low effective pre-school 6.70*** 1.87 0.52
Low HLE, medium effective pre-school 3.01# 1.56 0.23
Medium HLE, medium effective pre-school 4.58** 1.62 0.35
High HLE, medium effective pre-school 5.60*** 1.59 0.43
Low HLE, high effective pre-school 7.40*** 1.85 0.57
Medium HLE, high effective pre-school 5.21** 1.90 0.40
High HLE, high effective pre-school 8.71*** 1.80 0.67
Table A.6.16 English Contextualised Model: Net impact of primary school effectiveness *Statistically significant at 0.05 level.
Estimate SE Effect Size
Primary School Effectiveness (compared to low effective)
Missing effectiveness score 0.91 1.04 0.07
Medium effective 0.90 0.88 0.07
High effective 3.01* 1.23 0.24 For the majority of children whose primary school effectiveness score is missing, this is due to the fact, that these children attend private primary schools.
Table A.6.17 Mathematics Contextualised Model: Net impact of primary school effectiveness *Statistically significant at 0.05 level, ***Statistically significant at 0.001 level
Estimate SE Effect Size
Primary School Effectiveness (compared to low effective)
Missing effectiveness score
1.49*
1.04
0.12
Medium effective 1.92* 0.85 0.15
High effective 4.93*** 1.23 0.38
For the majority of children whose primary school effectiveness score is missing, this is due to the fact, that these children attend private primary schools.
92
Table A.6.18 English Contextualised Model: Net combined impact of pre-school quality and primary school effectiveness (English)
Estimate SE Effect Size
Pre-school quality and primary school effectiveness (English)
(compared to „no pre-school and low effective primary school‟)
Missing 0.67 2.34 0.05
No pre-school, medium effective primary school -2.00 2.53 -0.16
No pre-school, high effective primary school 2.37 4.50 0.19
Low quality pre-school, low effective primary school -1.41 2.91 -0.11
Low quality pre-school, medium effective primary school -0.14 2.44 -0.01
Low quality pre-school, high effective primary school -3.95 3.81 -0.32
Medium quality pre-school, low effective primary school -0.70 2.44 -0.06
Medium quality pre-school, medium effective primary school 0.53 2.32 0.04
Medium quality pre-school, high effective primary school 3.03 2.55 0.25
High quality pre-school, low effective primary school 1.50 2.78 0.12
High quality pre-school, medium effective primary school 2.46 2.39 0.20
High quality pre-school, high effective primary school 4.71 2.87 0.38
Table A.6.19 Mathematics Contextualised Model: Net combined impact of pre-school quality and primary school effectiveness (Mathematics) *Statistically significant at 0.05 level, **Statistically
significant at 0.01 level, # Just failed to reach statistical significance at 0.05 level
Estimate SE Effect Size
Pre-school quality and primary school effectiveness (Mathematics)
(compared to „no pre-school and low effective primary school‟)
Missing 6.47** 2.10 0.50
No pre-school, medium effective primary school 5.27* 2.32 0.41
No pre-school, high effective primary school 8.77* 4.46 0.68
Low quality pre-school, low effective primary school 3.84 2.63 0.30
Low quality pre-school, medium effective primary school 6.03** 2.21 0.47
Low quality pre-school, high effective primary school 4.79 3.48 0.37
Medium quality pre-school, low effective primary school 5.47* 2.24 0.42
Medium quality pre-school, medium effective primary school 6.54** 2.07 0.50
Medium quality pre-school, high effective primary school 11.66*** 2.33 0.90
High quality pre-school, low effective primary school 7.88** 2.54 0.61
High quality pre-school, medium effective primary school 8.96*** 2.15 0.69
High quality pre-school, high effective primary school 7.75** 2.86 0.60
93
Table A.6.20 English Contextualised Model: Net combined impact of pre-school effectiveness (Pre-Reading) and primary school effectiveness (English)
Estimate SE Effect Size
Pre-school effectiveness (Pre-Reading) and primary school effectiveness (English) (compared to „no pre-school and low effective primary school‟)
Missing 0.67 2.34 0.05
No pre-school, medium effective primary school -1.91 2.53 -0.15
No pre-school, high effective primary school 2.47 4.50 0.20
Low effective pre-school, low effective primary school -0.88 2.66 -0.07
Low effective pre-school, medium effective primary school 0.44 2.42 0.04
Low effective pre-school, high effective primary school 5.38 3.59 0.43
Medium effective pre-school, low effective primary school -1.11 2.49 -0.09
Medium effective pre-school, medium effective primary school 0.87 2.32 0.07
Medium effective pre-school, high effective primary school 2.51 2.57 0.20
High effective pre-school, low effective primary school 2.87 2.85 0.23
High effective pre-school, medium effective primary school 1.69 2.41 0.14
High effective pre-school, high effective primary school 2.67 2.89 0.22
Table A.6.21 Mathematics Contextualised Model: Net combined impact of pre-school effectiveness (early number concepts) and primary school effectiveness (Mathematics) # Just failed to reach statistical significance at 0.05 level
*Statistically significant at 0.05 level, **Statistically significant at 0.01 level, ***Statistically significant at 0.001 level,
Estimate SE Effect Size
Pre-school effectiveness (early number concepts) and primary school effectiveness (Mathematics) (compared to „no pre-school and low effective primary school‟)
Missing 6.37** 2.10 0.49
No pre-school, medium effective primary school 5.26* 2.31 0.41
No pre-school, high effective primary school 8.38# 4.45 0.65
Low effective pre-school, low effective primary school 5.18# 2.82 0.40
Low effective pre-school, medium effective primary school 6.90** 2.26 0.53
Low effective pre-school, high effective primary school 11.68*** 3.03 0.90
Medium effective pre-school, low effective primary school 4.61* 2.19 0.35
Medium effective pre-school, medium effective primary school 6.44** 2.06 0.50
Medium effective pre-school, high effective primary school 9.21*** 2.36 0.71
High effective pre-school, low effective primary school 10.82*** 2.74 0.83
High effective pre-school, medium effective primary school 8.80*** 2.18 0.68
High effective pre-school, high effective primary school 10.72*** 2.85 0.83
94
Appendix 7: Results of Contextualised Multilevel Analyses Controlling for Prior Attainment Table A.7.1.a: Simple value added analysis of cognitive progress from the end of Year 2 in primary school to the end of Year 6 showing primary school and child level variance
English (Year 6) standardised score
Mathematics (Year 6) standardised score
Estimate (standard error)
Estimate (standard error)
School level variance estimate (se) 16.47 (2.80) 19.95 (3.08)
Table A.7.1.a shows that, slightly more of the total variance in English at the end of Year 6 is accounted for by prior attainment at the end of Year 2, than is the case for Mathematics (approximately fifty-three per cent for English, approximately forty-eight per cent for Mathematics). The reduction of school level variance in particular is greater in the case of English than Mathematics, indicating the greater importance of a particular school (or more generally educational environment) for progress in Mathematics during Key Stage 2. The intra-school correlation is a measure of the variation in children‟s progress associated with the school level and can be seen as an overall indicator of potential differences in school effectiveness. The intra-school correlations for English and Mathematics are very similar. It is possible that, this variation between schools, in terms of progress, may reflect differences in teaching approaches and emphases during Key Stage 1 and Key Stage 2 (a matter explored in a sub study of 125 schools and Year 5 classes using classroom observations see Sammons et al., 2007). The intra-school correlations are fairly large indicating that around 16 to 17 per cent of the variation in progress is accounted for by the primary school attended. These findings are in line with other reported studies of primary school effects (see Mortimore et al., 1988; MacBeath & Mortimore, 2001)
95
Table A.7.1.b: English Contextualised Model controlling for prior attainment (impact of child, parent, home environment and other measures on year 6 standardised English attainment) AMENDED TABLE (MARCH 2010)
Comparison Group Experimental Group Coef se z Sig ES Sig
English Year 2 Continuous Variable 0.68 0.02 41.73 0.00 2.12 *
Age Continuous Variable 0.01 0.06 0.14 0.89 0.00
Gender: Boys Gender: Girls 2.16 0.41 5.25 0.00 0.23 *
Free School Meals: None Missing -1.99 6.86 -0.29 0.77 -0.22
FSM: Yes -0.89 0.62 1.44 0.15 -0.10
Need for EAL support: No Missing -0.32 0.61 -0.52 0.60 -0.03
Need for EAL support: Yes -2.35 1.48 -1.59 0.11 -0.26
Development Problems: None
Missing 1.31 2.85 0.46 0.65 0.14
At least one -0.86 0.65 -1.32 0.19 -0.09
More than one -0.37 2.00 -0.18 0.86 -0.04
Birth weight: Normal
Birth weight: Missing -1.19 1.60 -0.74 0.46 -0.13
Birth weight: very low<=1500g -0.03 1.76 -0.01 0.99 0.00
All the predictors that turned out to be significant predictors or predictors improving model fit of Year 6 attainment (see Appendix 6) have been kept in the model.*Statistically significant at 0.05 level.
96
Table A.7.2: Mathematics Contextualised Model (impact of child, parent, home environment and other measures on year 6 standardised Mathematics attainment) controlling for prior attainment AMENDED TABLE (MARCH 2010)
Comparison Group Experimental Group Coef se z Sig ES Sig
Any other ethnic minority heritage 0.66 1.38 0.48 0.63 0.07
Indian heritage 4.22 1.61 2.62 0.01 0.45 *
Pakistani heritage 2.96 1.25 2.37 0.02 0.31 *
Bangladeshi heritage 4.63 2.19 2.12 0.03 0.49 *
Mixed race heritage 0.69 0.97 0.71 0.48 0.07
Income: None
Income: Missing 2.37 1.40 1.70 0.09 0.25
£2,500 - £14,999 0.48 0.98 0.48 0.63 0.05
£17,500 - £29,999 1.02 1.03 0.99 0.32 0.11
£30,000 - £37,499 1.08 1.12 0.97 0.33 0.11
£37,500 - £67,499 1.71 1.09 1.57 0.12 0.18
£67,500 - £132,000+ 0.50 1.51 0.33 0.74 0.05
Family Socio Economic Status: Highest
Missing -0.37 0.88 -0.42 0.68 -0.04
Other professional non manual -1.00 0.99 -1.01 0.31 -0.11
Skilled non manual -2.04 1.02 -2.00 0.05 -0.22 *
Skilled manual -2.07 1.20 -1.73 0.08 -0.22
Semi skilled -1.81 1.78 -1.02 0.31 -0.19
Unskilled -2.16 1.31 -1.65 0.10 -0.23
Unemployed: not working -4.98 2.56 -1.95 0.05 -0.53 *
Mother‟s Qualification: None
Missing 3.35 1.81 1.84 0.07 0.35
Vocational 0.95 0.78 1.21 0.23 0.10
16 academic 1.34 0.64 2.10 0.04 0.14 *
18 academic 1.52 0.97 1.57 0.12 0.16
Degree or equivalent 4.65 1.01 4.59 0.00 0.49 *
Higher degree 6.25 1.56 4.02 0.00 0.66 *
Other professional 3.57 1.80 1.98 0.05 0.38 *
Father‟s Qualification: None
Missing -0.69 0.70 -0.99 0.32 -0.07
Vocational -0.81 0.83 -0.97 0.33 -0.08
16 academic -0.67 0.72 -0.94 0.35 -0.07
18 academic -0.78 1.02 -0.77 0.44 -0.08
Degree or equivalent 1.35 0.99 1.36 0.17 0.14
Higher degree 1.92 1.49 1.28 0.20 0.20
Other professional 2.16 2.21 0.98 0.33 0.23
Early Years Home Learning Index: Lowest
Missing 0.97 1.62 0.60 0.55 0.10
14-19 0.38 0.85 0.44 0.66 0.04
20-24 0.91 0.87 1.04 0.30 0.10
25-32 1.12 0.87 1.28 0.20 0.12
33-43 2.80 1.04 2.69 0.01 0.30 *
Key Stage 1Home Learning Environment
Interactions: High
Missing -2.80 1.33 -2.10 0.04 -0.30 *
Low -0.85 0.89 -0.96 0.34 -0.09
Low - Moderate -0.60 0.76 -0.78 0.44 -0.06
Moderate-High -0.49 0.72 -0.68 0.50 -0.05
All the predictors that turned out to be significant predictors or predictors improving model fit of Year 6 attainment (see Appendix 6) have been kept in the model. *Statistically significant at 0.05.
97
Table A.7.3 English Contextualised Model controlling for prior attainment: Net impact of pre-school attendance
Estimate SE Effect Size
Pre-school (compared to no pre-school)
1.41 0.84 0.15
Table A.7.4 Mathematics Contextualised Model controlling for prior attainment: Net impact of pre-school attendance
Estimate SE Effect Size
Pre-school (compared to no pre-school)
1.45 0.87 0.15
Table A.7.5a English Contextualised Model controlling for prior attainment: Net impact of Pre-school quality measured by ECERS-E *Statistically significant at 0.05 level
Estimate SE Effect Size
Pre-school Quality (compared to low quality)
No pre-school -0.47 1.01 -0.05
Medium quality 0.94 0.68 0.10
High quality 1.63* 0.79 0.18
Table A.7.5b English Contextualised Model controlling for prior attainment: Net impact of Pre-school quality measured by ECERS-E *Statistically significant at 0.05 level
Estimate SE Effect Size
Pre-school Quality (compared to no pre school)
Low Quality 0.47 1.01 0.05
Medium quality 1.41 0.86 0.15
High quality 2.10* 0.95 0.23
Table A.7.6a Mathematics Contextualised Model controlling for prior attainment: Net impact of Pre-school quality measured by ECERS-E # Just failed to reach statistical significance at 0.05 level
Estimate SE Effect Size
Pre-school Quality (compared to low quality)
No Pre-School -0.43 1.04 -0.05
Medium quality 1.12 0.71 0.12
High quality 1.51# 0.82 0.16
98
Table A.7.6b Mathematics Contextualised Model controlling for prior attainment: Net impact of Pre-school quality measured by ECERS-E *Statistically significant at 0.05 level
Estimate SE Effect Size
Pre-school Quality (compared to no pre school)
Low quality 0.43 1.04 0.05
Medium quality 1.55 0.89 0.16
High quality 1.94* 0.99 0.20
Table A.7.7a English Contextualised Model controlling for prior attainment: Net impact of Pre-school effectiveness (Pre-Reading) ***Statistically significant at 0.001 level
Estimate SE Effect Size
Pre-school Effectiveness (compared to no pre school)
Low effective 2.11 1.09 0.22
Medium effective 0.95 0.89 0.10
High effective 2.65*** 1.01 0.28
Table A.7.7b English Contextualised Model controlling for prior attainment: Net impact of Pre-school effectiveness (Pre-Reading) *Statistically significant at 0.05 level
Estimate SE Effect Size
Pre-school Effectiveness (compared to low effective)
No pre-school -2.11 1.09 -0.22
Medium effective -1.16 0.77 -0.12
High effective 0.54 0.93 0.06
Table A.7.8a Mathematics Contextualised Model controlling for prior attainment: Net impact of pre-school effectiveness (Early number concepts) *Statistically significant at 0.05 level
Estimate SE Effect Size
Pre-school Effectiveness (compared to no pre school)
Low effective 1.33 0.95 0.14
Medium effective 1.21 0.87 0.13
High effective 2.02 0.96 0.22
Table A.7.8b Mathematics Contextualised Model controlling for prior attainment: Net impact of pre-school effectiveness (Early number concepts) *Statistically significant at 0.05 level
Estimate SE Effect Size
Pre-school Effectiveness (compared to low effective)
No pre-school -1.33 0.95 -0.14
Medium effective -0.11 0.63 -0.01
High effective 0.69 0.75 0.07
99
Table A.7.9 English Contextualised Model controlling for prior attainment: Net impact of Primary school Academic Effectiveness **Statistically significant at 0.01 level
Estimate SE Effect Size
Primary School Effectiveness (compared to Low Effectiveness)
Low - Mid Effectiveness 0.75 0.86 0.08
Medium - High Effectiveness 1.22 0.72 0.13
High Effectiveness 3.41** 1.01 0.37
Table A.7.10 Mathematics Contextualised Model controlling for prior attainment: Net impact of Primary school Academic Effectiveness *Statistically significant at 0.05 level *Statistically significant at 0.001 level # Just failed to reach statistical significance at 0.05 level
Estimate SE Effect Size
Primary School Effectiveness (compared to Low Effectiveness)
Low - Mid Effectiveness 0.91 0.88 0.10
Medium - High Effectiveness 1.58* 0.74 0.17
High Effectiveness 4.91* 1.05 0.52
100
Glossary of terms Age standardised scores Assessment scores that have been adjusted to take account of the child‟s age at testing. This enables a comparison to be made between the performance of an individual pupil, and the relative achievement of a representative sample of children in the same age group throughout the country or, in this case, the relative achievement of the EPPE sample. ‘at risk’ The ETYSEN report acknowledges that the term „at risk‟ is a complex one which will differ depending on the particular criteria used. In the ETYSEN study cognitive risk is defined as 1 sd below national average and strong cognitive risk as 1 sd below sample average. These provide definitions of children who may be seen to be „at risk‟ on the basis of their cognitive attainment at entry to pre-school. Attendance The number of sessions attended at the target centre by an EPPE child from entry to study (BAS assessment) to leaving the target pre-school (based on pre-school centre registers). This measure provides a crude indicator of amount of target pre-school experience. Baseline measures Assessments taken by the EPPE child at entry to the study. These assessment scores are subsequently employed as prior attainment measures in a value added analysis of pupils‟ cognitive progress. Birth weight Babies born weighing 2500 grams (5lbs 8oz) or less are defined as below normal birth weight, foetal infant classification is below 1000 grams, very low birth weight is classified as 1001-1005 grams and low birth weight is classified as 1501-2500 grams (Scott and Carran, 1989). British Ability Scales (BAS) This is a battery of assessments specially developed by NFER-Nelson to assess very young children‟s abilities. The assessments used at entry to the EPPE study and at entry to reception were: Block building - Visual-perceptual matching, especially in spatial orientation (only entry to EPPE study) Naming Vocabulary – Expressive language and knowledge of names Pattern construction – Non-verbal reasoning and spatial visualisation (only entry to reception) Picture Similarities – Non-verbal reasoning Early number concepts – Knowledge of, and problem solving using pre-numerical and numerical concepts (only entry to reception) Copying – Visual–perceptual matching and fine-motor co-ordination. Used specifically for children without English Verbal comprehension – Receptive language, understanding of oral instructions involving basic language concepts. Centre/School level variance The proportion of variance in a particular child outcome measure (i.e. Pre-Reading scores at start of primary school) attributable to differences between individual centres/schools rather than differences between individual children. Child background factors Child background characteristics such as age, gender, ethnicity. Compositional effects The impact of peer group measures on a child‟s individual outcomes. For example, when the characteristics of children in a centre (measured as a centre level aggregated variable) show a significant relationship with outcomes at the individual child level, after controlling for the same variable at the individual level. For further details see Harker (2001). Confidence intervals at the 95% level A range of values which can be expected to include the „true‟ value in 95 out of 100 samples (i.e. if the calculation was repeated using 100 random samples).
101
Contextualised models Cross-sectional multilevel models exploring children‟s cognitive attainment at entry to primary school, controlling for child, parent and home learning environment characteristics (but not prior attainment). Controlling for Several variables may influence an outcome and these variables may themselves be associated. Multilevel statistical analyses can calculate the influence of one variable upon an outcome having allowed for the effects of other variables. When this is done the net effect of a variable upon an outcome controlling for other variables can be established. Correlation A correlation is a measure of statistical association that ranges form + 1 to -1. Duration In terms of the value added models, the duration of pre-school covers the time period between date of BAS assessment at entry to the EPPE study until entry to primary school. Note that the number of months of pre-school attended before the child entered the EPPE study is not included in this duration measure. A separate „duration‟ measure of amount of time in pre-school prior to entering the study was tested but was not found to be significant (note that this „duration‟ measure is confounded with prior attainment). In the contextualised models, duration of pre-school refers to the time period between entry to the target pre-school until entry to primary school. These duration measures provide a crude indication of length of pre-school experience. ECERS-R and ECERS-E The American Early Childhood Environment Rating Scale (ECERS-R) (Harms et al., 1998) is based on child centred pedagogy and also assesses resources for indoor and outdoor play. The English rating scale (ECERS-E) (Sylva et al., 2003) was intended as a supplement to the ECERS-R and was developed specially for the EPPE study to reflect the Desirable Learning Outcomes (which have since been replaced by the Early Learning Goals), and more importantly the Curriculum Guidance for the Foundation Stage which at the time was in trial stage. Educational effectiveness Research design which seeks to explore the effectiveness of educational institutions in promoting a range of child/student outcomes (often academic measures) while controlling for the influence of intake differences in child/student characteristics. Effect sizes (ES) Effect sizes (ES) provide a measure of the strength of the relationships between different predictors and the child outcomes under study. For further discussion see Appendix 5 and Elliot & Sammons (2004). Family factors Examples of family factors are mother‟s qualifications, father‟s employment and family SES. General Cognitive Ability (GCA) A measure of children‟s overall cognitive ability, incorporating non-verbal and verbal BAS sub-scales. Hierarchical nature of the data Data that clusters into pre-defined sub-groups or levels within a system (i.e. young children, pre-school centres, LAs). Home learning environment factors Measures derived from reports from parents (at interview) about what children do at home, for example, playing with numbers and letters, singing songs and nursery rhymes. Intervention study A study in which researchers „intervene‟ in the sample to control variables i.e. control by setting, the adult:child ratios in order to compare different specific ratios in different settings. EPPE is not an intervention study in that it investigates naturally occurring variation in pre-school settings.
102
Intra-centre/school correlation The intra-centre/school correlation measures the extent to which the scores of children in the same centre/school resemble each other as compared with those from children at different centres/schools. The intra-centre/school correlation provides an indication of the extent to which unexplained variance in children‟s progress (i.e. that not accounted for by prior attainment) may be attributed to differences between centres/schools. This gives an indication of possible variation in pre-school centre/school effectiveness. Multiple Disadvantage Based on three child variables, six parent variables, and one related to the home learning environment which were considered „risk‟ indicators when looked at in isolation. A child‟s „multiple disadvantage‟ was calculated by summing the number of indicators the child was at risk on. Multilevel modelling A methodology that allows data to be examined simultaneously at different levels within a system (i.e. young children, pre-school centres, LAs), essentially a generalisation of multiple regression. Multiple regression A method of predicting outcome scores on the basis of the statistical relationship between observed outcome scores and one or more predictor variables. Net effect The unique contribution of a particular variable upon an outcome while other variables are controlled. Outliers Pre-school centres where children made significantly greater/less progress than predicted on the basis of prior attainment and other significant child, parent and home learning environment characteristics. Pedagogical strategies Strategies used by the educator to support learning. These include the face to face interactions with children, the organisation of the resources and the assessment practices and procedures. Pre-Reading attainment Composite formed by adding together the scores for phonological awareness (rhyme and alliteration) and letter recognition. Prior attainment factors Measures which describe pupils‟ achievement at the beginning of the phase or period under investigation (i.e. taken on entry to primary or secondary school or, in this case, on entry to the EPPE study). Quality Measures of pre-school centre quality collected through observational assessments (ECERS-R, ECERS-E and CIS) made by trained researchers. Sampling profile/procedures The EPPE sample was constructed by:
Five regions (six LAs) randomly selected around the country, but being representative of urban, rural, inner city areas.
Pre-schools from each of the 6 types of target provision (nursery classes, nursery schools, local authority day nurseries, private day nurseries, play groups and integrated centres) randomly selected across the region. Significance level Criteria for judging whether differences in scores between groups of children or centres might have arisen by chance. The most common criteria is the 95% level (p<0.05) which can be expected to include the „true‟ value in 95 out of 100 samples (i.e. the probability being one in twenty that a difference might have arisen by chance). Social/behavioural development A child‟s ability to „socialise‟ with other adults and children and their general behaviour to others.
103
Socio Economic Status (SES) Occupational information was collected by means of a parental interview when children were recruited to the study. The Office of Population Census and Surveys OPCS (1995) Classification of Occupations was used to classify mothers and fathers current employment into one of 8 groups: professional I, other professional non manual II, skilled non manual III, skilled manual III, semi-skilled manual IV, unskilled manual V, never worked and no response. Family SES was obtained by assigning the SES classification based on the parent with the highest occupational status. Standard deviation (sd) A measure of the spread around the mean in a distribution of numerical scores. In a normal distribution, 68% of cases fall within one standard deviation of the mean and 95% of cases fall within two standard deviations. Target centre A total of 141 pre-school centres were recruited to the EPPE research covering 6 types of provision. The sample of children was drawn from these target centres. Total BAS score By combining 4 of the BAS sub-scales (2 verbal and 2 non-verbal) a General Cognitive Ability score or Total BAS score at entry to the study can be computed. This is a measure of overall cognitive ability. Value added models Longitudinal multilevel models exploring children‟s cognitive progress over the pre-school period, controlling for prior attainment and significant child, parent and home learning environment characteristics. Value added residuals Differences between predicted and actual results for pre-school centres (where predicted results are calculated using value added models).
104
Additional Information This research report was written before the new UK Government took office on
11 May 2010. As a result the content may not reflect current Government policy and may make reference to the Department for Children, Schools and Families (DCSF) which has now been
replaced by the Department for Education (DFE).
The views expressed in this report are the authors‟ and do not necessarily reflect those of the Department for Education.
105
Copies of this publication can be obtained from: DCSF Publications PO Box 5050 Sherwood Park Annesley Nottingham NG15 ODJ Tel 0845 6022260 Fax 0845 6033360 Email [email protected] Please quote ref:DCSF-RR048