22
Deriving Insight from Data WCMUG Meeting 23 November 2010 presented by Richard Hoath and Craig Wilson www.informsolutions.ca
| Date post: | 14-Jul-2015 |
| Category: |
Devices & Hardware |
| Upload: | informsolutions |
| View: | 257 times |
| Download: | 0 times |

Deriving Insight from DataWCMUG Meeting23 November 2010presented by Richard Hoath and Craig Wilson
www.informsolutions.ca
data

connecting the last mile

what has happened
reactive
• pre‐canned reports
move between extremes
sense and respond
what is happening
• reporting against business outcomes• indicators set on emerging problems• drill down• lots of reports!
problem solving
what will happen
• regular analysis for changes in key indicators• use of statistical analysis
focus on drivers of business outcomes
predictive
SHIFTING FROM REACTIVE TO PREDICTIVE ANALYTICS
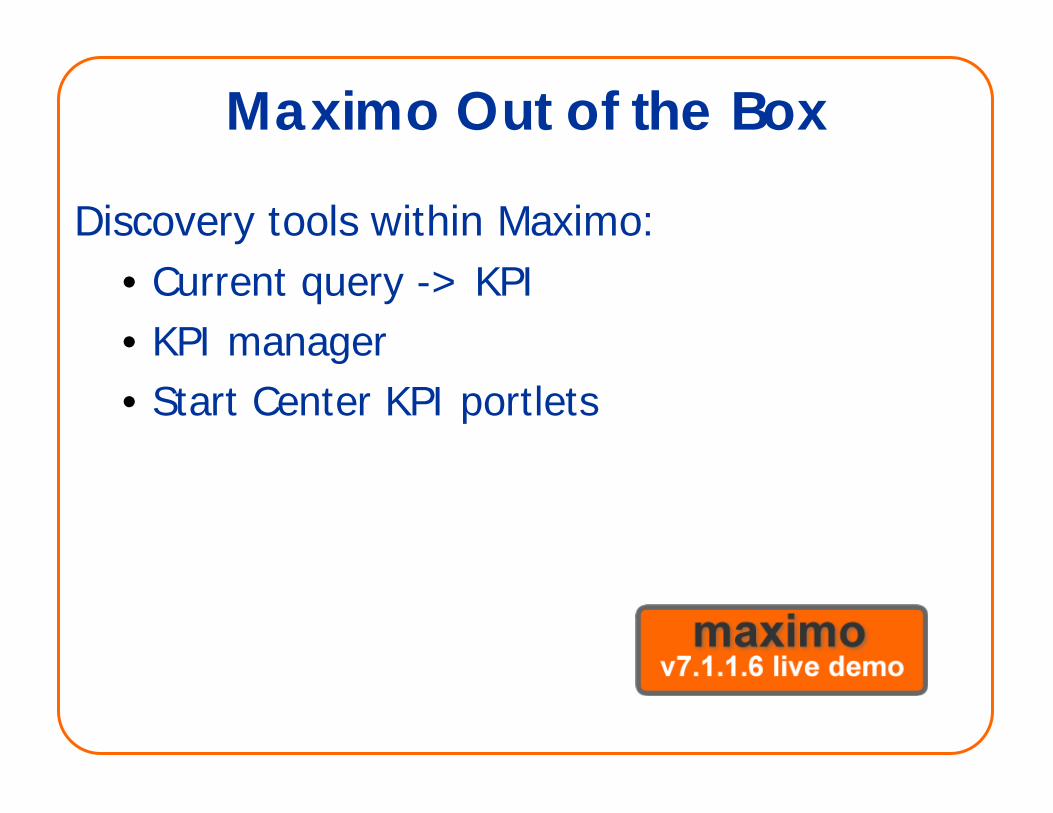
Maximo Out of the Box
Discovery tools within Maximo:• Current query -> KPI• KPI manager• Start Center KPI portlets
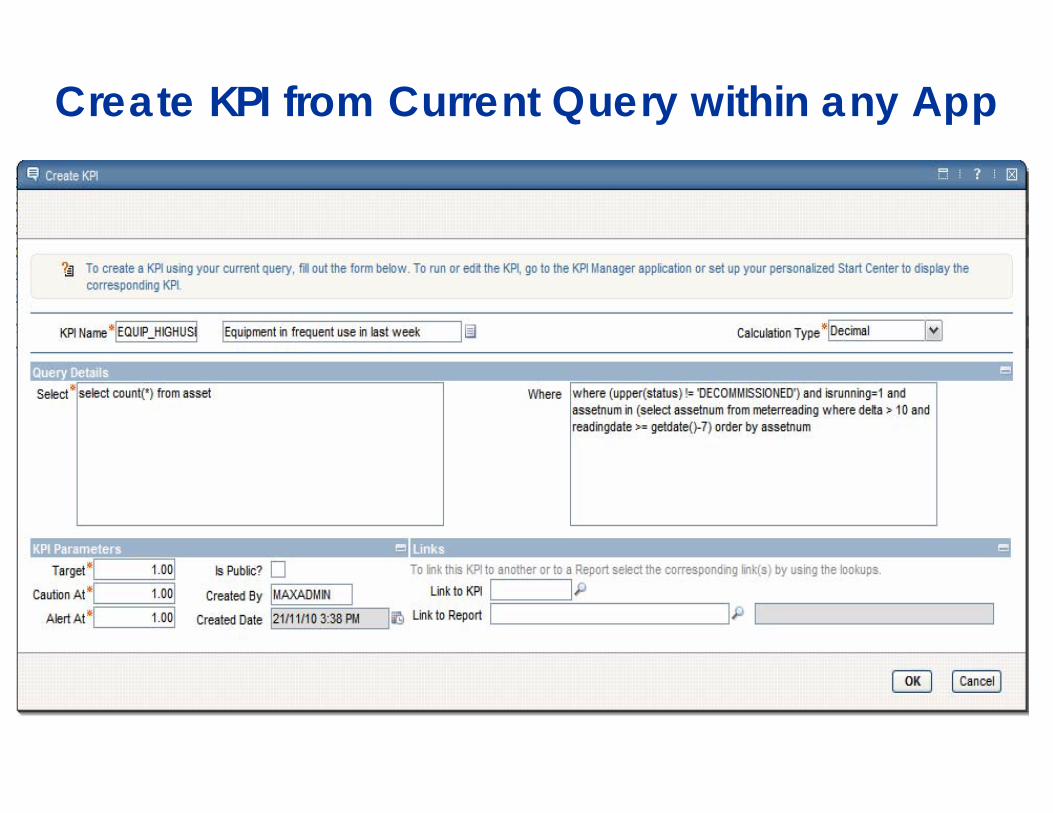
Create KPI from Current Query within any App

KPI Manager
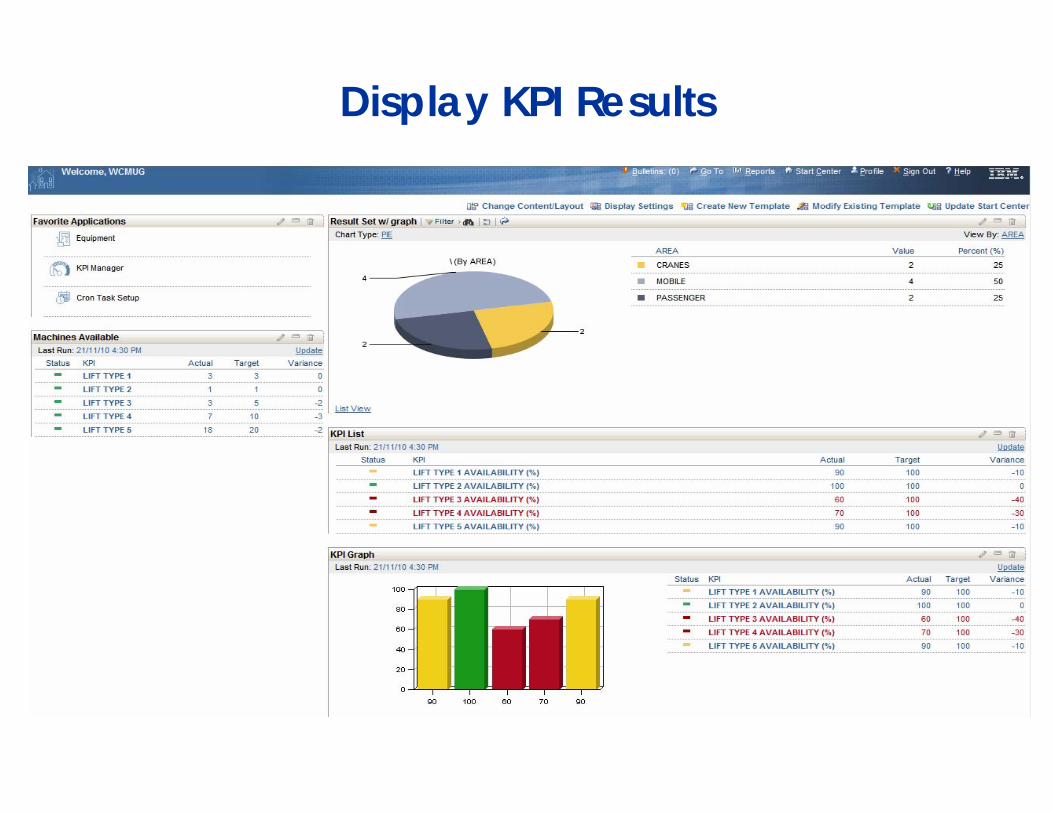
Display KPI Results
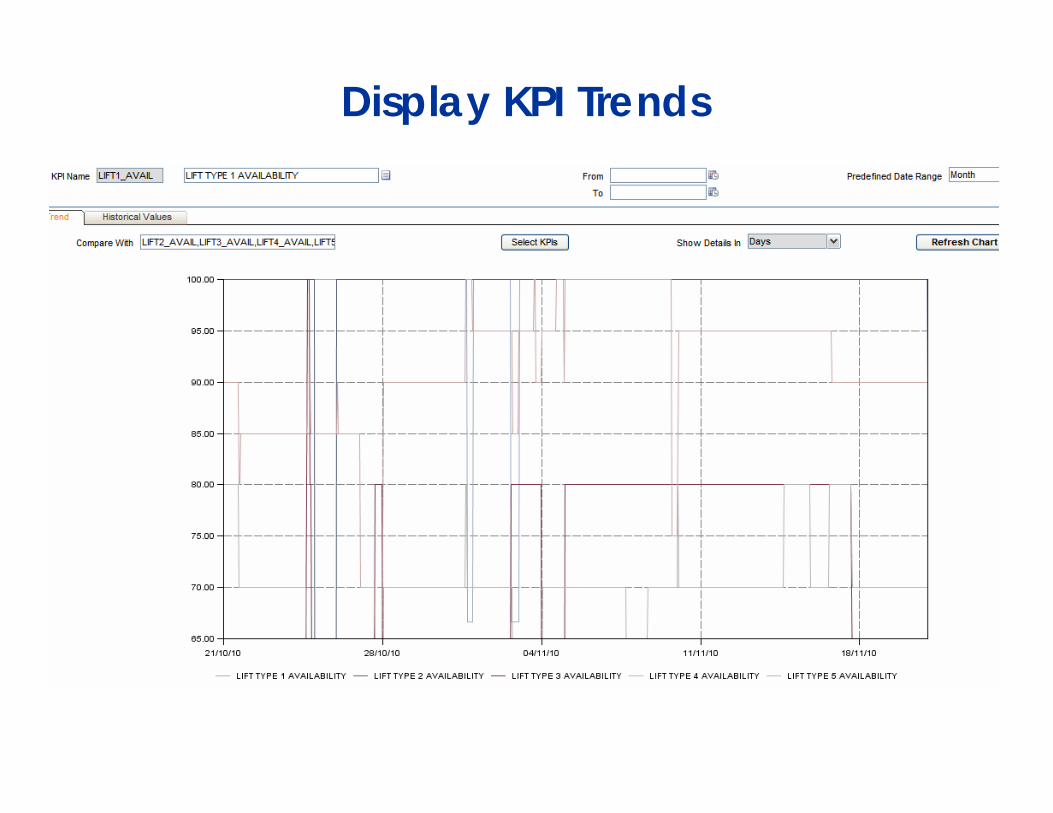
Display KPI Trends
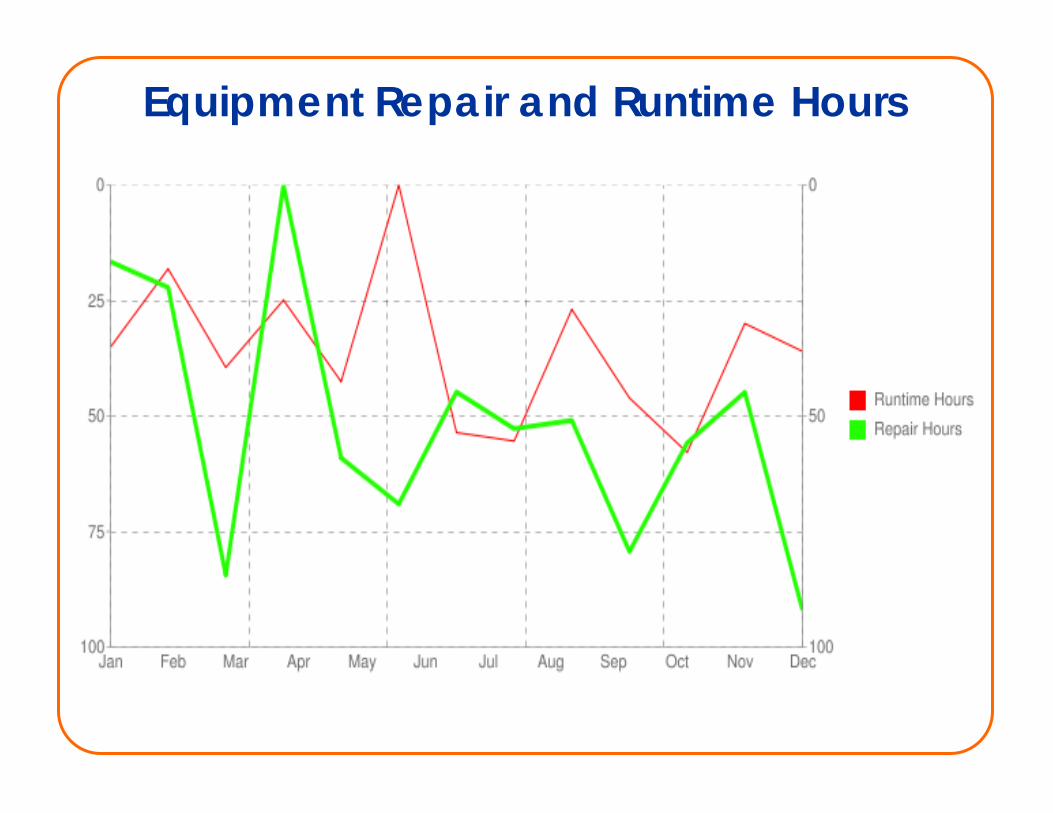
Equipment Repair and Runtime Hours

Equipment Repair and Runtime Hours
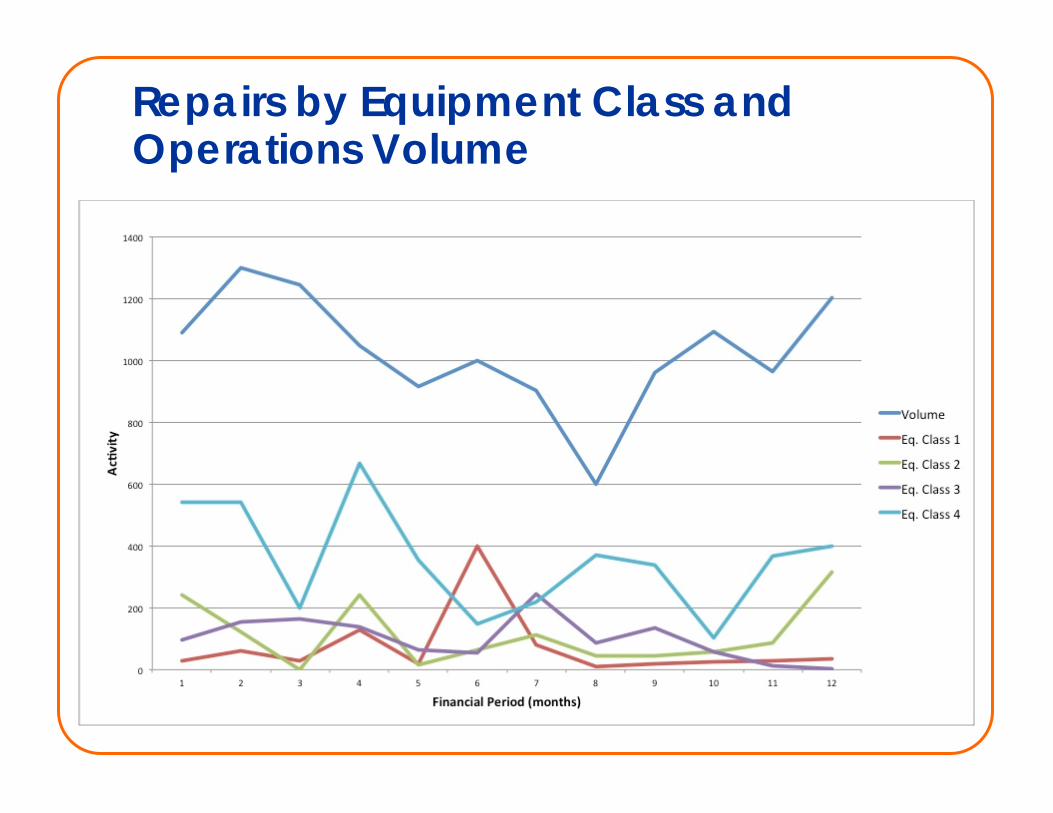
Repairs by Equipment Class andOperations Volume
• External large data sets• massive, unstructured, disconnected• quality, relevance?• w3c open data project, xhtml standards
• “web 3.0” semantic web• push for open and more structured data• “accessible, interoperable, valuable” for example, www.opencalais.com• close gap between human and machine readable web content
• discovering patterns in connected networks• identify and gain feedback from the 30% of nodes at core of networks
• cleaning “messy data”• tools like Google refine are emerging
Research/Emerging Ideas
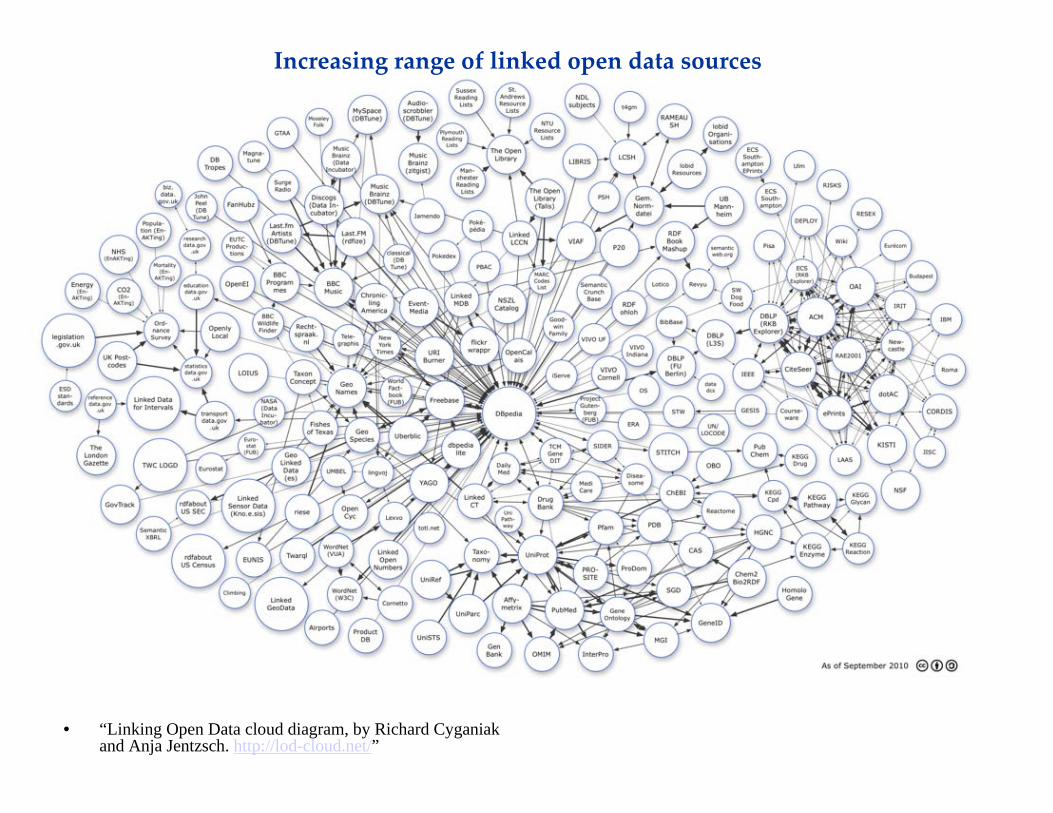
• “Linking Open Data cloud diagram, by Richard Cyganiakand Anja Jentzsch. http://lod-cloud.net/”
Increasing range of linked open data sources
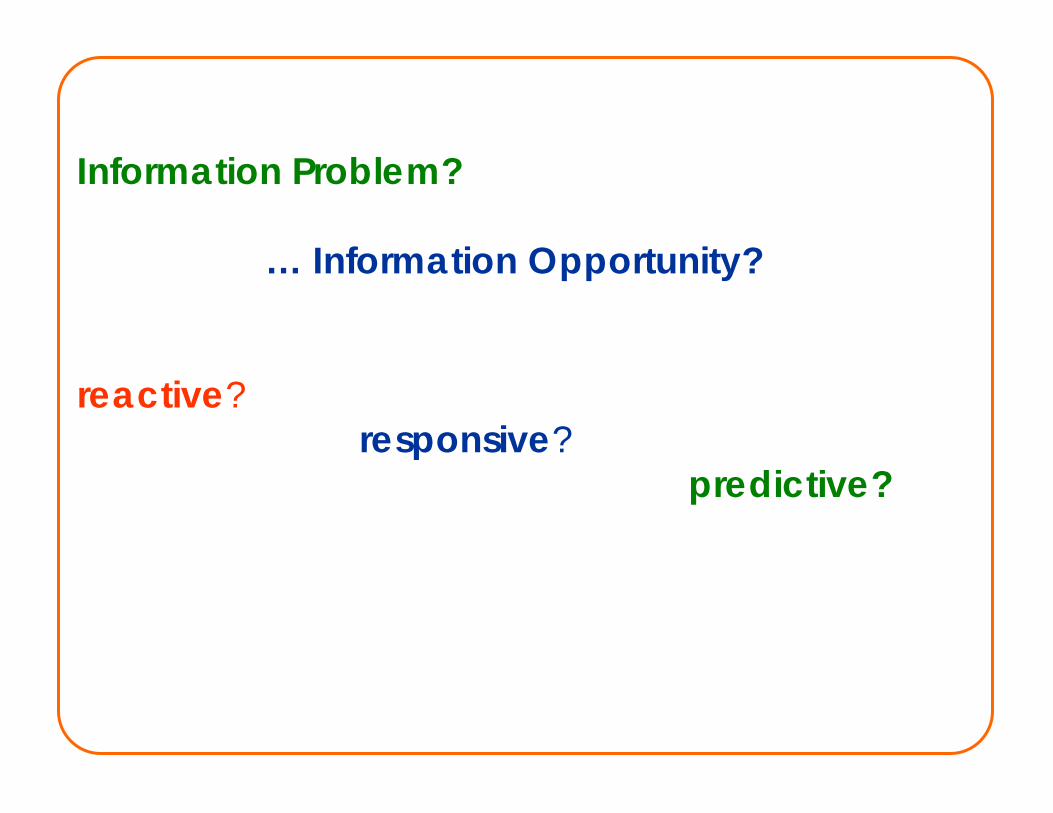
Information Problem?
… Information Opportunity?
reactive?responsive?
predictive?
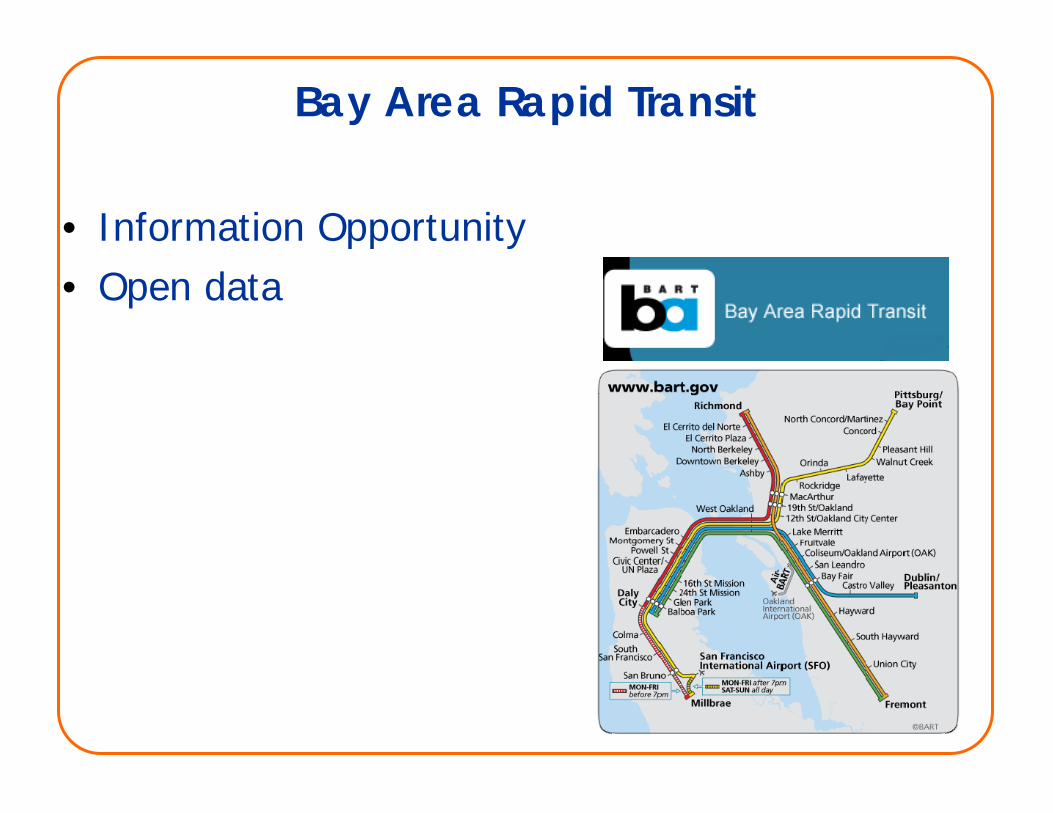
• Information Opportunity• Open data
Bay Area Rapid Transit

Safety Incident Counts
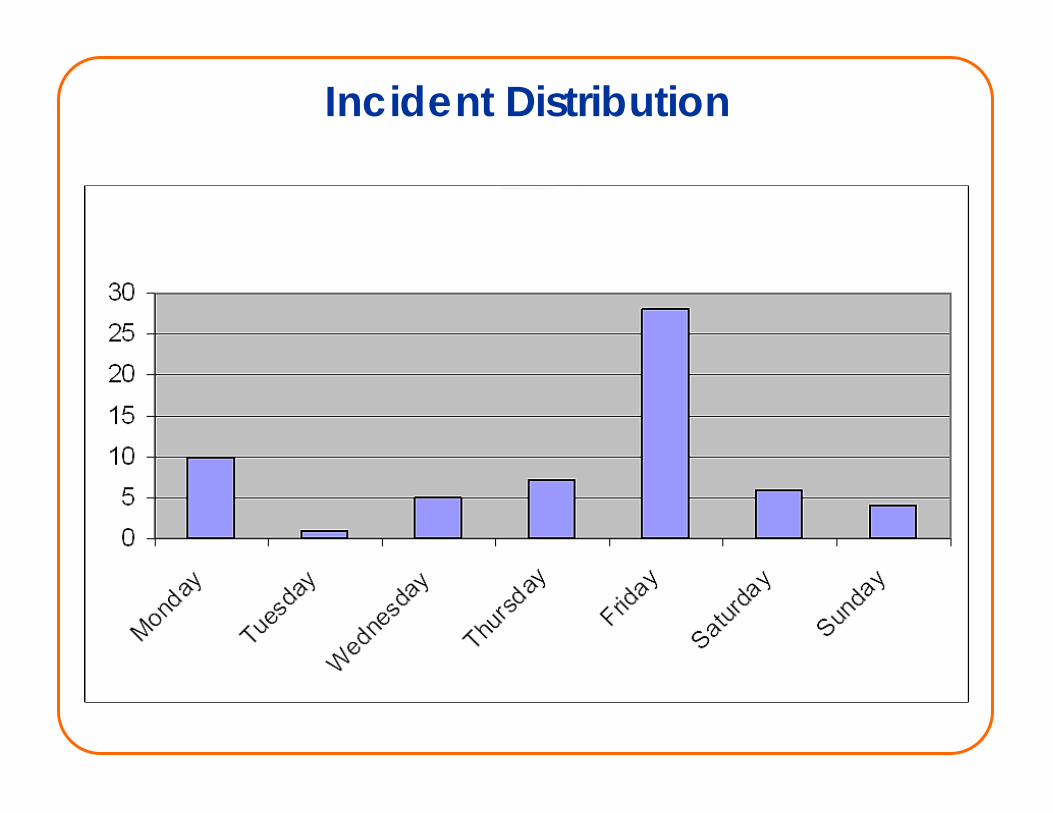
Incident Distribution
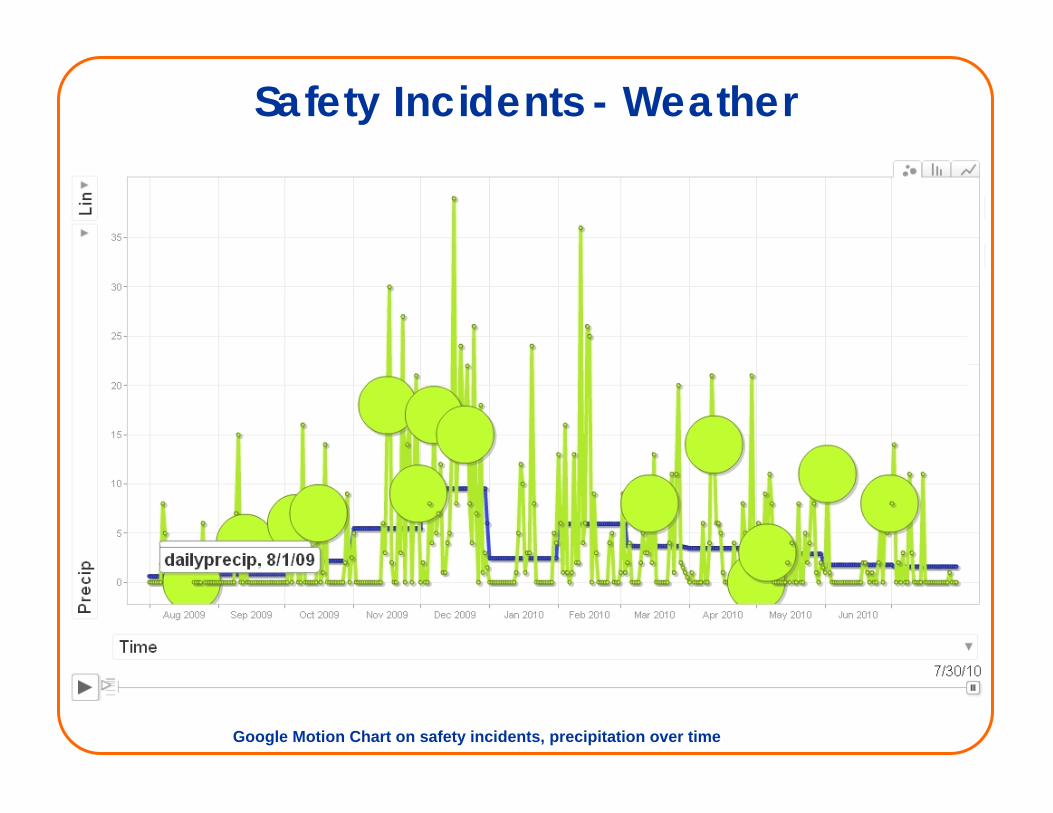
Safety Incidents - Weather
Google Motion Chart on safety incidents, precipitation over time

Word Cloud generated from 4000 Maximo work orders (using IBM Many Eyes)

Thought leaders on Insight from public mass data setsTim Berners-Lee
• inventor of the www, W3C Linking Open Data project, “make public data public”Hans Rosling
• fact based world view through use and understanding of public statistics http://www.gapminder.org/ , creator of now named Google Motion Charts
• Ted Talks presentations www.ted.comNicholas Christakis
• discovering connections within social networks, public health determinates
Open Data InitiativesBay Area Rapid Transit http://www.bart.gov/schedules/developers/Central Knowledge Archive Network http://ckan.net/
Visualization Tools used in PresentationGoogle Motion Charts
http://code.google.com/apis/visualization/documentation/gallery/motionchart.htmlIBM many eyes
www-958.ibm.com/me

Deriving Insight from DataWCMUG Meeting23 November 2010presented by Richard Hoath and Craig Wilson
www.informsolutions.ca


