Informatics-Enabled Community Engagement in the Washington Heights Informatics Infrastructure for Comparative Effectiveness Research (WICER) Project Suzanne Bakken, PhD, RN, FAAN, FACMI School of Nursing and Department of Biomedical Informatics Columbia University 1R01HS019853, R01HS022961
Transcript
Informatics-Enabled Community Engagement in the Washington Heights Informatics Infrastructure for
Comparative Effectiveness Research (WICER) Project
Suzanne Bakken, PhD, RN, FAAN, FACMISchool of Nursing and Department of Biomedical Informatics
Columbia University
1R01HS019853, R01HS022961
Community Engagement in Context of the Learning Health Systems
• Building a strong fabric of trust among stakeholders through communication and demonstration of value
• Principles as a foundation for fabric of trust: – Build a shared learning environment– Engage health and health care, population and patient– Leverage existing programs and policies
• Difficulty of building a strong fabric of trust among racial and ethnic minorities – Low participation rates in research studies– Low participation rates in biobanks– Limited use of information technologies for health-related
purposes.
Goals of WICER
• Comprehensive understanding of the Washington Heights/Inwood population
• Facilitate research with this population• Demonstrate infrastructure capabilities for
comparative effectiveness research
Washington Heights/Inwood
• 5 zip codes: 10031, 10032, 10033, 10034, 10040
• Represents significant issues in health care disparities
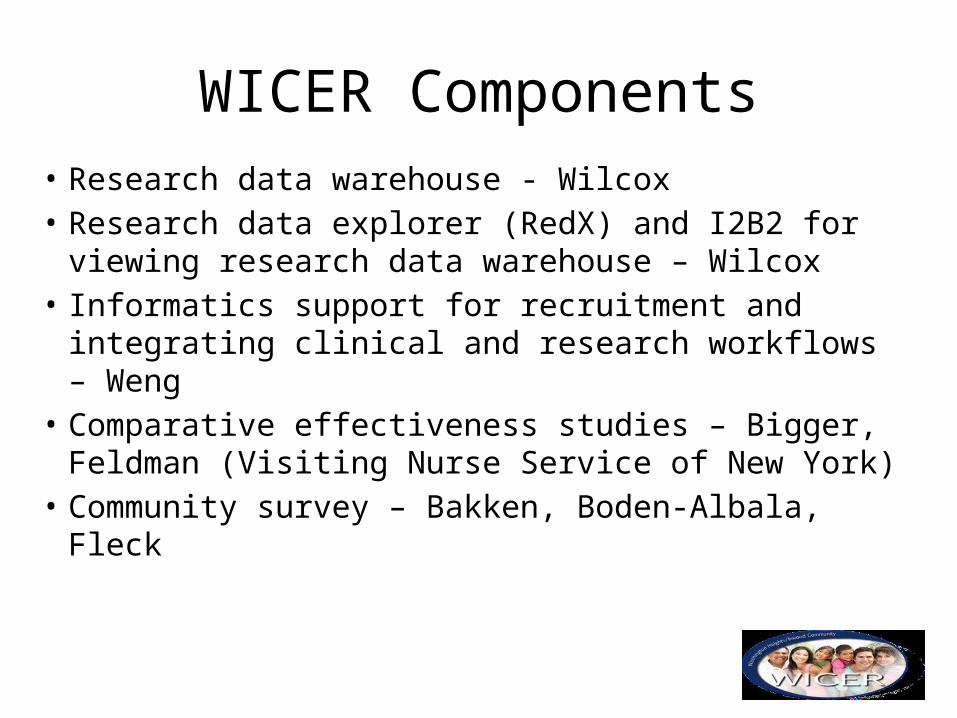
WICER Components• Research data warehouse - Wilcox • Research data explorer (RedX) and I2B2 for viewing
research data warehouse – Wilcox• Informatics support for recruitment and integrating
clinical and research workflows – Weng• Comparative effectiveness studies – Bigger, Feldman
(Visiting Nurse Service of New York)• Community survey – Bakken, Boden-Albala, Fleck
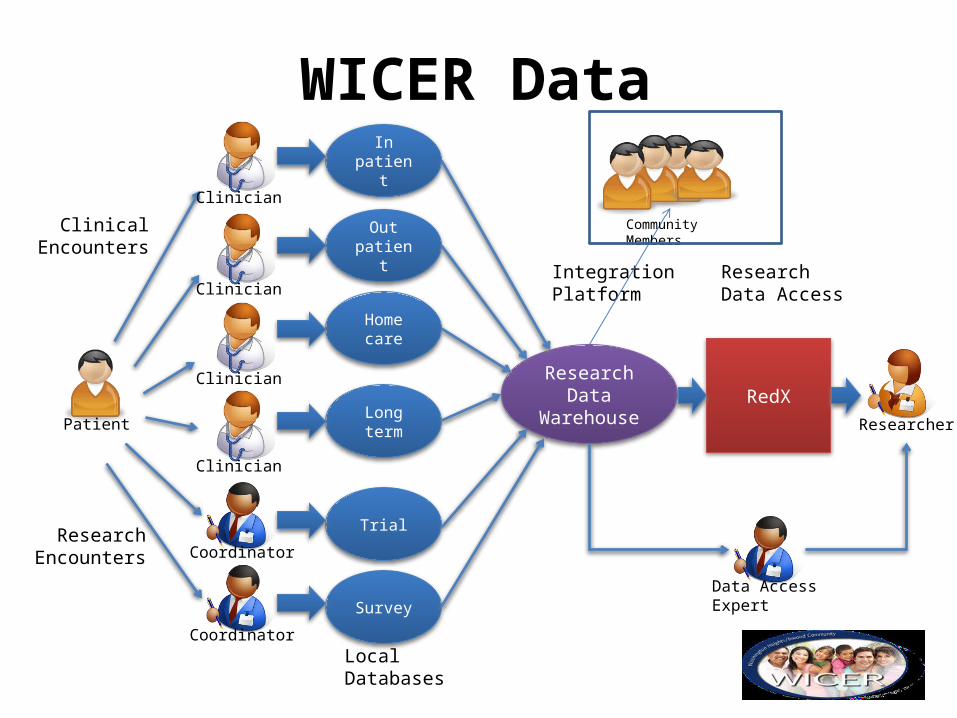
WICER Data
Coordinator
Researcher
Coordinator
In patient
Out patient
Home care
Long term
Trial
Survey
LocalDatabases
Clinical Encounters
Research Encounters
ResearchData
WarehouseRedX
Integration Platform
ResearchData Access
Data Access Expert
Clinician
Clinician
Clinician
Clinician
Patient
Community Members
Community Engagement• Survey design and implementation• Returning data to community• Role of informatics
Community Survey• Demographics
– Including socio-economic status• Anthropometric measures and vital signs
– Nutrition– Physical activity– Social role performance– Health and illness perceptions– Self health assessment– Depression– Medication adherence– Quality of life– Health literacy
• Baseline and follow-up approximately 1 year apart• Some overlap with BRFSS and NYC Community Health Survey – Yoon eGEMS
publication
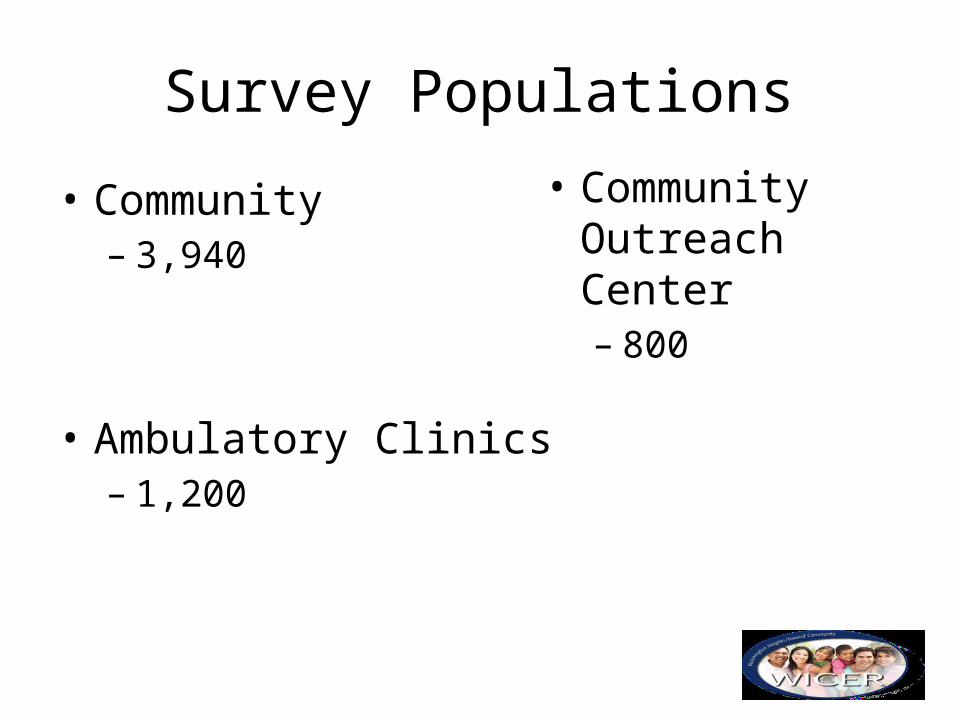
Survey Populations
• Community– 3,940
• Ambulatory Clinics– 1,200
• Community Outreach Center– 800
Survey Design and Implementation• CTSA-funded Columbia-Community Partnership for Health
(CCPH)• Free community blood pressure screening and education at
CCPH• Focus groups to inform survey content• Data collection by bilingual community health workers from
Washington Heights/Inwood in homes, community organizations, and local businesses as well as CCPH and clinics
• Incorporation of snowball sampling methods• Compensation for participant time with incentives of value to
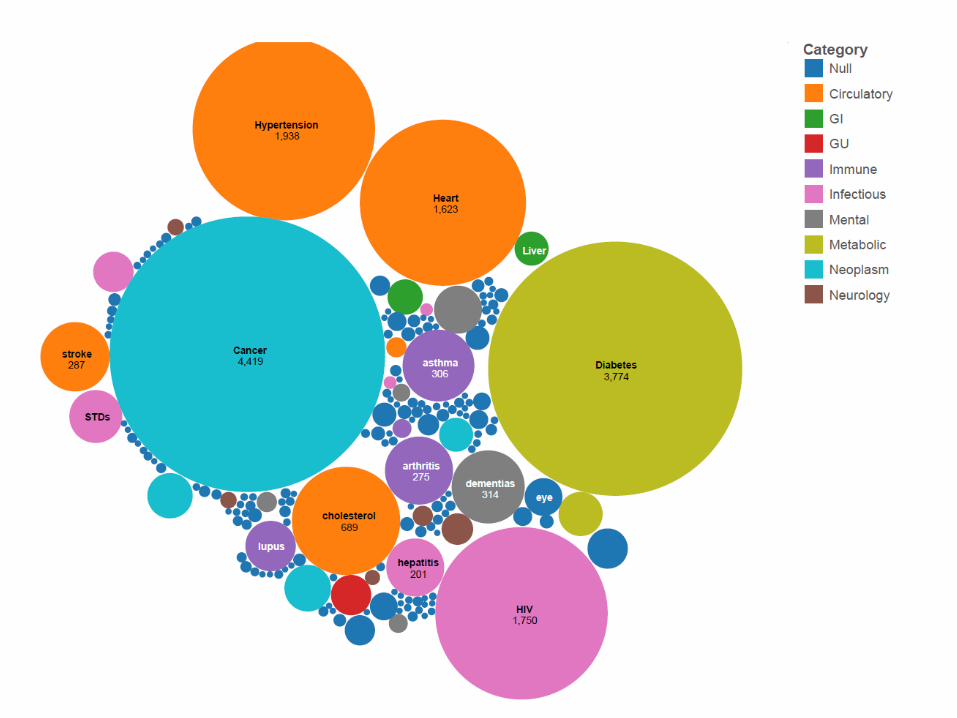
residents (e.g., grocery coupons)• Asked about top health concerns
Building a Strong Fabric of Trust
• Participation rates in research studies – increased enrollment rates for WICER referrals to other studies
• Participation rates in biobanks – exceeded biospecimen collection goals
• Use of information technologies for health-related purposes – only 7% had used information technology for health purposes, but most participants agreed to linkage of survey data to clinical data
Returning Data to the Community• Survey respondents• Community-based Organizations
Returning Survey Data to Participants• Established WICER visualization working group that
includes investigators from a variety of disciplines including nursing, medicine, public health, biomedical informatics, engineering, human factors, communication, art, fashion, theater
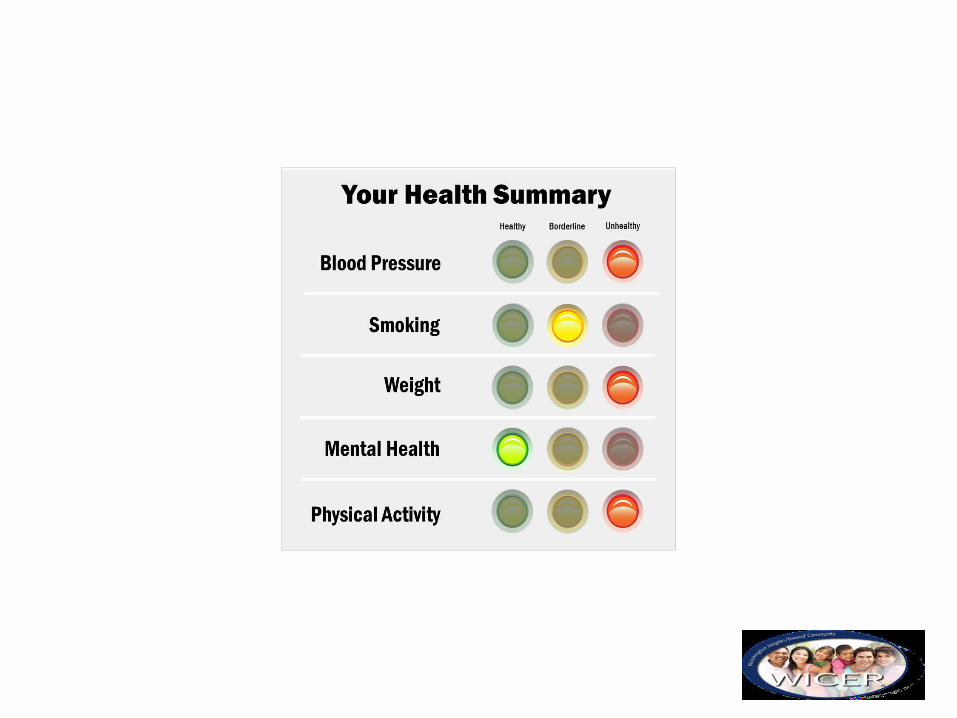
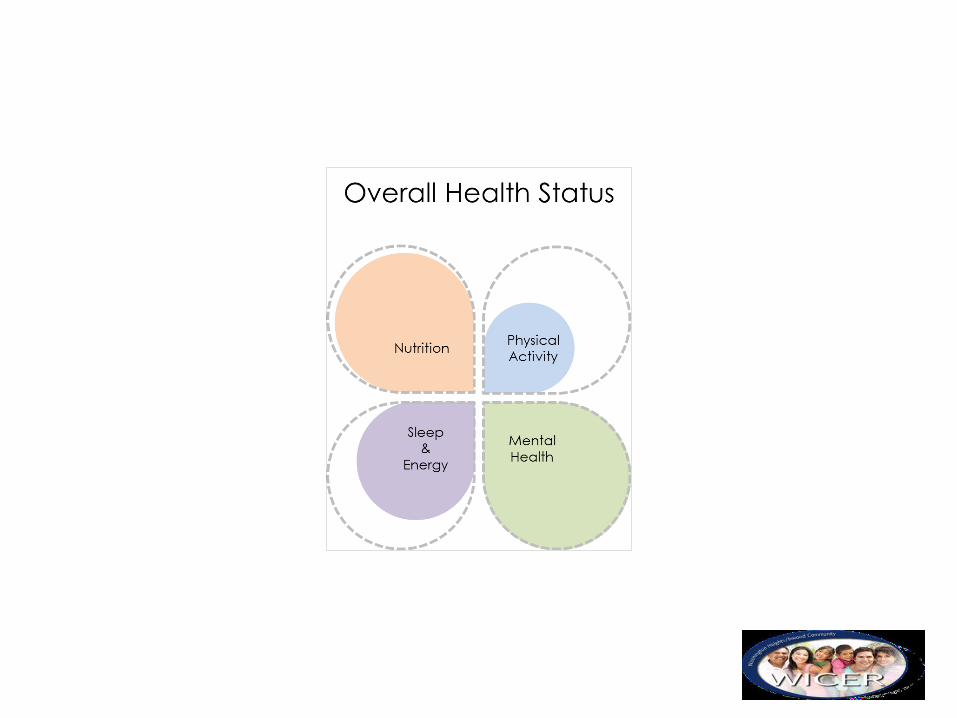
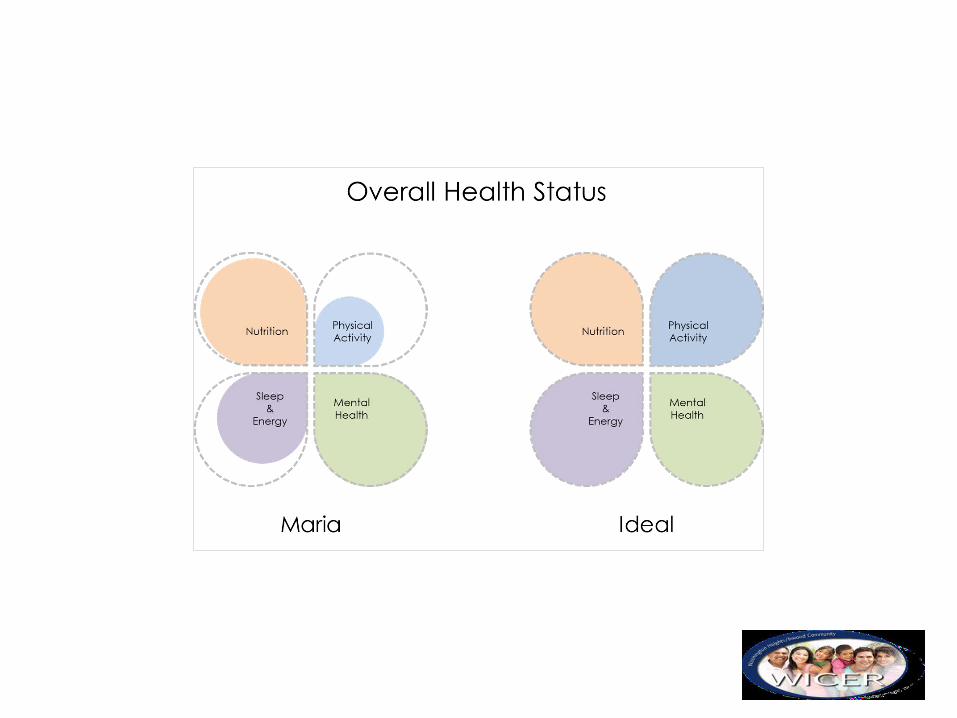
• Creation of infographics of varying levels of complexity based on cognitive tasks
• Focus groups regarding preference and acceptability• Basic research regarding comprehension• Applied research related to actionability in consumer-facing
and provider-facing applications• Process reported in Arcia et al. AMIA 2013
Key Lessons from Focus Groups More is more Culture matters
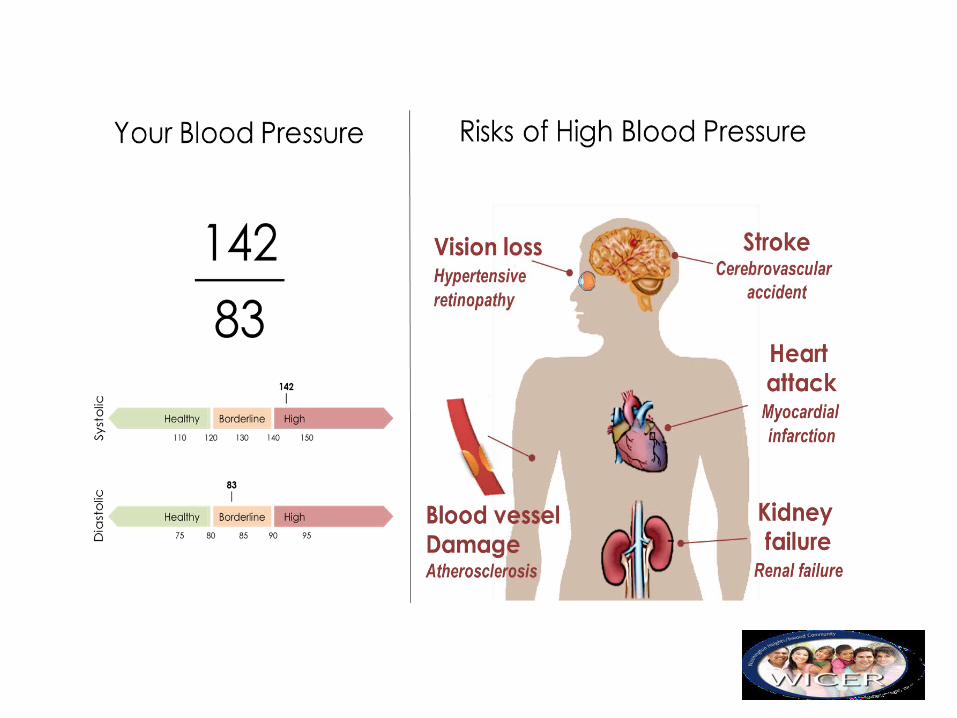
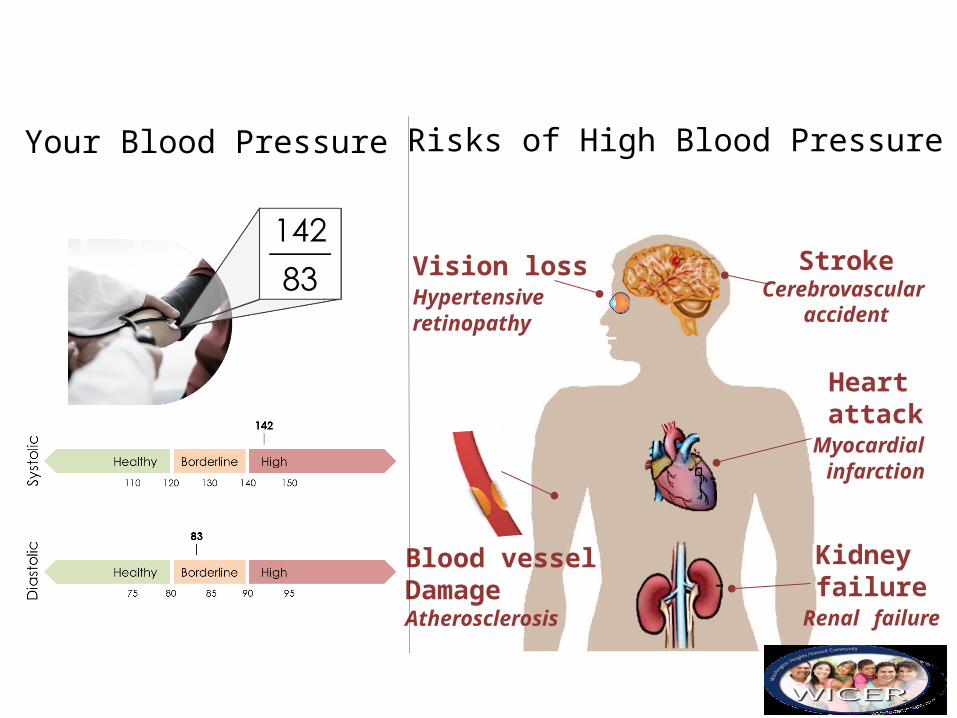
Your Blood Pressure Risks of High Blood Pressure
StrokeCerebrovascular
accident
Heart attackMyocardial infarction
Kidney failureRenal failure
Vision lossHypertensive retinopathy
Blood vessel DamageAtherosclerosis
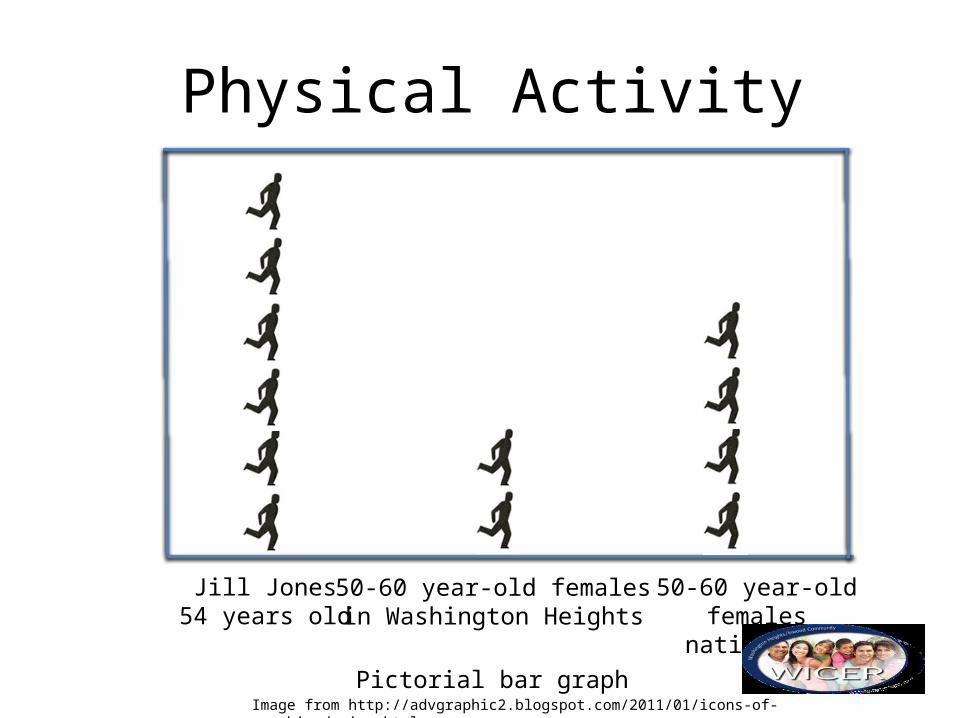
Days with Adequate Physical Activity in the Last Month
Jill Jones54 years old
50-60 year-old femalesin Washington Heights
50-60 year-old femalesnationwide
22
15
25
Physical Activity
Jill Jones54 years old
50-60 year-old femalesin Washington Heights
50-60 year-old femalesnationwide
Image from http://advgraphic2.blogspot.com/2011/01/icons-of-graphic-design.html
Pictorial bar graph
Physical Activity
Community-based Organizations• Focus groups• Elicitation of information needs and
desired formats
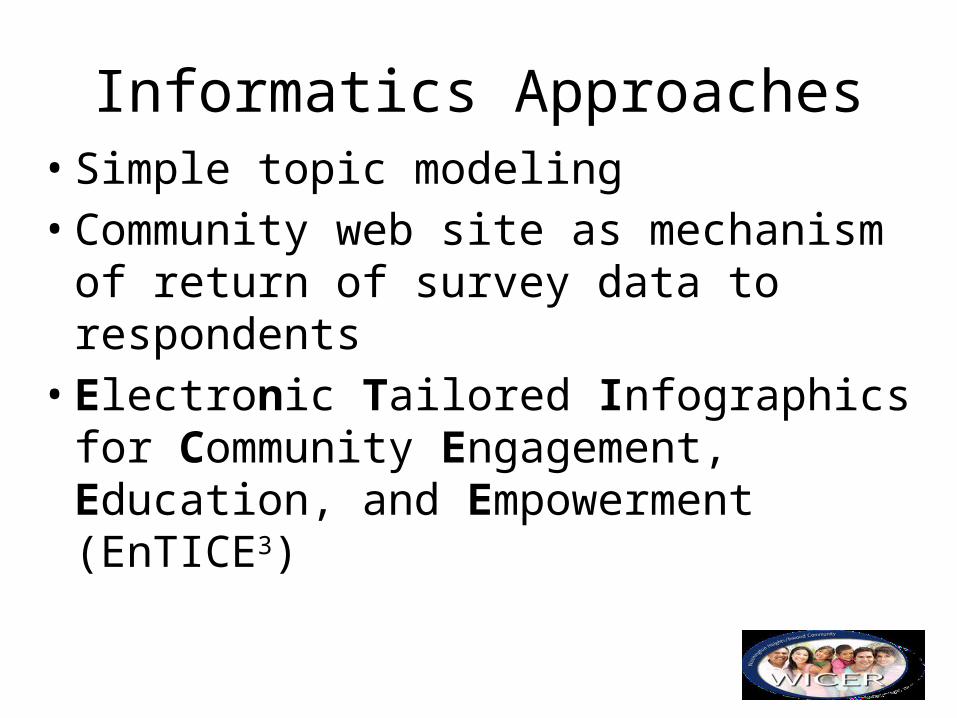
Informatics Approaches• Simple topic modeling• Community web site as mechanism of
return of survey data to respondents• Electronic Tailored Infographics for
Community Engagement, Education, and Empowerment (EnTICE3)
The EnTICE3 Framework and Sample Infographic
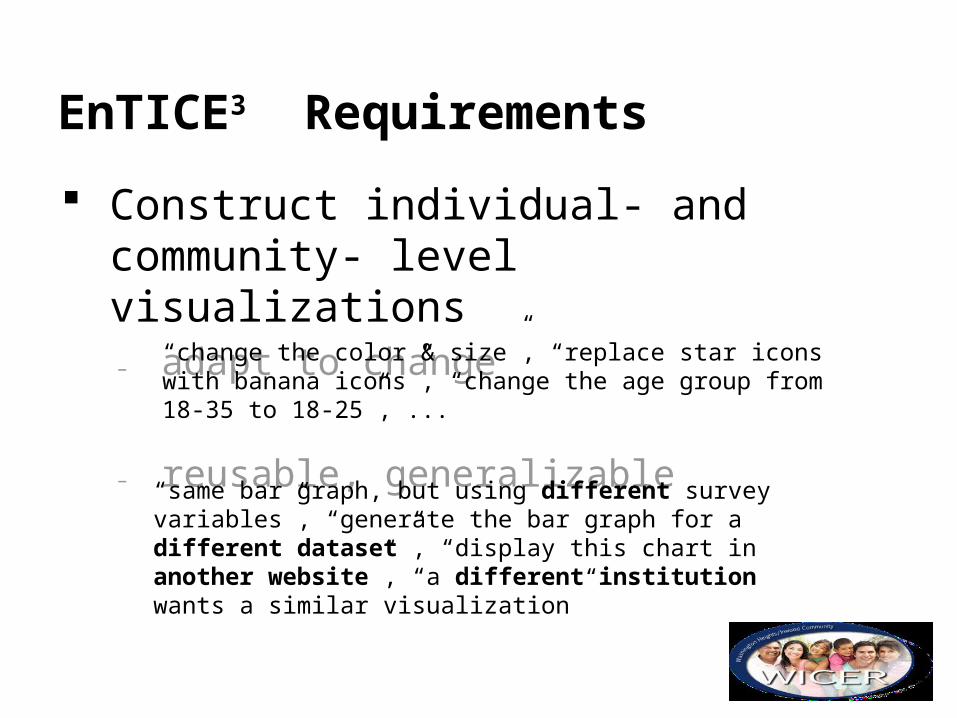
EnTICE3 Requirements
Construct individual- and community- level visualizations₋ adapt to change
₋ reusable, generalizable
“change the color & size”, “replace star icons with banana icons”, “change the age group from 18-35 to 18-25”, ...
“same bar graph, but using different survey variables”, “generate the bar graph for a different dataset”, “display this chart in another website”, “a different institution wants a similar visualization”
EnTICE3 Requirements
• Construct individual- and community- level visualizations₋ adapt to change
■ iterative approach■ prototype → production
₋ reusable, generalizable■ modular, generic services■ web standards (HTML, HTTP)■ web components (encapsulated interactive
templates)
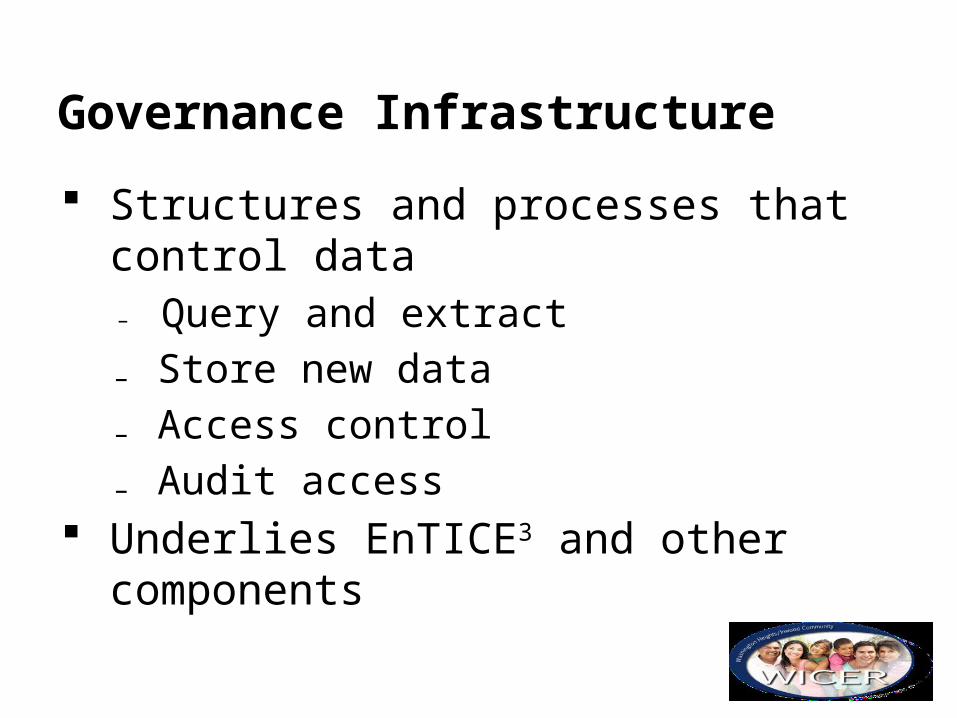
Governance Infrastructure
Structures and processes that control data₋ Query and extract₋ Store new data₋ Access control₋ Audit access
Underlies EnTICE3 and other components
Conclusions• Significant barriers to research participation exist for
populations at high risk for health disparities• Community engagement approaches essential to reach
such participants• Ethical imperative to return data to those that
contribute it in a way that is comprehensible and actionable for improving health
• Important component of a learning health system• Requires continued engagement and iterative