This bulletin which has been published previously as Livestock Statistical Bulletin will be renamed as Livestock Information Bulletin from this issue onwards. 1. Present Status of the Poultry Breeder Farm Operations in Sri Lanka. Poultry is the most developed livestock sub sector in Sri Lanka. Both poultry breeder farms (Grand Parent & Parent) and commercial farms are in operation within the country. Day old chicks (DOC) required for the production in commercial poultry farms are supplied by poultry parent farms (broiler & Layer). As per the regulations under Animal Diseases Act No 59 of 1992, all the poultry breeder farms and hatcheries in Sri Lanka should be registered in the Department of Animal Production and Health (DAPH) and such registration should be renewed annually. For the year 2014, 41 farms, including 3 grandparent farms, had been registered in DAPH. To collect the information on present situation of the breeder farms, a rapid appraisal on poultry parent farms was conducted by DAPH during June to October, 2014. During this programme, 35 registered parent farms in 59 locations were visited and production data were collected. Two farms were functioning as mixed farms having both broiler and layer breeds within single premise. Out of the remaining 33 farms, 23 were broiler parent farms (37 locations), 9 were layer parent farms and the other was again a mixed farm with separated layer and broiler operations in 4 locations. Majority of the parent farms were running as multistage farms. 48% of them used environmentally controlled housing system. 1.1 Broiler Industry Considering the present DOC production, broiler industry produces nearly 8 times that of the layer industry. There are 3 broiler grand parent farms which was 2 in 2012 supplying DOC to parent farms. Therefore importation of broiler parent DOC has been reduced. During the year 2014, 226,192 parent female DOC had been imported. This accounts to a 30.2% reduction to that of 2013. Though the importations had been reduced, availability of DOC remains more or less equal with 1,185,352 total broiler parent female DOC purchase in 2013 and 1,180,286 in 2014. Total farm capacity of broiler breed exceeds 1.2 million at present. Scale of operation ranges from 3,000 to 92,578 from which more than 42% farms having >30,000 heads. Though broiler parent farms have the potential of producing 2,641,184 chicks per week it has been limited to 2,098,492 per week due to marketing limitations in 2014. Still, a growth of the sector is being observed resulting 116.99 million broiler chick production in 2014 when compared to 110.7 million in 2013. Information Bulletin Department of Animal Production and Health Volume 7 2014 Issue 1 ISSN 2448-9792 Contents Page No. Present Status of the Poultry Breeder 01 Farm Operations in Sri Lanka. Fluctuation of Chicken Egg Prices (2013-2014) 02 Poultry Feed Production in Sri Lanka 03
Transcript
This bulletin which has been published previously as Livestock Statistical Bulletin will be renamed as Livestock Information Bulletin from this issue onwards.
1. Present Status of the Poultry Breeder Farm Operations in Sri Lanka.
Poultry is the most developed livestock sub sector in Sri Lanka. Both poultry breeder farms (Grand Parent & Parent) and commercial farms are in operation within the country. Day old chicks (DOC) required for the production in commercial poultry farms are supplied by poultry parent farms (broiler & Layer). As per the regulations under Animal Diseases Act No 59 of 1992, all the poultry breeder farms and hatcheries in Sri Lanka should be registered in the Department of Animal Production and Health (DAPH) and such registration should be renewed annually. For the year 2014, 41 farms, including 3 grandparent farms, had been registered in DAPH. To collect the information on present situation of the breeder farms, a rapid appraisal on poultry parent farms was conducted by DAPH during June to October, 2014. During this programme, 35 registered parent farms in 59 locations were visited and production data were collected. Two farms were functioning as mixed farms having both broiler and layer breeds within single premise. Out of the remaining 33 farms, 23 were broiler parent farms (37 locations), 9 were layer parent farms and the other was again a mixed farm with separated layer and broiler operations in 4 locations. Majority of the parent farms were running as multistage farms. 48% of them used environmentally controlled housing system.
1.1 Broiler Industry
Considering the present DOC production, broiler industry produces nearly 8 times that of the layer industry. There are 3 broiler grand parent farms which was 2 in 2012 supplying DOC to parent farms. Therefore importation of broiler parent DOC has been reduced. During the year 2014, 226,192 parent female DOC had been imported. This accounts to a 30.2% reduction to that of 2013. Though the importations had been reduced, availability of DOC remains more or less equal with 1,185,352 total broiler parent female DOC purchase in 2013 and 1,180,286 in 2014.
Total farm capacity of broiler breed exceeds 1.2 million at present. Scale of operation ranges from 3,000 to 92,578 from which more than 42% farms having >30,000 heads. Though broiler parent farms have the potential of producing 2,641,184 chicks per week it has been limited to 2,098,492 per week due to marketing limitations in 2014. Still, a growth of the sector is being observed resulting 116.99 million broiler chick production in 2014 when compared to 110.7 million in 2013.
Information BulletinDepartment of Animal Production and Health
Volume 7 2014 Issue 1
ISSN 2448-9792Contents Page No.
Present Status of the Poultry Breeder 01Farm Operations in Sri Lanka.
Fluctuation of Chicken Egg Prices(2013-2014) 02
Poultry Feed Production in Sri Lanka 03
Volume 7 2014 Issue 1
Page 2
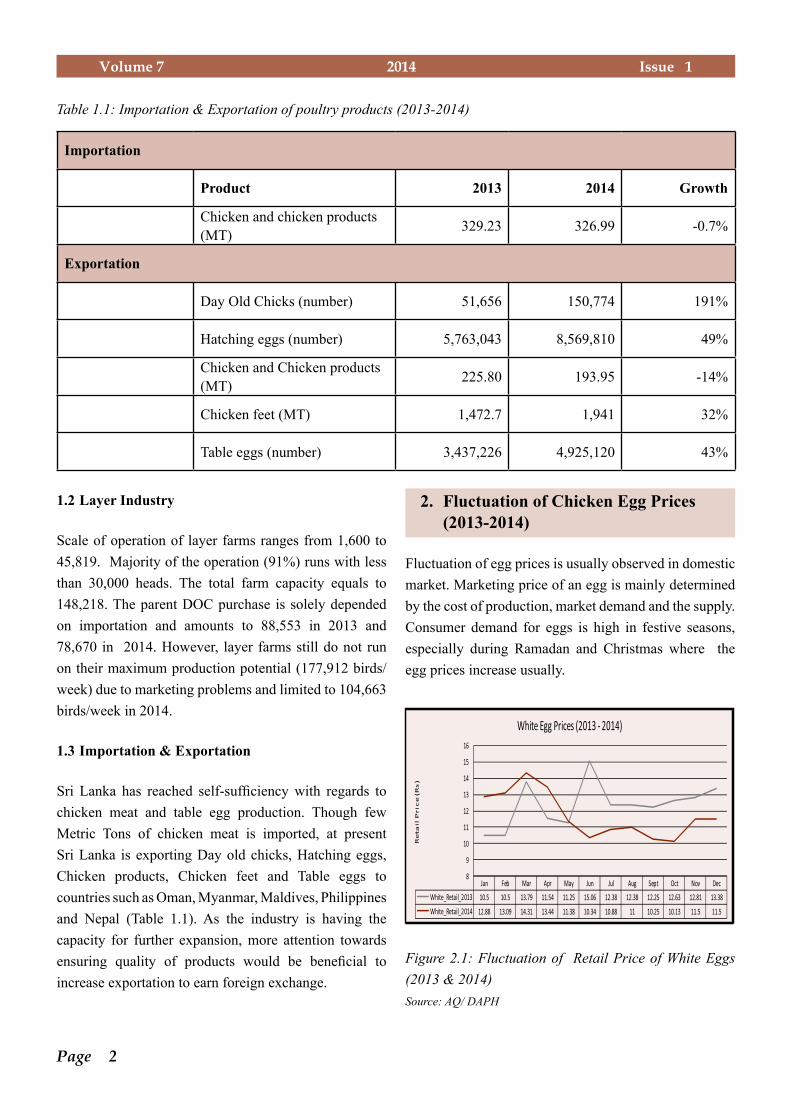
Table 1.1: Importation & Exportation of poultry products (2013-2014)
Importation
Product 2013 2014 Growth
Chicken and chicken products (MT) 329.23 326.99 -0.7%
Exportation
Day Old Chicks (number) 51,656 150,774 191%
Hatching eggs (number) 5,763,043 8,569,810 49%
Chicken and Chicken products (MT) 225.80 193.95 -14%
Chicken feet (MT) 1,472.7 1,941 32%
Table eggs (number) 3,437,226 4,925,120 43%
1.2 Layer Industry
Scale of operation of layer farms ranges from 1,600 to 45,819. Majority of the operation (91%) runs with less than 30,000 heads. The total farm capacity equals to 148,218. The parent DOC purchase is solely depended on importation and amounts to 88,553 in 2013 and 78,670 in 2014. However, layer farms still do not run on their maximum production potential (177,912 birds/ week) due to marketing problems and limited to 104,663 birds/week in 2014.
1.3 Importation & Exportation
Sri Lanka has reached self-sufficiency with regards to chicken meat and table egg production. Though few Metric Tons of chicken meat is imported, at present Sri Lanka is exporting Day old chicks, Hatching eggs, Chicken products, Chicken feet and Table eggs to countries such as Oman, Myanmar, Maldives, Philippines and Nepal (Table 1.1). As the industry is having the capacity for further expansion, more attention towards ensuring quality of products would be beneficial to increase exportation to earn foreign exchange.
2. Fluctuation of Chicken Egg Prices (2013-2014)
Fluctuation of egg prices is usually observed in domestic market. Marketing price of an egg is mainly determined by the cost of production, market demand and the supply. Consumer demand for eggs is high in festive seasons, especially during Ramadan and Christmas where the egg prices increase usually.
Figure 2.1: Fluctuation of Retail Price of White Eggs (2013 & 2014)Source: AQ/ DAPH
Page 3
Volume 7 2014 Issue 1
Table 2.1: Price differences between Brown and White eggs (2009-2014)
Year 2009 2010 2011 2012 2013 2014
White Egg retail price (Rs)
9.32 12.34 9.88 11.9 12.37 11.72
Brown Egg retail price (Rs)
9.79 12.88 10.39 11.9 13.09 12.19
In year 2014 estimated cost of production of an egg was Rs10.33 and purchasing price of a brown egg was Rs11.56 which means the producer earn Rs1.23 per brown egg. The observation is similar to that in 2013 where the estimated cost of production per egg was Rs10.53 and purchasing price was Rs11.74 which means the producer profited Rs1.21 per egg. When the fluctuation patterns of retail prices in 2013 and 2014 were compared, it is evident that an unusual reduction of prices is observed from June to December, 2014 even if it includes Ramadan and Christmas seasons (Figure 2.1). Purchasing price of the eggs follows a similar fluctuation pattern hence an increment of production could be assumed as the possible reason for the observed difference between two years. This behavior is unusual and may affect the sustainability of the industry.
Figure 2.2: Pattern of egg purchasing price fluctuations (2000-2014)Source: LPE/DAPH
In Sri Lanka brown egg price is usually higher than the white egg price as shown in table 2.1. The thick egg shell in brown eggs reduce the mechanical damage during transportation. And in Sri Lanka, it seems there is a higher preference for the brown eggs in the market which may govern the price difference.
As shown in figure 2.2 there is a continuous increase in egg price. According to the trend analysis, the purchasing price of a brown egg could be expected to rise up to Rs12.85 (r2= 0.92) in 2015. In the same time cost of production could also be reduced to 10.25 (r2= 0.79) increasing the profit gain (Rs 2.60) by the producer.
3. Poultry Feed Production in Sri Lanka
Poultry industry in Sri Lanka is one of a major sub sectors in the livestock industry. It has shown a high growth rate over the past few years because poultry products are an essential food items in Sri Lankan menus. Demend for chicken and eggs are completely satisfied by the local producers. As a result poultry feed production has also rapidly increased.
As shown in figure 3.1 there is 24.2 % increase of poultry population in the period from 2009 to 2014 with a marked increase from 2012 to 2013. As a result of this increased population the demand for poultry feed has also gone up.
Figure 3.1: Change in poultry population
Table 3.1 and figure 3.2 shows the trends in poultry feed production. As shown in table 3.1 there is a conspicuous change in poultry feed production pattern during the
period considered.
Volume 7 2014 Issue 1
Page 4
Table 3.1: Poultry Feed Production
Year Commercial
Poultry Feed (MT)
Self-mixed Poultry Feed
(MT)Total (MT)
2009 272,562.95 207,221.88 479,784.80
2010 285,510.46 199,000.00 484,510.50
2011 386,253.13 208,000.00 594,253.10
2012 363,736.64 297,601.70 661,338.30
2013 384,872.40 384,217.50 769,089.90
2014 426,627.50 385,996.00 812,623.50
Source: DAPH Annual Reports
With the expansion of the industry, poultry feed production has incresed by 69.4% in 2014 when compared to 2009. However, the production of commercial poultry feed has increased only by 56.5% while the self mixed feed production has incresed by 86.3% during the same period. Considering the trends on production of both feed types it could be predicted that in 2015 the production of self mixed feed (411,734.1 MT, r2=0.9) and commercial feed
(417,590.1MT, r2=0.86) would be more or less equal. Therefore, if the growth of the industry continues in the same pattren as observed at present, the total poultry feed production will be closer to 829,324.2MT in 2015 with 49.6% contribution from self mixeres. Small scale producers which is the predominant may use their own formula due to high cost of commercial feed to maintain net profit. Although, this practice will help the small scale farmers to reduce the cost of production, the quality of those feed is questionable. Prevention of contamination of feeed raw materials will minimize these adverse effects of self mixed feed.
Contributors:Dr. (Miss) D. L. N. KumudinieMrs. R. WijesingheMiss. K. UdugamaMr. M. Jayasinghe
Livestock Planning and Economics Division Department of Animal Production and Health