Page 1
Information Channel Diagrams: An Approach for Modelling Information
Flows
Christopher Durugbo*, Windo Hutabarat, Ashutosh Tiwari and Jeffrey R. Alcock
School of Applied Sciences,
Cranfield University,
Bedfordshire,
MK43 0AL
United Kingdom
Corresponding author email: [email protected]
Telephone: +44 (0) 1234 750 111 Ext 5656
Abstract: : In this article, the ‘information channel diagram’ (ICD) approach is introduced as a diagrammatical
tool for modelling information flow during the delivery phase of organisations in which goods are deployed or
delivered to customers.
An initial review and evaluation of current tools for modelling information flow will be conducted based on the
characteristics of information flow during the delivery phases in organisations. Diagrammatic primitives and a
prescribed modelling methodology for developing an ICD will be presented, and a case scenario of the delivery
phase of an organisation within the health care sector will be applied to demonstrate the use of the ICD. The
article concludes by discussing some applications, generalisation potential and limitations of the ICD approach.
Keywords: Information flow; Diagrammatic modelling; Conceptual design; Function-orientation; Delivery
phase; Product-service systems
li2106
TextBox
Journal of Intelligent Manufacturing, Volume 22, Issue March, 2011, pp1-13
Page 2
1. INTRODUCTION
1.1. Research Background
According to Firesmith and Henderson-Sellers (2002) the delivery phase for organisations can be defined as the
phase during which work products are deployed to end users. Sundin (2009) defined the delivery phase as ‘the
delivery of products and installation’. This phase is characterised by a range of extensive services to aid the use
of products that have been paid for. These services include making technicians available for product installation,
online and telephone staff to support product use and installation. Wang and Das (2001) defined the delivery
phase as the flow of goods ‘from the seller to the buyer’. This flow is part of a transaction that is ‘finally
committed as soon as the seller delivers appropriate goods to the buyer’.
Within the delivery phase, information is important for two main reasons: firstly, as an input parameter for
strategising the delivery process and secondly, as a control measure for achieving high-level delivery
performances (Fawcett et al. 1997; Hicks et al. 2006). Furthermore, the flow, deployment or delivery of goods
in modern supply chains and businesses is characterised by the concurrent flow of information that is analysed
for: improving customer service i.e. information exchanges between customers and sales teams (Iskanius et al.
2004), and ‘flow fulfilment’ in which customers are updated on the progress of orders (Childerhouse et al.
2003).
Analysing information flow is an important design challenge with origins in the 1960s and early 1970s (Kusiak
et al 1994), and modelling information flow is the first step in an information flow analysis methodology
(Macintosh 1997; Yan et al. 1999) that is achieved through mathematical (Lo Storto et al. 2008) and
diagrammatical (Ball et al. 2004; Jorgensen 1998) techniques. Mathematical modelling offers a useful avenue
for analysing organisations to reveal mathematical properties that underlie organisational structures and
processes (Collins et al. 2009). However, diagrammatic modelling tools are usually applied and preferred
because they require less storage and are processed more efficiently by humans in comparison to textual
representation and documents (Sen 1992).
1.2. Aim of Paper
This paper introduces the ‘information channel diagram’ (ICD) – as an approach for modelling information
flow. The aim of the paper is to propose diagrammatical representations for modelling exchanges involving
information flow during the delivery phase for organisations.
1.3. Research Focus
Concentrating on function-oriented modelling, Durugbo et al. (2010a) identified existing diagrammatic tools
that can be used to model information flow in organisations. These tools include Data Flow Diagrams (DFDs),
Integrated DEFinition method of modelling functionality and information modelling (IDEFØ and IDEF1),
Graphes à Résultats et Activités Interreliés (GRAI) grids and nets, Petri nets (PNs), Input-Process-Output (IPO)
diagrams and Design Structure Matrices (DSMs). The reader is referred to the review paper by Durugbo et al.
(2010a) for the origin, concept and applications of existing diagrammatic tools for modelling information flow.
To guide information flow managers, diagrammatic tools can include prescribed modelling methodologies. For
instance, a DFD can be developed based on two different modelling methodologies: explosion (also applied in
the IDEF methodology) in which each successive model is derived as an explosion from a single activity step in
a parent or preceding diagram, and expansion in which a single diagram is iteratively expanded till the entire
system has been comprehensively modelled (Durugbo et al. 2010a).
Also, for effective use of diagrammatic models in design, it has been suggested that existing diagrammatic tools
be assessed based on their ability to aid perceptual (for thorough grasp of meaning) and conceptual (for
hypotheses development) cognitive processes (Hungerford et al. 2004). This assessment aids designers and
researchers in systematically identifying modelling requirements of intended tool users that may then be applied
in: selecting tools that meet user requirements, combining tools to create a hybrid version for use in modelling
organisation characteristics, modifying tools to meet user requirements, or developing new tools to fill existing
gaps or fulfil user requirements (Durugbo et al. 2010a).
Page 3
The focus of this paper is to identify the characteristics of information flow during delivery exchanges that
involve customers and manufacturers, and to make use of these characteristics to propose diagrammatic
primitives for modelling information flow. In order to accomplish this, current needs for information flow
modelling during delivery will be analysed, and the ICD approach will be introduced and demonstrated using a
case scenario of delivery within the health care sector.
1.4. Structure of the Paper
The remainder of this paper is structured as follows. §2 describes the research methodology for the paper. §3
introduces the Information Channel Diagram (ICD) approach as a set of diagrammatic primitive and modelling
methodology that was then used in an example scenario to demonstrate how a model of information flow could
be created using the approach. Finally, §4 discusses some possible applications, generalisation potential and
limitations of the ICD approach within the context of research for modelling information flow.
2. RESEARCH METHODOLOGY
An analytical, applied research methodology (Kumar 1996) was adopted for this research. The research began
analytically to evaluate delivery phase characteristics used in the development of the proposed approach and the
information used during in this evaluation was derived from literature. The research methodology then moved
on to address the problem identified following the evaluation of delivery phase characteristics.
The analytical, applied approach adopted in this paper is typical of model development approaches such as
DeMarco (1979) for DFD and Doumeingts (1989) for GRAI. In these approaches, researchers have initially
captured the practise in industry through case studies, evaluated existing tools in terms of current needs and
proposed new tools to meet current needs through the reuse, adaptation and introduction of diagrammatic
primitives.
The research methodology for creating the ICD approach is implemented through five main stages:
characteristics identification, tools evaluation, approach development, approach demonstration, and approach
comparison with pre-existing tools, as shown in Fig. 1.
2.1. Characteristics identification
Focusing on information flow during the delivery phase of organisations, an empirical study was carried out to
capture delivery phase information flow characteristics (Durugbo et al. 2010b). The study was based on a
sample of microsystems companies. It captured information flow characteristics with regards to ‘what managers
of information flow during the delivery of microsystems would like to better understand and represent’. The
findings are summarised in Table 1.
2.2. Evaluation of current modelling tools
The information presented in Table 1 represents a set of criteria - the required representations of information
flow - which can be used to assess currently available tools.
These criteria were used to evaluate each of the modelling tools identified in §1 i.e. DFDs, IDEFØ and IDEF1,
GRAI grids and nets, PNs, IPO diagrams and DSMs. The output of this assessment is presented in Tables A1-
A6 (see Appendix).
The evaluation showed that for two required representations, roles of company personnel and multiple channels,
primitives were not present in any of the tools. Furthermore, for another six representations, primitives were
inadequate for effective representation. This evaluation is summarised in Fig. 2.
2.3. Approach Development
The ICD approach is developed in this paper to fulfil the design goal of ‘assisting information managers
effectively represent and understand delivery phase information flow’. To fulfil this goal, ICD offers two
Page 4
elements, firstly, a set of diagrammatic primitives to depict information flow, secondly, a user method for using
the primitives to create information flow models.
2.3.1. Diagrammatic Primitives
To create the primitive set, the approach outlined in Fig. 2 was followed. Diagrammatic primitives were reused,
modified, adopted or introduced as follows:
1. Roles of company personnel: ‘swim-lanes’ were adapted from existing literature to depict roles during
interactions. Swim lanes are primitives commonly used in business process modelling (e.g. Kim et al.
(2005)) to represent ‘what’ or ‘who’ is involved in a process.
2. Multiple channels: three forms of squares, novel primitives, were introduced to depict verbal, written and
electronic forms that are the main communication channels in modern organisations (Yazici 2002). Verbal
forms refer to face-to-face interactions and word of mouth, written forms include paper copies of
documents such as newsletters, receipts and reports, while electronic forms consist of electronic mails,
spreadsheets and so on.
3. Timing of processes: to represent timing of processes, rectangles used to depict processes in modelling tools
such as DFD and IDEF were modified by including a label within each rectangle to indicated estimated
process time.
4. Collaborative processes: to show collaborative processes, rectangles indicating processes were allowed to
stretch across multiple swim-lanes.
5. Harmonising flows: to represent internal and external flows, arrows used in existing modelling tools were
reused.
6. Information flow path: lines used in existing tools were adapted for use in the ICD approach to depict links
for flow paths between processes or people. The purpose of adopting lines in the ICD approach was to
extend their use to fill multiple identified gaps. These depicted links offer avenues for enabling what Lin
and Cheng (2007) have termed ‘relationship flows’.
7. Contextualised information: lines were assigned colour-coding to show how information can be
contextualised
8. Synchronised communication channels: to show how communication channels can be synchronised, lines
used to depict links were allowed to contain squares that are positioned in series or parallel
9. Information sharing: open ended rectangles that indicate data stores in DFD were modified by fusing each
data store with a square to depict information sharing in terms of both the means for sharing the information
and the source of the information (data store).
2.3.2. Deriving the user method for creating information flow model
Deriving a user method for creating an information flow model was a two stage process. In the first, existing
literature methods were assessed and one selected. In the second, this method was adapted in detail as a user
method for creating ICDs.
Functional composition (Jorgensen 1995) was selected from the literature, because, unlike existing methods
used in creating information flow models (such as explosion and expansion), composition enables users to
methodically populate models by increasingly adding and connecting primitives for creating a chain of
primitives. Outside the information flow domain, functional composition is a well established practise in
software development, in which chains of functions are increasingly added to create subroutines and procedures
To adopt functional composition as a method for ICD, a set of design steps (i.e. procedures) was formulated by
the authors: (i) to initially represent diagrammatic primitives with associations to other primitives within the
ICD approach (i.e. primitives with higher dependencies) and (ii) to increasingly add diagrammatic primitives
with a view to creating a complete ICD. This user method is detailed in §3.2
2.4. Approach demonstration
In a previous work (Durugbo et al. 2009) the authors of this paper studied the efficiency of information flow in
the delivery phase by a major healthcare organisation. The scenario studied in that paper is used here as an
example to show the creation of an ICD.
Page 5
The example was selected for familiarisation and simplicity purposes. In the demonstration of the ICD, the
scenario for the delivery phase within the health sector is identified, the steps for information flow are captured
and an ICD based on the steps is produced
2.5. Comparison of the ICD approach with pre-existing tools
To compare the ICD approach against pre-existing tools, ICD was assessed against the original criteria (Table 1)
used to assess existing modelling tools. This evaluation is presented in Table 4.
3. INFORMATION CHANNEL DIAGRAMS
In this section, the information channel diagram (ICD) approach is introduced as a modelling tool based on a set
of diagrammatic primitives, and a prescribed modelling methodology for creating information flow models.
3.1. Diagrammatic Primitives
Table 2 shows the nine diagrammatic primitives and the arrangements to fulfil the needs of the information flow
characteristics of the delivery phase in an organisation. In the table, the first three diagrammatic primitives
concentrate on representing interactions whereas the fourth and fifth focus on representing processes. The sixth
and seventh diagrammatic primitives represent coordination while the eighth and the ninth represent
streamlining. Each is now described below.
Primitive Set 1: Representing Interactions
Each swim-lane in the ICD is labelled with task roles during information flow (such as information manager or
principal engineer). The swim-lanes also contain processes that each role is responsible for.
Paths for information flow are shown as arrows along lines that link or network organisational processes. Each
arrow is unidirectional and points in the direction to which information flows. If the direction of flow is towards
a process, then the arrow is placed above the link whereas feedbacks are shown below the links. Arrows are also
accompanied with a short description of the type of information that is flowing from one process to the next.
The arrows used in the ICD offer features to aid manager of information flow to understand how information
flow can be coordinated.
Representing multiple channels of communication is proposed in the ICD approach by means of three types of
labelled squares: completely shaded boxes to indicate information and communication technologies (ICTs) such
as emails, telephone or similar means for communication based on technology, clear boxes folded at the bottom
right corner to indicate documented forms of communication i.e. document flow, and boxes containing
intersecting diagonals to depict face-to-face interactions mostly one-on-one and group meetings.
Primitive Set 2: Representing Processes
Processes for the ICD are represented as labelled rectangles. Each rectangle is labelled with a process number
and the estimated time for each process is positioned below the bottom right corner of the rectangle.
The rectangles can be stretched across several swim-lanes to show collaborative processes. For instance, if a
process is stretched across the swim lanes for a manager and systems designer, then it implies that the process
may require collaboration between the manager and system designer.
Primitive Set 3: Representing Coordination
Within the ICD approach, the representation of how communication channels can be synchronised is done: in
series to show how one communication channel can be used to reinforce another channel, or in parallel to depict
alternative channels that are available for information flow. For instance, if a customer can call, email or write to
make an enquiry, then the available channels are in parallel. Similarly, if an information manager responds to an
enquiry via email followed by a telephone call, then the communication channels are in series.
Page 6
To aid in the representation of how internal and external flows can be harmonised, the swim-lane (role) of
information managers can be depicted first, in the centre of the ICD. Next, external roles (particularly the
customer), are depicted to the left of the information manager’s swim-lane. Internal roles such as technicians
and business directors are then depicted to the right of the information manager’s swim-lane.
Primitive Set 4: Representing Streamlining
Contextualised information is an option within the ICD represented by means of different colours for process
links and flows. Colours to contextualise information can also used for the label ascribed to each swim-lane (for
roles) at the discretion of the ICD user.
The open ended rectangle, the primitive used to represent data storage in the DFD is adopted and customised for
use in the ICD to depict information sharing. Each open ended rectangle labelled with a unique identifier (as in
DFD) is also fused with squares, as shown in Table 2, to indicate the type of media form used to store and share
information. For instance a completely shaded box would indicate data or information stored via telematics such
as email, word documents or spreadsheets.
3.2. Methodology for creating information flow models
For the creation of an ICD, four steps are prescribed, as shown in Table 3, to describe how collected data about
information flow in organisations can be transformed into diagrammatic models. In each step, primitive sets are
increasingly added to populate the ICD. These steps are now described as follows:
Modelling Step 1: Depicting Roles
The creation of ICDs begins with identifying the roles in the organisational scenario(s) extracted from the data
collection process. These roles are depicted as swim lanes positioned side-by-side with the option of using
different colours for each swim-lane left to the discretion of ICD users.
Modelling Step 2: Positioning Processes
The next step in the development of the ICD involves positioning processes within a swim-lane or over multiple
swim-lanes (to depict collaborative processes) for roles to take ownership and be responsible for processes. The
estimated time for each process is also included. For each process, a number format is defined depending on the
degree to which a function is decomposed. Three levels of decomposition (function → task → process) are
applied as a guide for the technique to ensure a function can be sufficiently broken up into a set of activities.
Each level of decomposition is assigned an additional digit. This assignment is continued till the lowest level
where processes are described. The first digit represents functions in the organisations; the second represents
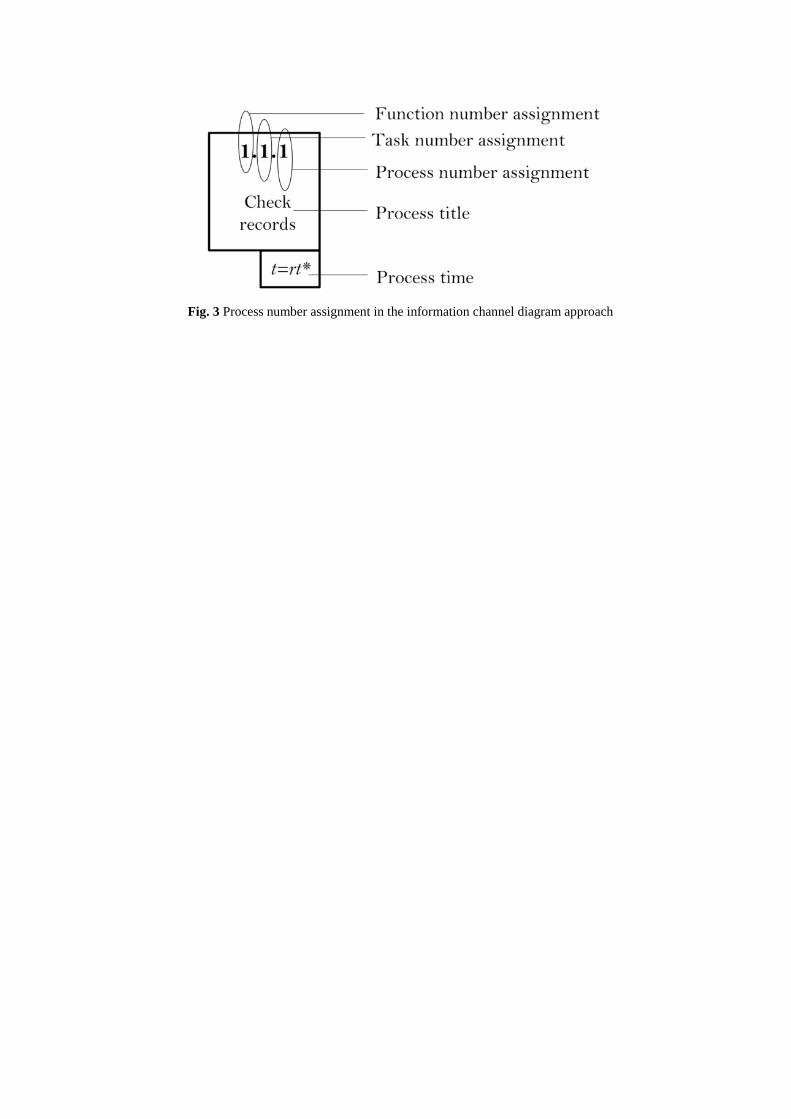
tasks carried out as part of the function; while the third represents processes. For instance, Fig. 3 shows a
process to ‘check records’ (labelled as 1.1.1.), that is part of a task to manage customer sales records (labelled as
1.1.), that is part of a sales function (labelled as 1).
Modelling Step 3: Introducing Information flow links
Next, links are introduced to depict relationships that exist between roles during delivery processes. Since the
focus of the ICD is for modelling information flows during delivery exchanges that involve customers and
manufacturers, the links between processes are labelled with arrows depicting the flow of information. Labels
that are above links represent feed-forward paths whereas labels below links depict feed-back paths.
Also, depending on the scenario, information flow may involve the aggregation of new information or the
extraction of information for storage. Where this is the case, links can be connected to other links to represent
aspects such as access or exchange involving a data store, or modification of information for granularity /
transparency.
The introduction of information sharing with an ICD follows the labelling of links and is done in a similar
manner to step 2 i.e. introduced information sharing primitives are positioned in a swim lane for roles to take
responsibility for storing and sharing information.
Page 7
Modelling Step 4: Representing Communication Channels
The final step in the creation of the ICD is the representation of communication channels. In the ICD, different
forms of communication channels can be used to describe available means for accessing and transferring
information and can be represented in two ways: sequentially and concurrently. In sequentially represented
communication channels, the flow of information involves the use of two or more media forms or interactions.
For instance, a telephone call followed by an email would be considered serial communication channels in the
ICD. Similarly, in concurrently represented communication channels, the flow of information entails the
availability of alternate media forms or interactions. For example, a customer may send an email or make a
phone call to make an enquiry.
In some cases, succeeding processes may make use of the same communication channels as a preceding process.
In these cases, it is not necessary to repeatedly depict the channels in the succeeding processes.
3.3. Case Scenario: Delivery within the Health Care Sector
Durugbo et al. (2009) used here as a case study centres on the operations of a major healthcare organisation that
offers ‘service agreements’. This service agreement involves delivering mission-critical equipment backed, with
24 hour service for remote clinical and technical expertise. In the solution, products delivered to client
businesses (i.e. customers) included X-ray machines, computed tomography (CT), magnetic resonance (MR),
ultrasound and nuclear medicine imaging equipment, whereas services delivered included software updates,
planned maintenance and parts replacement. In the scenario, a laboratory technician from a client business
makes a request and receives replacement parts and maintenance for a CT machine. The focal point in the
scenario is the information flow involving the support staff (as the manager of information flow) which contains
eight steps: Technician requests service → Support staff checks service → Support staff checks orders →
Support staff updates orders → Support staff places order for service → Support staff gives feedback (to
technician) → Support Staff gets feedback (from service team) → Support staff updates record.
Using the methodology of §3.2, a description of information flow, as shown in Fig. 4, can be presented using the
ICD approach in four steps.
For the first step, the three different roles identified in the scenario i.e. the lab technician, customer support and
service team, are depicted in swim-lanes. The customer support role is positioned in the middle because it
interacts with the lab technician, a role external to the healthcare organisation, and the internal
parts/maintenance staff. Consequently, the swim-lanes of the lab technician and the parts/maintenance staffs are
depicted to the left and right respectively of the customer support.
The second step involves positioning the eight processes, derived from the eight steps described in scenario,
within the depicted swim-lanes. These processes are derived as follows: ‘request service’, ‘check services’,
‘check orders’, ‘update orders’, ‘place order’, ‘support feedback’, ‘customer feedback’ and ‘update services’.
Apart from the process in which the technician orders a service and the service team gives feedback to the
support staff, the rest of the processes are positioned within the swim-lane of the customer support. Each process
is part of a ‘service delivery’ task, which in turn is part of a ‘delivery’ function. Processes are labelled using the
scheme introduced in §3.2, starting from 1.1.1 and ending at 1.1.8. In Durugbo et al. (2009), no indication is
given as to process timing, consequently, in this scenario, times for processes are estimated and used for
illustration purposes.
For the third step, links for enabling the flow of information are introduced (and labelled) to connect processes
and to show exchanges that involve data retrieval/ storage (and sharing of information). In the example, two
records held by the customer support for data retrieval/ storage of orders and services are captured. The order
records are accessed by the process to ‘check orders’ and modified by the ‘update orders’ process. Similarly,
the service records are accessed by the ‘check service’ process and modified by the ‘update services’ process.
The fourth step entails representing the communication channels used in the scenario, mainly telephone
conversations, e-mails, spreadsheets and company meetings as shown in Fig 4. Since, the communication
channels used by process 1.1.1 are the same for succeeding processes 1.1.2 to 1.1.4, these communication
channels are not replicated for processes 1.1.2 to 1.1.4. Similarly, the communication channels for 1.1.6 are not
replicated since they are the same as those for 1.1.5.
Page 8
4. DISCUSSION
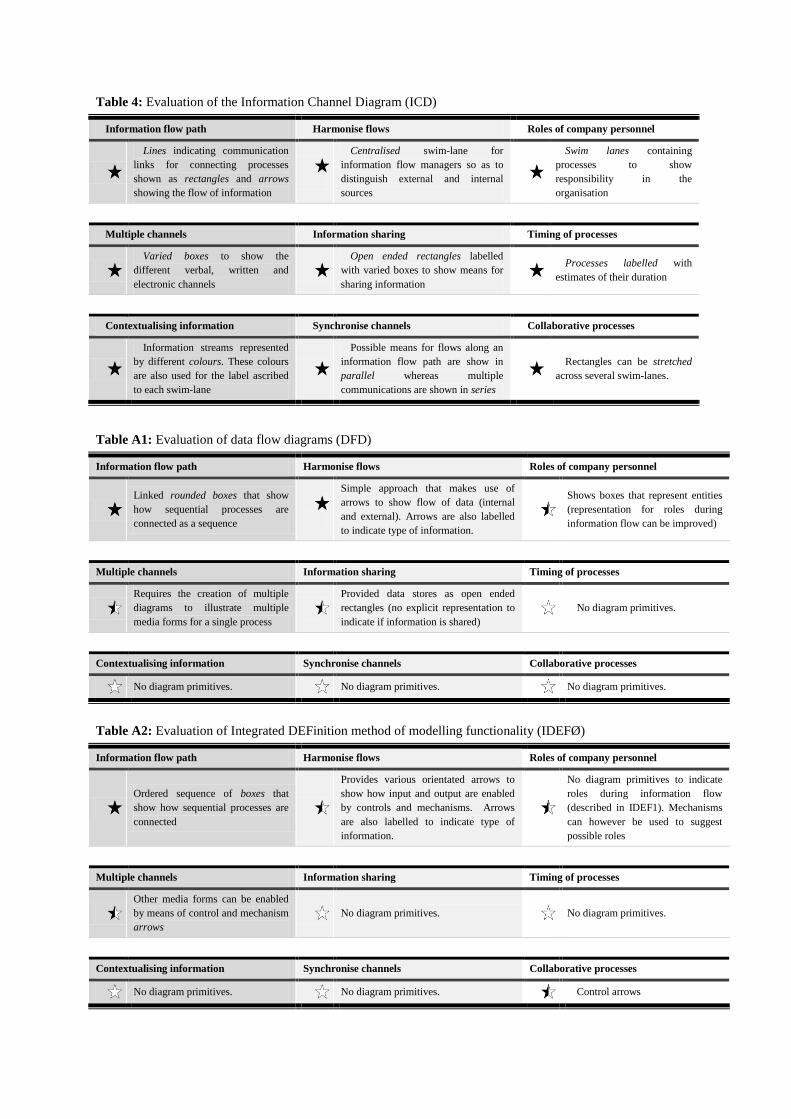
In Table 4, the ICD approach is evaluated based on the star-based system, introduced in §2.2 (and described in
the Appendix), with regards to the representations required by managers of information flow. The table
demonstrates coverage of the required representations for the delivery phase in organisations.
This section highlights and discusses some important applications, generalisation potential and limitations of the
proposed ICD approach. Possible future research directions are also discussed.
4.1. Applications of the Information Channel Diagram
During delivery phases, the ICD approach can be applied in two main ways: delivery information flow
management and delivery role definition.
Within an ICD, where possible, the manager of delivery information flow (for which the ICD is proposed) must
be positioned centrally to distinguish external and internal information flows. It is for this reason that the
creation of an ICD begins with the depiction of the role of the ‘information flow manager’ such as information
professionals (Hibberd and Evatt 2004), web masters (Van der Walt and Van Brakel 2000) and chief
information officers (Gottshalk 2002).
Flow management for information exchanges with customers located to the right of the information flow
manager, as shown in §3.3, could then be analysed for managing and improving customer service. Internal
information exchanges with staff to the left of the information flow manager could also be analysed for defining
control policies such as delivery data storage/ privacy and information sharing.
Using the ICD approach, the roles of staff could be defined for delivery tasks that are allocated in relation to
organisational structures such as: management information systems, communication channels, delivery
networks, business processes, databases and decision support system. These structures could be particularly
useful for defining the physical layout in modern organisations by illustrating roles that require interactions and
access to common delivery information. The illustration of roles could then be used as a guide in the positioning
of organisational departments
4.2. Generalisation Potential of the Information Channel Diagram
The two main applications of the ICD approach identified in §4.1 were discussed within the context of delivery.
However, due to the focus of the ICD on primitives for organisational characteristics, the use of the tool could
be extended for modelling other areas of an organisation and could potentially support the ability of firms to
leverage ICTs, a concept termed competitive networking (Malecki 2002). The ICD approach supports
competitive networking by enabling organisational designers and analysts to visualise links and communication
channels within which ICTs are used. In addition to visualising ICTs as electronic communication channels, the
ICD approach also illustrates verbal (face-to-face interactions) and written (paper documentation)
communication channels.
Based on these communication channels, competitive networking within organisations could then be enhanced
through the use of features captured by the ICD approach such as: number of organisational roles, level of
individual and collaborative tasks, data storage required, and concentration of information flow.
4.3. Limitations of the Information Channel Diagram
As mentioned earlier, the ICD approach like most diagrammatic modelling tools requires less storage and is
processed more efficiently in humans in comparison to textual representation and documents. However,
mathematical modelling is also required to reveal mathematical properties that underlie organisational structures
and processes. In addition, the ICD approach was developed based on ‘what managers of information flow
during the delivery of microsystems would like to better understand and represent’. Consequently, there is a
need to explore other delivery phase requirements of organisations from different domains. This could lead to a
more comprehensive model that fulfils delivery requirements across industry sectors promoting interoperability
within and across sectors. Furthermore, the ICD approach is a tool for modelling information flow in individual
and collaborative processes at a high-level of abstraction but is limited to point-to-point links between
Page 9
processes. The approach considers the dynamics associated with organisational roles and processes but aspects
such as integrity, privacy and confidentiality associated with information flow are not prescribed.
4.4. Future Research Directions
Prior works by authors such as Ellis (1989) and Stapel et al. (2007) have proposed and demonstrated the use of
novel diagrammatic tools for fulfilling the requirements of specific sectors such as administrative processes of
publishing firms and software development processes. Similarly, this article has proposed and demonstrated the
use of a novel tool, i.e. the ICD approach, for fulfilling the requirements of delivery processes.
Consequently, challenges exist to explore the usability of the ICD for other sectors and processes. There is
therefore a need to examine if the ICD can be generalised for different companies. Some specific research areas
that could be explored include the extent to which the ICD could be generalised, the performance of the ICD
against other tools and the correlation of tool performance across different sectors.
Potential users of the ICD, such as delivery personnel, could be asked to rank the performance of the ICD
against other tools. Appropriate scenarios for comparing the tools would also need to the identified and
generated when used in other sectors.
5. CONCLUSIONS
This article describes the ‘information flow channel’ (ICD) approach - a diagrammatical tool for modelling
information flow with a view to analysing delivery information exchanges. The delivery phase for organisations
is characterised by processes that enable the flow of products and services to customers.
The ICD approach contains a set of primitives for representing information flows during delivery exchanges that
involve customers and manufacturers and a prescribed modelling methodology for using the tool. The primitives
include: swim-lanes to represent roles during interactions, lines to depict process links, arrows to show
information flow, rectangles to show (individual and collaborative) processes and process times, varied squares
to illustrate communication channels (face-to-face interactions, paper documentation and, information and
communication technologies), and open ended rectangles tagged with squares to depict information sharing.
Coloured links and arrows are also used to depict how information flow can be contextualised.
The prescribed modelling methodology is based on diagrammatic composition i.e. increasingly adding
diagrammatic primitives to populate the information flow model in four main steps that depict roles, position
processes, introduce flow links and represent communication channels.
A case scenario of the delivery of integrated products and services within the health care sector was used to
demonstrate how the prescribed modelling methodology can be used to model information flow during the
delivery phase of organisations.
ACKNOWLEDGMENTS
The authors would like to extend their sincere thanks to the Engineering and Physical Sciences Research
Council (EPSRC), for its support via the Cranfield Innovative Manufacturing Research Centre (CIMRC),
towards the work carried out in the preparation of this paper.
REFERENCES
Ball, P., Albores, P., Macbryde, J. (2004). Requirements for modelling e-Business processes. Production Planning and
Control, 15 (8), 776-785.
Childerhouse, P., Hermiz, R., Mason-Jones, R., Popp, A., Towill, D. R. (2003). Information flow in automotive supply
chains - Identifying and learning to overcome barriers to change. Industrial Management and Data Systems, 103 (7), 491-
502
Collins, S. T., Bradley, J. A., Yassine, A.A. (2010). Analyzing product development task networks to examine
Page 10
organizational change. IEEE Transactions on Engineering Management, 57 (3), 513-525.
DeMarco, T. (1979). Structured analysis and system specification. Yourdon Press, New Jersey
Doumeingts, G. (1989). GRAI approach to designing and controlling advanced manufacturing systems in CIM environment.
In: Advanced Information Technologies for Industrial Material Flow Systems, Nof ,S. Y., Moodie, C. L. (eds.), NATO ASI
Series, Springer-Verlag, Berlin, 461-529
Durugbo C., Tiwari A., Alcock J. R. (2009). An info-dynamic engine approach to improving the efficiency of information
flow in a product-service system, Proceedings of the 1st CIRP IPS2 Conference, 107-112.
Durugbo C., Tiwari A., Alcock J. R. (2010a). A review of information flow diagrammatic models for product-service
systems. To appear in: International Journal of Advanced Manufacturing Technology
Durugbo C., Tiwari A., Alcock J. R. (2010b). Information flow for delivery performance: a study of microsystems
companies. To appear in: International Journal of Production Economics
Ellis, D. (1989). A behavioural approach to information retrieval design. Journal of Documentation, 46 (3), 318-38
Fawcet, S. E., Calantone, R., Smith, S. R. (1997). Delivery capability and firm performance in international operations.
International Journal of Production Economics, 51 (3), 191-204.
Firesmith D., Henderson-Sellers B. (2002). The OPEN Process framework: an introduction. Addison-Wesley, Harlow, Herts,
U.K.,
Gottschalk, P. (1999). Strategic management of IS/IT functions: The role of the CIO in Norwegian organizations.
International Journal of Information Management, 19 (5), 389-399.
Hibberd, B., Evatt, A. (2004). Mapping information flows: a practical guide, The Information Management Journal. 38(1),
58–64.
Hicks, B. J., Culley, S. J., McMahon, C. A. (2006). A study of issues relating to information management across engineering
SMEs. International Journal of Information Management, 26 (4), 267-289
Hungerford, B. C., Hevner, A. R., Collins, R. W. (2004), Reviewing software diagrams: a cognitive study, IEEE
Transactions on Software Engineering, 30 (2), 82-96
Iskanius, P., Helaakoski, H., Alaruikka, A.M., Kipinä, J. (2004). Transparent information flow in business networks by using
agents. IEEE International Engineering Management Conference, 3, 1342-1346.
Jorgensen, P. (1995). Software Testing, A Craftsman’s Approach, CRC Press, New York
Jorgensen, K. A. (1998). Information Modelling: foundation, abstraction mechanisms and approach. Journal of Intelligent
Manufacturing, 9 (6), 571-581.
Kim, K.H., Lee, J.H., Kim, C.M. (2005). A real-time cooperative swim-lane business process modeler, Lecture Notes in
Computer Science, 3480, 176-185
Kumar, R. (1996). Research methodology. Longman. London.
Kusiak A., Larson N., Wang J. (1994), Reengineering of design and manufacturing processes, Computers and Industrial
Engineering, 26 (3), 521-536
Lin, F., Cheng, T. C. E. (2007). The structural theory of general systems applied in management: The total relationship flow
management theorems. International Journal of General Systems, 36 (6), 673-681.
Lo Storto, C., D'Avino, G., Dondo, P., Zezza, V. (2008). Simulating information ambiguity during new product
development: A forecasting model using system dynamics. International Journal of Modelling, Identification and Control, 3
(1), 97-110.
MacIntosh, R. (1997). Business process re-engineering new applications for the techniques of production engineering.
International Journal of Production Economics, 50 (1), pp. 43-49.
Malecki, E.J. (2002). Hard and soft networks for urban competitiveness. Urban Studies, 39 (5-6), 929-945.
Sen, T. (1992). Diagrammatic knowledge representation, IEEE Transactions on Systems, Man and Cybernetics, 22 (4), 826-
830.
Stapel, K., Schneider, K., Lübke, D., Flohr, T. (2007). Improving an industrial reference process by information flow
analysis: A case study. Lecture Notes in Computer Science (including subseries Lecture Notes in Artificial Intelligence and
Lecture Notes in Bioinformatics), 4589, 147-159.
Sundin, E. (2009). Life cycle perspectives of product/service systems: in design theory, in Sakao, T., Lindahl, M. (eds.)
Introduction to Product/Service-System Design, Springer-Verlag, London
Wang G., Das A., (2001). Models and protocol structures for software agent based complex ecommerce transactions,
Lecture Notes in Computer Science, 2115, 121-131.
Van Der Walt, P., Van Brakel, P. (2000). Task analysis of the webmaster: results of an empirical study. Aslib Proceedings,
52(1), 20–38.
Yan, P., Zhou, M., Hu, B., Feng, Z. (1999). Modeling and control of workstation level information flow in FMS using
modified Petri nets. Journal of Intelligent Manufacturing, 10 (6), 557-568.
Yazici, H.J. (2002). The role of communication in organizational change: An empirical investigation. Information and
Management, 39 (7), 539–552.
Page 11
FIGURES
Fig. 1 Research methodology
Page 12
Fig. 2 Evaluation of current modelling tools
Page 13
Fig. 3 Process number assignment in the information channel diagram approach
Page 14
Fig. 4 Information channel diagram for the customer enquiry scenario
Page 15
TABLES
Table 1: Delivery phase representations required by information flow managers (table data taken from Durugbo
et al. (2010b))
Information flow characteristics Representation required by managers of information flow
Delivery interactions
1. roles of company personnel
2. information flow path
3. multiple channels
Delivery processes 4. timing of processes
5. collaborative processes
Information flow coordination 6. synchronise communication channel
7. harmonise flows
Information flow streamlining 8. contextualised information
9. information sharing
Table 2: Diagrammatic primitives and arrangements of the information channel diagram approach
Page 16
Table 3 Composition methodology for creating information channel diagrams
APPENDIX
A star-based system was adopted to evaluate each modelling tool based on the representations required by
managers of information. Each cell in tables A1-A6 was inspected to ascertain if current tools offered
diagrammatic primitives for representing delivery phase information flow. Corresponding cells of each of the
tables were also inspected to identify ‘gaps’ in the evaluated tools with a view to summarising the design goal of
the research.
Key:
A completely shaded star ( ) implies that the modelling tool provides basic primitives to represent what is
required.
A partially shaded star ( ) indicates that the modelling tool provides primitives that are related to what is
required.
A clear star ( ) shows that the modelling tool does not provide any primitives to represent what is required.
Page 17
Table 4: Evaluation of the Information Channel Diagram (ICD)
Information flow path Harmonise flows Roles of company personnel
Lines indicating communication
links for connecting processes
shown as rectangles and arrows
showing the flow of information
Centralised swim-lane for
information flow managers so as to
distinguish external and internal
sources
Swim lanes containing
processes to show
responsibility in the
organisation
Multiple channels Information sharing Timing of processes
Varied boxes to show the
different verbal, written and
electronic channels
Open ended rectangles labelled
with varied boxes to show means for
sharing information
Processes labelled with
estimates of their duration
Contextualising information Synchronise channels Collaborative processes
Information streams represented
by different colours. These colours
are also used for the label ascribed
to each swim-lane
Possible means for flows along an
information flow path are show in
parallel whereas multiple
communications are shown in series
Rectangles can be stretched
across several swim-lanes.
Table A1: Evaluation of data flow diagrams (DFD)
Information flow path Harmonise flows Roles of company personnel
Linked rounded boxes that show
how sequential processes are
connected as a sequence
Simple approach that makes use of
arrows to show flow of data (internal
and external). Arrows are also labelled
to indicate type of information.
Shows boxes that represent entities
(representation for roles during
information flow can be improved)
Multiple channels Information sharing Timing of processes
Requires the creation of multiple
diagrams to illustrate multiple
media forms for a single process
Provided data stores as open ended
rectangles (no explicit representation to
indicate if information is shared) No diagram primitives.
Contextualising information Synchronise channels Collaborative processes
No diagram primitives. No diagram primitives. No diagram primitives.
Table A2: Evaluation of Integrated DEFinition method of modelling functionality (IDEFØ)
Information flow path Harmonise flows Roles of company personnel
Ordered sequence of boxes that
show how sequential processes are
connected
Provides various orientated arrows to
show how input and output are enabled
by controls and mechanisms. Arrows
are also labelled to indicate type of
information.
No diagram primitives to indicate
roles during information flow
(described in IDEF1). Mechanisms
can however be used to suggest
possible roles
Multiple channels Information sharing Timing of processes
Other media forms can be enabled
by means of control and mechanism
arrows No diagram primitives. No diagram primitives.
Contextualising information Synchronise channels Collaborative processes
No diagram primitives. No diagram primitives. Control arrows
Page 18
Table A3: Evaluation of Graphes à Résultats et Activités Interreliés (GRAI) grids
Information flow path Harmonise flows Roles of company personnel
Compact grid showing the flow of
information between processes that
are marked as cells
Shows the flow of information as
arrows that are transferred to internal
sources in manufacturing processes
No diagram primitives to indicate
roles during information flow.
(rather initial and final states for
decision making in systems are
described)
Multiple channels Information sharing Timing of processes
Requires the creation of multiple
diagrams to illustrate multiple
media forms for a single process No diagram primitives.
Labels grids with timescales to
show estimated (or actual) process
duration
Contextualising information Synchronise channels Collaborative processes
No diagram primitives. No diagram primitives. No diagram primitives.
Table A4: Evaluation of Petri Nets (PNs)
Information flow path Harmonise flows Roles of company personnel
Order sequence of bubbles that
show connection and various
process relationships
Provides unlabelled arrows showing
direction of flow. No diagram primitives.
Multiple channels Information sharing Timing of processes
Requires the creation of multiple
diagrams to illustrate multiple
media forms for a single process No diagram primitives. No diagram primitives.
Contextualising information Synchronise channels Collaborative processes
No diagram primitives. No diagram primitives. No diagram primitives.
Table A5: Evaluation of Input-Process-Output (IPO) diagrams
Information flow path Harmonise flows Roles of company personnel
A set of ordered boxes that
represents inputs, processes and
outputs
Describes the inputs and outputs in
boxes that flow in and out of processes No diagram primitives.
Multiple channels Information sharing Timing of processes
Can be textually described in the
boxes provided for input, process
and output No diagram primitives. No diagram primitives.
Contextualising information Synchronise channels Collaborative processes
No diagram primitives. No diagram primitives. No diagram primitives.
Table A6: Evaluation of Design Structure Matrices (DSM)
Information flow path Harmonise flows Roles of company personnel
Page 19
Matrix representing various
relationships between processes Shows information flows as a mark but
the type of information is not labelled. No diagram primitives.
Multiple channels Information sharing Timing of processes
Requires the creation of multiple
diagrams to illustrate multiple
media forms for a single process No diagram primitives. No diagram primitives.
Contextualising information Synchronise channels Collaborative processes
No diagram primitives. No diagram primitives. No diagram primitives.