64

Information Circular 9477
Mining Roof Bolting Machine Safety:A Study of the Drill Boom Vertical Velocity
By Dean H. Ambrose, John R. Bartels, August J. Kwitowski, Raymond F. Helinski,
Sean Gallagher, Ph.D., Linda J. McWilliams, and Thomas R. Battenhouse, Jr.
DEPARTMENT OF HEALTH AND HUMAN SERVICESCenters for Disease Control and Prevention
National Institute for Occupational Safety and HealthPittsburgh Research Laboratory
Pittsburgh, PA
May 2005

This document is the public domain and may be freely copied or reprinted.
Disclaimer: Mention of any company or product does not constitute endorsement by NIOSH.
ORDERING INFORMATION
Copies of National Institute for Occupational Safety and Health (NIOSH)
documents and information
about occupational safety and health are available from
NIOSH–Publications Dissemination
4676 Columbia Parkway
Cincinnati, OH 45226–1998
FAX: 513–533–8573
Telephone: 1–800–35–NIOSH
(1–800–356–4674)
E-mail: [email protected]
Web site: www.cdc.gov/niosh
DHHS (NIOSH) Publication No. 2005–128
CONTENTSPage
Abstract . . . . . . . . . . . . . . . . . . . . . . . . . . . . . . . . . . . . . . . . . . . . . . . . . . . . . . . . . . . . . . . . . . . . . . . . . . . . . . . . . . . 1
Introduction . . . . . . . . . . . . . . . . . . . . . . . . . . . . . . . . . . . . . . . . . . . . . . . . . . . . . . . . . . . . . . . . . . . . . . . . . . . . . . . . . . . 2
Background . . . . . . . . . . . . . . . . . . . . . . . . . . . . . . . . . . . . . . . . . . . . . . . . . . . . . . . . . . . . . . . . . . . . . . . . . . . . . . . . . . . 4
Research . . . . . . . . . . . . . . . . . . . . . . . . . . . . . . . . . . . . . . . . . . . . . . . . . . . . . . . . . . . . . . . . . . . . . . . . . . . . . . . . . . . 5
Study population . . . . . . . . . . . . . . . . . . . . . . . . . . . . . . . . . . . . . . . . . . . . . . . . . . . . . . . . . . . . . . . . . . . . . . . . . . . . . 5
Model validation . . . . . . . . . . . . . . . . . . . . . . . . . . . . . . . . . . . . . . . . . . . . . . . . . . . . . . . . . . . . . . . . . . . . . . . . . . . . . 5
Experimental design . . . . . . . . . . . . . . . . . . . . . . . . . . . . . . . . . . . . . . . . . . . . . . . . . . . . . . . . . . . . . . . . . . . . . . . . . . 6
Measurements . . . . . . . . . . . . . . . . . . . . . . . . . . . . . . . . . . . . . . . . . . . . . . . . . . . . . . . . . . . . . . . . . . . . . . . . . . . . . . . 10
Data analysis . . . . . . . . . . . . . . . . . . . . . . . . . . . . . . . . . . . . . . . . . . . . . . . . . . . . . . . . . . . . . . . . . . . . . . . . . . . . . . . . . . 12
Frequency and cross-tabulation analysis . . . . . . . . . . . . . . . . . . . . . . . . . . . . . . . . . . . . . . . . . . . . . . . . . . . . . . . . . . . 15
Method . . . . . . . . . . . . . . . . . . . . . . . . . . . . . . . . . . . . . . . . . . . . . . . . . . . . . . . . . . . . . . . . . . . . . . . . . . . . . . . . . . 15
Variables investigated . . . . . . . . . . . . . . . . . . . . . . . . . . . . . . . . . . . . . . . . . . . . . . . . . . . . . . . . . . . . . . . . . . . . 15
Data . . . . . . . . . . . . . . . . . . . . . . . . . . . . . . . . . . . . . . . . . . . . . . . . . . . . . . . . . . . . . . . . . . . . . . . . . . . . . . . . . . 15
Results . . . . . . . . . . . . . . . . . . . . . . . . . . . . . . . . . . . . . . . . . . . . . . . . . . . . . . . . . . . . . . . . . . . . . . . . . . . . . . . . . . 15
Frequency analysis . . . . . . . . . . . . . . . . . . . . . . . . . . . . . . . . . . . . . . . . . . . . . . . . . . . . . . . . . . . . . . . . . . . . . . . 15
Fixed variables . . . . . . . . . . . . . . . . . . . . . . . . . . . . . . . . . . . . . . . . . . . . . . . . . . . . . . . . . . . . . . . . . . . . . . . 15
Conditional variables . . . . . . . . . . . . . . . . . . . . . . . . . . . . . . . . . . . . . . . . . . . . . . . . . . . . . . . . . . . . . . . . . . 16
Random variables . . . . . . . . . . . . . . . . . . . . . . . . . . . . . . . . . . . . . . . . . . . . . . . . . . . . . . . . . . . . . . . . . . . . . 16
Data sets . . . . . . . . . . . . . . . . . . . . . . . . . . . . . . . . . . . . . . . . . . . . . . . . . . . . . . . . . . . . . . . . . . . . . . . . . . . . 16
Cross-tabulation analysis . . . . . . . . . . . . . . . . . . . . . . . . . . . . . . . . . . . . . . . . . . . . . . . . . . . . . . . . . . . . . . . . . . 16
Seam height versus random variables . . . . . . . . . . . . . . . . . . . . . . . . . . . . . . . . . . . . . . . . . . . . . . . . . . . . . . 16
Subject versus random variables . . . . . . . . . . . . . . . . . . . . . . . . . . . . . . . . . . . . . . . . . . . . . . . . . . . . . . . . . . 16
Work posture versus random variables . . . . . . . . . . . . . . . . . . . . . . . . . . . . . . . . . . . . . . . . . . . . . . . . . . . . . 16
Drilling behavior versus random variables . . . . . . . . . . . . . . . . . . . . . . . . . . . . . . . . . . . . . . . . . . . . . . . . . . 16
Bolting behavior versus random variables . . . . . . . . . . . . . . . . . . . . . . . . . . . . . . . . . . . . . . . . . . . . . . . . . . 17
Boom speed versus fixed, conditional, and random variables . . . . . . . . . . . . . . . . . . . . . . . . . . . . . . . . . . . 17
Summary . . . . . . . . . . . . . . . . . . . . . . . . . . . . . . . . . . . . . . . . . . . . . . . . . . . . . . . . . . . . . . . . . . . . . . . . . . . . . . . . . 17
Logistic regression analysis . . . . . . . . . . . . . . . . . . . . . . . . . . . . . . . . . . . . . . . . . . . . . . . . . . . . . . . . . . . . . . . . . . . . . 18
Method . . . . . . . . . . . . . . . . . . . . . . . . . . . . . . . . . . . . . . . . . . . . . . . . . . . . . . . . . . . . . . . . . . . . . . . . . . . . . . . . . . 18
Results . . . . . . . . . . . . . . . . . . . . . . . . . . . . . . . . . . . . . . . . . . . . . . . . . . . . . . . . . . . . . . . . . . . . . . . . . . . . . . . . . . 18
Model 1 . . . . . . . . . . . . . . . . . . . . . . . . . . . . . . . . . . . . . . . . . . . . . . . . . . . . . . . . . . . . . . . . . . . . . . . . . . . . . . . 18
Model 2 . . . . . . . . . . . . . . . . . . . . . . . . . . . . . . . . . . . . . . . . . . . . . . . . . . . . . . . . . . . . . . . . . . . . . . . . . . . . . . . 18
Model 3 . . . . . . . . . . . . . . . . . . . . . . . . . . . . . . . . . . . . . . . . . . . . . . . . . . . . . . . . . . . . . . . . . . . . . . . . . . . . . . . 18
Model 4 . . . . . . . . . . . . . . . . . . . . . . . . . . . . . . . . . . . . . . . . . . . . . . . . . . . . . . . . . . . . . . . . . . . . . . . . . . . . . . . 19
Model 5 . . . . . . . . . . . . . . . . . . . . . . . . . . . . . . . . . . . . . . . . . . . . . . . . . . . . . . . . . . . . . . . . . . . . . . . . . . . . . . . 19
Summary . . . . . . . . . . . . . . . . . . . . . . . . . . . . . . . . . . . . . . . . . . . . . . . . . . . . . . . . . . . . . . . . . . . . . . . . . . . . . . . . . 19
Survival analysis . . . . . . . . . . . . . . . . . . . . . . . . . . . . . . . . . . . . . . . . . . . . . . . . . . . . . . . . . . . . . . . . . . . . . . . . . . . . . 19
Method . . . . . . . . . . . . . . . . . . . . . . . . . . . . . . . . . . . . . . . . . . . . . . . . . . . . . . . . . . . . . . . . . . . . . . . . . . . . . . . . . . 19
Variables investigated . . . . . . . . . . . . . . . . . . . . . . . . . . . . . . . . . . . . . . . . . . . . . . . . . . . . . . . . . . . . . . . . . . . . 19
Data . . . . . . . . . . . . . . . . . . . . . . . . . . . . . . . . . . . . . . . . . . . . . . . . . . . . . . . . . . . . . . . . . . . . . . . . . . . . . . . . . . 19
Survival analysis . . . . . . . . . . . . . . . . . . . . . . . . . . . . . . . . . . . . . . . . . . . . . . . . . . . . . . . . . . . . . . . . . . . . . . . . 20
Results . . . . . . . . . . . . . . . . . . . . . . . . . . . . . . . . . . . . . . . . . . . . . . . . . . . . . . . . . . . . . . . . . . . . . . . . . . . . . . . . . . 20
Results of forward selection process . . . . . . . . . . . . . . . . . . . . . . . . . . . . . . . . . . . . . . . . . . . . . . . . . . . . . . . . . 20
Risk model . . . . . . . . . . . . . . . . . . . . . . . . . . . . . . . . . . . . . . . . . . . . . . . . . . . . . . . . . . . . . . . . . . . . . . . . . . . . . 20
Boom speed . . . . . . . . . . . . . . . . . . . . . . . . . . . . . . . . . . . . . . . . . . . . . . . . . . . . . . . . . . . . . . . . . . . . . . . . . . . . 20
Boom direction . . . . . . . . . . . . . . . . . . . . . . . . . . . . . . . . . . . . . . . . . . . . . . . . . . . . . . . . . . . . . . . . . . . . . . . . . . 20
Drilling behavior . . . . . . . . . . . . . . . . . . . . . . . . . . . . . . . . . . . . . . . . . . . . . . . . . . . . . . . . . . . . . . . . . . . . . . . . 21
Work posture/seam height combinations . . . . . . . . . . . . . . . . . . . . . . . . . . . . . . . . . . . . . . . . . . . . . . . . . . . . . . 22
Bolting behavior . . . . . . . . . . . . . . . . . . . . . . . . . . . . . . . . . . . . . . . . . . . . . . . . . . . . . . . . . . . . . . . . . . . . . . . . . 22
Anthropometry . . . . . . . . . . . . . . . . . . . . . . . . . . . . . . . . . . . . . . . . . . . . . . . . . . . . . . . . . . . . . . . . . . . . . . . . . . 22
Operator location . . . . . . . . . . . . . . . . . . . . . . . . . . . . . . . . . . . . . . . . . . . . . . . . . . . . . . . . . . . . . . . . . . . . . . . . 22
Summary . . . . . . . . . . . . . . . . . . . . . . . . . . . . . . . . . . . . . . . . . . . . . . . . . . . . . . . . . . . . . . . . . . . . . . . . . . . . . . . . . 22
Conclusions . . . . . . . . . . . . . . . . . . . . . . . . . . . . . . . . . . . . . . . . . . . . . . . . . . . . . . . . . . . . . . . . . . . . . . . . . . . . . . . . . . . 23

CONTENTS–ContinuedPage
Other research considerations . . . . . . . . . . . . . . . . . . . . . . . . . . . . . . . . . . . . . . . . . . . . . . . . . . . . . . . . . . . . . . . . . . . . . 24
Acknowledgments . . . . . . . . . . . . . . . . . . . . . . . . . . . . . . . . . . . . . . . . . . . . . . . . . . . . . . . . . . . . . . . . . . . . . . . . . . . . . . 25
References . . . . . . . . . . . . . . . . . . . . . . . . . . . . . . . . . . . . . . . . . . . . . . . . . . . . . . . . . . . . . . . . . . . . . . . . . . . . . . . . . . . 25
Appendix A.—Frequency of incidents . . . . . . . . . . . . . . . . . . . . . . . . . . . . . . . . . . . . . . . . . . . . . . . . . . . . . . . . . . . . . . . 26
Appendix B.—Frequency by operator location . . . . . . . . . . . . . . . . . . . . . . . . . . . . . . . . . . . . . . . . . . . . . . . . . . . . . . . . 31
Appendix C.—Frequency data sets . . . . . . . . . . . . . . . . . . . . . . . . . . . . . . . . . . . . . . . . . . . . . . . . . . . . . . . . . . . . . . . . . 35
Appendix D.—Cross-tabulation . . . . . . . . . . . . . . . . . . . . . . . . . . . . . . . . . . . . . . . . . . . . . . . . . . . . . . . . . . . . . . . . . . . . 38
Appendix E.—Logistic regression models for roof bolter simulation data . . . . . . . . . . . . . . . . . . . . . . . . . . . . . . . . . . . 50
Appendix F.—Survival analysis tables . . . . . . . . . . . . . . . . . . . . . . . . . . . . . . . . . . . . . . . . . . . . . . . . . . . . . . . . . . . . . . 51
Appendix G.—Illustrations of operator's work behaviors . . . . . . . . . . . . . . . . . . . . . . . . . . . . . . . . . . . . . . . . . . . . . . . . 54
ILLUSTRATIONS
1. Artist concept of an operator caught within the boom arm and canopy . . . . . . . . . . . . . . . . . . . . . . . . . . . . . . . 2
2. Actual dual boom arm roof bolting machine . . . . . . . . . . . . . . . . . . . . . . . . . . . . . . . . . . . . . . . . . . . . . . . . . . . 3
3. Full-scale wooden roof bolter boom arm setup for data collection . . . . . . . . . . . . . . . . . . . . . . . . . . . . . . . . . . 3
4. Operator close to the moving boom arm with hand on the controls . . . . . . . . . . . . . . . . . . . . . . . . . . . . . . . . . . 3
5. A roof bolter operator's work posture in an underground coal mine . . . . . . . . . . . . . . . . . . . . . . . . . . . . . . . . . 4
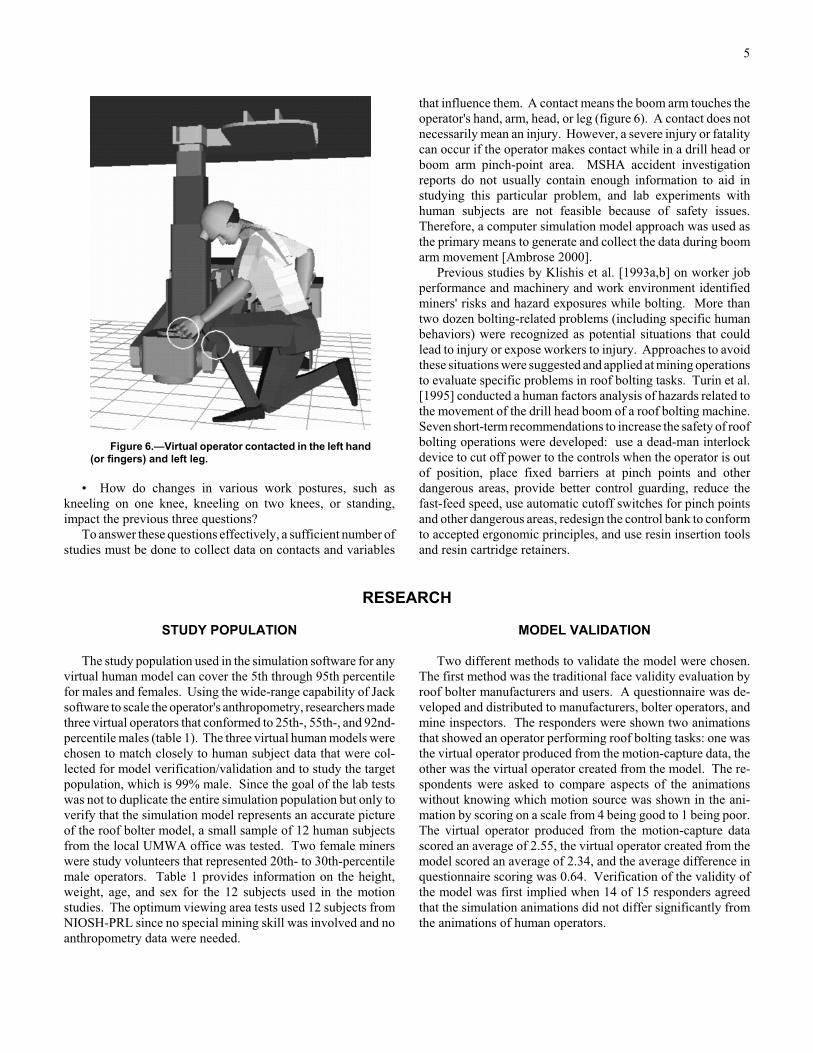
6. Virtual operator contacted in the left hand (or fingers) and left leg . . . . . . . . . . . . . . . . . . . . . . . . . . . . . . . . . . 5
7. Angular data of the original and modified viewing areas for the virtual operator . . . . . . . . . . . . . . . . . . . . . . . 8
8. A view of the roof bolter model from a computer monitor . . . . . . . . . . . . . . . . . . . . . . . . . . . . . . . . . . . . . . . . 11
9. Flowchart of NIOSH's algorithm for processing the simulation data files . . . . . . . . . . . . . . . . . . . . . . . . . . . . . 13
A–1. Incidents by seam height . . . . . . . . . . . . . . . . . . . . . . . . . . . . . . . . . . . . . . . . . . . . . . . . . . . . . . . . . . . . . . . . . . 26
A–2. Incidents by operator percentile . . . . . . . . . . . . . . . . . . . . . . . . . . . . . . . . . . . . . . . . . . . . . . . . . . . . . . . . . . . . . 26
A–3. Incidents by work posture . . . . . . . . . . . . . . . . . . . . . . . . . . . . . . . . . . . . . . . . . . . . . . . . . . . . . . . . . . . . . . . . . 27
A–4. Incidents by boom speed . . . . . . . . . . . . . . . . . . . . . . . . . . . . . . . . . . . . . . . . . . . . . . . . . . . . . . . . . . . . . . . . . . 27
A–5. Incidents by drilling behavior . . . . . . . . . . . . . . . . . . . . . . . . . . . . . . . . . . . . . . . . . . . . . . . . . . . . . . . . . . . . . . 28
A–6. Incidents by bolting behavior . . . . . . . . . . . . . . . . . . . . . . . . . . . . . . . . . . . . . . . . . . . . . . . . . . . . . . . . . . . . . . . 28
A–7. Incidents by boom direction . . . . . . . . . . . . . . . . . . . . . . . . . . . . . . . . . . . . . . . . . . . . . . . . . . . . . . . . . . . . . . . . 29
A–8. Incidents by body part . . . . . . . . . . . . . . . . . . . . . . . . . . . . . . . . . . . . . . . . . . . . . . . . . . . . . . . . . . . . . . . . . . . . 29
A–9. Incidents by machine part . . . . . . . . . . . . . . . . . . . . . . . . . . . . . . . . . . . . . . . . . . . . . . . . . . . . . . . . . . . . . . . . . 30
B–1. Incidents by operator location . . . . . . . . . . . . . . . . . . . . . . . . . . . . . . . . . . . . . . . . . . . . . . . . . . . . . . . . . . . . . . 31
B–2. Contact incidents by operator location and body part . . . . . . . . . . . . . . . . . . . . . . . . . . . . . . . . . . . . . . . . . . . . 32
B–3. Contact incidents by operator location and work posture . . . . . . . . . . . . . . . . . . . . . . . . . . . . . . . . . . . . . . . . . 33
B–4. Contact incidents by operator location and seam height . . . . . . . . . . . . . . . . . . . . . . . . . . . . . . . . . . . . . . . . . . 34
D–1. Contact incidents by seam height and boom direction . . . . . . . . . . . . . . . . . . . . . . . . . . . . . . . . . . . . . . . . . . . . 38
D–2. Contact incidents by seam height and body part . . . . . . . . . . . . . . . . . . . . . . . . . . . . . . . . . . . . . . . . . . . . . . . . 38
D–3. Contact incidents by seam height and machine part . . . . . . . . . . . . . . . . . . . . . . . . . . . . . . . . . . . . . . . . . . . . . 39
D–4. Contact incidents by operator percentile and boom direction . . . . . . . . . . . . . . . . . . . . . . . . . . . . . . . . . . . . . . 39
D–5. Contact incidents by operator percentile and body part . . . . . . . . . . . . . . . . . . . . . . . . . . . . . . . . . . . . . . . . . . . 40
D–6. Contact incidents by operator percentile and machine part . . . . . . . . . . . . . . . . . . . . . . . . . . . . . . . . . . . . . . . . 40
D–7. Contact incidents by work posture and boom direction . . . . . . . . . . . . . . . . . . . . . . . . . . . . . . . . . . . . . . . . . . . 41
D–8. Contact incidents by work posture and body part . . . . . . . . . . . . . . . . . . . . . . . . . . . . . . . . . . . . . . . . . . . . . . . 41
D–9. Contact incidents by work posture and machine part . . . . . . . . . . . . . . . . . . . . . . . . . . . . . . . . . . . . . . . . . . . . . 42
D–10. Contact incidents by drilling behavior and boom direction . . . . . . . . . . . . . . . . . . . . . . . . . . . . . . . . . . . . . . . . 42
D–11. Contact incidents by drilling behavior and body part . . . . . . . . . . . . . . . . . . . . . . . . . . . . . . . . . . . . . . . . . . . . 43
D–12. Contact incidents by drilling behavior and machine part . . . . . . . . . . . . . . . . . . . . . . . . . . . . . . . . . . . . . . . . . . 43
D–13. Contact incidents by bolting behavior and machine part . . . . . . . . . . . . . . . . . . . . . . . . . . . . . . . . . . . . . . . . . . 44
D–14. Contact incidents by bolting behavior and boom direction . . . . . . . . . . . . . . . . . . . . . . . . . . . . . . . . . . . . . . . . 44
D–15. Contact incidents by bolting behavior and body part . . . . . . . . . . . . . . . . . . . . . . . . . . . . . . . . . . . . . . . . . . . . . 45
D–16. Contact incidents by boom speed and boom direction . . . . . . . . . . . . . . . . . . . . . . . . . . . . . . . . . . . . . . . . . . . . 45
D–17. Contact incidents by boom speed and body part . . . . . . . . . . . . . . . . . . . . . . . . . . . . . . . . . . . . . . . . . . . . . . . . 46

ILLUSTRATIONS–Continued
Page
D–18. Contact incidents by boom speed and machine part . . . . . . . . . . . . . . . . . . . . . . . . . . . . . . . . . . . . . . . . . . . . . 46
D–19. Contact incidents by boom speed and work posture . . . . . . . . . . . . . . . . . . . . . . . . . . . . . . . . . . . . . . . . . . . . . 47
D–20. Contact incidents by boom speed and operator percentile . . . . . . . . . . . . . . . . . . . . . . . . . . . . . . . . . . . . . . . . . 47
D–21. Contact incidents by boom speed and drilling behavior . . . . . . . . . . . . . . . . . . . . . . . . . . . . . . . . . . . . . . . . . . . 48
D–22. Contact incidents by boom speed and seam height . . . . . . . . . . . . . . . . . . . . . . . . . . . . . . . . . . . . . . . . . . . . . . 48
D–23. Contact incidents by boom speed and bolting behavior . . . . . . . . . . . . . . . . . . . . . . . . . . . . . . . . . . . . . . . . . . . 49
G–1. 45-in seam height and different work postures . . . . . . . . . . . . . . . . . . . . . . . . . . . . . . . . . . . . . . . . . . . . . . . . . 54
G–2. 60-in seam height and different work postures . . . . . . . . . . . . . . . . . . . . . . . . . . . . . . . . . . . . . . . . . . . . . . . . . 55
G–3. 72-in seam height and standing work posture . . . . . . . . . . . . . . . . . . . . . . . . . . . . . . . . . . . . . . . . . . . . . . . . . . 56
TABLES
1. Subject anthropometric data . . . . . . . . . . . . . . . . . . . . . . . . . . . . . . . . . . . . . . . . . . . . . . . . . . . . . . . . . . . . . . . . 6
2. Data that met the acceptance criteria . . . . . . . . . . . . . . . . . . . . . . . . . . . . . . . . . . . . . . . . . . . . . . . . . . . . . . . . . 6
3. Behavior list for drilling a hole and installing a bolt . . . . . . . . . . . . . . . . . . . . . . . . . . . . . . . . . . . . . . . . . . . . . 7
4. Reaction times of operators used in the roof bolter model . . . . . . . . . . . . . . . . . . . . . . . . . . . . . . . . . . . . . . . . . 8
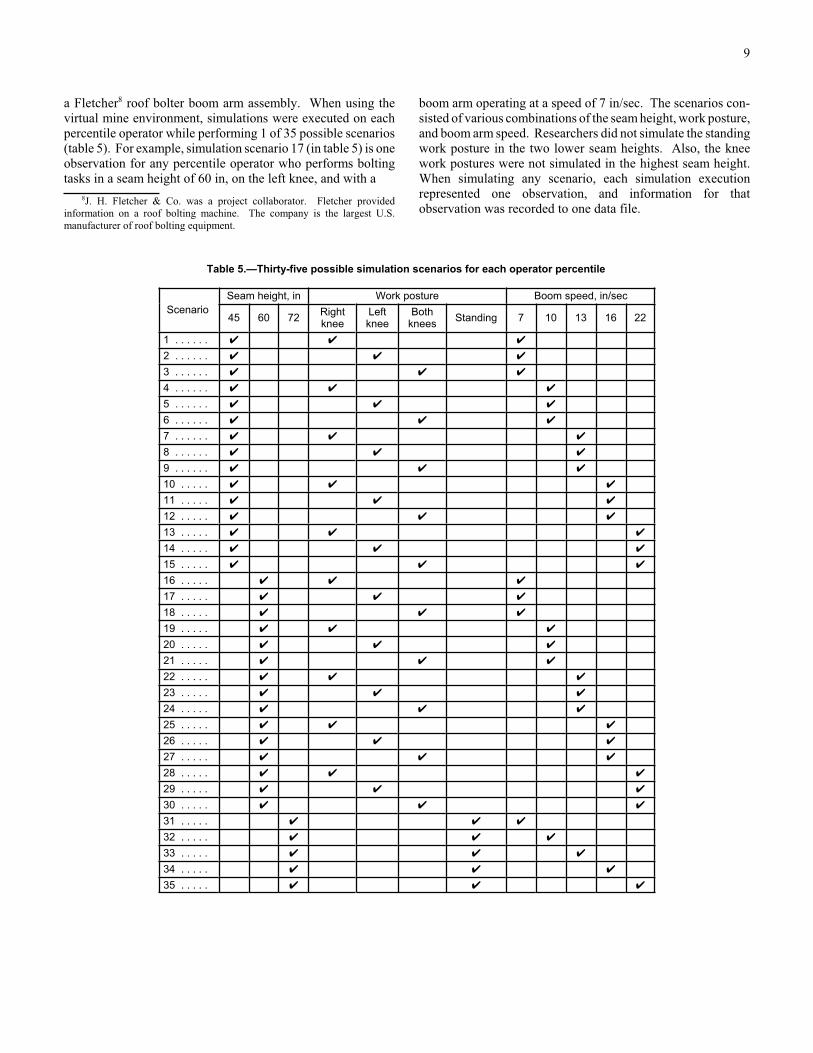
5. Thirty-five possible simulation scenarios for each operator percentile . . . . . . . . . . . . . . . . . . . . . . . . . . . . . . . 9
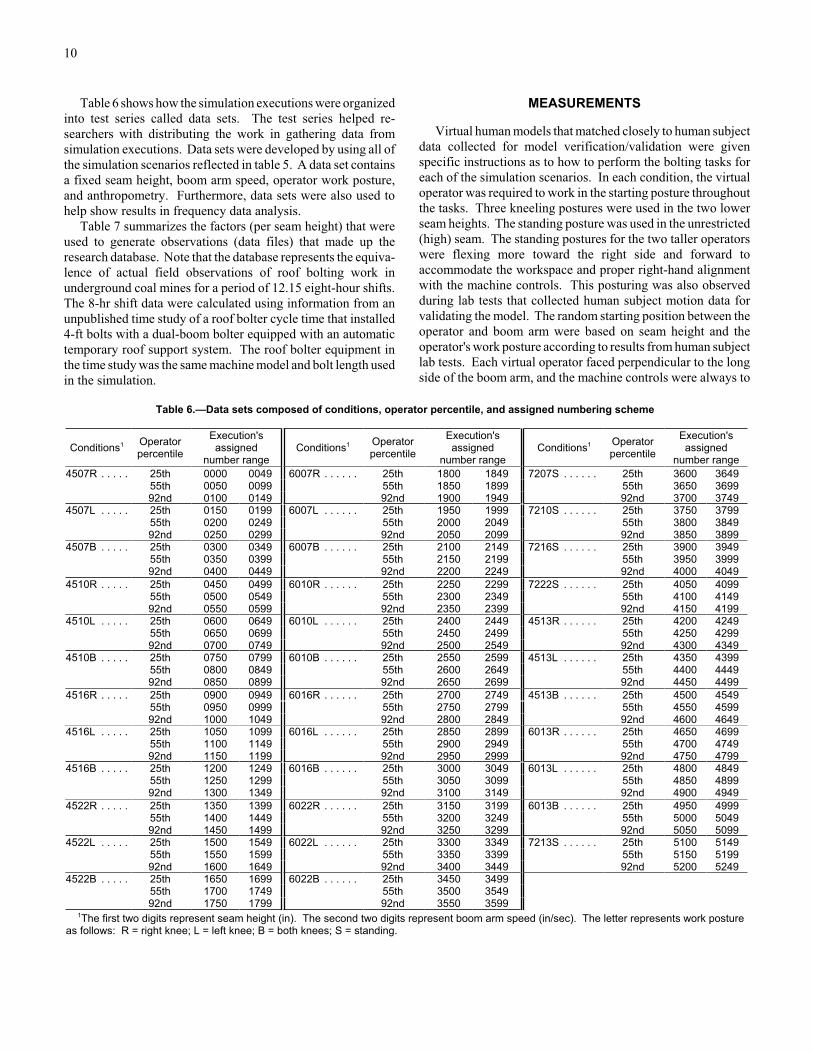
6. Data sets composed of conditions, operator percentile, and assigned numbering scheme . . . . . . . . . . . . . . . . . 10
7. Factors that determined the number of observations (simulation executions) per seam height . . . . . . . . . . . . . 11
8. Sample data output file . . . . . . . . . . . . . . . . . . . . . . . . . . . . . . . . . . . . . . . . . . . . . . . . . . . . . . . . . . . . . . . . . . . 11
9. Comparison of one contact per execution versus all contacts . . . . . . . . . . . . . . . . . . . . . . . . . . . . . . . . . . . . . . 14
10. Results of slow versus fast reaction for simulation executions . . . . . . . . . . . . . . . . . . . . . . . . . . . . . . . . . . . . . 14
11. Hypothesized time-to-event regression model . . . . . . . . . . . . . . . . . . . . . . . . . . . . . . . . . . . . . . . . . . . . . . . . . . 21
12. Main effects risk model . . . . . . . . . . . . . . . . . . . . . . . . . . . . . . . . . . . . . . . . . . . . . . . . . . . . . . . . . . . . . . . . . . . 21
13. Instantaneous relative risk estimates at specified time for each variable . . . . . . . . . . . . . . . . . . . . . . . . . . . . . . 22
A–1. Incidents by seam height . . . . . . . . . . . . . . . . . . . . . . . . . . . . . . . . . . . . . . . . . . . . . . . . . . . . . . . . . . . . . . . . . . 26
A–2. Incidents by operator percentile . . . . . . . . . . . . . . . . . . . . . . . . . . . . . . . . . . . . . . . . . . . . . . . . . . . . . . . . . . . . . 26
A–3. Incidents by work posture . . . . . . . . . . . . . . . . . . . . . . . . . . . . . . . . . . . . . . . . . . . . . . . . . . . . . . . . . . . . . . . . . 27
A–4. Incidents by boom speed . . . . . . . . . . . . . . . . . . . . . . . . . . . . . . . . . . . . . . . . . . . . . . . . . . . . . . . . . . . . . . . . . . 27
A–5. Incidents by drilling behavior . . . . . . . . . . . . . . . . . . . . . . . . . . . . . . . . . . . . . . . . . . . . . . . . . . . . . . . . . . . . . . 28
A–6. Incidents by bolting behavior . . . . . . . . . . . . . . . . . . . . . . . . . . . . . . . . . . . . . . . . . . . . . . . . . . . . . . . . . . . . . . . 28
A–7. Incidents by boom direction . . . . . . . . . . . . . . . . . . . . . . . . . . . . . . . . . . . . . . . . . . . . . . . . . . . . . . . . . . . . . . . . 29
A–8. Incidents by body part . . . . . . . . . . . . . . . . . . . . . . . . . . . . . . . . . . . . . . . . . . . . . . . . . . . . . . . . . . . . . . . . . . . . 29
A–9. Incidents by machine part . . . . . . . . . . . . . . . . . . . . . . . . . . . . . . . . . . . . . . . . . . . . . . . . . . . . . . . . . . . . . . . . . 30
B–1. Incidents by operator location . . . . . . . . . . . . . . . . . . . . . . . . . . . . . . . . . . . . . . . . . . . . . . . . . . . . . . . . . . . . . . 31
B–2. Contact incidents by operator location and body part . . . . . . . . . . . . . . . . . . . . . . . . . . . . . . . . . . . . . . . . . . . . 32
B–3. Contact incidents by operator location and work posture . . . . . . . . . . . . . . . . . . . . . . . . . . . . . . . . . . . . . . . . . 33
B–4. Contact incidents by operator location and seam height . . . . . . . . . . . . . . . . . . . . . . . . . . . . . . . . . . . . . . . . . . 34
C–1. Frequencies by data sets sorted by contacts . . . . . . . . . . . . . . . . . . . . . . . . . . . . . . . . . . . . . . . . . . . . . . . . . . . . 35
C–2. Frequencies by data sets sorted by avoid incidents . . . . . . . . . . . . . . . . . . . . . . . . . . . . . . . . . . . . . . . . . . . . . . 36
C–3. Data sets by body part and contacts . . . . . . . . . . . . . . . . . . . . . . . . . . . . . . . . . . . . . . . . . . . . . . . . . . . . . . . . . . 37
D–1. Contact incidents by seam height and boom direction . . . . . . . . . . . . . . . . . . . . . . . . . . . . . . . . . . . . . . . . . . . . 38
D–2. Contact incidents by seam height and body part . . . . . . . . . . . . . . . . . . . . . . . . . . . . . . . . . . . . . . . . . . . . . . . . 38
D–3. Contact incidents by seam height and machine part . . . . . . . . . . . . . . . . . . . . . . . . . . . . . . . . . . . . . . . . . . . . . 39
D–4. Contact incidents by operator percentile and boom direction . . . . . . . . . . . . . . . . . . . . . . . . . . . . . . . . . . . . . . 39
D–5. Contact incidents by operator percentile and body part . . . . . . . . . . . . . . . . . . . . . . . . . . . . . . . . . . . . . . . . . . . 40
D–6. Contact incidents by operator percentile and machine part . . . . . . . . . . . . . . . . . . . . . . . . . . . . . . . . . . . . . . . . 40
D–7. Contact incidents by work posture and boom direction . . . . . . . . . . . . . . . . . . . . . . . . . . . . . . . . . . . . . . . . . . . 41
D–8. Contact incidents by work posture and body part . . . . . . . . . . . . . . . . . . . . . . . . . . . . . . . . . . . . . . . . . . . . . . . 41
D–9. Contact incidents by work posture and machine part . . . . . . . . . . . . . . . . . . . . . . . . . . . . . . . . . . . . . . . . . . . . . 42
TABLES–Continued
Page
D–10. Contact incidents by drilling behavior and boom direction . . . . . . . . . . . . . . . . . . . . . . . . . . . . . . . . . . . . . . . . 42
D–11. Contact incidents by drilling behavior and body part . . . . . . . . . . . . . . . . . . . . . . . . . . . . . . . . . . . . . . . . . . . . 43
D–12. Contact incidents by drilling behavior and machine part . . . . . . . . . . . . . . . . . . . . . . . . . . . . . . . . . . . . . . . . . . 43
D–13. Contact incidents by bolting behavior and machine part . . . . . . . . . . . . . . . . . . . . . . . . . . . . . . . . . . . . . . . . . . 44
D–14. Contact incidents by bolting behavior and boom direction . . . . . . . . . . . . . . . . . . . . . . . . . . . . . . . . . . . . . . . . 44
D–15. Contact incidents by bolting behavior and body part . . . . . . . . . . . . . . . . . . . . . . . . . . . . . . . . . . . . . . . . . . . . . 45
D–16. Contact incidents by boom speed and boom direction . . . . . . . . . . . . . . . . . . . . . . . . . . . . . . . . . . . . . . . . . . . . 45
D–17. Contact incidents by boom speed and body part . . . . . . . . . . . . . . . . . . . . . . . . . . . . . . . . . . . . . . . . . . . . . . . . 46
D–18. Contact incidents by boom speed and machine part . . . . . . . . . . . . . . . . . . . . . . . . . . . . . . . . . . . . . . . . . . . . . 46
D–19. Contact incidents by boom speed and work posture . . . . . . . . . . . . . . . . . . . . . . . . . . . . . . . . . . . . . . . . . . . . . 47
D–20. Contact incidents by boom speed and operator percentile . . . . . . . . . . . . . . . . . . . . . . . . . . . . . . . . . . . . . . . . . 47
D–21. Contact incidents by boom speed and drilling behavior . . . . . . . . . . . . . . . . . . . . . . . . . . . . . . . . . . . . . . . . . . . 48
D–22. Contact incidents by boom speed and seam height . . . . . . . . . . . . . . . . . . . . . . . . . . . . . . . . . . . . . . . . . . . . . . 48
D–23. Contact incidents by boom speed and bolting behavior . . . . . . . . . . . . . . . . . . . . . . . . . . . . . . . . . . . . . . . . . . . 49
E–1. Modeling the probability of a contact for slow reaction time of operator . . . . . . . . . . . . . . . . . . . . . . . . . . . . . 50
F–1. Univariate model information (outcome slow) . . . . . . . . . . . . . . . . . . . . . . . . . . . . . . . . . . . . . . . . . . . . . . . . . 51
F–2. Models with boom speed . . . . . . . . . . . . . . . . . . . . . . . . . . . . . . . . . . . . . . . . . . . . . . . . . . . . . . . . . . . . . . . . . . 51
F–3. Models with boom speed, boom direction . . . . . . . . . . . . . . . . . . . . . . . . . . . . . . . . . . . . . . . . . . . . . . . . . . . . . 52
F–4. Models with boom speed, boom direction, drilling behavior . . . . . . . . . . . . . . . . . . . . . . . . . . . . . . . . . . . . . . . 52
F–5. Models with boom speed, boom direction, drilling behavior, work posture/seam height . . . . . . . . . . . . . . . . . 52
F–6. Models with boom speed, boom direction, drilling behavior, work posture/seam height, bolting behavior . . . 53
F–7. Models with boom speed, boom direction, drilling behavior, work posture/seam height, bolting behavior,
operator percentile . . . . . . . . . . . . . . . . . . . . . . . . . . . . . . . . . . . . . . . . . . . . . . . . . . . . . . . . . . . . . . . . . . . . 53
F–8. Final model . . . . . . . . . . . . . . . . . . . . . . . . . . . . . . . . . . . . . . . . . . . . . . . . . . . . . . . . . . . . . . . . . . . . . . . . . . . . 53
UNIT OF MEASURE ABBREVIATIONS USED IN THIS REPORT
fL footlambert in/sec inch per second
ft foot lb pound
hr hour msec millisecond
in inch sec second

MINING ROOF BOLTING MACHINE SAFETY:
A STUDY OF THE DRILL BOOM VERTICAL VELOCITY
By Dean H. Ambrose,1 John R. Bartels,2 August J. Kwitowski,3
Raymond F. Helinski,4 Sean Gallagher, Ph.D.,5 Linda J. McWilliams,6
and Thomas R. Battenhouse, Jr.7
ABSTRACT
This report examines the boom arm vertical speed for roof bolting machines to study a moving boom arm
appendage at different speeds during different work scenarios. The goal of this study is to determine the impact
of the appendage speed on the likelihood of the operator's hand, arm, head, or leg making contact, such as
touching the moving appendage. The overall research goal is to reduce workers' risks to injury from exposure
to underground mining machinery.
Accident investigation reports from the Mine Safety and Health Administration do not usually contain
enough information to aid in studying this problem, and lab experiments with human subjects are not feasible
because of safety issues. As an alternative, researchers used a unique computer simulation model that uses a
virtual human, vision tracking, and generates random virtual human motions and risky work behaviors. By
using specialized software to simulate the computer model, researchers accurately identified potential hazards
of tasks where it is not possible to perform experiments with human subjects.
Results of a frequency distribution analytic approach show that, regardless of other variables, contact
incidents were always greater when the boom was moving up, always greater on the hand, and always greater
for the boom arm part of the machine. The reason why the subject experiences more contacts when the boom
arm is moving up rather than down is that more risky behaviors occur during drilling and bolting when the
boom is ascending.
Results of a cross-tabulation analytic approach show that the 25th-percentile operators experienced more
contacts than other operator sizes and had most of their contacts during a boom speed of 13 in/sec. The
hand-on-boom behavior during drilling and bolting tasks experienced more contacts than other work behaviors,
and both tasks had most of their contacts during speed 13 in/sec. The 60-in seam experienced more contacts
than other seam heights and had most of the contacts during speed 16 in/sec.
For univariate logistic regression models, seam height is the most important predictor of the probability of
a contact. However, a multivariate logistic regression model predicted contacts are more likely with the both-
knee work posture in the 60-in seam, a 25th-percentile operator compared to a 55th-percentile operator, and
speeds 16 and 22 in/sec compared to 7 in/sec.
Results of a survival analytic approach suggest that controlling the boom speed is the most important factor
in determining the risk of an operator making contact. Based on the data collected, boom speeds greater than
13 in/sec result in a substantial increase in risk to the roof bolter operator making contact. Speeds less than or
equal to 13 in/sec are associated with a more modest relative risk of making contact, which represents a
decrease in potential hazard. Virtual operator's response time has little effect on the number of contacts
experienced.
The mining industry can use the information in this study to reduce the likelihood that roof bolter operators
will experience injury due to contact with a moving roof bolting machine's boom arm.
1Safety engineer, Pittsburgh Research Laboratory, National Institute for Occupational Safety and Health, Pittsburgh, PA.2Mechanical engineer, Pittsburgh Research Laboratory, National Institute for Occupational Safety and Health, Pittsburgh, PA.3Civil engineer, Pittsburgh Research Laboratory, National Institute for Occupational Safety and Health, Pittsburgh, PA.4Electronics technician, Pittsburgh Research Laboratory, National Institute for Occupational Safety and Health, Pittsburgh, PA (retired).5Research physiologist, Pittsburgh Research Laboratory, National Institute for Occupational Safety and Health, Pittsburgh, PA.6Statistician, Pittsburgh Research Laboratory, National Institute for Occupational Safety and Health, Pittsburgh, PA.7Geosciences system analyst, Science Applications International Corp., Augusta, GA.
2
INTRODUCTION
The Mine Safety and Health Administration's (MSHA)
Health and Safety Accident Classification injury database
showed an average of 660 roof bolter operator accidents per
year over a 5-year period (1999–2003). This makes roof bolting
the most hazardous machine-related job in underground mining,
representing 39% of all machine-related accidents in under-
ground coal mines. Protecting the safety of our Nation's mine
workers is of paramount importance; however, there are
currently no regulations or method of determining the safe speed
of roof bolter boom arms. Several fatalities of operators of
underground coal mining equipment have led to an investigation
of safe vertical velocities of a roof bolter boom arm at the
National Institute for Occupational Safety and Health's (NIOSH)
Pittsburgh Research Laboratory (PRL). MSHA established a
roof bolting machine committee with members from the West
Virginia Board of Coal Mine Health and Safety, NIOSH, and
roof bolter manufacturers. The committee's objective was to
identify hazards and recommend solutions. The data collection
effort involved analysis of MSHA accident data, visits to
underground mines to interview experienced roof bolting
machine operators, discussions with roof bolting machine
manufacturers, interviews with workers who were injured while
performing roof bolting tasks, and reviews of research on roof
bolting safety. The information-gathering and fact-finding ef-
forts of the committee identified 10 roof bolting-related prob-
lems that may have contributed to or caused accidents while the
operator was within the drill head or boom pinch-point area (see
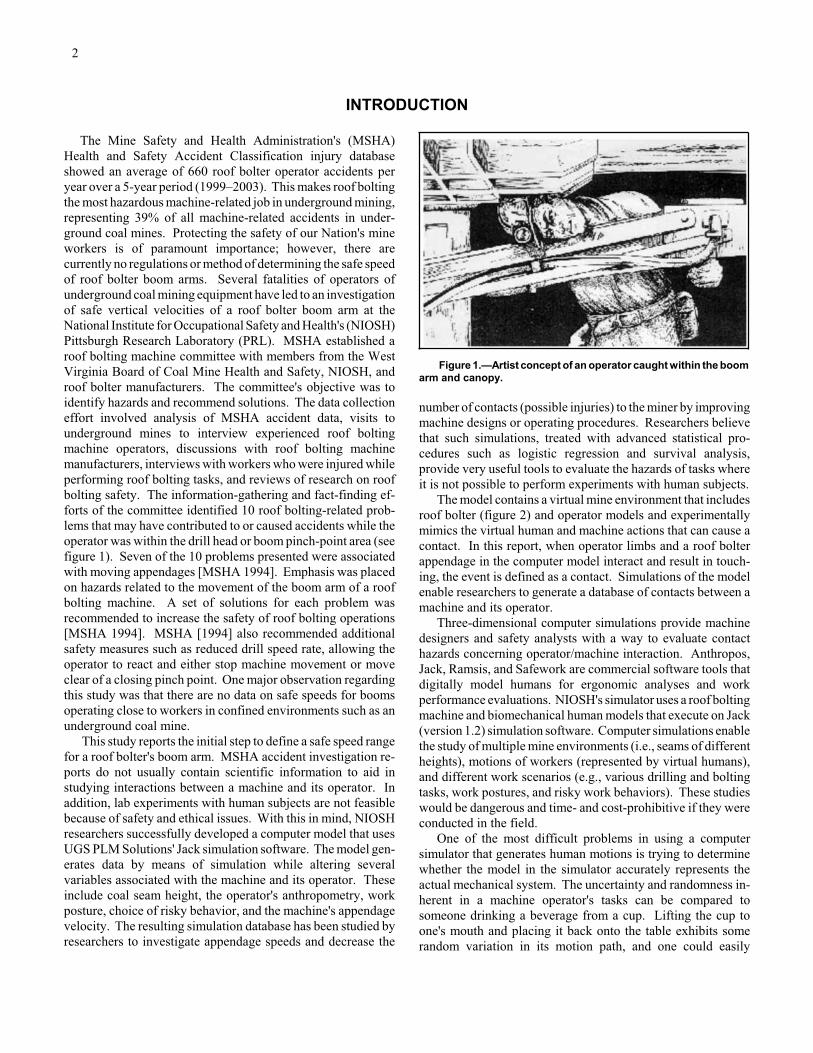
figure 1). Seven of the 10 problems presented were associated
with moving appendages [MSHA 1994]. Emphasis was placed
on hazards related to the movement of the boom arm of a roof
bolting machine. A set of solutions for each problem was
recommended to increase the safety of roof bolting operations
[MSHA 1994]. MSHA [1994] also recommended additional
safety measures such as reduced drill speed rate, allowing the
operator to react and either stop machine movement or move
clear of a closing pinch point. One major observation regarding
this study was that there are no data on safe speeds for booms
operating close to workers in confined environments such as an
underground coal mine.
This study reports the initial step to define a safe speed range
for a roof bolter's boom arm. MSHA accident investigation re-
ports do not usually contain scientific information to aid in
studying interactions between a machine and its operator. In
addition, lab experiments with human subjects are not feasible
because of safety and ethical issues. With this in mind, NIOSH
researchers successfully developed a computer model that uses
UGS PLM Solutions' Jack simulation software. The model gen-
erates data by means of simulation while altering several
variables associated with the machine and its operator. These
include coal seam height, the operator's anthropometry, work
posture, choice of risky behavior, and the machine's appendage
velocity. The resulting simulation database has been studied by
researchers to investigate appendage speeds and decrease the
Figure 1.—Artist concept of an operator caught within the boom
arm and canopy.
number of contacts (possible injuries) to the miner by improving
machine designs or operating procedures. Researchers believe
that such simulations, treated with advanced statistical pro-
cedures such as logistic regression and survival analysis,
provide very useful tools to evaluate the hazards of tasks where
it is not possible to perform experiments with human subjects.
The model contains a virtual mine environment that includes
roof bolter (figure 2) and operator models and experimentally
mimics the virtual human and machine actions that can cause a
contact. In this report, when operator limbs and a roof bolter
appendage in the computer model interact and result in touch-
ing, the event is defined as a contact. Simulations of the model
enable researchers to generate a database of contacts between a
machine and its operator.
Three-dimensional computer simulations provide machine
designers and safety analysts with a way to evaluate contact
hazards concerning operator/machine interaction. Anthropos,
Jack, Ramsis, and Safework are commercial software tools that
digitally model humans for ergonomic analyses and work
performance evaluations. NIOSH's simulator uses a roof bolting
machine and biomechanical human models that execute on Jack
(version 1.2) simulation software. Computer simulations enable
the study of multiple mine environments (i.e., seams of different
heights), motions of workers (represented by virtual humans),
and different work scenarios (e.g., various drilling and bolting
tasks, work postures, and risky work behaviors). These studies
would be dangerous and time- and cost-prohibitive if they were
conducted in the field.
One of the most difficult problems in using a computer
simulator that generates human motions is trying to determine
whether the model in the simulator accurately represents the
actual mechanical system. The uncertainty and randomness in-
herent in a machine operator's tasks can be compared to
someone drinking a beverage from a cup. Lifting the cup to
one's mouth and placing it back onto the table exhibits some
random variation in its motion path, and one could easily

3
visualize the path of that motion. To model this random motion,
the sequence of someone drinking a beverage from a cup would
recur until the cup is empty. Each motion path would differ
slightly even though the motions basically look alike. Likewise,
in the case of a machine operator, the operator's work behaviors,
motions of each behavior, and motion paths associated with
each motion behavior will have some degree of randomness
despite the basic task sameness. Through careful study,
researchers successfully incorporated within the roof bolter
model the randomness of the operator's motion and path
variance within that motion. This factor of randomness gives
NIOSH's simulator the capability to realistically represent the
operator's motions and work behaviors while executing any
machine task. Ambrose [2000, 2001, 2004] and Volberg and
Ambrose [2002] discuss in detail the development of random
motions used in the roof bolter model.
Before collecting final simulation data, researchers used test
results by Bartels et al. [2001, 2003] on the roof bolter model to
validate and ensure that parameter assumptions made for the
computer-based simulation conform to actual field practice.
Training videos, in-mine observations and videos, and working
with a bolter manufacturer and experts helped to determine
actual bolting practice. Studies by Bartels et al. [2001, 2003]
verified the operator's response times, task motions, and field of
view relative to the roof bolter's boom arm. Human subject tests
with a full-scale working mockup of a roof bolter boom arm
(figure 3) were used to collect motion data that helped determine
parameters for building valid and credible models. The roof
bolter model requires input data that closely matches an actual
machine operating characteristics (e.g., dimensions and speeds)
as well as data that accurately reflect physical characteristics of
the operator, such as how close to the moving boom arm he or
she is to reach machine controls and insert the drill steel or bolt
into the drill head (figure 4). Researchers obtained these data by
using a motion tracking/capturing system using experienced
United Mine Workers of America (UMWA) miners as subjects.
The subjects performed prescribed tasks on the mockup that
mimic bolting practices that did not include risky behaviors as
described in this report. Researchers found no differences be-
tween test subjects' actual bolting practice and recommended
practice (according to roof bolting training materials). During
human subject data collection, risky behaviors invalidated a test
session, resulting in rerunning the test.
Experiments in other industries have provided some evi-
dence for resolving safe machine appendage speeds for reducing
potential hazards. Industries using robots exhibit concern for
guidelines for robotics safety. Etherton [1987] reports that
10 in/sec is a speed whereby humans could recognize and react
to a perceived hazard in the system. In addition, the Occupa-
tional Safety and Health Administration (OSHA) [1987] reports
that robot speeds for teach-and-repeat programming sessions are
required to be slow. The current standard of the American
National Standards Institute recommends that this slow speed
should not exceed 10 in/sec. However, Karwowski et al. [1992]
report that test subjects with respect to the potential hazards
from a moving robot arm similarly perceive the range of slow
speeds of robot motion from 8 to 16 in/sec. Their study sug-
gests that the safe slow speed of robot motions for teaching and
programming purposes lies somewhere between 10 and 8 in/sec,
and for safe reduced speed of robot motions redefines the
current recommendation of 10 in/sec. Moreover, the U.S.
Figure 2.—Actual dual boom arm roof bolting machine.(Photograph courtesy of J. H. Fletcher & Co., Huntington, WV.)
Figure 4.—Operator close to the moving boom
arm with hand on the controls.
Figure 3.—Full-scale wooden roof bolter boom arm setup for
data collection. The mannequin illustrates motion sensor
locations.

4
Department of Energy [1998] states that because the teacher can
be within the robot's restrictive envelope, mistakes in program-
ming can result in unintended movement, so a restricted speed
of 6 in/sec is required on any part of the robot. This slower
speed would minimize potential injuries to a teacher if
inadvertent action or movement occurred.
This report documents NIOSH's success in achieving its
expected outcome to examine the speed range of a roof bolter
boom arm for different workplace scenarios and compare sta-
tistically which scenarios are most likely to cause contacts
(possible injuries) to miners.
BACKGROUND
Roof bolting is one of the most basic functions and most
dangerous jobs in underground coal mining. Roof bolts are the
main method of roof support in mines, which is essential to
ventilation and safety. After miner crews remove a section of
the coal seam, roof bolting machine operators install bolts (steel
rods) to secure areas of unsupported roof from caving in.
A bolter crew's typical work sequence includes tramming and
positioning the machine, general preparation and setup, drilling
a hole, and installing a bolt. General preparation is a
miscellaneous category that includes setting up temporary roof
supports, scaling, handling ventilation material, performing a
methane check, handling supplies, emptying the dust box, and
examining the workplace. Drilling bolt holes involves inserting
the drill steel in the chuck, adding extension steels if necessary,
changing the bits, drilling the hole, and removing the steel. Bolt
installation involves making up bolt assemblies, inserting resins
in the hole if necessary, bending bolts, inserting bolts into the
hole, aligning the bolts, raising bolts, and spinning to mix resin
or torque the installed bolt. The sequence repeats until the as-
signed area of the roof is secure and then the machine trams to
a new location.
Roof bolting may be regarded as a fairly structured and
repetitive work situation. Although there is an established work
cycle, it is commonly altered due to external influences,
including variability in geology, interruption by coworkers and
supervisors, machine malfunctions, variability of supplies, etc.
The roof bolter operator is under constant production pressure
to install as many bolts in one 8-hr shift as necessary to keep up
with coal-cutting operations while remaining vigilant to all of
the possible dangers. Consequently, roof bolting work in a
newly exposed roof area involves even greater risk from the yet
unsupported and unknown conditions.
The roof bolter operator does his or her job in a confined
environment (see figure 5) in a limited working height, e.g.,
45 in, and in close proximity and in low visibility to a moving
drill head mounted on a boom arm 72 in long. This restricted
work environment can force the operator in awkward postures
for tasks that require quick reactions to avoid being contacted by
moving machine parts. Restricted visibility due to a protection
canopy and low lighting conditions further complicate the task.
Moreover, roof bolters work in a newly exposed roof area;
consequently, there is greater risk from the unsupported and
unknown conditions.
The range of the operator location is about 20 to 38 inches
from the boom arm because of the restricted work space or work
posture when performing the bolting tasks. This range of
distance brings the operator close to the boom arm while it is
moving. Subsequently, this closeness allows the operator to
easily reach the controls and perform tasks that require handling
the drill steel and bolt that attaches to the drill head located at
one end of the boom arm.
One major observation regarding the study by MSHA [1994]
was that there are no data on safe speeds for booms operating
close to workers in confined environments such as an
underground coal mine. To address this problem, the main
question that needs to be answered is: What range of boom
speeds minimizes the roof bolter operator's chances of contact
or possible injury without sacrificing job performance? This
question becomes even more important in light of potential rules
being discussed by MSHA on improving the design of roof
bolters. The information needed to answer the question is—
• When does the operator see the moving boom arm and
drill head during the bolting operation?
• How frequent are the contacts between the operator and
moving machine appendages?
• What are the distances between the operator's hands, arms,
legs, and head and the moving boom arm and drill head during
each of the operator's job tasks?
Figure 5.—A roof bolter operator's work posture in an
underground coal mine.
5
• How do changes in various work postures, such as
kneeling on one knee, kneeling on two knees, or standing,
impact the previous three questions?
To answer these questions effectively, a sufficient number of
studies must be done to collect data on contacts and variables
that influence them. A contact means the boom arm touches the
operator's hand, arm, head, or leg (figure 6). A contact does not
necessarily mean an injury. However, a severe injury or fatality
can occur if the operator makes contact while in a drill head or
boom arm pinch-point area. MSHA accident investigation
reports do not usually contain enough information to aid in
studying this particular problem, and lab experiments with
human subjects are not feasible because of safety issues.
Therefore, a computer simulation model approach was used as
the primary means to generate and collect the data during boom
arm movement [Ambrose 2000].
Previous studies by Klishis et al. [1993a,b] on worker job
performance and machinery and work environment identified
miners' risks and hazard exposures while bolting. More than
two dozen bolting-related problems (including specific human
behaviors) were recognized as potential situations that could
lead to injury or expose workers to injury. Approaches to avoid
these situations were suggested and applied at mining operations
to evaluate specific problems in roof bolting tasks. Turin et al.
[1995] conducted a human factors analysis of hazards related to
the movement of the drill head boom of a roof bolting machine.
Seven short-term recommendations to increase the safety of roof
bolting operations were developed: use a dead-man interlock
device to cut off power to the controls when the operator is out
of position, place fixed barriers at pinch points and other
dangerous areas, provide better control guarding, reduce the
fast-feed speed, use automatic cutoff switches for pinch points
and other dangerous areas, redesign the control bank to conform
to accepted ergonomic principles, and use resin insertion tools
and resin cartridge retainers.
RESEARCH
STUDY POPULATION
The study population used in the simulation software for any
virtual human model can cover the 5th through 95th percentile
for males and females. Using the wide-range capability of Jack
software to scale the operator's anthropometry, researchers made
three virtual operators that conformed to 25th-, 55th-, and 92nd-
percentile males (table 1). The three virtual human models were
chosen to match closely to human subject data that were col-
lected for model verification/validation and to study the target
population, which is 99% male. Since the goal of the lab tests
was not to duplicate the entire simulation population but only to
verify that the simulation model represents an accurate picture
of the roof bolter model, a small sample of 12 human subjects
from the local UMWA office was tested. Two female miners
were study volunteers that represented 20th- to 30th-percentile
male operators. Table 1 provides information on the height,
weight, age, and sex for the 12 subjects used in the motion
studies. The optimum viewing area tests used 12 subjects from
NIOSH-PRL since no special mining skill was involved and no
anthropometry data were needed.
MODEL VALIDATION
Two different methods to validate the model were chosen.
The first method was the traditional face validity evaluation by
roof bolter manufacturers and users. A questionnaire was de-
veloped and distributed to manufacturers, bolter operators, and
mine inspectors. The responders were shown two animations
that showed an operator performing roof bolting tasks: one was
the virtual operator produced from the motion-capture data, the
other was the virtual operator created from the model. The re-
spondents were asked to compare aspects of the animations
without knowing which motion source was shown in the ani-
mation by scoring on a scale from 4 being good to 1 being poor.
The virtual operator produced from the motion-capture data
scored an average of 2.55, the virtual operator created from the
model scored an average of 2.34, and the average difference in
questionnaire scoring was 0.64. Verification of the validity of
the model was first implied when 14 of 15 responders agreed
that the simulation animations did not differ significantly from
the animations of human operators.
Figure 6.—Virtual operator contacted in the left hand
(or fingers) and left leg.

6
Table 1.—Subject anthropometric data
SubjectHeight,
inWeight,
lbAge,years
SexOperatorpercentile
Percentileinterval
virtual25 . . . . . 66.4 159.4 — male 24 20–30virtual55 . . . . . 70.0 172.4 — male 54 50–60virtual92 . . . . . 71.8 187.0 — male 91 90–95human 1 . . . . . 71.0 187.2 47 male 84 80–90human 2 . . . . . 68.7 135.8 54 male 51 50–60human 3 . . . . . 69.4 177.7 41 male 61 60–70human 4 . . . . . 69.2 179.5 44 male 58 50–60human 5 . . . . . 70.4 185.9 49 male 79 70–80human 6 . . . . . 71.9 194.0 49 male 92 90–95human 7 . . . . . 66.5 169.8 53 female 24 (male) 20–30human 8 . . . . . 66.4 168.5 47 female 24 (male) 20–30human 9 . . . . . 69.7 183.9 50 male 63 60–70human 10 . . . . 71.8 198.2 47 male 91 90–95human 11 . . . . 69.3 183.0 44 male 59 50–60human 12 . . . . 68.3 174.9 48 male 49 40–50
Table 2.—Data that met the acceptance criteria
Work posture ConditionPercent met
criteriaBoth knees . . . . . . . .60-in seam average operator . . . . 71.43
Both knees . . . . . . . .60-in seam human subjectoperator . . . . . . . . . . . . . . . . . . . .
63.54
Right knee . . . . . . . .60-in seam average operator . . . . 71.07
Right knee . . . . . . . .60-in seam human subjectoperator . . . . . . . . . . . . . . . . . . . .
62.29
Standing . . . . . . . . . .72-in seam average operator . . . . 69.64
Standing . . . . . . . . . .72-in seam human subjectoperator . . . . . . . . . . . . . . . . . . . .
72.66
Starting position . . . .Average operator . . . . . . . . . . . . . 80.35Starting position . . . .Human subject operator . . . . . . . . 72.22
Overall average . . — 70.40
The second method compared the motions generated by thesimulation with motion data collected on human subjects.Although the predictions of the model could not be directlycompared, the accuracy of the movements used to generate"contact data" could be. The aspects of operator movements de-termined to be critical were the range of motion of operators andvariation in those movements.
Two sets of simulation data were generated from motion dataof the knee and standing work postures. The first used virtualoperators with anthropometric measurements identical to thoseof the 12 human subjects tested. Here, the data were comparedon a subject-to-subject basis. The second set used operatorsgenerated from Jack software in seven different anthropometricsizes. Researchers compared data to an average of the humansubjects within a 10th- percentile range, e.g., the Jack-generated55th-percentile operator was compared to the average of thesubjects in the 50th-60th percentile range.
The human subject movement data tended to vary greatlyfrom individual to individual, making it impractical for a directcomparison of each individual's exact path of movement. Be-cause the amount of movement and the variation of movementwere the primary concerns, the comparisons were made betweenthe statistical ranges by using standard deviation of movement.Researchers developed two sets of test data to verify the model.One set compared Jack-generated operators' motions in each ofthe anthropometric size ranges with human subject data aver-aged for that range ("average" operator). The other set
compared an individual test subject's motions with a simulationusing that subject's anthropometry ("human subject" operator).The criterion for acceptance of the simulation data was less than1.6-in difference from the human subject data, the static po-sitional accuracy of the motion-tracking system with theresolution settings used.
Table 2 shows the percentage of range of motion data byusing standard deviations that met the acceptance criteria. Thesimulations run using average operators (generated from Jacksoftware 25th-, 45th-, 55th-, 65th-, 75th-, 85th-, and 92nd-percentile persons) showed a greater percentage of standarddeviation values that met the acceptance criteria. This would beexpected since averaged standard deviation values were used asthe input data for the simulation. In general, the percentage ofagreement was good in relation to modeling a scenario with thecomplexity of roof bolting.
To assess the performance of the model, Bartels et al. [2003]report in detail the lab experiments and results that comparedmovements of the virtual human in the model to those of theirtest subject counterparts. The report also discusses the eval-uation of human motion and response time data to duplicateaccurately the skills and experience involved in operatingmining equipment.
EXPERIMENTAL DESIGN
The roof bolting operation was broken down into specifictasks. Klishis et al. [1993b] observed the tasks and the amountof time spent on each task. The task list provided a guide indeveloping the experimental design for lab human subject testsand motion scenarios for the computer simulations.
Early phases of roof bolter model development used inputparameter values that were guesses to allow development toprogress. Consequently, limited lab experiments were necessaryto determine input parameters (e.g., accurate field of vision,human response in roof bolting postures, human motionenvelopes of body appendages, and initial work startingpostures) for the roof bolter model and to validate the model andsimulations.
The computer model generates and collects contact databetween the machine and its virtual operator while recording

7
predictor variables, such as the seam height, the operator'sstarting positions, operator work postures, risky work behaviors,anthropometry, and the machine appendage velocity. Datacollected by the roof bolter model consist of counting thenumber of contacts and recording the time when a contacthappens.
Collected data were recorded to a file for each simulationscenario execution. The first line in the file contained informa-tion on the seam height, work posture, boom arm speed,operator anthropometry, and operator work behaviors. Further-more, the following information was recorded every 0.03 sec tothe file:
• Simulated time(s)• The operator's initial distance (in) from the boom arm• The boom arm distance (in) from a reference point on the
floor level• Distance calculations (in) between eight viewing area
reference points and a reference point on the boom arm to helpdetermine when the operator sees the boom arm
• A number marking sequential contacts between limbs andmachine appendage was recorded for each simulated frame.
The computer model contains seven variables having differ-ent levels. The seam height (three levels) consisted of 45, 60,and 72 in to accommodate the operator's work posture (fourlevels): right knee, left knee, both knees, and standing. Humansubject motion tests provided data that defined models of virtualhumans whose percentile interval ranged from the 24th to the92nd. The operator's final anthropometry (3 levels+) conformedto 25th-, 55th-, and 92nd-percentile males. Researchers alsocollected operator's starting locations from the human subjectmotion test data and calculated unique starting location valuesfor each subject as a function of the seam height and workpostures in that seam. The operator's risky behavior duringdrilling and bolt installation each had four levels. The fivelevels of the boom arm speeds—7, 10, 13, 16, and22 in/sec—were selected from MSHA [1994]. Researchers hadoriginally planned to collect data on four speeds. Based oninitial results from the data analysis of a four-speed database,researchers could not speak to the risks associated with speedsbetween 10 and 16 in/sec. Therefore, researchers included afifth speed, 13 in/sec, which split the difference between twoinitial speed levels.
A behavior motion is a series of human motions that mimicsa specific action. Studies on worker job performance and machin-ery and work environment identify miners' risky work behaviorand hazard exposures while bolting [Klishis et al. 1993a,b].Researchers used this information to identify specific riskybehaviors for the drilling operation and bolt installation (seetable 3 and figures in appendix G). Also, researchers were in-terested in work behaviors occurring only when the machineappendage had movement; consequently, other risky behaviorsassociated with operating a roof bolter were not used. Ambrose's[2004] decision algorithm was integrated within the model thatrandomly selects which behavior to use for a simulationexecution. Numerical parameters used in the algorithm came
from the percentage of operator actions that resulted in hazardexposure. These parameters were based on statistical observa-tions of bolter operator actions associated with unsafe acts[Klishis et al. 1993a].
Table 3.—Behavior list for drilling a hole and installing a bolt
Operation Work behavior descriptionDrill . . . . . Hand off the drill steel and hand off the boom arm.
Hand on the drill steel.Hand on the boom arm.Hand on the drill steel and then hand on the boom arm.
Bolt . . . . . Hand off the bolt or wrench and hand off the boom arm.Hand on the bolt or wrench.Hand on the boom arm.Hand on the bolt or wrench and then hand on the boomarm.
NOTE.—Klishis et al. [1993a,b] were not specific with regard to handlocation on the boom arm, drill steel, or wrench. In the simulations,researchers placed the hand on the boom arm approximately aft-end ofthe drill head and placed the hand on drill steel, bolt, or wrenchapproximately midsection of the item.
As part of the experiment design, the operator's chance ofavoiding a contact was also evaluated to ensure that an avoidincident (near-miss) would not be considered a contact. Thisrequired knowledge of when the operator sees the moving boomarm and the reaction time needed to avoid the boom arm.Investigators used information from Helander et al. [1987],Kobrick [1965], and Welford and Brebner [1980] to define apredetermined human response time— 250 msec (fast) and400 msec (slow)—to get out of the way of a moving boom armonce it is seen. Table 4 quantifies data to determine "fast" and"slow" reaction times of operators as a function of seam height,work posture, and operators' anthropometric data.
Investigators originally used a viewing area for the virtualoperator that was a cone with an oval directrix as defined byHumantech [2003] to experiment with the virtual human'svision-tracking capabilities. For acceptable viewing in reducedlighting conditions found in underground mines, MSHA'sminimum lighting requirements mandate illumination levels of0.06 fL. The viewing area was modified from lab test results onhuman subjects that determined the optimal viewing area andaccurate field of vision for the virtual human in undergroundmines (figure 7).
Because investigators did not have access to the simulationsoftware source code, the operator's reaction time in combi-nation with the viewing area could not be made an integral partof the computer model. Consequently, when executing simu-lations, recorded data included time of contacts and when theboom arm was in and out of the operator's view. Subsequently,during data postprocessing of the contact database, a collisioncheck algorithm compared time-pairings of when the boom armwas in and out of view to determine suspected avoid incidents(near-misses). The results provided investigators with enoughinformation that identified contacts that could be avoided by theoperator.
The 25th-, 55th-, and 92nd-percentile operator models wereplaced in a virtual mine environment that contained a model of

8
Figure 7.—Angular data of the original and modified viewing areas for the
virtual operator.
Table 4.—Reaction times of operators used in the roof bolter model, milliseconds
Operatorpercentile
45-IN SEAM HEIGHTRight-knee
work postureLeft-knee
work postureBoth-knees
work postureFast
reactiontime
Slowreaction
time
Fastreaction
time
Slowreaction
time
Fastreaction
time
Slowreaction
time25th . . . . . . 436 736 356 656 376 67655th . . . . . . 401 701 366 666 397 69792nd . . . . . 330 630 384 684 349 649
Operatorpercentile
60-IN SEAM HEIGHTRight-knee
work postureLeft-knee
work postureBoth-knees
work postureFast
reactiontime
Slowreaction
time
Fastreaction
time
Slowreaction
time
Fastreaction
time
Slowreaction
time25th . . . . . . 370 670 376 676 356 65655th . . . . . . 333 633 392 692 353 65392nd . . . . . 403 703 424 724 375 675
Operatorpercentile
72-IN SEAM HEIGHTStanding
work postureFast
reactiontime
Slowreaction
time25th . . . . . . 374 67455th . . . . . . 376 67692nd . . . . . 388 688
9
a Fletcher8 roof bolter boom arm assembly. When using thevirtual mine environment, simulations were executed on eachpercentile operator while performing 1 of 35 possible scenarios(table 5). For example, simulation scenario 17 (in table 5) is oneobservation for any percentile operator who performs boltingtasks in a seam height of 60 in, on the left knee, and with a
8J. H. Fletcher & Co. was a project collaborator. Fletcher provided
information on a roof bolting machine. The company is the largest U.S.
manufacturer of roof bolting equipment.
boom arm operating at a speed of 7 in/sec. The scenarios con-sisted of various combinations of the seam height, work posture,and boom arm speed. Researchers did not simulate the standingwork posture in the two lower seam heights. Also, the kneework postures were not simulated in the highest seam height.When simulating any scenario, each simulation executionrepresented one observation, and information for thatobservation was recorded to one data file.
Table 5.—Thirty-five possible simulation scenarios for each operator percentile
Scenario
Seam height, in Work posture Boom speed, in/sec
45 60 72Rightknee
Leftknee
Bothknees
Standing 7 10 13 16 22
1 . . . . . .
2 . . . . . .
3 . . . . . .
4 . . . . . .
5 . . . . . .
6 . . . . . .
7 . . . . . .
8 . . . . . .
9 . . . . . .
10 . . . . .
11 . . . . .
12 . . . . .
13 . . . . .
14 . . . . .
15 . . . . .
16 . . . . .
17 . . . . .
18 . . . . .
19 . . . . .
20 . . . . .
21 . . . . .
22 . . . . .
23 . . . . .
24 . . . . .
25 . . . . .
26 . . . . .
27 . . . . .
28 . . . . .
29 . . . . .
30 . . . . .
31 . . . . .
32 . . . . .
33 . . . . .
34 . . . . .
35 . . . . .
10
Table 6 shows how the simulation executions were organized
into test series called data sets. The test series helped re-
searchers with distributing the work in gathering data from
simulation executions. Data sets were developed by using all of
the simulation scenarios reflected in table 5. A data set contains
a fixed seam height, boom arm speed, operator work posture,
and anthropometry. Furthermore, data sets were also used to
help show results in frequency data analysis.
Table 7 summarizes the factors (per seam height) that were
used to generate observations (data files) that made up the
research database. Note that the database represents the equiva-
lence of actual field observations of roof bolting work in
underground coal mines for a period of 12.15 eight-hour shifts.
The 8-hr shift data were calculated using information from an
unpublished time study of a roof bolter cycle time that installed
4-ft bolts with a dual-boom bolter equipped with an automatic
temporary roof support system. The roof bolter equipment in
the time study was the same machine model and bolt length used
in the simulation.
MEASUREMENTS
Virtual human models that matched closely to human subject
data collected for model verification/validation were given
specific instructions as to how to perform the bolting tasks for
each of the simulation scenarios. In each condition, the virtual
operator was required to work in the starting posture throughout
the tasks. Three kneeling postures were used in the two lower
seam heights. The standing posture was used in the unrestricted
(high) seam. The standing postures for the two taller operators
were flexing more toward the right side and forward to
accommodate the workspace and proper right-hand alignment
with the machine controls. This posturing was also observed
during lab tests that collected human subject motion data for
validating the model. The random starting position between the
operator and boom arm were based on seam height and the
operator's work posture according to results from human subject
lab tests. Each virtual operator faced perpendicular to the long
side of the boom arm, and the machine controls were always to
Table 6.—Data sets composed of conditions, operator percentile, and assigned numbering scheme
Conditions1 Operatorpercentile
Execution'sassigned
number rangeConditions1 Operator
percentile
Execution'sassigned
number rangeConditions1 Operator
percentile
Execution'sassigned
number range
4507R . . . . . 25th 0000 0049 6007R . . . . . . 25th 1800 1849 7207S . . . . . . 25th 3600 364955th 0050 0099 55th 1850 1899 55th 3650 369992nd 0100 0149 92nd 1900 1949 92nd 3700 3749
4507L . . . . . 25th 0150 0199 6007L . . . . . . 25th 1950 1999 7210S . . . . . . 25th 3750 379955th 0200 0249 55th 2000 2049 55th 3800 384992nd 0250 0299 92nd 2050 2099 92nd 3850 3899
4507B . . . . . 25th 0300 0349 6007B . . . . . . 25th 2100 2149 7216S . . . . . . 25th 3900 394955th 0350 0399 55th 2150 2199 55th 3950 399992nd 0400 0449 92nd 2200 2249 92nd 4000 4049
4510R . . . . . 25th 0450 0499 6010R . . . . . . 25th 2250 2299 7222S . . . . . . 25th 4050 409955th 0500 0549 55th 2300 2349 55th 4100 414992nd 0550 0599 92nd 2350 2399 92nd 4150 4199
4510L . . . . . 25th 0600 0649 6010L . . . . . . 25th 2400 2449 4513R . . . . . . 25th 4200 424955th 0650 0699 55th 2450 2499 55th 4250 429992nd 0700 0749 92nd 2500 2549 92nd 4300 4349
4510B . . . . . 25th 0750 0799 6010B . . . . . . 25th 2550 2599 4513L . . . . . . 25th 4350 439955th 0800 0849 55th 2600 2649 55th 4400 444992nd 0850 0899 92nd 2650 2699 92nd 4450 4499
4516R . . . . . 25th 0900 0949 6016R . . . . . . 25th 2700 2749 4513B . . . . . . 25th 4500 454955th 0950 0999 55th 2750 2799 55th 4550 459992nd 1000 1049 92nd 2800 2849 92nd 4600 4649
4516L . . . . . 25th 1050 1099 6016L . . . . . . 25th 2850 2899 6013R . . . . . . 25th 4650 469955th 1100 1149 55th 2900 2949 55th 4700 474992nd 1150 1199 92nd 2950 2999 92nd 4750 4799
4516B . . . . . 25th 1200 1249 6016B . . . . . . 25th 3000 3049 6013L . . . . . . 25th 4800 484955th 1250 1299 55th 3050 3099 55th 4850 489992nd 1300 1349 92nd 3100 3149 92nd 4900 4949
4522R . . . . . 25th 1350 1399 6022R . . . . . . 25th 3150 3199 6013B . . . . . . 25th 4950 499955th 1400 1449 55th 3200 3249 55th 5000 504992nd 1450 1499 92nd 3250 3299 92nd 5050 5099
4522L . . . . . 25th 1500 1549 6022L . . . . . . 25th 3300 3349 7213S . . . . . . 25th 5100 514955th 1550 1599 55th 3350 3399 55th 5150 519992nd 1600 1649 92nd 3400 3449 92nd 5200 5249
4522B . . . . . 25th 1650 1699 6022B . . . . . . 25th 3450 349955th 1700 1749 55th 3500 354992nd 1750 1799 92nd 3550 3599
1The first two digits represent seam height (in). The second two digits represent boom arm speed (in/sec). The letter represents work postureas follows: R = right knee; L = left knee; B = both knees; S = standing.

11
Table 7.—Factors that determined the number of observations (simulation executions)per seam height
Observationtotals
Seamheight, in
Factors
OperatorsBoom
speedsWork
posturesSimulationexecutions
2,250 . . . . . . . . 45 3 5 3 502,250 . . . . . . . . 60 3 5 3 50750 . . . . . . . . . 72 3 5 1 50Overall - 5,250 — — — — —
Table 8.—Sample data output file
CONF=1 SEAM=2 POST=3 SPED=1 SUBJ=1 BEHD=1 BEHB=1time OPL V1 V2 V3 V4 V5 V6 V7 V8 BAM LPB LPD LAB LAD LLB LLD RLB RLD HDB0.03 54. -4. 38. 5. 63. 28. 58. 32. 20. 19. 0. 0. 0. 0. 0. 0. 0. 0. 0.0.06 54. -4. 38. 5. 63. 28. 58. 32. 20. 19. 0. 0. 0. 0. 0. 0. 0. 0. 0.0.10 54. -4. 38. 5. 63. 28. 58. 32. 20. 19. 0. 0. 0. 0. 0. 0. 0. 0. 0.0.13 54. -4. 38. 5. 63. 28. 58. 32. 20. 19. 0. 0. 0. 0. 0. 0. 0. 0. 0.0.16 54. -4. 38. 5. 63. 28. 58. 32. 20. 19. 0. 0. 0. 0. 0. 0. 0. 0. 0.0.20 54. -4. 38. 5. 63. 28. 58. 32. 20. 19. 0. 0. 0. 0. 0. 0. 0. 0. 0.0.23 54. -4. 38. 5. 63. 28. 58. 32. 20. 19. 0. 0. 0. 0. 0. 0. 0. 0. 0.
First line and columns of data file (coded) Subsequent lines and columns in data file
CONF - machine control configuration 1=piano key controlsSEAM - seam height 1=45 in; 2=60 in; 3=72 inPOST - work posture 1=right knee; 2=left knee; 3=both knees; 4=standingSPED - boom arm speed 1=7 in/sec; 2=10 in/sec 3=16 in/sec; 4=22 in/sec 5=13 in/secSUBJ - operator's anthropometry 1=25th; 2=55th; 3=92ndBEHD - operator's behavior during the drilling task 1=none; 2=hand on drill 3=hand on boom; 4=hand on bothBEHB - operator's behavior during the bolting task 1=none; 2=hand on bolt 3=hand on boom; 4=hand on both
time - simulated time, secOPL - operator's distance from the boom arm, inV1 through V8 - reference points on the vision cone whose values areused to determine if the boom arm is seen by the operatorBAM - to determine boom arm movement, a distance is measuredbetween a floor reference point and boom arm reference, inLPB through HDB - a numerical marking that indicates if a contactoccurred between an operator limb and machine appendage. "1"means contact; "0" means no contact.LPB / LPD = left palm with boom / with drill headLAB / LAD = left forearm with boom / with drill headLLB / LLD = left leg with boom / with drill headRLB / RLD = right leg with boom / with drill headHDB = head with boom arm
the operator's right. The virtual operator grabbed the tools (drill
steel, bolt, or wrench) with the right hand, passed the tool off to
the left hand, and grabbed them with both hands to finish setting
the tool in the drill head and/or hole in the mine ceiling (mine
roof).
Once the preparation for the drilling or bolt installation task
was completed, the right hand was positioned on the appropriate
lever that controlled the boom arm's vertical movement. Boom
arm speed was the same ascending and descending. During the
boom arm movement, the left hand's motion would be one of
four possible risky work behaviors as defined in table 3. At no
time during boom arm movement was the virtual operator
positioned in a pinch-point area of the drill head or boom arm.
When the virtual operator and machine interacted and
resulted in touching, the event was defined as a contact.
Researchers were interested in contacts occurring only when the
machine appendage was moving. Furthermore, the model
included random operators' motions before and after the boom
arm appendage moved [Ambrose 2004]. These motions helped
to improve motion accuracy through random positioning of the
arm and hand just before or after appendage movement. Also,Figure 8.—A view of the roof bolter model from a
computer monitor.

12
these motions made the overall model (figure 8), when
simulated, look visually realistic.
Data were collected according to the organized data sets
(table 5). Three separate computers were used in the data-
gathering phase of the study. Using different computers did not
influence simulation outcomes because a copy of the simulation
model executed perfectly on all computers. No changes or
modifications to the model were necessary for any of the
computers used in data collection. The data collection phase
took 5 months to complete.
Researchers had each of the 5,250 simulation executions
stored in separate data files. One data file contained lines of
information identified by a timeframe. The number of
timeframes varied because the length of a simulation execution
changed due to one or more of the following: boom speed,
seam height, or risky work behavior. A timeframe constitutes
one line of data in the output file, except for the first line in the
file, which describes each simulation scenario. Table 8 shows
several lines of a data file. The table also includes definitions
for line and column descriptors.
DATA ANALYSIS
Results of this analysis of roof bolter simulations provideinformation that could be quite helpful in making recom-mendations to reduce the likelihood that roof bolter operatorsget injured from contact with a moving boom arm. Researchersbelieve that the use of such simulations, treated with frequencyand cross-tabulation and advanced statistical procedures such aslogistic regression and survival analysis, provide extremelyuseful tools to evaluate potential hazards of tasks where it is notpossible to perform experiments with human subjects.
NIOSH contracted with Science Applications InternationalCorp. (SAIC), Augusta, GA, to assist in the data-postprocessingphase of the research. SAIC postprocessed data from 5,250simulation executions with the aid of a customized softwareprogram whose algorithm followed the flow diagram in figure 9.SAIC generated the final database by developing a customizedprogram based on NIOSH's algorithm that detailed sequencesfor examining the simulation results. NIOSH analysts usedSAIC's final database for this portion of the study.
The resulting database contains information representingvariables that could influence predictions of contact incidentsbetween the operator's body parts and the moving boom arm anddrill head. The determinations of contact incidents for eachsimulation execution resulted in four possible occurrences:
• A contact between the machine and the operator for aperson with both slow and fast reactions.
• A contact between the machine and the operator for aperson with only slow reactions.
• An avoid incident (near-miss) where a contact occurred inthe simulation, but postanalysis determined that the operatorsaw the bolter boom arm and had fast enough reactions to getout of the way of (avoid) the contact.
• A complete simulation execution where no contacts oravoid incidents occurred (none).
A simulation execution would continue to completion eventhough it was possible for a single simulation to have multiplecontacts and avoids. The presence of multiple incidents in asingle simulation execution meant that data analysis could bedone on either a data set containing avoids and all contacts (allof the contacts) or one incident per simulation execution(one run/one contact). Consequently, researchers made twoseparate sets of data from the initial postprocessed database.
Table 9 compares the two sets of data. This comparison
showed that the source of contact incidents and the relationship
of the variables associated with the incidents did not differ
significantly for the two. The one run/one contact data set was
also considered by researchers to more accurately represent the
real-world situation, as an operator would most likely stop or
at least pause after being struck with a moving machine
appendage. The one run/one contact data set also lent itself to
other types of data analysis techniques such as logistic
regression and survival analysis.
Analysis also shows that the reaction time of the operator did
not significantly affect the outcome of the simulation (table 10).
The number of contact incidents for an operator with slow
reactions differed from those for an operator with fast reactions
by less than 1% in both data sets. The results were as expected
insofar as there was a difference. There was a reasonable
difference in reaction times between fast and slow operators
obtained from reaction time tests on our human subjects.
However, the speculation as to why a small difference in
contacts might be reflected in the speed range of the boom being
studied is that if the operator with fast reactions could not get
out of the path of the boom, the slower operator certainly would
not either. Also, depending on the stimulus, small differences
were found in some reaction time test cases in the literature
search. Moreover, literature reviews were not helpful with
whole-body reaction of the upper torso and limbs in confined
spaces, which was a concern in our research.
The following sections contain frequency and cross-
tabulation, logistic regression, and survival analyses. All
analyses were conducted using only the occurrences for the
operator with slow reactions that included one contact per sim-
ulation executions (one run/one contact). Frequency analysis is
the simplest method to observe how different categories of
values are distributed in the sample database. Customarily, if a
data set includes any categorical data (e.g., seam height,
appendage speed, work posture, etc.), then one of the first steps
in the data analysis is to compute a frequency table for those
variables. Cross-tabulation is a combination of two (or more)
frequency tables arranged such that each cell in the resulting
table represents a unique combination of specific values of
cross-tabulated variables. Thus, cross-tabulation allows re-
searchers to examine frequencies of observations that belong to

13
Figure 9.–Flowchart of NIOSH’s algorithm for processing the simulation data files.

14
Table 9.—Comparison of one contact per execution versus all contacts
VariableReaction
timeOne run/one contact All contacts
Avoid incidents Contacts Avoid incidents ContactsSeam height, in . . . . . . . . . . Slow . . . . . 45>60>72 60>45>72 60>45>72 60>72>45
Fast . . . . . . 45>60>72 60>45>72 60>45>72 60>72>45Operator percentile . . . . . . . . Slow . . . . . 92>55>25 25>55>92 25>55>92 25>55>92
Fast . . . . . . 55>25>92 25>55>92 25>55>92 25>55>92Work posture1 . . . . . . . . . . . . Slow . . . . . L>B>R>S B>R>L>S L>B>R>S B>R>S>L
Fast . . . . . . L>B>R>S B>R>L>S L>B>R>S B>R>L>SBoom arm speed, in/sec . . . . Slow . . . . . 10>13>7>22>16 16>22>13>10>7 10>13>7>16>22 16>22>7>13>10
Fast . . . . . . 10>13>7>22>16 16>22>7>10 10>13>7>16>22 16>22>7>13>10Drilling behavior2 . . . . . . . . . Slow . . . . . B>D&B>N>D B>D&B>N>D B>D&B>N>D B>N>D&B>D
Fast . . . . . . B>D&B>N>D B>N>D&B>D B>D&B>N>D B>N>D&B>DBolting behavior3 . . . . . . . . . Slow . . . . . N>B>BT>BT&B B>N>BT&B>BT B>N>BT&B>BT B>BT&B>N>BT
Fast . . . . . . B>N>BT>BT&B B>N>BT&B>BT B>N>BT&B>BT B>BT&B>N>BTBoom direction4 . . . . . . . . . . Slow . . . . . D>U U>D D>U U>D
Fast . . . . . . D>U U>D D>U U>DBody part5 . . . . . . . . . . . . . . . Slow . . . . . H>L>A>HD H>L>HD>A H>L>A>HD H>A>L>HD
Fast . . . . . . H>L>A>HD H>L>HD>A H>L>A>HD H>A>L>HDSide6 . . . . . . . . . . . . . . . . . . . Slow . . . . . L>R>HD L>HD>R L>R>HD L>HD>R
Fast . . . . . . L>R>HD L>HD>R L>R>HD L>HD>RMachine part7 . . . . . . . . . . . . Slow . . . . . B>D B>D B>D B>D
Fast . . . . . . B>D B>D B>D B>D1L = left knee; R = right knee; B = both knees; S = standing.2B = hand on boom; D = hand on drill steel; D&B = hand on drill steel then on boom; N = none.3B = hand on boom; BT = hand on bolt; BT&B = hand on bolt then on boom; N = none.4D = down; U = up.5H = hand; L = leg; A = arm; HD = head.6L = left; R = right; HD = head.7B = boom; D = drill head.
Table 10.—Results of slow versus fast reaction for simulation executions
All contacts One contact per simulation
Frequency PercentCumulative
percentFrequency Percent
Cumulativepercent
SLOW OPERATORAvoid . . . . . 2,777 27.02 27.02 755 14.38 14.38Contact . . . . 5,798 56.42 83.45 2,750 52.38 66.76None . . . . . . 1,701 16.55 100.00 1,745 33.24 100.00 Total . . . . 10,276 100.00 — 5,250 100.00 —
FAST OPERATORAvoid . . . . . 2,768 26.94 26.94 799 15.22 15.22Contact . . . . 5,807 56.51 83.45 2,706 51.54 66.76None . . . . . . 1,701 16.55 100.00 1,745 33.24 100.00 Total . . . . 10,276 100.00 — 5,250 100.00 —
specific categories for more than one variable. By examining
these frequencies, researchers can identify relationships between
cross-tabulated variables and provide information on trends to
use other statistical approaches for the database.
Logistic regression is a technique used for relating one or
more independent variables to an outcome variable, which fol-
lows a binomial rather than a normal distribution. This model
is useful for identifying risk factors related to the presence or
absence of a condition. Researchers used the logit (logistic)
transformation of p (the probability of an event or nonevent) as
the dependent variable. Complex numerical algorithms are gen-
erally required to fit the parameters of the model.
Survival analysis is a statistical technique that allows re-
searchers to determine factors that influence both whether an
event occurs (for example, contact between the boom and
operator) and the time until that event occurs. In the present
situation, this event might represent contact between the boom
of the roof bolter and the worker operating the machine at some
point in the period of a simulation execution. Since several
variables (such as boom speed, work posture, worker behaviors,
etc.) were varied in the simulations, survival analysis can be
used to evaluate which of these factors were most important in
terms of predicting an event (contact), as well as whether certain
work behaviors, postures, or other factors might actually protect
a worker from experiencing a contact.
Presenting various approaches to data analysis was part of the
research objective, and each analysis technique used the same
database. However, we do not recommend comparing results
from each approach because of the differences in underlying
mathematics, the computational details, and expected outcomes.
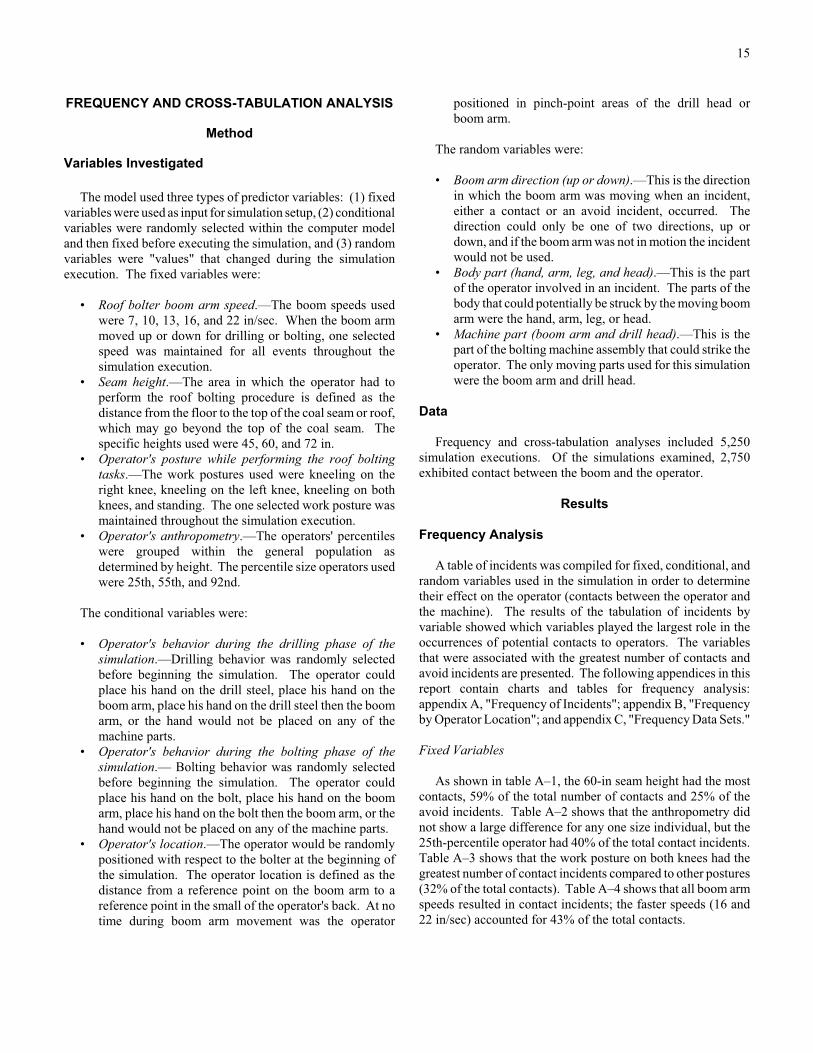
15
FREQUENCY AND CROSS-TABULATION ANALYSIS
Method
Variables Investigated
The model used three types of predictor variables: (1) fixed
variables were used as input for simulation setup, (2) conditional
variables were randomly selected within the computer model
and then fixed before executing the simulation, and (3) random
variables were "values" that changed during the simulation
execution. The fixed variables were:
• Roof bolter boom arm speed.—The boom speeds used
were 7, 10, 13, 16, and 22 in/sec. When the boom arm
moved up or down for drilling or bolting, one selected
speed was maintained for all events throughout the
simulation execution.
• Seam height.—The area in which the operator had to
perform the roof bolting procedure is defined as the
distance from the floor to the top of the coal seam or roof,
which may go beyond the top of the coal seam. The
specific heights used were 45, 60, and 72 in.
• Operator's posture while performing the roof bolting
tasks.—The work postures used were kneeling on the
right knee, kneeling on the left knee, kneeling on both
knees, and standing. The one selected work posture was
maintained throughout the simulation execution.
• Operator's anthropometry.—The operators' percentiles
were grouped within the general population as
determined by height. The percentile size operators used
were 25th, 55th, and 92nd.
The conditional variables were:
• Operator's behavior during the drilling phase of the
simulation.—Drilling behavior was randomly selected
before beginning the simulation. The operator could
place his hand on the drill steel, place his hand on the
boom arm, place his hand on the drill steel then the boom
arm, or the hand would not be placed on any of the
machine parts.
• Operator's behavior during the bolting phase of the
simulation.— Bolting behavior was randomly selected
before beginning the simulation. The operator could
place his hand on the bolt, place his hand on the boom
arm, place his hand on the bolt then the boom arm, or the
hand would not be placed on any of the machine parts.
• Operator's location.—The operator would be randomly
positioned with respect to the bolter at the beginning of
the simulation. The operator location is defined as the
distance from a reference point on the boom arm to a
reference point in the small of the operator's back. At no
time during boom arm movement was the operator
positioned in pinch-point areas of the drill head or
boom arm.
The random variables were:
• Boom arm direction (up or down).—This is the direction
in which the boom arm was moving when an incident,
either a contact or an avoid incident, occurred. The
direction could only be one of two directions, up or
down, and if the boom arm was not in motion the incident
would not be used.
• Body part (hand, arm, leg, and head).—This is the part
of the operator involved in an incident. The parts of the
body that could potentially be struck by the moving boom
arm were the hand, arm, leg, or head.
• Machine part (boom arm and drill head).—This is the
part of the bolting machine assembly that could strike the
operator. The only moving parts used for this simulation
were the boom arm and drill head.
Data
Frequency and cross-tabulation analyses included 5,250
simulation executions. Of the simulations examined, 2,750
exhibited contact between the boom and the operator.
Results
Frequency Analysis
A table of incidents was compiled for fixed, conditional, and
random variables used in the simulation in order to determine
their effect on the operator (contacts between the operator and
the machine). The results of the tabulation of incidents by
variable showed which variables played the largest role in the
occurrences of potential contacts to operators. The variables
that were associated with the greatest number of contacts and
avoid incidents are presented. The following appendices in this
report contain charts and tables for frequency analysis:
appendix A, "Frequency of Incidents"; appendix B, "Frequency
by Operator Location"; and appendix C, "Frequency Data Sets."
Fixed Variables
As shown in table A–1, the 60-in seam height had the most
contacts, 59% of the total number of contacts and 25% of the
avoid incidents. Table A–2 shows that the anthropometry did
not show a large difference for any one size individual, but the
25th-percentile operator had 40% of the total contact incidents.
Table A–3 shows that the work posture on both knees had the
greatest number of contact incidents compared to other postures
(32% of the total contacts). Table A–4 shows that all boom arm
speeds resulted in contact incidents; the faster speeds (16 and
22 in/sec) accounted for 43% of the total contacts.

16
Conditional Variables
Data in tables A–5 and A–6 show that the hand-on-boom
behavior for drilling or bolting had more contacts than any other
drilling or bolting behavior. Table B–1 showed three locations
with increased contact incidents: 21.7, 29.9, and 30.3 in.
Further sorting of operator location indicated that the increase
at 21.7 in was associated with increased head incidents with the
operator on both knees in a 60-in seam height (see tables B–2 to
B–4). The increase in incidents at 29.9 and 30.3 in were as-
sociated with the operator in a standing position and an increase
in contacts with the hand (see tables B–2 and B–3).
Random Variables
Table A–7 shows the boom arm upward direction had
significantly more contacts (76% of the total) and fewer avoid
incidents (37% of the total) than the down direction. Table A–8
shows the hand was involved in 67% of all contact incidents.
Table A–9 shows the boom arm was the closest moving
machine part to the operator and accounted for 80% of all
contact incidents.
Data Sets
Frequency analysis was done on the data sets described in
table 6. The data set for each simulation execution was a pre-
determined set of the variables assigned for a set of
50 simulation executions. An example of this would be 45R07,
which defines the set of conditions for a 45-in seam height, with
the operator on the right knee and the boom arm speed set at
7 in/sec. Examining the data sets in tables C–1 and C–2 con-
firms trends seen when the results for the individual variables
were analyzed. Examples of this analysis show: (1) data sets
6022B and 6016B (60-in seam height with the operator on both
knees) had the most contacts, (2) data sets 4510L and 4510B
(45-in seam height with the operator on both knees) had the
most avoid incidents, and (3) the hand for data set 7207S and
the head for data set 6022B had the most contacts.
Cross-tabulation Analysis
A cross-tabulation of incidents was compiled for selected
variables used in the simulation in order to determine their effect
on contacts between the operator and machine. The results of
the tabulation of contact incidents by variable showed which
variables played the largest role in the occurrences of potential
contacts to operators (see appendix D).
Seam Height Versus Random Variables
In comparing seam heights against boom direction, body
part, and machine part (tables D–1 to D–3), the following
relationships were identified. Regardless of seam height, contact
incidents were always greater on the hand, always greater for
the boom arm part of the machine, and always greater when the
boom arm was moving up. The greatest number of contacts was
always associated with the 60-in seam. The greatest number of
contacts occurred for the 60-in seam with the boom moving up
(46% of all contacts), the 60-in seam with contact on the hand
(32% of all contacts), and the 60-in seam with contact made
with the machine boom (47% of all contacts). The fewest
number of contacts occurred for the 72-in seam with the boom
moving down and the 45-in seam with contact made with the
drill head. Zero contacts occurred with the operator's leg at a
45-in seam height and with the operator's head at a 72-in seam
height.
Subject Versus Random Variables
In comparing subjects against boom arm direction, body part,
and machine part (tables D–4 to D–6), the following rela-
tionships were identified. Regardless of subject size, contact
incidents were always greater when the boom was moving up,
always greater on the hand, and always greater for the boom part
of the machine. The greatest number of contacts was always as-
sociated with the 25th-percentile size, and the fewest number of
contacts always occurred with the 92nd-percentile size. The
greatest number of contacts occurred for the 25th-percentile size
with the boom moving up (29% of all contacts), occurred on the
hand (27% of all contacts), and involved the machine boom
(31% of all contacts). The fewest number of contacts occurred
for the 92nd-percentile size with the boom moving down,
occurred on the arm, and involved the drill head.
Work Posture Versus Random Variables
Analysts identified several relationships when comparing
work posture against boom direction, body part, and machine
part (see tables D–7 to D–9). Regardless of posture, contact in-
cidents were always greater when the boom was moving up,
always greater on the hand, and always greater for the boom part
of the machine. The greatest number of contacts occurred for
the both-knee work posture with the boom moving up (27% of
all contacts), the right-knee posture with contact made with the
hand (18% of all contacts), and the both-knee posture with
contact made with the machine boom (25% of all contacts). The
fewest number of contacts occurred for the standing posture
with the boom moving down and for the standing posture with
contact made with the drill head. Zero contacts occurred for the
cases involving the operator's head in the right-knee, left-knee,
and standing work postures and for those involving the
operator's leg in the both-knee posture.
Drilling Behavior Versus Random Variables
Analysts identified several relationships when comparing
drilling behavior against boom direction, body part, and ma-
chine part (see tables D–10 to D–12). Regardless of drilling
behavior, contact incidents were always greater when the boom
was moving up, always greater on the hand, and always greater
for the boom part of the machine. The greatest number of

17
contacts occurred for the hand-on-boom behavior with the boom
moving up (42% of all contacts), occurred on the hand (41% of
all contacts), and involved the machine boom (45% of all
contacts). The fewest number of contacts occurred for the
hand-on-drill-steel behavior with the boom moving down,
hand-on-drill-steel behavior with contact on the arm, and hand-
on-drill-steel-behavior involving the drill head part of the
machine.
Bolting Behavior Versus Random Variables
Analysts identified several relationships when comparing
bolting behavior against boom direction, body part, and machine
part (see tables D–13 to D–15). Regardless of bolting behavior,
contact incidents were always greater when the boom was
moving up, always greater on the hand, and always greater for
the boom part of the machine. The greatest number of contacts
occurred for the hand-on-boom behavior with the boom moving
up (26% of all contacts), occurred on the hand (27% of all
contacts), and involved the machine boom (32% of all contacts).
The fewest number of contacts occurred for the hand-on-bolt
behavior with the boom moving down, the hand-on-boom-
then-bolt behavior with contact on the arm, and the hand-on-bolt
behavior with contact made with the drill head.
Boom Speed Versus Fixed, Conditional, and Random Variables
Analysts identified several relationships when comparing
boom speed against boom direction, body part, and machine part
(table D–16 to D–18). Regardless of boom speed, contact
incidents were always greater when the boom was moving up,
always greater on the hand, and always greater for the boom part
of the machine. The greatest number of contacts occurred at the
16 in/sec speed for the following: boom moving up (17% of all
contacts), hand part of the body (16% of all contacts), and the
boom part of the machine (18% of all contacts). The fewest
number of contacts occurred for the 10-in/sec speed with the
boom moving down, the 7-in/sec speed involving contact with
the arm, and the 22-in/sec speed involving contact with the drill
head.
Analysts identified several relationships when comparing
boom speed against work posture, subject, drilling behavior,
bolting behavior, and seam height (tables D–19 to D–23). For
all boom speeds, the work posture on both knees had the
greatest number of contacts and the standing posture had the
fewest number of contacts. The greatest number of contacts
occurred for the 16-in/sec speed with the work posture on both
knees; the fewest number of contacts occurred for the 22-in/sec
speed while standing. Regardless of boom speed, the 25th-
percentile sizes had the greatest number of contacts while,
regardless of speed, the 92nd-percentile size had the fewest
number of contacts. The greatest number of contacts occurred
for the 13-in/sec speed at the 25th-percentile size. The fewest
number of contacts occurred for the 10-in/sec speed at the 92nd-
percentile size. Regardless of boom speed, the 60-in seam
height had the greatest number of contacts. The 72-in seam had
the fewest number of contacts for all speeds except 10 in/sec,
where the 45-in seam had the fewest. The greatest number of
contacts was associated with the 16 in/sec speed at the 60-in
seam height. The fewest number of contacts was for the
10-in/sec speed at the 45-in seam height. Regardless of boom
speed, the hand-on-boom drilling behavior had the most
contacts and, regardless of speed, the hand-on-boom bolting
behavior had the most contacts. Regardless of speed, the
hand-on-drill-steel drilling behavior had the fewest number of
contacts and, regardless of speed, the hand-on-bolt bolting
behavior had the fewest number of contacts. For the drilling
behaviors, the greatest number of contacts was for 13 in/sec and
hand on the boom; the fewest number of contacts was for
13 in/sec and hand on the drill steel. For the bolting behaviors,
the greatest number of contacts was for 13 in/sec and hand on
the boom; the fewest was for 10 in/sec and hand on the bolt.
Summary
The frequency-fixed variable analyses showed the following:
• The faster boom speeds of 16 and 22 in/sec combined
accounted for the greatest number of contacts (43% of the
total).
• The seam height of 60 in had the most contacts, with 59%
of the total number of contacts and 25% of the avoid
incidents.
• A work posture on both knees had the greatest number of
contact incidents compared to other postures (32% of the
total contacts).
• The 25th-percentile individual had slightly more contact
incidents than the other size individuals.
The frequency-conditional variable analyses showed the
following:
• 42% of all contacts occurred for the hand-on-boom
behavior when the boom was moving up.
• 41% of all contacts occurred for the hand-on-boom
behavior with contact made with the hand.
• 45% of all contacts occurred for the hand-on-boom
behavior with contact made with the machine boom.
The frequency-random variable analyses showed the
following:
• The hand was the closest body part to the moving boom
arm and was involved in 67% of all contact incidents.
• The boom was the closest moving machine part to the
operator and accounted for 80% of all contacts.
• Regardless of other variables, contact incidents were
always greater when the boom was moving up.
The cross-tabulation/fixed-variable analyses showed the
following:
• Regardless of boom speed, 92nd-percentile-sized operators
experienced fewer contacts than other operator sizes.
• Regardless of boom speed, 25th-percentile-sized operators
experienced more contacts than other operator sizes.

18
The cross-tabulation/fixed-random-variable analyses showed
the following:
• 46% of all contacts occurred in the 60-in seam with the
boom moving up.
• 47% of all contacts occurred in the 60-in seam and
involved the machine boom.
LOGISTIC REGRESSION ANALYSIS
Method
An initial approach to the modeling of the roof bolter
simulation data used logistic regression analysis. This statistical
procedure is often used to investigate the relationship between
a binary or dichotomous response (outcome variable) and a set
of predictor variables (or covariates). For a binary response
model, the response, Y, can take on one of two possible values,
denoted for convenience by 1 or 0.
(1)
where x is a vector of explanatory variables,
p = Pr(Y = 1 | x),
is the intercept parameter,
and is the vector of slope parameters.
Odds ratio (OR) estimates are computed from the parameter
estimates. The OR is defined as the ratio of the odds for those
with the response factor variable (x = 1) to the odds for those
without the response factor variable (x = 0). The OR is obtained
by exponentiation of the value of the parameter associated with
the response factor. It indicates how the odds of an event
change as, for example, a dichotomous response factor changes
from 0 to 1. For instance, an OR of 2 means that the odds of an
event when the response factor variable x = 1 are twice the odds
of an event when x = 0. The linear logistic regression models in
this study were fit by the method of maximum likelihood. In a
very general sense, the method of maximum likelihood
estimation yields values for the unknown model parameters,
which maximizes the probability of obtaining the observed set
of data.
For the roof bolter simulation data, the outcome contact
variable was coded as "contact" (Y = 1) versus "avoid + no
contact" (Y = 0). The predictor variables or covariates
considered in this analysis were restricted to only those that
remained static during a simulation execution. These included
(1) seam height, (2) boom speed, (3) anthropometry, (4) work
posture, and (5) a work posture/seam height combination. Work
posture/seam height combination was used because the higher
seam height used only one posture—standing. The logistic
regression analysis modeled the probability of a "contact" as a
function of this set of covariates [Pr(Y = 1 | x)]. The analysis
included 5,250 simulation executions, and 52% of the
simulations exhibited a contact between the boom and the
operator. All models used data generated for an operator with
slow reaction time in order to be consistent with the other
analytical techniques used in this report.
Initially, researchers produced univariate logistic regression
models (models with only one predictor variable or covariate).
A final main effects multivariate model that included all of the
covariates tested in the univariate models was generated. The
method of reference cell coding was used for all of the
covariates (SAS version 8.0). A covariate was considered to be
significantly related to the outcome when the p-value of the
Wald test was <0.05. All models had a statistically significant
main effect for the covariate(s). This analysis investigated no
interactions terms. R2 value, based on the likelihood ratio chi-
square for testing the null hypothesis that all the coefficients are
zero, was calculated for all of the models. This R2 is a
generalized coefficient of determination that measures
predictive power (it cannot be interpreted as a proportion of
variance explained by the covariates). The results of the logistic
regression analysis are presented in appendix E.
Results
Model 1
For this model, the covariate under consideration was seam
height. The reference group was seam height equal to 45 in.
For 60 in compared to 45 in, the likelihood of a contact was
almost seven times greater (OR = 6.96). For 72 in compared to
45 in, the likelihood of a contact was six times greater (OR =
6.33). The R2 was equal to 0.24, which is the largest value
shown for any of the univariate models. Thus, for these logistic
regression models, seam height is the most important predictor
of the probability of a contact.
Model 2
The predictor variable in this model was boom speed.
A boom speed of 7 in/sec was the reference level. The contact
difference between 10 in/sec and the reference group was less
likelihood of a contact. ORs of approximately 1.35 and 1.19
were found for 16 and 22 in/sec, respectively, compared to
7 in/sec. There was no significant effect found at 13 in/sec.
Model 3
Anthropometry was the covariate entered in this model.
A virtual human model that represented an operator conforming
to the 55th percentile was chosen as the reference group. At the
25th percentile, an operator would be 1.65 times more likely to
be contacted, whereas at the 92nd percentile an operator would
be less likely to be contacted (OR = 0.69).
logit x( ) logpp
p1

19
Model 4
In this model, the predictor variable was work posture, with
standing being the reference level. Being on the right knee, the
left knee, or both knees, an operator would be less likely to be
contacted (OR = 0.36, 0.35, and 0.60, respectively).
Model 5
This model represented a multivariate model. A multivariate
analysis is a more comprehensive modeling of the data. In a
multivariate logistic regression model, each estimated
coefficient provides an estimate of the log odds adjusting for all
other variables included in the model. For this model, a problem
occurred when seam height and anthropometry were included
simultaneously. A linear combination occurred because the
cells were empty for standing in 45- and 60-in seam heights and
kneeling in 72-in seam heights. To handle this situation, a new
variable was created that combined both seam height and work
posture. "Standing/72 in" was considered the reference level,
with the other categories being "right knee/45 in," "right
knee/60 in," "left knee/45 in," "left knee/60 in," "both
knees/45 in," and "both knees/60 in". For this new variable, the
only OR that showed significant contact compared to
"standing/72 in" was "both knees/60 in" (OR = 2.05). In this
model, a 25th-percentile operator would be about two times
more likely (OR = 1.93) to be contacted compared to the 55th-
percentile reference level. Boom speeds of 16 and 22 in/sec
were approximately 1.5 and 1.26 times more likely,
respectively, of involving a contact compared to 7 in/sec.
In order to incorporate the predictor variables that were
dynamic over the course of a simulation execution, it was
necessary to use a modeling approach that took into account the
element of time. Survival analysis (e.g., Cox regression) was
the next step used for the modeling of the roof bolter simulation
data.
Summary
• Compared to seam height of 45 in, the likelihood of a
contact was nearly seven times greater in a seam height of 60 in
and six times greater in a seam height of 72 in.
• The odds of a contact between a boom speed of 13 in/sec
and 7 in/sec, the reference group, were not significant.
• ORs of approximately 1.35 and 1.19 were found for boom
speeds of 16 and 22 in/sec, respectively, compared to 7 in/sec.
• A 25th-percentile operator is 1.65 times more likely to be
contacted than a 55th-percentile operator. A 92nd-percentile
operator is less likely to be contacted (OR = 0.69) than a 55th-
percentile operator.
• Comparing work postures/seam heights, the operator has
about the same likelihood of a contact when on the right knee,
left knee, or both knees.
• For the multivariate model (comparing standing posture,
7 in/sec boom speed, and 55th-percentile operator), significantly
higher ORs were found: 2.05 for "both knees/60 in," 1.5 for
16 in/sec and 1.26 for 22 in/sec, and 1.93 for the 25th-percentile
operator.
SURVIVAL ANALYSIS
The following describes the results of a survival analysis on
the simulations presented in this report. Some of the
information presented regarding the methods and results of the
survival analysis are somewhat technical. However, a summary
at the end of this section describes the major findings of the
survival analysis for those not interested in the technical aspects
of the analysis.
Method
Variables Investigated
Several variables believed to be important in influencing
whether and when a contact might occur were investigated.
These include boom speed, drilling and bolting behaviors, boom
direction (up or down), work posture/seam height combinations
(e.g., worker on right knee in 45-in seam), operator location, and
anthropometry (worker size). The dependent (or the outcome)
variable was the time to an event (i.e., boom making contact
with the worker) occurring.
Except for operator location, which was entered as a
continuous variable, all variables in the model were entered as
dummy variables using a referent (or comparison) condition
against which all other levels of the variable were judged. The
following list identifies the referent conditions for all
independent variables for which dummy coding were used.
• Boom speed: 7 in/sec
• Drilling behavior: hand not touching boom or drill steel
• Bolting behavior: hand not touching boom or bolt
• Work posture/seam height combination: standing in 72-in
seam
• Anthropometry: 25th-percentile worker
• Boom direction: boom not moving upwards
• Operator location: distance from operator's back to boom
is 23 in
Data
Researchers examined 5,250 cases involving possible contact
between the boom arm and the operator. A number of cases
involved no contact between the operator and the boom while
the boom was not moving. As a result, the survival analysis
comprised 3,517 cases. Of this total, 2,750 cases involved
unintentional contact with a moving boom arm (considered an
"event" in the survival analysis). The balance (767 cases)
consisted of censored observations or cases where unintentional
contact between the boom arm and operator occurred throughout
the simulation execution.

20
Survival Analysis
A Cox regression model (time-to-event regression analysis)
was conducted to evaluate the factors influencing the time when
contact was made to the worker. Table 11 shows the hypothe-
sized time-to-event regression model. Analysts used a forward
selection procedure in developing the model. In each step,
variables were selected for inclusion on the basis of the Akaike
Information Criterion (AIC), i.e., the model whose variable
resulted in the lowest AIC was selected at each successive step
of the model-building process. The model-building process
ceased when the lowest AIC for a step was greater than the
lowest AIC obtained in the previous step.
A primary assumption of the time-to-event regression model
was that the hazard proportions associated with the model's
variable comparisons did not differ significantly with respect to
time during the period of analysis. This assumption was
checked for all variables at the univariate stage of the model-
building process. If the assumption was not tenable, the inter-
action between the variable and the natural logarithm of time
was included in the model whenever that variable was entered
into the regression models. A final check of the proportional
hazards assumption was performed once the final model was
determined.
Probabilities that risk ratios were significantly different
from 1 were calculated using the Wald statistic for covariates
with one degree of freedom. Probabilities for variables with
multiple degrees of freedom were obtained by subtracting the
log likelihood for the reduced model from the full model and
obtaining a chi-square with the appropriate degrees of freedom.
Alpha levels were set at 0.05 for all cases. Results for each step
of the survival analysis are presented in appendix F.
Results
Results of Forward Selection Process
Variables entered earlier in the model-building process are
considered more influential for predicting the time-to-event
(contacts) than those entered later. The following list shows the
order in which variables were entered into the model:
1. Boom speed
2. Boom direction
3. Drilling behavior
4. Work posture/seam height combination
5. Bolting behavior
6. Anthropometry (operator percentile)
7. Operator location
Tables F–1 to F–7 contain results of the analyses in the
development of the main effects model. These tables reveal that
the first five variables included in the model violated the
proportional hazards assumption. This indicates that the hazard
associated with a contact occurring was not constant over the
period of the analysis, but that the hazard changed over time.
Thus, in the final model (table F–8), these variables included
interaction terms with the natural logarithm of time to properly
assess the associated risks throughout the period of the
simulation.
Risk Model
Based on the results of the forward selection Cox regression
analyses, a main effects risk model was developed (table 12).
The coefficients in this model helped to evaluate the relative risk
of experiencing a contact at different points during the
simulation executions and showed the degree of influence for
each variable in the model while controlling for the effects of all
other covariates. For example, if one wanted to know the rela-
tive risk of a contact for a worker bolting with the boom moving
up at 16 in/sec at time 25 (compared to reference conditions),
one would simply insert a "1" for each term containing a z2 and
z7, a "25" for each term with ln (time) included, and a "0" for all
other variables. The result would be that such a worker would
have a chance of experiencing a contact that was 33.25 times the
referent condition.
Table 13 shows the instantaneous relative risk of experi-
encing a contact for all model variables at different times in the
simulation process. Each estimate of risk of experiencing a
contact represents the increase (or decrease) in the chance of a
contact occurring at a particular time assuming that the specified
variable is present and that the influencing factor is judged
against the referent condition. The following sections detail the
implications of the relative risk model in terms of the
independent variables examined.
Boom Speed
Boom speed was the most influential variable in terms of
explaining the time to an event (contact) occurring. Increases in
boom speed resulted in increased chance of a contact throughout
the period of the simulation. Thus, based on the data collected
in this simulation analysis, boom speeds greater than 13 in/sec
result in a substantial increase in chance that the roof bolter
operator would be contacted, while speeds less than or equal to
13 in/sec are associated with a more modest hazard level.
Boom Direction
Relative risk of being contacted for the boom moving in an
upward direction (compared to downward or no movement)
were greatest at the beginning of the task and decreased with
time. Early in the task, upward movement of the boom resulted
in a threefold increase in the chance of a contact. At the
midpoint of the simulation (time = 25), the relative chance was
still more than twice the referent condition. This change in the
hazard reflects the fact that conditions where the boom is
moving upward occur earlier, on average, than situations where
the boom is moving downward. Thus, the risk of being
contacted associated with upward boom movement tend to be
seen earlier in the simulation rather than later. In general,

21
chances of a contact were greater for upward compared to
downward boom movement.
Drilling Behavior
Analysts found hand placements when drilling to result in
significant increases in the chance of a contact occurring early in
the simulation, with decreasing chances observed as the
simulation time increased. This chance of being contacted profile
reflects the fact that the drilling phase of roof bolting occurs early
in the task, and chance of a contact associated with this activity
would be seen early in the simulation. Having the hand on the
drill steel then the boom resulted in the greatest increase in
chances of being contacted compared with the hand being on
neither the drill steel nor the boom. Having the hand only on the
boom was associated with an only slightly less chance of a contact
than having the hand on the drill steel then boom, but a greater
chance than when having the hand on the drill steel.
Table 11.—Hypothesized time-to-event regression model
k = coefficients for variables used in the model;
z1 = boom speed 10 in/sec;
z2 = boom speed 13 in/sec;
z3 = boom speed 16 in/sec;
z4 = boom speed 22 in/sec;
z5 = boom moving upwards;
z6 = drilling behavior: hand on drill steel;
z7 = drilling behavior: hand on boom;
z8 = drilling behavior: hand on drill steel then on boom;
z9 = posture/seam: right knee/45 in;
z10 = posture/seam: right knee/60 in;
z11 = posture/seam: left knee/45 in;
z12 = posture/seam: left knee/60 in;
z13 = posture/seam: both knees/45 in;
z14 = posture/seam: both knees/60 in;
z15 = bolting behavior: hand on bolt;
z16 = bolting behavior: hand on boom;
z17 = bolting behavior: hand on bolt then on boom;
z18 = 55th-percentile worker;
z19 = 95th-percentile worker; and
z20 = operator location (in).
Table 12.—Main effects risk model
z1 = boom speed 10 in/sec;
z2 = boom speed 13 in/sec;
z3 = boom speed 16 in/sec;
z4 = boom speed 22 in/sec;
z5 = boom moving upwards;
z6 = drilling behavior: hand on drill steel;
z7 = drilling behavior: hand on boom;
z8 = drilling behavior: hand on drill steel then on boom;
z9 = posture/seam: right knee/45 in;
z10 = posture/seam: right knee/60 in;
z11 = posture/seam: left knee/45 in;
z12 = posture/seam: left knee/60 in;
z13 = posture/seam: both knees/45 in;
z14 = posture/seam: both knees/60 in;
z15 = bolting behavior: hand on bolt;
z16 = bolting behavior: hand on boom;
z17 = bolting behavior: hand on bolt then on boom;
z18 = 55th-percentile worker;
z19 = 95th-percentile worker; and
z20 = operator location (in).
202019191818171716161515141413131212
111110109988776655443322110 exp||
zzzzzzzzz
zzzzzzzzzzzzthzth
)170.0243.0
047.0)ln(268.0241.0)ln(230.0250.0)ln(341.0
675.0)ln(137.1539.2)ln(743.3014.9)ln(274.2
002.6)ln(959.3470.9)ln(291.2049.6)ln(927.3
236.9)ln(465.1282.5)ln(428.1978.4)ln(142.1
906.3)ln(668.0995.2)ln(649.2234.4)ln(299.2
890.3)ln(971.1698.3)ln(173.1300.2exp()|()|(
2019
1817171616
151414131312
12111110109
988776
655443
322110
zz
ztimezztimezztime
ztimezztimezztimez
ztimezztimezztimez
ztimezztimezztimez
ztimezztimezztimez
ztimezztimezzzthzth
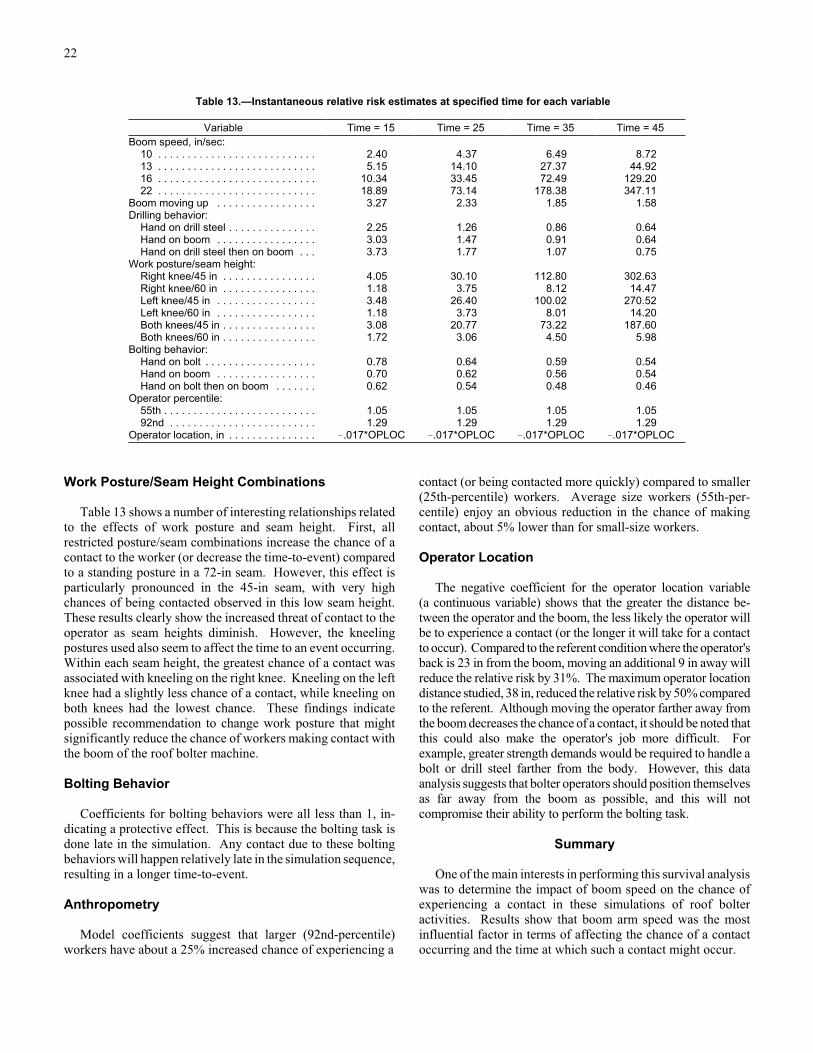
22
Table 13.—Instantaneous relative risk estimates at specified time for each variable
Variable Time = 15 Time = 25 Time = 35 Time = 45
Boom speed, in/sec: 10 . . . . . . . . . . . . . . . . . . . . . . . . . . . 2.40 4.37 6.49 8.72 13 . . . . . . . . . . . . . . . . . . . . . . . . . . . 5.15 14.10 27.37 44.92 16 . . . . . . . . . . . . . . . . . . . . . . . . . . . 10.34 33.45 72.49 129.20 22 . . . . . . . . . . . . . . . . . . . . . . . . . . . 18.89 73.14 178.38 347.11Boom moving up . . . . . . . . . . . . . . . . . 3.27 2.33 1.85 1.58Drilling behavior: Hand on drill steel . . . . . . . . . . . . . . . 2.25 1.26 0.86 0.64 Hand on boom . . . . . . . . . . . . . . . . . 3.03 1.47 0.91 0.64 Hand on drill steel then on boom . . . 3.73 1.77 1.07 0.75Work posture/seam height: Right knee/45 in . . . . . . . . . . . . . . . . 4.05 30.10 112.80 302.63 Right knee/60 in . . . . . . . . . . . . . . . . 1.18 3.75 8.12 14.47 Left knee/45 in . . . . . . . . . . . . . . . . . 3.48 26.40 100.02 270.52 Left knee/60 in . . . . . . . . . . . . . . . . . 1.18 3.73 8.01 14.20 Both knees/45 in . . . . . . . . . . . . . . . . 3.08 20.77 73.22 187.60 Both knees/60 in . . . . . . . . . . . . . . . . 1.72 3.06 4.50 5.98Bolting behavior: Hand on bolt . . . . . . . . . . . . . . . . . . . 0.78 0.64 0.59 0.54 Hand on boom . . . . . . . . . . . . . . . . . 0.70 0.62 0.56 0.54 Hand on bolt then on boom . . . . . . . 0.62 0.54 0.48 0.46Operator percentile: 55th . . . . . . . . . . . . . . . . . . . . . . . . . . 1.05 1.05 1.05 1.05 92nd . . . . . . . . . . . . . . . . . . . . . . . . . 1.29 1.29 1.29 1.29Operator location, in . . . . . . . . . . . . . . . .017*OPLOC .017*OPLOC .017*OPLOC .017*OPLOC
Work Posture/Seam Height Combinations
Table 13 shows a number of interesting relationships relatedto the effects of work posture and seam height. First, allrestricted posture/seam combinations increase the chance of acontact to the worker (or decrease the time-to-event) comparedto a standing posture in a 72-in seam. However, this effect isparticularly pronounced in the 45-in seam, with very highchances of being contacted observed in this low seam height.These results clearly show the increased threat of contact to theoperator as seam heights diminish. However, the kneelingpostures used also seem to affect the time to an event occurring.Within each seam height, the greatest chance of a contact wasassociated with kneeling on the right knee. Kneeling on the leftknee had a slightly less chance of a contact, while kneeling onboth knees had the lowest chance. These findings indicatepossible recommendation to change work posture that mightsignificantly reduce the chance of workers making contact withthe boom of the roof bolter machine.
Bolting Behavior
Coefficients for bolting behaviors were all less than 1, in-dicating a protective effect. This is because the bolting task isdone late in the simulation. Any contact due to these boltingbehaviors will happen relatively late in the simulation sequence,resulting in a longer time-to-event.
Anthropometry
Model coefficients suggest that larger (92nd-percentile)workers have about a 25% increased chance of experiencing a
contact (or being contacted more quickly) compared to smaller(25th-percentile) workers. Average size workers (55th-per-centile) enjoy an obvious reduction in the chance of makingcontact, about 5% lower than for small-size workers.
Operator Location
The negative coefficient for the operator location variable(a continuous variable) shows that the greater the distance be-tween the operator and the boom, the less likely the operator willbe to experience a contact (or the longer it will take for a contactto occur). Compared to the referent condition where the operator'sback is 23 in from the boom, moving an additional 9 in away willreduce the relative risk by 31%. The maximum operator locationdistance studied, 38 in, reduced the relative risk by 50% comparedto the referent. Although moving the operator farther away fromthe boom decreases the chance of a contact, it should be noted thatthis could also make the operator's job more difficult. Forexample, greater strength demands would be required to handle abolt or drill steel farther from the body. However, this dataanalysis suggests that bolter operators should position themselvesas far away from the boom as possible, and this will notcompromise their ability to perform the bolting task.
Summary
One of the main interests in performing this survival analysiswas to determine the impact of boom speed on the chance ofexperiencing a contact in these simulations of roof bolteractivities. Results show that boom arm speed was the mostinfluential factor in terms of affecting the chance of a contactoccurring and the time at which such a contact might occur.

23
Moreover, results of this analysis show that there is a significantincrease in the risk of being contacted at the two highest boomspeeds, 16 and 22 in/sec, compared to the lower speeds(13 in/sec or less). The former were associated with a marked,and perhaps unacceptable, increase in the risk of beingcontacted, whereas the risk for the latter was much moremodest. From the current analysis, one can conclude that boomspeeds above 13 in/sec entail significant chance of beingcontacted. Speeds that are 13 in/sec or below result in a muchlower exposure to being contacted, which represents a decreasein potential hazard.
Covariates such as operator work behaviors (placing the handon the boom, drill steel, or bolt), work posture and seam heightcombinations, boom direction, operator location, and workeranthropometry were also significant factors in the time-to-eventregression analysis. Workers were more likely to experience acontact when the boom was moving in an upward direction,especially early in the roof bolting task. Kneeling work posturesgenerally resulted in increased risk of being contacted comparedto standing in a 72-in seam. Kneeling on the right knee
within each seam height entailed the greatest chance of acontact. Positioning of the workers farther from the boomresulted in a lower risk of being contacted; however, this couldalso impact the workers' ability to perform the roof bolting task.Larger workers were 25% more likely to make contact with theboom, whereas smaller workers were about 5% less likely tomake contact. Drilling behaviors such as placing the hand onthe boom or drill steel resulted in a greater chance of a contact,while bolting behaviors (occurring later in the bolting cycle)increased the time when the event occurred.
It should be noted that this survival analysis was developedusing a main effects model only. It is possible that the factorsexamined in this report have interactive effects (for instance,boom speed could have more of an impact on the chance ofbeing contacted when certain work postures are adopted). Thelarge number of simulations, computational demands of runningCox regression models and of checking proportional hazardassumptions, and the large number of interactions (120) madeanalysis of these interactions impractical given the timeconstraints involved.
CONCLUSIONS
NIOSH researchers successfully developed a computermodel that generates contact data by means of simulation whileexercising the model with several variables associated with themachine and its operator, such as coal seam height, theoperator's anthropometry, work posture and choice of riskybehavior, and the machine's appendage velocity. The resultingsimulation database contains 5,250 observations. The databaserepresented the equivalence of actual field observations of roofbolting and corresponds to a work period of 12.15 eight-hourshifts.
Analysts used data only on the occurrences for the operatorwith slow reactions that included one incident per simulationexecution (one run/one contact). Researchers on this projectbelieve the use of such simulations, treated with statisticalprocedures such as frequency, cross-tabulation, logistic re-gression, and survival analysis, provide extremely useful toolsto evaluate the hazards of tasks where it is not possible toperform experiments with human subjects. Results of this anal-ysis could help in making recommendations that reduce thelikelihood that roof bolter operators experience injuries due tocontact with a moving boom.
Analysis shows that the reaction time of the operator did notsignificantly affect the outcome of the simulation. The numberof contact incidents for an operator with slow reactions differedfrom those for an operator with fast reactions by less than 1% inboth data sets. There was a reasonable difference in reactiontimes between fast and slow operators obtained from reactiontime tests on our human subjects. As to the reason for the smalldifference in contacts, researchers speculate that in the boomspeed range studied, if the operator with fast reactions could notget out of the path of the boom, the slower operator certainlywould not either.
Results from frequency distribution analyses showed:
• The seam height of 60 in had the most contacts (59% of thetotal number of contacts), and the seam height of 45 in had 75%of the avoid incidents.
• The 25th-percentile individual had 7% more contacts thanthe 55th-percentile and 13% more than the 92nd-percentile.
• The one-knee work posture had 49% of the total number ofcontact incidents, the posture on both knees had 32%, and thestanding posture had 19%.
• The faster boom speeds of 16 and 22 in/sec combinedaccounted for the greatest number of contacts (43% of the total).
• The hand-on-boom behavior for both drilling and boltingtasks accounted for most of the contacts.
• The boom-up direction had the most contacts (76% of thetotal number of contacts). The boom-down direction had 63%of the avoid incidents.
• The hand was the closest body part to the moving boomarm and was involved in 67% of all contacts. The leg was thesecond most contacted body part (15% of all contacts).
• The boom was the closest moving machine part to theoperator, accounting for 80% of all contacts.
• Regardless of other variables, contact incidents were alwaysgreater when the boom was moving up, always greater on thehand, and always greater for the boom arm part of the machine.The reason why the subject experiences more contacts when theboom arm is moving up rather than down is that riskier behaviorsoccur during drilling and bolting, when the boom is ascending.
Results regarding boom speed from cross-tabulation analysesshowed:

24
• Regardless of boom speed, the boom-up direction hadmore contacts than boom-down.
• The boom-up direction had most of its contacts at the twohigher boom speeds: 22% at speed 16 in/sec and 21% at speed22 in/sec.
• Regardless of boom speed, the operator's hand had morecontacts than the other body parts.
• The hand had most of its contacts during speed 16 in/sec(24%) and 13 in/sec (21%).
• The boom arm had more contacts than the drill head andhad most contacts during speeds 16 and 22 in/sec.
• The both-knee work posture had more contacts than theother postures and had most contacts (23%) during speed16 in/sec.
• 25th-percentile operators had more contacts than otheroperator sizes and had most of their contacts (22%) during speed13 in/sec.
• Regardless of boom speed, the hand-on-boom behaviorduring drilling and bolting tasks had more contacts than otherwork behaviors.
• Drilling tasks had most of their contacts (24%) duringspeed 13 in/sec. Bolting had most contacts (22%) during thesame speed.
• The 60-in seam had more contacts than the other seamheights and had most of the contacts (22%) during speed16 in/sec.
Logistic regression analyses showed:
• Compared to a seam height of 45 in, contacts occurrednearly seven times more often in a 60-in seam height and sixtimes more often in a 72-in seam height.
• The odds of a contact between a boom speed of 13 and7 in/sec, the reference group, were not significant.
• ORs of approximately 1.35 and 1.19 were found for 16 and
22 in/sec, respectively, compared to 7 in/sec.
• A 25th-percentile operator had a likelihood of making
more contacts (1.65) than a 55th-percentile operator.
• A 92nd-percentile operator had a likelihood of making
fewer contacts (0.69) than a 55th-percentile operator.
• Comparing work postures/seam heights, about the same
likelihood of a contact occurred when the operator was on the
right knee, left knee, or both knees.
• For the multivariate model (comparing standing posture,
7-in/sec boom speed, and 55th-percentile operator), significantly
higher ORs were found: 2.05 for both knees/60 in, 1.5 for
16 in/sec and 1.26 for 22 in/sec, and 1.93 for the 25th-percentile
operator.
Results of a survival analytic approach showed:
• Controlling the boom speed is the most important factor in
determining the chance of an operator making contact.
• Boom speed was the most influential variable for
explaining the time to an event (contact) occurring.
• Increases in boom speed resulted in increased chance of a
contact throughout the period of the simulation.
• The chance of being contacted at the higher boom speeds
(16 and 22 in/sec) was generally two to four times greater than
at 13 in/sec and four to eight times greater than at 10 in/sec.
• A boom arm speed greater than 16 in/sec resulted in a
substantial increase in the chance of the boom making contact
with the roof bolter operator.
• Boom speeds less than or equal to 13 in/sec resulted in a
smaller chance of being contacted, which represents a decrease
in potential hazard.
OTHER RESEARCH CONSIDERATIONS
The process of performing 5,250 simulations and subsequent
analyses required a considerable effort. Automating the simu-
lation software and integrating data management with data
analysis can enhance the virtual-reality simulation method.
Software automation can decrease the time required to produce
simulations and permit more time for data analysis. The inte-
gration of data management and data analysis can increase
efficiency and permit an extensive examination of available
information. For instance, a central database could streamline
software automation by providing a queue of requested simu-
lations, real-time monitoring of active simulations, and archived
data from completed simulations. Simple data analysis inter-
faces could query data directly from the database and allow
researchers to update calculations as data become available. In
addition, enhanced data analysis interfaces would trigger
calculations within the database or initiate iterative compu-
tations on a remote system; this would increase the efficiency of
repetitious analyses and permit an unparalleled degree of
exploratory data analysis. Individual researchers could use
interfaces tailored to their specific roles. Virtual-reality
simulations provide a wealth of information that is unavailable
through conventional investigations. These automation, data
management, and data analysis enhancements could efficiently
represent this information and allow investigators to draw
insightful conclusions regarding health and safety issues.
Analysts answered this study's question concerning boom
speed by using the most appropriate statistical techniques
available. Other factors such as drilling behavior, bolting
behavior, boom direction, work posture/seam height com-
bination, operator location, and anthropometry showed signif-
icant influence on the chance of an operator making contact.
Using analytical techniques, an examination of the database
would uncover significant interactions between these factors
should they exist.
Researchers recommended a study to increase the safety for
bolting machine operators during lateral boom swing operations.

25
This research has been approved and is currently underway.
Boom swing usually occurs when the operator is repositioning
the boom arm to a new bolt insertion location. It requires that
the operator properly actuate the right control(s) and then
reposition his/her body in coordination with the moving boom
arm. In low seam heights, operators may perform boom swings
from kneeling positions, which hinders their ability to avoid
contact with the boom arm. Observation of boom swing shows
that even experienced operators have a tendency to actuate the
boom swing control in the direction opposite from what is
intended. The fundamental issue is which boom swing speed(s)
maximize the operators' chances of escaping injuries while still
allowing the operators to perform bolting functions effectively.
Like the vertical boom arm study, this work will use primarily
motion capture and computer simulation/modeling technologies
to evaluate human motions while operating a bolting machine in
various postures. Expected outcomes include lateral boom
swing velocities, possible control, and procedural modifications
to minimize inadvertent control actuation.
ACKNOWLEDGMENTS
The authors gratefully acknowledge the following colleagues
at the NIOSH Pittsburgh Research Laboratory: Joseph P.
DuCarme, Mary Ellen Nelson, Albert H. Cook, George F.
Fischer, Albert L. Brautigam provided technical expertise in the
design and fabrication of the roof bolter mockup and platform,
and the associated electrical and hydraulic control systems.
E. William Rossi provided technical support in operating the
motion tracking and data collection system. Mary Ellen Nelson,
Albert H. Cook, and Mary Ann Rossi assisted in the lab human
subject tests.
REFERENCES
Ambrose DH [2000]. A simulation approach analyzing random motion
events between a machine and its operator. Warrendale, PA: Society of
Automotive Engineers, Inc., technical paper 2000–01–2160, pp. 1–11.
Ambrose DH [2001]. Random motion capture model for studying events
between a machine and its operator. In: Proceedings of the Advanced
Simulation Technologies Conference (Seattle, WA, April 22–26, 2001). San
Diego, CA: Society for Computer Simulation International, pp. 127–134.
Ambrose DH [2004]. Developing random virtual human motions and risky
work behaviors for studying anthropotechnical systems. Pittsburgh, PA: U.S.
Department of Health and Human Services, Public Health Service, Centers for
Disease Control and Prevention, National Institute for Occupational Safety and
Health, DHHS (NIOSH) Publication No. 2004–130, IC 9468.
Bartels JR, Ambrose DH, Wang RC [2001]. Verification and validation of
roof bolter simulation models for studying events between a machine and its
operator. Warrendale, PA: Society of Automotive Engineers, Inc., technical
paper 2001–01–2088, pp. 1–14.
Bartels JR, Kwitowski AJ, Ambrose DH [2003]. Verification of a roof
bolter simulation model. Warrendale, PA: Society of Automotive Engineers,
Inc., technical paper 2003–01–2217, pp. 1–7.
Etherton J [1987]. System considerations on robot end effector speed as a
risk factor during robot maintenance. In: Proceedings of the Eighth
International System Safety Conference (New Orleans, LA). Unionville, VA:
System Safety Society, pp. 434–437.
Helander MG, Karwan MH, Etherton J [1987]. A model of human reaction
time to dangerous robot arm movements. In: Proceedings of the 31st Annual
Meeting of the Human Factors Society. Santa Monica, CA: Human Factors
Society, pp. 191–195.
Humantech, Inc. [2003]. Ergonomic design guidelines for engineers. Ann
Arbor, MI: Humantech, Inc.
Karwowski W, Parsaei HR, Soundararajan A, Pongpatanasuegsa N [1992].
Estimation of safe distance from the robot arm as a guide for limiting slow speed
of robot motions. In: Proceedings of the 36th Annual Meeting of the Human
Factors and Ergonomics Society. Santa Monica, CA: Human Factors and
Ergonomics Society, pp. 992–996.
Klishis MJ, Althous RC, Layne LA, Lies GM [1993a]. Coal mine injury
analysis: a model for reduction through training. Morgantown, WV: West
Virginia University, Mining Extension Service.
Klishis MJ, Althous RC, Stobbe TJ, Plummer RW, Grayson RL, Layne LA,
et al. [1993b]. Coal mine injury analysis: a model for reduction through
training. Vol. 8: Accident risk during the roof bolting cycle: analysis of
problems and potential solutions, Morgantown, WV: West Virginia University.
Mining Extension Service.
Kobrick JL [1965]. Effects of physical location of visual stimuli on
intentional response time. J Eng Psychol 4(1):1–8.
MSHA [1994]. Coal mine safety and health roof bolting machine
committee: report of findings, July 8, 1994. Arlington, VA: U.S. Department
of Labor, Mine Safety and Health Administration, Coal Mine Safety and Health,
Safety Division, pp. 1–28.
OSHA [1987]. Guidelines for robotic safety. OSHA directive
STD 01–12–002 (instruction pub 8–1.3). Washington, DC: U.S. Department of
Labor, Occupational Safety and Health Administration, Office of Science and
Technology Assessment, September 21.
Turin FC, et al. [1995]. Human factors analysis of roof bolting hazards in
underground coal mines. Pittsburgh, PA: U.S. Department of the Interior,
Bureau of Mines, RI 9568. NTIS No. PB 95–274411.
U.S. Department of Energy [1998]. Department of Energy (DOE) OSH
technical reference. Chapter 1 – industrial robots; part 4 – work practices; 4.1 –
safeguarding methods. [http://www.eh.doe.gov/docs/osh_tr/ch14.html]. Date
accessed: January 2005.
Volberg O, Ambrose DH [2002]. Motion editing and reuse techniques and
their role in studying events between a machine and its operator. In: Proceedings
of the Society of Computer Simulation International Advanced Simulation
Technologies Conference (San Diego, CA, April 14–18). Vol. 34, No. 4. San
Diego, CA: Society of Computer Simulation International, pp. 181–186.
Welford AT, Brebner JMT [1980]. Reaction times. New York: Academic
Press, pp. 117–123.

26
APPENDIX A.–FREQUENCY OF INCIDENTS
Table A–1.—Incidents by seam height
Seam
height, inAvoid Contact None Total
45 . . . . . . . . . . . . . . . . . 564 606 1,080 2,25060 . . . . . . . . . . . . . . . . . 185 1,619 446 2,25072 . . . . . . . . . . . . . . . . . 6 525 219 750 Total . . . . . . . . . . . . . 755 2,750 1,745 5,250
Table A–2.—Incidents by operator percentile
Operator
percentileAvoid Contact None Total
25th . . . . . . . . . . . . . . 211 1,113 426 1,75055th . . . . . . . . . . . . . . 259 900 592 1,75192nd . . . . . . . . . . . . . 285 737 727 1,749 Total . . . . . . . . . . . 755 2,750 1,745 5,250
0
500
1000
1500
2000
45-in 60-in 72-in
Seam Height
Incid
en
tsAvoid
Contact
None
Figure A–1.—Incidents by seam height.
0
200
400
600
800
1000
1200
25th 55th 92nd
Operator Percentile
Incid
en
ts
Avoid
Contact
None
Figure A–2.–Incidents by operator percentile.
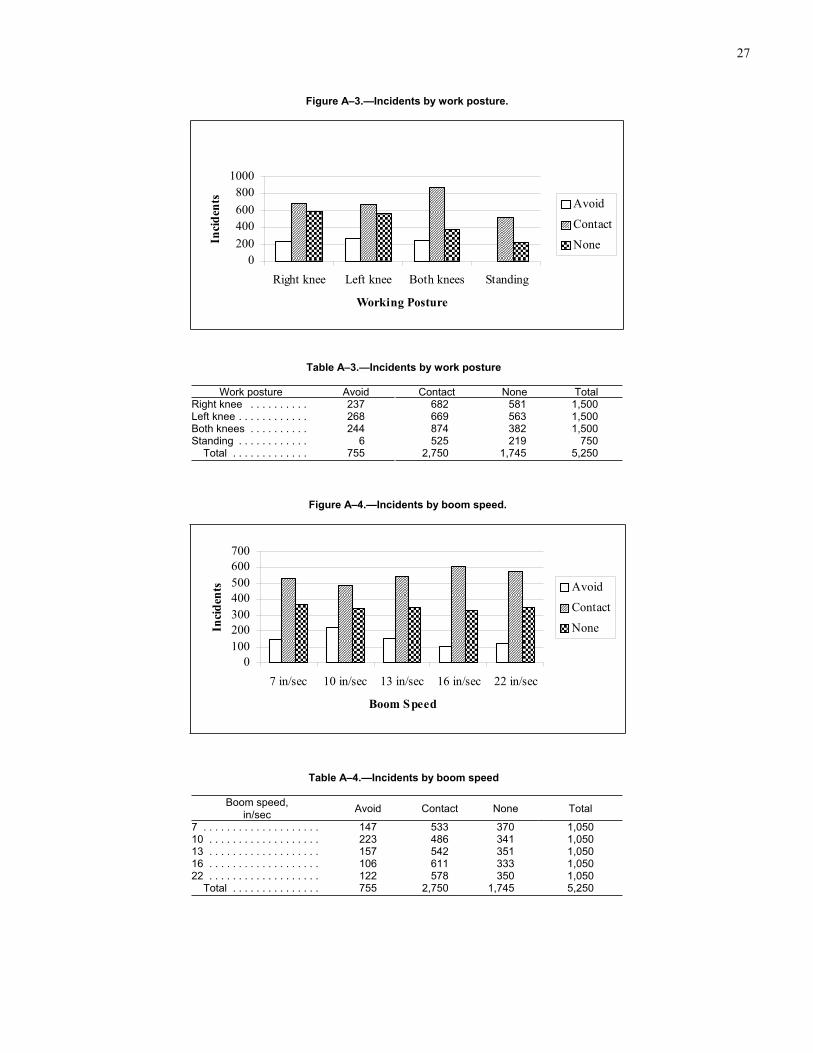
27
Table A–3.—Incidents by work posture
Work posture Avoid Contact None TotalRight knee . . . . . . . . . . 237 682 581 1,500Left knee . . . . . . . . . . . . 268 669 563 1,500Both knees . . . . . . . . . . 244 874 382 1,500Standing . . . . . . . . . . . . 6 525 219 750 Total . . . . . . . . . . . . . 755 2,750 1,745 5,250
Table A–4.—Incidents by boom speed
Boom speed,
in/secAvoid Contact None Total
7 . . . . . . . . . . . . . . . . . . . . 147 533 370 1,05010 . . . . . . . . . . . . . . . . . . . 223 486 341 1,05013 . . . . . . . . . . . . . . . . . . . 157 542 351 1,05016 . . . . . . . . . . . . . . . . . . . 106 611 333 1,05022 . . . . . . . . . . . . . . . . . . . 122 578 350 1,050 Total . . . . . . . . . . . . . . . 755 2,750 1,745 5,250
0
200
400
600
800
1000
Right knee Left knee Both knees Standing
Working Posture
Inci
den
ts Avoid
Contact
None
Figure A–3.—Incidents by work posture.
0
100
200
300
400
500
600
700
7 in/sec 10 in/sec 13 in/sec 16 in/sec 22 in/sec
Boom Speed
Inci
den
ts Avoid
Contact
None
Figure A–4.—Incidents by boom speed.

28
Table A–5.—Incidents by drilling behavior
Drilling behavior Avoid Contact None TotalNone . . . . . . . . . . . . . . . . . . . . . . . . . . . . . . . . . . . 68 673 1,030 1,771Hand on drill steel . . . . . . . . . . . . . . . . . . . . . . . . . 42 168 142 352Hand on boom . . . . . . . . . . . . . . . . . . . . . . . . . . . 555 1,541 458 2,554Hand on drill steel then on boom . . . . . . . . . . . . . 90 368 115 573 Total . . . . . . . . . . . . . . . . . . . . . . . . . . . . . . . . . 755 2,750 1,745 5,250
Table A–6.—Incidents by bolting behavior
Bolting behavior Avoid Contact None Total
None . . . . . . . . . . . . . . . . . . . . . . . . . . . . . . 287 748 756 1,791Hand on bolt . . . . . . . . . . . . . . . . . . . . . . . . 146 402 289 837Hand on boom . . . . . . . . . . . . . . . . . . . . . . 220 1,042 468 1,730Hand on bolt then on boom . . . . . . . . . . . . 102 558 232 892 Total . . . . . . . . . . . . . . . . . . . . . . . . . . . . 755 2,750 1,745 5,250
0
500
1000
1500
2000
None Hand on drill
steel
Hand on boom Hand on drill
steel then on
boom
Drilling Behavior
Inci
den
ts Avoid
Contact
None
Figure A–5.—Incidents by drilling behavior.
0
500
1000
1500
None Hand on bolt Hand on boom Hand on bolt
then on boom
Bolting Behavior
Inci
den
ts
Avoid
Contact
None
Figure A–6.—Incidents by bolting behavior.

29
Table A–7.—Incidents by boom direction
Boom direction Avoid Contact TotalDown . . . . . . . . . . . . . . . . . . . . 472 671 1,143Up . . . . . . . . . . . . . . . . . . . . . . . 283 2,079 2,362 Total . . . . . . . . . . . . . . . . . . . 755 2,750 3,505
Table A–8.—Incidents by body part
Body part Avoid Contact TotalLeg . . . . . . . . . . . . . . . . . . . . . . . . 51 419 470Arm . . . . . . . . . . . . . . . . . . . . . . . . 38 201 239Hand . . . . . . . . . . . . . . . . . . . . . . . 638 1,835 2,473Head . . . . . . . . . . . . . . . . . . . . . . . 28 295 323 Total . . . . . . . . . . . . . . . . . . . . . 755 2,750 3,505
0
500
1000
1500
2000
2500
Down Up
Boom Direction
Inci
den
ts
Avoid
Contact
Figure A–7.—Incidents by boom direction.
0
500
1000
1500
2000
Leg Arm Hand Head
Body Part
Inci
den
ts
Avoid
Contact
Figure A–8.—Incidents by body part.
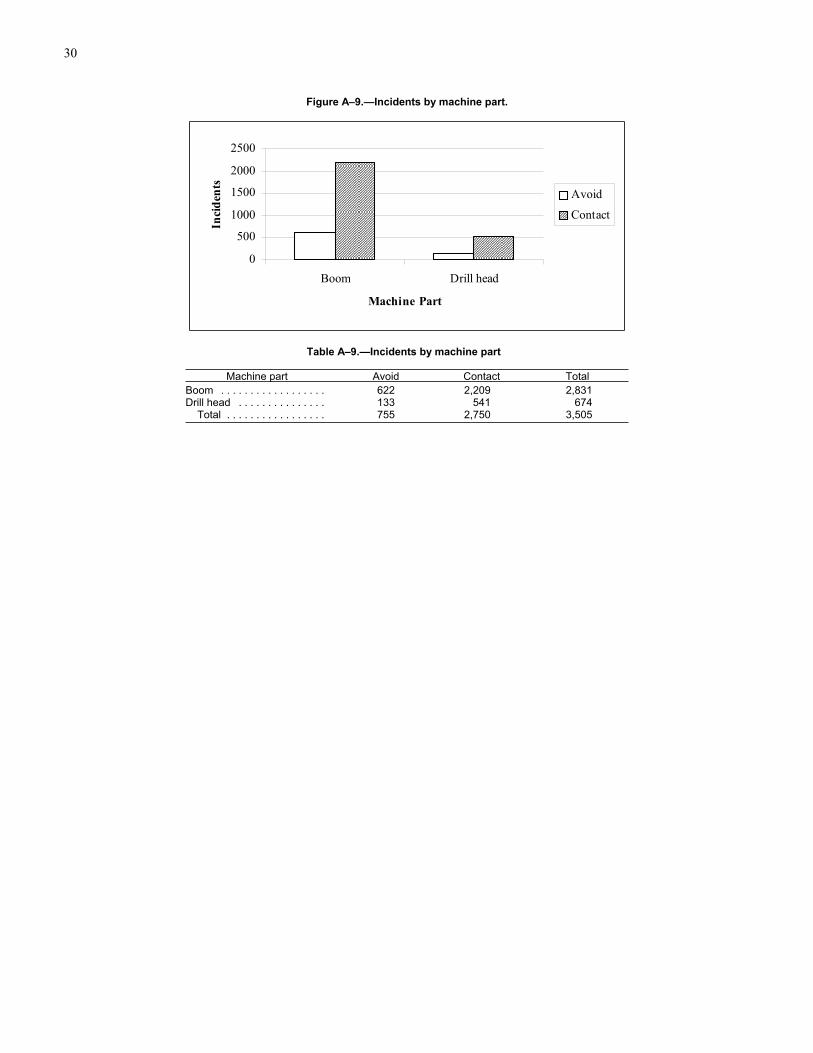
30
Table A–9.—Incidents by machine part
Machine part Avoid Contact Total
Boom . . . . . . . . . . . . . . . . . . 622 2,209 2,831Drill head . . . . . . . . . . . . . . . 133 541 674 Total . . . . . . . . . . . . . . . . . 755 2,750 3,505
0
500
1000
1500
2000
2500
Boom Drill head
Machine Part
Inci
den
ts
Avoid
Contact
Figure A–9.—Incidents by machine part.

31
APPENDIX B.–FREQUENCY BY OPERATOR LOCATION
Table B–1.—Incidents by operator location
Operatorlocation
(in)Avoid Contact None
Totalincidents
Operatorlocation
(in)Avoid Contact None
Totalincidents
20.1 . . . . . 0 12 0 12 29.5 . . . . . . . . 47 85 88 22020.5 . . . . . 0 60 1 61 29.9 . . . . . . . . 48 122 90 26020.9 . . . . . 2 102 6 110 30.3 . . . . . . . . 48 123 137 30821.3 . . . . . 2 134 15 151 30.7 . . . . . . . . 54 102 121 27721.7 . . . . . 8 141 16 165 31.1 . . . . . . . . 54 82 108 24422.0 . . . . . 4 135 27 166 31.5 . . . . . . . . 42 72 104 21822.4 . . . . . 6 124 22 152 31.9 . . . . . . . . 29 43 87 15922.8 . . . . . 13 117 22 152 32.3 . . . . . . . . 19 20 53 9223.2 . . . . . 4 76 12 92 32.7 . . . . . . . . 9 11 31 5123.6 . . . . . 4 104 12 120 33.1 . . . . . . . . 5 19 12 3624.0 . . . . . 13 87 11 111 33.5 . . . . . . . . 0 14 8 2224.4 . . . . . 17 88 23 128 33.9 . . . . . . . . 0 21 10 3124.8 . . . . . 22 87 41 150 34.3 . . . . . . . . 0 12 12 2425.2 . . . . . 26 87 62 175 34.6 . . . . . . . . 0 4 8 1225.6 . . . . . 43 92 45 180 35.0 . . . . . . . . 0 10 16 2626.0 . . . . . 43 97 64 204 35.4 . . . . . . . . 0 7 11 1826.4 . . . . . 34 83 53 170 35.8 . . . . . . . . 0 9 12 2126.8 . . . . . 24 58 53 135 36.2 . . . . . . . . 0 4 11 1527.2 . . . . . 21 56 46 123 36.6 . . . . . . . . 0 3 9 1227.6 . . . . . 17 61 45 123 37.0 . . . . . . . . 0 3 5 828.0 . . . . . 19 43 46 108 37.4 . . . . . . . . 0 0 5 528.3 . . . . . 17 34 44 95 37.8 . . . . . . . . 0 1 1 228.7 . . . . . 27 37 53 117 TOTAL . . . . 755 2,750 1,745 5,25029.1 . . . . . 34 68 87 189
0
20
40
60
80
100
120
140
160
20.1 22.0 24.0 26.0 28.0 29.9 31.9 33.9 35.8 37.8
O perator Location (in)
Incid
en
ts
avoid contact none
Figure B–1.—Incidents by operator location.

32
Table B–2.—Contact incidents by operator location and body part
Operatorlocation
(in)
Body part Totalcontact
incidents
Operatorlocation
(in)
Body part Totalcontact
incidentsLeg Arm Hand Head Leg Arm Hand Head
20.1 . . . . 0 0 3 9 12 29.5 . . . . . . . . 0 10 75 0 8520.5 . . . . 0 7 20 33 60 29.9 . . . . . . . . 0 19 103 0 12220.9 . . . . 2 8 37 55 102 30.3 . . . . . . . . 13 7 103 0 12321.3 . . . . 7 6 55 66 134 30.7 . . . . . . . . 21 8 73 0 10221.7 . . . . 14 17 53 57 141 31.1 . . . . . . . . 16 4 62 0 8222.0 . . . . 20 15 65 35 135 31.5 . . . . . . . . 3 3 66 0 7222.4 . . . . 29 21 54 20 124 31.9 . . . . . . . . 3 5 35 0 4322.8 . . . . 41 11 56 9 117 32.3 . . . . . . . . 3 2 15 0 2023.2 . . . . 35 4 36 1 76 32.7 . . . . . . . . 5 0 6 0 1123.6 . . . . 52 4 48 0 104 33.1 . . . . . . . . 6 0 13 0 1924.0 . . . . 34 4 49 0 87 33.5 . . . . . . . . 5 0 9 0 1424.4 . . . . 23 4 60 1 88 33.9 . . . . . . . . 4 1 16 0 2124.8 . . . . 18 9 59 1 87 34.3 . . . . . . . . 1 0 11 0 1225.2 . . . . 16 5 62 4 87 34.6 . . . . . . . . 0 0 4 0 425.6 . . . . 13 2 77 0 92 35.0 . . . . . . . . 0 1 9 0 1026.0 . . . . 13 0 80 4 97 35.4 . . . . . . . . 0 0 7 0 726.4 . . . . 4 8 71 0 83 35.8 . . . . . . . . 0 1 8 0 926.8 . . . . 6 2 50 0 58 36.2 . . . . . . . . 0 1 3 0 427.2 . . . . 6 1 49 0 56 36.6 . . . . . . . . 0 1 2 0 327.6 . . . . 6 0 55 0 61 37.0 . . . . . . . . 0 0 3 0 328.0 . . . . 0 1 42 0 43 37.4 . . . . . . . . 0 0 0 0 028.3 . . . . 0 1 33 0 34 37.8 . . . . . . . . 0 0 1 0 128.7 . . . . 0 0 37 0 37 TOTAL . . . . 419 201 1,835 295 2,75029.1 . . . . 0 8 60 0 68
0
20
40
60
80
100
120
20.1 22.0 24.0 26.0 28.0 29.9 31.9 33.9 35.8 37.8
Operator Location (in)
Con
tact
In
cid
ents
leg arm hand head
Figure B–2.—Contact incidents by operator location and body part.

33
Table B–3.—Contact incidents by operator location and work posture
Operatorlocation
(in)
Work posture Totalcontact
incidents
Operatorlocation
(in)
Work posture Totalcontact
incidentsRightknee
Leftknee
Bothknees
StandingRightknee
Leftknee
Bothknees
Standing
20.1 . . . . . . . 0 3 9 0 12 29.5 . . . . . . . . 19 5 17 44 8520.5 . . . . . . . 0 11 49 0 60 29.9 . . . . . . . . 14 6 25 77 12220.9 . . . . . . . 0 12 90 0 102 30.3 . . . . . . . . 21 13 26 63 12321.3 . . . . . . . 0 26 108 0 134 30.7 . . . . . . . . 7 4 25 66 10221.7 . . . . . . . 0 27 114 0 141 31.1 . . . . . . . . 8 9 13 52 8222.0 . . . . . . . 5 27 103 0 135 31.5 . . . . . . . . 8 5 11 48 7222.4 . . . . . . . 10 44 70 0 124 31.9 . . . . . . . . 6 4 3 30 4322.8 . . . . . . . 22 47 48 0 117 32.3 . . . . . . . . 2 4 2 12 2023.2 . . . . . . . 21 37 18 0 76 32.7 . . . . . . . . 0 0 0 11 1123.6 . . . . . . . 38 58 8 0 104 33.1 . . . . . . . . 0 1 0 18 1924.0 . . . . . . . 28 59 0 0 87 33.5 . . . . . . . . 0 0 0 14 1424.4 . . . . . . . 31 56 1 0 88 33.9 . . . . . . . . 0 0 0 21 2124.8 . . . . . . . 42 38 7 0 87 34.3 . . . . . . . . 0 0 0 12 1225.2 . . . . . . . 38 36 13 0 87 34.6 . . . . . . . . 0 0 0 4 425.6 . . . . . . . 49 29 14 0 92 35.0 . . . . . . . . 0 0 0 10 1026.0 . . . . . . . 51 21 25 0 97 35.4 . . . . . . . . 0 0 0 7 726.4 . . . . . . . 36 27 20 0 83 35.8 . . . . . . . . 0 0 0 9 926.8 . . . . . . . 32 15 11 0 58 36.2 . . . . . . . . 0 0 0 4 427.2 . . . . . . . 37 7 12 0 56 36.6 . . . . . . . . 0 0 0 3 327.6 . . . . . . . 46 9 6 0 61 37.0 . . . . . . . . 0 0 0 3 328.0 . . . . . . . 33 8 2 0 43 37.4 . . . . . . . . 0 0 0 0 028.3 . . . . . . . 26 6 2 0 34 37.8 . . . . . . . . 0 0 0 1 128.7 . . . . . . . 25 4 8 0 37 TOTAL . . . . 682 669 874 525 2,75029.1 . . . . . . . 27 11 14 16 68
0
20
40
60
80
100
120
140
20.1 22.0 24.0 26.0 28.0 29.9 31.9 33.9 35.8 37.8
Operator Location (in)
Co
nta
ct
Incid
en
ts
right left both stand
Figure B–3.—Contact incidents by operator location and work posture.

34
Table B–4.—Contact incidents by operator location and seam height
Operatorlocation
(in)
Seam height (in) Totalcontact
incidents
Operatorlocation
(in)
Seam height (in) Totalcontact
incidents45 60 72 45 60 72
20.1 . . . . . 0 12 0 12 29.5 . . . . . . . . 35 6 44 8520.5 . . . . . 0 60 0 60 29.9 . . . . . . . . 42 3 77 12220.9 . . . . . 0 102 0 102 30.3 . . . . . . . . 59 1 63 12321.3 . . . . . 0 134 0 134 30.7 . . . . . . . . 36 0 66 10221.7 . . . . . 0 141 0 141 31.1 . . . . . . . . 30 0 52 8222.0 . . . . . 0 135 0 135 31.5 . . . . . . . . 24 0 48 7222.4 . . . . . 0 124 0 124 31.9 . . . . . . . . 13 0 30 4322.8 . . . . . 0 117 0 117 32.3 . . . . . . . . 8 0 12 2023.2 . . . . . 0 76 0 76 32.7 . . . . . . . . 0 0 11 1123.6 . . . . . 2 102 0 104 33.1 . . . . . . . . 1 0 18 1924.0 . . . . . 4 83 0 87 33.5 . . . . . . . . 0 0 14 1424.4 . . . . . 12 76 0 88 33.9 . . . . . . . . 0 0 21 2124.8 . . . . . 20 67 0 87 34.3 . . . . . . . . 0 0 12 1225.2 . . . . . 22 65 0 87 34.6 . . . . . . . . 0 0 4 425.6 . . . . . 31 61 0 92 35.0 . . . . . . . . 0 0 10 1026.0 . . . . . 47 50 0 97 35.4 . . . . . . . . 0 0 7 726.4 . . . . . 47 36 0 83 35.8 . . . . . . . . 0 0 9 926.8 . . . . . 28 30 0 58 36.2 . . . . . . . . 0 0 4 427.2 . . . . . 30 26 0 56 36.6 . . . . . . . . 0 0 3 327.6 . . . . . 28 33 0 61 37.0 . . . . . . . . 0 0 3 328.0 . . . . . 23 20 0 43 37.4 . . . . . . . . 0 0 0 028.3 . . . . . 9 25 0 34 37.8 . . . . . . . . 0 0 1 128.7 . . . . . 19 18 0 37 TOTAL . . . . 606 1,619 525 2,75029.1 . . . . . 36 16 16 68
0
20
40
60
80
100
120
140
160
20.1 22.0 24.0 26.0 28.0 29.9 31.9 33.9 35.8 37.8
Operator Location (in)
Co
nta
ct
Incid
en
ts
45-in 60-in 72-in
Figure B–4.—Contact incidents by operator location and seam height.

35
APPENDIX C.—FREQUENCY DATA SETS
Table C–1.—Frequencies by data sets sorted by contacts
Conditions1
Frequencies PercentagesAvoid
incidentsContacts None Total
Avoidincidents
Contacts None
6022B . . . . . 0 136 14 150 0.0 90.7 9.36016B . . . . . 0 127 23 150 0.0 84.7 15.36010B . . . . . 8 122 20 150 5.3 81.3 13.36007B . . . . . 9 119 22 150 6.0 79.3 14.76007L . . . . . 3 119 28 150 2.0 79.3 18.76022L . . . . . 13 115 22 150 8.7 76.7 14.77213S . . . . . 0 115 35 150 0.0 76.7 23.36013B . . . . . 9 113 28 150 6.0 75.3 18.76022R . . . . . 10 111 29 150 6.7 74.0 19.37210S . . . . . 0 108 42 150 0.0 72.0 28.07216S . . . . . 2 106 42 150 1.3 70.7 28.06016L . . . . . 14 105 31 150 9.3 70.0 20.76016R . . . . . 5 105 40 150 3.3 70.0 26.77207S . . . . . 1 104 45 150 0.7 69.3 30.06010L . . . . . 20 101 29 150 13.3 67.3 19.36013R . . . . . 15 95 40 150 10.0 63.3 26.77222S . . . . . 3 92 55 150 2.0 61.3 36.76013L . . . . . 28 91 31 150 18.7 60.7 20.76010R . . . . . 21 83 46 150 14.0 55.3 30.74516B . . . . . 31 77 42 150 20.7 51.3 28.06007R . . . . . 30 77 43 150 20.0 51.3 28.74516R . . . . . 28 54 68 150 18.7 36.0 45.34507B . . . . . 47 53 50 150 31.3 35.3 33.34513B . . . . . 44 49 57 150 29.3 32.7 38.04522B . . . . . 35 49 66 150 23.3 32.7 44.04522R . . . . . 28 44 78 150 18.7 29.3 52.04507R . . . . . 26 43 81 150 17.3 28.7 54.04513R . . . . . 24 43 83 150 16.0 28.7 55.34516L . . . . . 26 37 87 150 17.3 24.7 58.04513L . . . . . 37 36 77 150 24.7 24.0 51.34522L . . . . . 33 31 86 150 22.0 20.7 57.34510B . . . . . 61 29 60 150 40.7 19.3 40.04510R . . . . . 50 27 73 150 33.3 18.0 48.74507L . . . . . 31 18 101 150 20.7 12.0 67.34510L . . . . . 63 16 71 150 42.0 10.7 47.3 Total . . . . . 755 2,750 1,745 5,250 — — —
1The first two digits represent coal seam height (in). The second two digits represent boomarm speed (in/sec). The letter represents work posture as follows: R = right knee; L = leftknee; B = both knees; S = standing.

36
Table C–2.—Frequencies by data sets sorted by avoid incidents
Conditions1
Frequencies PercentagesAvoid
incidentsContacts None Total
Avoidincidents
Contacts None
4510L . . . . . 63 16 71 150 42.0 10.7 47.34510B . . . . . 61 29 60 150 40.7 19.3 40.04510R . . . . . 50 27 73 150 33.3 18.0 48.74507B . . . . . 47 53 50 150 31.3 35.3 33.34513B . . . . . 44 49 57 150 29.3 32.7 38.04513L . . . . . 37 36 77 150 24.7 24.0 51.34522B . . . . . 35 49 66 150 23.3 32.7 44.04522L . . . . . 33 31 86 150 22.0 20.7 57.34516B . . . . . 31 77 42 150 20.7 51.3 28.04507L . . . . . 31 18 101 150 20.7 12.0 67.36007R . . . . . 30 77 43 150 20.0 51.3 28.76013L . . . . . 28 91 31 150 18.7 60.7 20.74516R . . . . . 28 54 68 150 18.7 36.0 45.34522R . . . . . 28 44 78 150 18.7 29.3 52.04507R . . . . . 26 43 81 150 17.3 28.7 54.04516L . . . . . 26 37 87 150 17.3 24.7 58.04513R . . . . . 24 43 83 150 16.0 28.7 55.36010R . . . . . 21 83 46 150 14.0 55.3 30.76010L . . . . . 20 101 29 150 13.3 67.3 19.36013R . . . . . 15 95 40 150 10.0 63.3 26.76016L . . . . . 14 105 31 150 9.3 70.0 20.76022L . . . . . 13 115 22 150 8.7 76.7 14.76022R . . . . . 10 111 29 150 6.7 74.0 19.36007B . . . . . 9 119 22 150 6.0 79.3 14.76013B . . . . . 9 113 28 150 6.0 75.3 18.76010B . . . . . 8 122 20 150 5.3 81.3 13.36016R . . . . . 5 105 40 150 3.3 70.0 26.76007L . . . . . 3 119 28 150 2.0 79.3 18.77222S . . . . . 3 92 55 150 2.0 61.3 36.77216S . . . . . 2 106 42 150 1.3 70.7 28.07207S . . . . . 1 104 45 150 0.7 69.3 30.06022B . . . . . 0 136 14 150 0.0 90.7 9.36016B . . . . . 0 127 23 150 0.0 84.7 15.37213S . . . . . 0 115 35 150 0.0 76.7 23.37210S . . . . . 0 108 42 150 0.0 72.0 28.0 Total . . . . . 755 2,750 1,745 5,250 — — —
1The first two digits represent coal seam height (in). The second two digits represent boomarm speed (in/sec). The letter represents work posture as follows: R = right knee; L = leftknee; B = both knees; S = standing.

37
Table C–3.—Data sets by body part and contacts
Conditions1 Body partTotal
Leg Arm Hand Head
4507B . . . . . . . . . — 2 90 8 1004507L . . . . . . . . . — 1 48 — 494507R . . . . . . . . . — 2 67 — 694510B . . . . . . . . . — 3 84 3 904510L . . . . . . . . . — — 79 — 794510R . . . . . . . . . — 6 71 — 774513B . . . . . . . . . — 8 79 6 934513L . . . . . . . . . — 5 68 — 734513R . . . . . . . . . — 8 59 — 674516B . . . . . . . . . — 8 90 10 1084516L . . . . . . . . . — 2 61 — 634516R . . . . . . . . . — 4 78 — 824522B . . . . . . . . . — 9 65 11 854522L . . . . . . . . . — 1 63 — 644522R . . . . . . . . . — 4 68 — 726007B . . . . . . . . . — 21 65 42 1286007L . . . . . . . . . 46 1 80 — 1276007R . . . . . . . . . 41 2 64 — 1076010B . . . . . . . . . — 14 63 53 1306010L . . . . . . . . . 66 8 58 — 1326010R . . . . . . . . . 32 5 67 — 1046013B . . . . . . . . . — 17 58 47 1226013L . . . . . . . . . 70 2 54 — 1266013R . . . . . . . . . 24 — 86 — 1106016B . . . . . . . . . — 12 66 49 1276016L . . . . . . . . . 43 2 76 — 1216016R . . . . . . . . . 27 3 81 — 1116022B . . . . . . . . . — 7 35 94 1366022L . . . . . . . . . 41 16 72 — 1296022R . . . . . . . . . 28 6 90 — 1247207S . . . . . . . . . 20 3 123 — 1467210S . . . . . . . . . 16 16 79 — 1117213S . . . . . . . . . 7 1 67 — 757216S . . . . . . . . . 26 23 64 — 1137222S . . . . . . . . . 26 17 56 — 99 TOTAL . . . . . . . 513 239 2,474 323 3,549
1The first two digits represent coal seam height (in). The second two digitsrepresent boom arm speed (in/sec). The letter represents work posture as follows:R = right knee; L = left knee; B = both knees; S = standing.

38
APPENDIX D.—CROSS-TABULATION
Table D–1.—Contact incidents by seam height and boom direction
Seamheight, in
Boom directionTotal Summary1
Up Down45 . . . . . . . . . . . . . . 361 245 606 U>D60 . . . . . . . . . . . . . . 1,258 361 1,619 U>D72 . . . . . . . . . . . . . . 460 65 525 U>D Total . . . . . . . . . . . 2,079 671 2,750 —1D = down; U = up.
Table D–2.—Contact incidents by seam height and body part
Seamheight, in
Body partTotal Summary1
Leg Arm Hand Head45 . . . . . . 0 33 563 10 606 H>A>HD>L60 . . . . . . 339 109 886 285 1,619 H>L>HD>A72 . . . . . . 80 59 386 0 525 H>L>A>HD Total . . . 419 201 1,835 295 2,750 —1H = hand; A = arm; HD = head; L = leg.
0
200
400
600
800
1000
1200
1400
45 in 60 in 72 in
Seam Height
Co
nta
ct
Incid
en
ts
Boom up
Boom down
Figure D–1.—Contact incidents by seam height and boom direction.
0
200
400
600
800
1000
45 in 60 in 72 in
Seam Height
Co
nta
ct
Incid
en
ts
leg
arm
hand
head
Figure D–2.—Contact incidents by seam height and body part.

39
Table D–3.—Contact incidents by seam height and machine part
Seamheight, in
Machine partTotal Summary1
Boom Drill head45 . . . . . . . . . . . . . . . . . . . . . 501 105 606 B>D60 . . . . . . . . . . . . . . . . . . . . . 1,295 324 1,619 B>D72 . . . . . . . . . . . . . . . . . . . . . 413 112 525 B>D Total . . . . . . . . . . . . . . . . . . 2,209 541 2,750 —1B = boom; D = drill head.
Table D–4.—Contact incidents by operator percentile and boom direction
Operatorpercentile
Boom directionTotal Summary1
Up Down25th . . . . . . . . . . . . . . . . . . . . . . 806 307 1,113 U>D55th . . . . . . . . . . . . . . . . . . . . . . 688 212 900 U>D92nd . . . . . . . . . . . . . . . . . . . . . 585 152 737 U>D Total . . . . . . . . . . . . . . . . . . . 2,079 671 2,750 —1U = up; D = down.
0
200
400
600
800
1000
1200
1400
45 in 60 in 72 in
Seam Height
Co
nta
ct
Incid
en
ts
boom
drillhead
Figure D–3.—Contact incidents by seam height and machine part.
0
200
400
600
800
1000
25th 55th 92nd
Operator Percentile
Co
nta
ct
Incid
en
ts
Boom up
Boom down
Figure D–4.—Contact incidents by operator percentile and boom direction.

40
Table D–5.—Contact incidents by operator percentile and body part
Operatorpercentile
Body partTotal Summary1
Leg Arm Hand Head25th . . . . . . . . . . . . . . . . 158 117 753 85 1,113 H>L>A>HD55th . . . . . . . . . . . . . . . . 181 60 578 81 900 H>L>HD>A92nd . . . . . . . . . . . . . . . 80 24 504 129 737 H>HD>L>A Total . . . . . . . . . . . . . 419 201 1,835 295 2,750 —1H = hand; L = leg; A = arm; HD = head.
Table D–6.—Contact incidents by operator percentile and machine part
Operatorpercentile
Machine partTotal Summary1
Boom Drill head25th . . . . . . . . . . . . . . . . . . 841 272 1,113 B>D55th . . . . . . . . . . . . . . . . . . 741 159 900 B>D92nd . . . . . . . . . . . . . . . . . 627 110 737 B>D Total . . . . . . . . . . . . . . . 2,209 541 2,750 —1B = boom; D = drill head.
0
100
200
300
400
500
600
700
800
25th 55th 92nd
Operator Percentile
Co
nta
ct
Incid
en
tsLeg
Arm
Hand
Head
Figure D–5.—Contact incidents by operator percentile and body part.
0
200
400
600
800
1000
25th 55th 92nd
Operator Percentile
Co
nta
ct
Incid
en
ts
Boom
Drill head
Figure D–6.—Contact incidents by operator percentile and machine part.

41
Table D–7.—Contact incidents by work posture and boom direction
Work postureBoom direction
Total Summary1
Down UpRight knee . . . . . . . . . . . . . . . . . . 245 437 682 U>DLeft knee . . . . . . . . . . . . . . . . . . . . 233 436 669 U>DBoth knees . . . . . . . . . . . . . . . . . . 128 746 874 U>DStanding . . . . . . . . . . . . . . . . . . . . 65 460 525 U>D Total . . . . . . . . . . . . . . . . . . . . . . 671 2,079 2,750 —1U = up; D = down.
Table D–8.—Contact incidents by work posture and body part
Work postureBody part
Total Summary1
Leg Arm Hand HeadRight knee . . . . . . . . . . 147 28 507 0 682 H>L>A>HDLeft knee . . . . . . . . . . . . 192 34 443 0 669 H>L>A>HDBoth knees . . . . . . . . . . 0 80 499 295 874 H>HD>A>LStanding . . . . . . . . . . . . 80 59 386 0 525 H>L>A>HD Total . . . . . . . . . . . . . . 419 201 1,835 295 2,750 —1H = hand; L = leg; A = arm; HD = head.
0
200
400
600
800
Right knee Left knee Both knees Standing
Working Posture
Co
nta
ct
Incid
en
tsUp
Down
Figure D–7.—Contact incidents by work posture and boom direction.
0
200
400
600
Right knee Left knee Both knees Standing
Working Posture
Co
nta
ct
Incid
en
ts
Leg
Arm
Hand
Head
Figure D-8.—Contact incidents by work posture and body part.

42
Table D–9.—Contact incidents by work posture and machine part
Work postureMachine part
Total Summary1Boom Drill head
Right knee . . . . . . . . . . 563 119 682 B>DLeft knee . . . . . . . . . . . . 535 134 669 B>DBoth knees . . . . . . . . . . 698 176 874 B>DStanding . . . . . . . . . . . . 413 112 525 B>D Total . . . . . . . . . . . . . . 2,209 541 2,750 —1B = boom; D = drill head.
Table D–10.—Contact incidents by drilling behavior and boom direction
Drilling behaviorBoom direction
Total Summary1Up Down
None . . . . . . . . . . . . . . . . . . . . . . . 501 172 673 U>DHand on drill steel . . . . . . . . . . . . . 133 35 168 U>DHand on boom . . . . . . . . . . . . . . . 1,160 381 1,541 U>DHand on drill steel then on boom . 285 83 368 U>D Total . . . . . . . . . . . . . . . . . . . . . 2,079 671 2,750 —1U = up; D = down.
0
200
400
600
800
Right knee Left knee Both knees Standing
Working Posture
Co
nta
ct
Incid
en
ts
Boom
Drill head
Figure D–9.—Contact incidents by work posture and machine part.
0
200
400
600
800
1000
1200
None Hand on drill
steel
Hand on boom Hand on drill
steel then on
boom
Drilling Behavior
Co
nta
ct
Incid
en
ts
Up
Down
Figure D–10.—Contact incidents by drilling behavior and boom direction.

43
Table D–11.—Contact incidents by drilling behavior and body part
Drilling behaviorBody part
Total Summary1
Leg Arm Hand HeadNone . . . . . . . . . . . . . . . . . . . . . . . 200 27 332 114 673 H>L>HD>AHand on drill steel . . . . . . . . . . . . . 28 13 97 30 168 H>L>HD>AHand on boom . . . . . . . . . . . . . . . 162 128 1,116 135 1,541 H>L>A>HDHand on drill steel then on boom . 29 33 290 16 368 H>A>L>HD Total . . . . . . . . . . . . . . . . . . . . . 419 201 1,835 295 2,750 —1H = hand; L = leg; HD = head; A = arm.
Table D–12.—Contact incidents by drilling behavior and machine part
Drilling behaviorMachine part
Total Summary1
Boom Drill headNone . . . . . . . . . . . . . . . . . . . . . . . . . 608 65 673 B>DHand on drill steel . . . . . . . . . . . . . . . 111 57 168 B>DHand on boom . . . . . . . . . . . . . . . . . 1,234 307 1,541 B>DHand on drill steel then on boom . . . 256 112 368 B>D Total . . . . . . . . . . . . . . . . . . . . . . . 2,209 541 2,750 —1B = boom; D = drill head.
0
200400
600
8001000
1200
None Hand on drill
steel
Hand on
boom
Hand on drill
steel then on
boom
Drilling Behavior
Co
nta
ct
Incid
en
tsLeg
Arm
Hand
Head
Figure D–11.—Contact incidents by drilling behavior and body part.
0200400600800
100012001400
None Hand on drill
steel
Hand on
boom
Hand on drill
steel then on
boom
Drilling Behavior
Co
nta
ct
Incid
en
ts
Boom
Drill head
Figure D–12.—Contact incidents by drilling behavior and machine part.

44
Table D–13.—Contact incidents by bolting behavior and machine part
Bolting behaviorMachine part
Total Summary1
Boom Drill headNone . . . . . . . . . . . . . . . . . . . 595 153 748 B>DHand on bolt . . . . . . . . . . . . . 305 97 402 B>DHand on boom . . . . . . . . . . . 870 172 1,042 B>DHand on bolt then on boom . 439 119 558 B>D Total . . . . . . . . . . . . . . . . . 2,209 541 2,750 —1B = boom; D = drill head.
Table D–14.—Contact incidents by bolting behavior and boom direction
Bolting behaviorBoom direction
Total Summary1Up Down
None . . . . . . . . . . . . . . . . . . . . . . . 619 129 748 U>DHand on bolt . . . . . . . . . . . . . . . . . 330 72 402 U>DHand on boom . . . . . . . . . . . . . . . 716 326 1,042 U>DHand on bolt then on boom . . . . . 414 144 558 U>D Total . . . . . . . . . . . . . . . . . . . . . 2,079 671 2,750 —1U = up; D = down.
0
200
400
600
800
1000
None Hand on bolt Hand on
boom
Hand on bolt
then on boom
Bolting Behavior
Co
nta
ct
Incid
en
ts
Boom
Drill head
Figure D–13.—Contact incidents by bolting behavior and machine part.
0
200
400
600
800
None Hand on bolt Hand on boom Hand on bolt
then on boom
Bolting Behavior
Co
nta
ct
Incid
en
ts
Up
Down
Figure D–14.—Contact incidents by bolting behavior and boom direction.

45
Table D–15.—Contact incidents by bolting behavior and body part
Bolting behaviorBody part
Total Summary1
Leg Arm Hand HeadNone . . . . . . . . . . . . . . . . . . . 141 54 454 99 748 H>L>HD>AHand on bolt . . . . . . . . . . . . . 67 41 237 57 402 H>L>HD>AHand on boom . . . . . . . . . . . 143 69 738 92 1,042 H>L>HD>AHand on bolt then on boom . 68 37 406 47 558 H>L>HD>A Total . . . . . . . . . . . . . . . . . 419 201 1,835 295 2,750 —1H = hand; L = leg; HD = head; A = arm.
Table D–16.—Contact incidents by boom speed and boom direction
Boom speed,in/sec
Boom directionTotal Summary1
Up Down7 . . . . . . . . . . . . . . . . . . . . . . 390 143 533 U>D10 . . . . . . . . . . . . . . . . . . . . . 414 72 486 U>D13 . . . . . . . . . . . . . . . . . . . . . 383 159 542 U>D16 . . . . . . . . . . . . . . . . . . . . . 461 150 611 U>D22 . . . . . . . . . . . . . . . . . . . . . 431 147 578 U>D Total . . . . . . . . . . . . . . . . . 2,079 671 2,750 —1U = up; D = down.
0
200
400
600
800
None Hand on bolt Hand on boom Hand on bolt
then on boom
Bolting Behavior
Co
nta
ct
Incid
en
tsLeg
Arm
Hand
Head
Figure D–15.—Contact incidents by bolting behavior and body part.
0
200
400
600
7 in/sec 10 in/sec 13 in/sec 16 in/sec 22 in/sec
Boom Speed
Co
nta
ct
Incid
en
ts
Up
Down
Figure D–16.—Contact incidents by boom speed and boom direction.
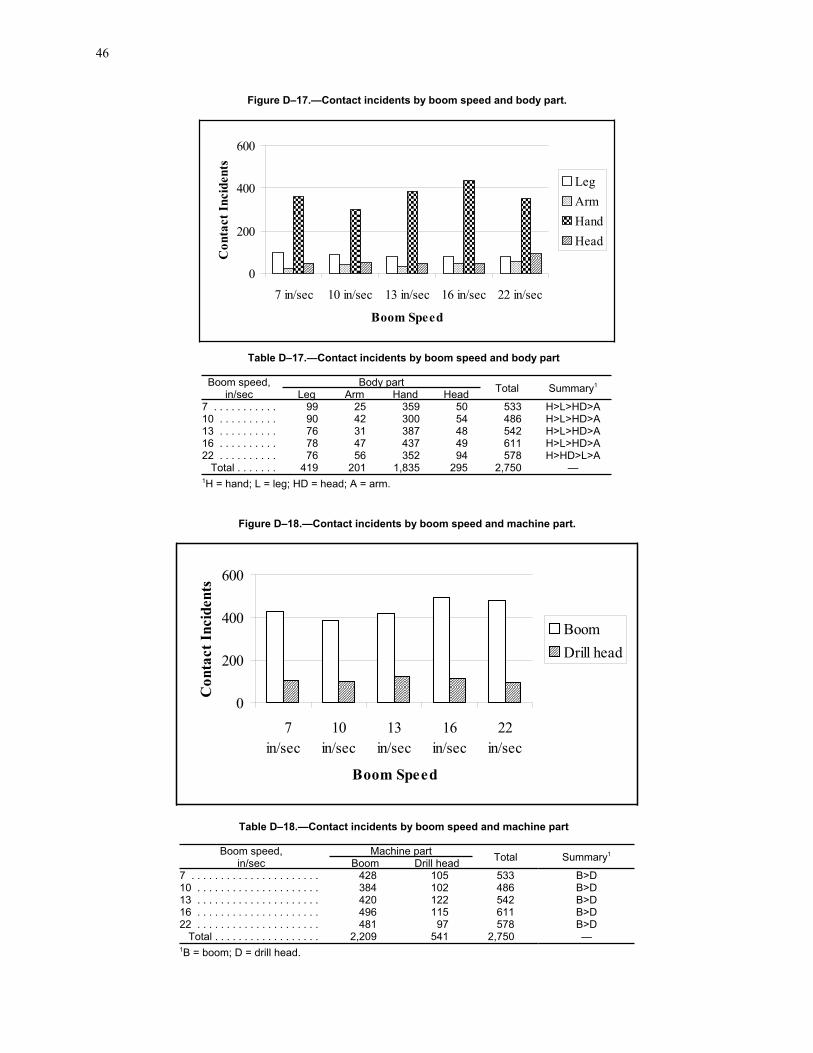
46
Table D–17.—Contact incidents by boom speed and body part
Boom speed,in/sec
Body partTotal Summary1
Leg Arm Hand Head7 . . . . . . . . . . . 99 25 359 50 533 H>L>HD>A10 . . . . . . . . . . 90 42 300 54 486 H>L>HD>A13 . . . . . . . . . . 76 31 387 48 542 H>L>HD>A16 . . . . . . . . . . 78 47 437 49 611 H>L>HD>A22 . . . . . . . . . . 76 56 352 94 578 H>HD>L>A Total . . . . . . . 419 201 1,835 295 2,750 —1H = hand; L = leg; HD = head; A = arm.
Table D–18.—Contact incidents by boom speed and machine part
Boom speed,in/sec
Machine partTotal Summary1
Boom Drill head7 . . . . . . . . . . . . . . . . . . . . . . 428 105 533 B>D10 . . . . . . . . . . . . . . . . . . . . . 384 102 486 B>D13 . . . . . . . . . . . . . . . . . . . . . 420 122 542 B>D16 . . . . . . . . . . . . . . . . . . . . . 496 115 611 B>D22 . . . . . . . . . . . . . . . . . . . . . 481 97 578 B>D Total . . . . . . . . . . . . . . . . . . 2,209 541 2,750 —1B = boom; D = drill head.
0
200
400
600
7 in/sec 10 in/sec 13 in/sec 16 in/sec 22 in/sec
Boom Speed
Co
nta
ct
Incid
en
ts
Leg
Arm
Hand
Head
Figure D–17.—Contact incidents by boom speed and body part.
0
200
400
600
7
in/sec
10
in/sec
13
in/sec
16
in/sec
22
in/sec
Boom Speed
Co
nta
ct
Incid
en
ts
Boom
Drill head
Figure D–18.—Contact incidents by boom speed and machine part.
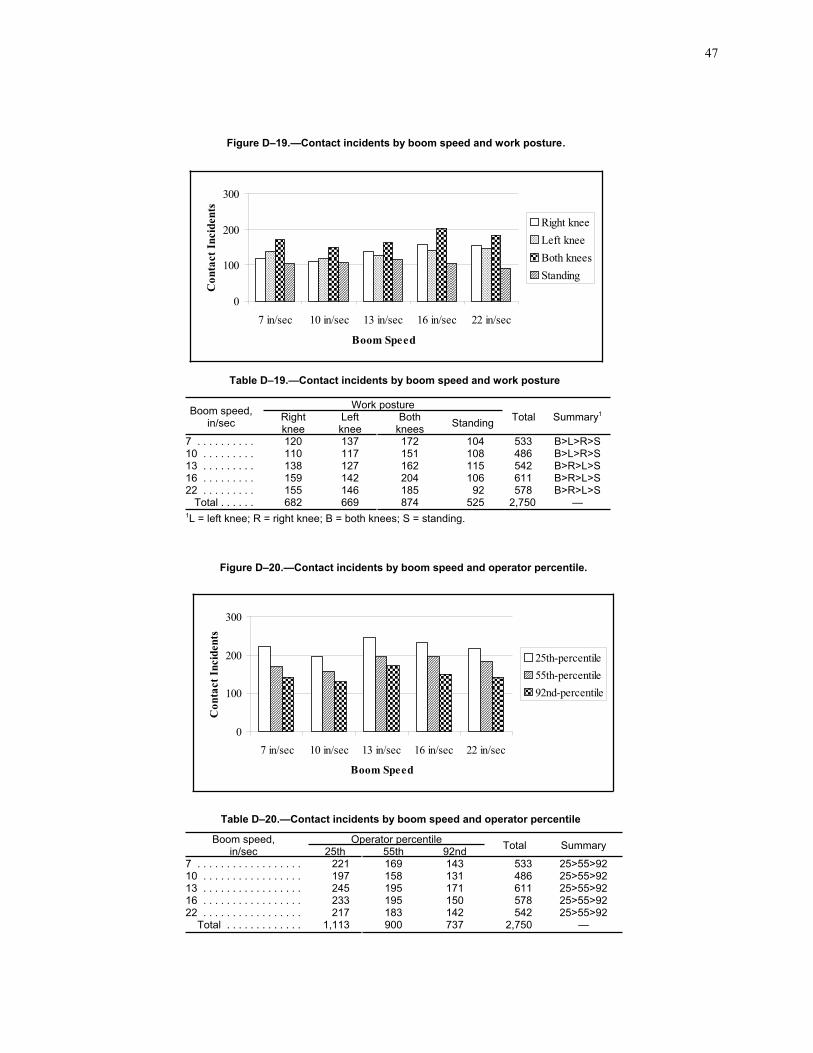
47
Table D–19.—Contact incidents by boom speed and work posture
Boom speed,in/sec
Work postureTotal Summary1Right
kneeLeftknee
Bothknees
Standing
7 . . . . . . . . . . 120 137 172 104 533 B>L>R>S10 . . . . . . . . . 110 117 151 108 486 B>L>R>S13 . . . . . . . . . 138 127 162 115 542 B>R>L>S16 . . . . . . . . . 159 142 204 106 611 B>R>L>S22 . . . . . . . . . 155 146 185 92 578 B>R>L>S Total . . . . . . 682 669 874 525 2,750 —1L = left knee; R = right knee; B = both knees; S = standing.
Table D–20.—Contact incidents by boom speed and operator percentile
Boom speed,in/sec
Operator percentileTotal Summary
25th 55th 92nd7 . . . . . . . . . . . . . . . . . . 221 169 143 533 25>55>9210 . . . . . . . . . . . . . . . . . 197 158 131 486 25>55>9213 . . . . . . . . . . . . . . . . . 245 195 171 611 25>55>9216 . . . . . . . . . . . . . . . . . 233 195 150 578 25>55>9222 . . . . . . . . . . . . . . . . . 217 183 142 542 25>55>92 Total . . . . . . . . . . . . . 1,113 900 737 2,750 —
0
100
200
300
7 in/sec 10 in/sec 13 in/sec 16 in/sec 22 in/sec
Boom Speed
Co
nta
ct
Incid
en
tsRight knee
Left knee
Both knees
Standing
Figure D–19.—Contact incidents by boom speed and work posture.
0
100
200
300
7 in/sec 10 in/sec 13 in/sec 16 in/sec 22 in/sec
Boom Speed
Co
nta
ct
Incid
en
ts
25th-percentile
55th-percentile
92nd-percentile
Figure D–20.—Contact incidents by boom speed and operator percentile.

48
Table D–21.—Contact incidents by boom speed and drilling behavior
Boom speed,in/sec
Drilling behaviorTotal Summary1
NoneHand ondrill steel
Hand onboom
Hand on drill steelthen on boom
7 . . . . . . . . . . . . 144 28 291 70 533 B>N>D&B>D10 . . . . . . . . . . . 120 39 268 59 486 B>N>D&B>D13 . . . . . . . . . . . 140 26 373 72 611 B>N>D&B>D16 . . . . . . . . . . . 129 38 322 89 578 B>N>D&B>D22 . . . . . . . . . . . 140 37 287 78 542 B>N>D&B>D Total . . . . . . . . 673 168 1,541 368 2,750 —1D = hand on drill steel; B = hand on boom; D&B = hand on drill steel then on boom; N = none.
Table D–22.—Contact incidents by boom speed and seam height
Boom speed,in/sec
Seam height, inTotal Summary
45 60 727 . . . . . . . . . . . . . . . . . . . . . . 114 315 104 533 60>45>7210 . . . . . . . . . . . . . . . . . . . . . 72 306 108 486 60>72>4513 . . . . . . . . . . . . . . . . . . . . . 168 337 106 611 60>45>7216 . . . . . . . . . . . . . . . . . . . . . 124 362 92 578 60>45>7222 . . . . . . . . . . . . . . . . . . . . . 128 299 115 542 60>45>72 Total . . . . . . . . . . . . . . . . . . 606 1,619 525 2,750 —
0
100
200
300
400
7
in/sec
10
in/sec
13
in/sec
16
in/sec
22
in/sec
Boom Speed
Co
nta
ct
Incid
en
tsNone
Hand on drill steel
Hand on boom
Hand on drill steel then on
boom
Figure D–21.—Contact incidents by boom speed and drilling behavior.
0
100
200
300
400
7 in/sec 10 in/sec 13 in/sec 16 in/sec 22 in/sec
Boom Speed
Co
nta
ct
Incid
en
ts
45 in
60 in
72 in
Figure D–22.—Contact incidents by boom speed and seam height.

49
Table D–23.—Contact incidents by boom speed and bolting behavior
Boom speed,in/sec
Bolting behaviorTotal Summary1
NoneHand on
boltHand on
boomHand on boltthen on boom
7 . . . . . . . . . . . . . 133 69 215 116 533 B>N>BT&B>BT10 . . . . . . . . . . . . 136 68 175 107 486 B>N>BT&B>BT13 . . . . . . . . . . . . 163 88 234 126 611 B>N>BT&B>BT16 . . . . . . . . . . . . 157 91 220 110 578 B>N>BT&B>BT22 . . . . . . . . . . . . 159 86 198 99 542 B>N>BT&B>BT Total . . . . . . . . . 748 402 1,042 558 2,750 —1BT = hand on bolt; B = hand on boom; BT&B = hand on bolt then on boom; N = none.
0
50
100
150
200
250
7
in/sec
10
in/sec
13
in/sec
16
in/sec
22
in/sec
Boom Speed
Co
nta
ct
Incid
en
tsNone
Hand on bolt
Hand on boom
Hand on bolt then on
boom
Figure D–23.—Contact incidents by boom speed and bolting behavior.

50
APPENDIX E.—LOGISTIC REGRESSION MODELS
FOR ROOF BOLTER SIMULATION DATA
Table E–1.—Modeling the probability of a contact for slow reaction time of operator (N = 5,250)
Model Predictor variable SE( ) Pr > chi-square R2
1 . . . . . Seam height:
0.2435 45 in . . . . . . . . . . . . . . . . . . — — 1.000 — 60 in . . . . . . . . . . . . . . . . . . 1.9403 0.0668 6.961 <.0001 72 in . . . . . . . . . . . . . . . . . . 1.8453 0.0928 6.330 <.0001
2 . . . . . Boom speed:
0.0087
7 in/sec . . . . . . . . . . . . . . . . — — 1.000 — 10 in/sec . . . . . . . . . . . . . . . 0.1793 0.0874 0.836 0.0402 13 in/sec . . . . . . . . . . . . . . . 0.0343 0.0873 1.035 0.6944 16 in/sec . . . . . . . . . . . . . . . 0.3301 0.0879 1.350 0.0006 22 in/sec . . . . . . . . . . . . . . . 0.1721 0.0875 1.188 0.0492
3 . . . . . Operator percentile:
0.0410 55th . . . . . . . . . . . . . . . . . . . — — 1.000 — 25th . . . . . . . . . . . . . . . . . . . 0.5020 0.0690 1.652 <.0001 92nd . . . . . . . . . . . . . . . . . . 0.3731 0.0681 0.689 <.0001
4 . . . . . Working posture:
0.0456 Standing . . . . . . . . . . . . . . . — — 1.000 — Right knee . . . . . . . . . . . . . 1.0287 0.0951 0.357 <.0001 Left knee . . . . . . . . . . . . . . . 1.0637 0.0951 0.345 <.0001 Both knees . . . . . . . . . . . . . 0.5132 0.0953 0.599 <.0001
5 . . . . . Working posture/seam height:
0.3195
Standing/72 in . . . . . . . . . . — — 1.000 — Right knee/45 in . . . . . . . . . 1.8941 0.1176 0.150 <.0001 Right knee/60 in . . . . . . . . . 0.3419 0.1129 0.710 0.0024 Left knee/45 in . . . . . . . . . . 2.4724 0.1274 0.084 <.0001 Left knee/60 in . . . . . . . . . . 0.0404 0.1161 1.041 0.7277 Both knees/45 in . . . . . . . . . 1.5904 0.1144 0.204 <.0001 Both knees/60 in . . . . . . . . . 0.7179 0.1272 2.050 <.0001Boom speed: 7 in/sec . . . . . . . . . . . . . . . . — — 1.000 — 10 in/sec . . . . . . . . . . . . . . . 0.2377 0.1007 0.788 0.0182 13 in/sec . . . . . . . . . . . . . . . 0.0453 0.1007 1.046 0.6525 16 in/sec . . . . . . . . . . . . . . . 0.3995 0.1015 1.491 <.0001 22 in/sec . . . . . . . . . . . . . . . 0.2291 0.1010 1.257 <.0233Operator percentile: 55th . . . . . . . . . . . . . . . . . . . — — 1.000 — 25th . . . . . . . . . . . . . . . . . . . 0.6553 0.0793 1.926 <.0001 92nd . . . . . . . . . . . . . . . . . . 0.4859 0.0777 0.615 <.0001
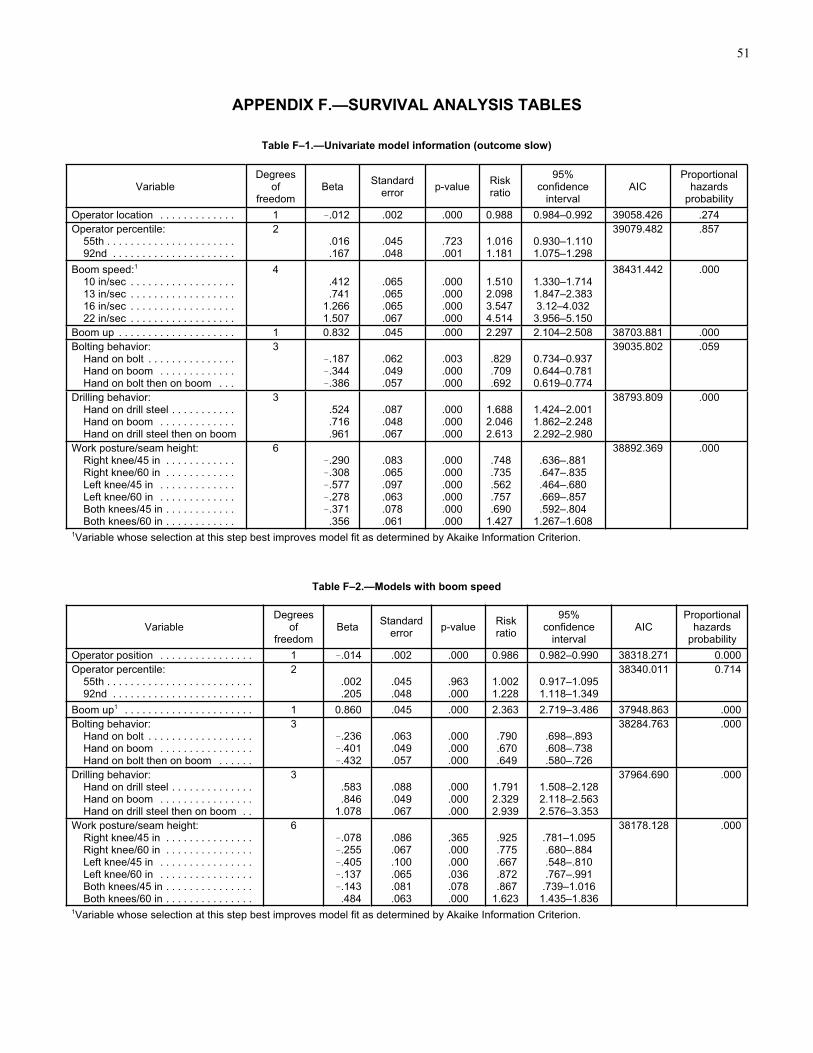
51
APPENDIX F.—SURVIVAL ANALYSIS TABLES
Table F–1.—Univariate model information (outcome slow)
VariableDegrees
offreedom
BetaStandard
errorp-value
Riskratio
95%confidence
intervalAIC
Proportionalhazards
probability
Operator location . . . . . . . . . . . . . 1 .012 .002 .000 0.988 0.984–0.992 39058.426 .274
Operator percentile: 55th . . . . . . . . . . . . . . . . . . . . . . 92nd . . . . . . . . . . . . . . . . . . . . .
2 .016 .167
.045
.048.723.001
1.0161.181
0.930–1.1101.075–1.298
39079.482 .857
Boom speed:1
10 in/sec . . . . . . . . . . . . . . . . . . 13 in/sec . . . . . . . . . . . . . . . . . . 16 in/sec . . . . . . . . . . . . . . . . . . 22 in/sec . . . . . . . . . . . . . . . . . .
4.412.741
1.2661.507
.065
.065
.065
.067
.000
.000
.000
.000
1.5102.0983.5474.514
1.330–1.7141.847–2.3833.12–4.032
3.956–5.150
38431.442 .000
Boom up . . . . . . . . . . . . . . . . . . . . 1 0.832 .045 .000 2.297 2.104–2.508 38703.881 .000
Bolting behavior: Hand on bolt . . . . . . . . . . . . . . . Hand on boom . . . . . . . . . . . . . Hand on bolt then on boom . . .
3.187.344.386
.062
.049
.057
.003
.000
.000
.829
.709
.692
0.734–0.9370.644–0.7810.619–0.774
39035.802 .059
Drilling behavior: Hand on drill steel . . . . . . . . . . . Hand on boom . . . . . . . . . . . . . Hand on drill steel then on boom
3.524.716.961
.087
.048
.067
.000
.000
.000
1.6882.0462.613
1.424–2.0011.862–2.2482.292–2.980
38793.809 .000
Work posture/seam height: Right knee/45 in . . . . . . . . . . . . Right knee/60 in . . . . . . . . . . . . Left knee/45 in . . . . . . . . . . . . . Left knee/60 in . . . . . . . . . . . . . Both knees/45 in . . . . . . . . . . . . Both knees/60 in . . . . . . . . . . . .
6.290.308.577.278.371.356
.083
.065
.097
.063
.078
.061
.000
.000
.000
.000
.000
.000
.748
.735
.562
.757
.6901.427
.636–.881
.647–.835
.464–.680
.669–.857
.592–.8041.267–1.608
38892.369 .000
1Variable whose selection at this step best improves model fit as determined by Akaike Information Criterion.
Table F–2.—Models with boom speed
VariableDegrees
offreedom
BetaStandard
errorp-value
Riskratio
95%confidence
intervalAIC
Proportionalhazards
probability
Operator position . . . . . . . . . . . . . . . . 1 .014 .002 .000 0.986 0.982–0.990 38318.271 0.000
Operator percentile: 55th . . . . . . . . . . . . . . . . . . . . . . . . . 92nd . . . . . . . . . . . . . . . . . . . . . . . .
2.002.205
.045
.048.963.000
1.0021.228
0.917–1.0951.118–1.349
38340.011 0.714
Boom up1 . . . . . . . . . . . . . . . . . . . . . . 1 0.860 .045 .000 2.363 2.719–3.486 37948.863 .000
Bolting behavior: Hand on bolt . . . . . . . . . . . . . . . . . . Hand on boom . . . . . . . . . . . . . . . . Hand on bolt then on boom . . . . . .
3.236.401.432
.063
.049
.057
.000
.000
.000
.790
.670
.649
.698–.893
.608–.738
.580–.726
38284.763 .000
Drilling behavior: Hand on drill steel . . . . . . . . . . . . . . Hand on boom . . . . . . . . . . . . . . . . Hand on drill steel then on boom . .
3.583.846
1.078
.088
.049
.067
.000
.000
.000
1.7912.3292.939
1.508–2.1282.118–2.5632.576–3.353
37964.690 .000
Work posture/seam height: Right knee/45 in . . . . . . . . . . . . . . . Right knee/60 in . . . . . . . . . . . . . . . Left knee/45 in . . . . . . . . . . . . . . . . Left knee/60 in . . . . . . . . . . . . . . . . Both knees/45 in . . . . . . . . . . . . . . . Both knees/60 in . . . . . . . . . . . . . . .
6.078.255.405.137.143.484
.086
.067
.100
.065
.081
.063
.365
.000
.000
.036
.078
.000
.925
.775
.667
.872
.8671.623
.781–1.095.680–.884.548–.810.767–.991
.739–1.0161.435–1.836
38178.128 .000
1Variable whose selection at this step best improves model fit as determined by Akaike Information Criterion.

52
Table F–3.—Models with boom speed, boom direction
VariableDegrees
offreedom
BetaStandard
errorp-value
Riskratio
95%confidence
intervalAIC
Proportionalhazards
probability
Operator location . . . . . . . . . . . . . . . . 1 .007 .002 .001 .734 .989–.997 37688.279 0.000
Operator percentile: 25th . . . . . . . . . . . . . . . . . . . . . . . . . 92nd . . . . . . . . . . . . . . . . . . . . . . . .
2.008.241
.045
.048.865.000
1.0081.272
.922–1.1011.158–1.398
37682.262 0.461
Bolting behavior: Hand on bolt . . . . . . . . . . . . . . . . . . Hand on boom . . . . . . . . . . . . . . . . Hand on bolt then on boom . . . . . .
3.256.348.452
.063
.050
.057
.000
.000
.000
.774
.706
.636
.685–.875
.640–.779
.569–.712
37641.491 0.000
Drilling behavior:1
Hand on drill steel . . . . . . . . . . . . . . Hand on boom . . . . . . . . . . . . . . . . Hand on drill steel then on boom . .
3.636
1.0251.266
.088
.048
.067
.000
.000
.000
1.8892.7883.546
1.591–2.2432.536–3.0643.109–4.045
37123.513 .000
Work posture/seam height: Right knee/45 in . . . . . . . . . . . . . . . Right knee/60 in . . . . . . . . . . . . . . . Left knee/45 in . . . . . . . . . . . . . . . . Left knee/60 in . . . . . . . . . . . . . . . . Both knees/45 in . . . . . . . . . . . . . . . Both knees/60 in . . . . . . . . . . . . . . .
6.476.095.202.018.047.492
.089
.067
.102
.066
.082
.063
.000
.159
.049
.782
.561
.000
1.609.909
1.223.982
1.0491.636
1.352–1.916.797–1.038
1.001–1.495.864–1.117.893–1.231
1.446–1.851
37581.826 0.000
1Variable whose selection at this step best improves model fit as determined by Akaike Information Criterion.
Table F–4.—Models with boom speed, boom direction, drilling behavior
VariableDegrees
offreedom
BetaStandard
errorp-value
Riskratio
95%confidence
intervalAIC
Proportionalhazards
probability
Operator location . . . . . . . . . . . . . . . . 1 .013 .002 .000 .987 — 36928.749 .000
Operator percentile: 25th . . . . . . . . . . . . . . . . . . . . . . . . . 92nd . . . . . . . . . . . . . . . . . . . . . . . .
2.063.166
.045
.048.165.001
0.9391.181
.859–1.0261.074–1.299
36948.790 .806
Bolting behavior: Hand on bolt . . . . . . . . . . . . . . . . . . Hand on boom . . . . . . . . . . . . . . . . Hand on bolt then on boom . . . . . .
3.184.323.415
.063
.050
.057
.004
.000
.000
.832
.724
.661
.735–.941
.656–.799
.590–.739
36910.591 0.000
Work posture/seam height:1
Right knee/45 in . . . . . . . . . . . . . . . Right knee/60 in . . . . . . . . . . . . . . . Left knee/45 in . . . . . . . . . . . . . . . . Left knee/60 in . . . . . . . . . . . . . . . . Both knees/45 in . . . . . . . . . . . . . . . Both knees/60 in . . . . . . . . . . . . . . .
6.444.066.250.059.181.658
.088
.068
.102
.066
.082
.063
.000
.332
.014
.372
.026
.000
1.5581.9361.2841.0601.1991.930
1.310–1.8530.820–1.0691.051–15690.932–1.2061.021–1.4071.705–2.185
36797.873 .000
1Variable whose selection at this step best improves model fit as determined by Akaike Information Criterion.
Table F–5.—Models with boom speed, boom direction, drilling behavior, work posture/seam height
VariableDegrees
offreedom
BetaStandard
errorp-value
Riskratio
95%confidence
intervalAIC
Proportionalhazards
probability
Operator location . . . . . . . . . . . . . . . . 1 .006 .005 .170 .994 .985–1.003 36180.209 .492
Operator percentile: 25th . . . . . . . . . . . . . . . . . . . . . . . . . 92nd . . . . . . . . . . . . . . . . . . . . . . . .
2.054.093
.046
.049.241.057
0.9481.098
.867–1.037
.997–1.208
36175.668 .979
Bolting behavior:1
Hand on bolt . . . . . . . . . . . . . . . . . . Hand on boom . . . . . . . . . . . . . . . . Hand on bolt then on boom . . . . . .
3.162.321.428
.063
.051
.058
.010
.000
.000
.850
.725
.652
.751–.962
.657–.801
.582–.731
36122.493 .046
1Variable whose selection at this step best improves model fit as determined by Akaike Information Criterion.
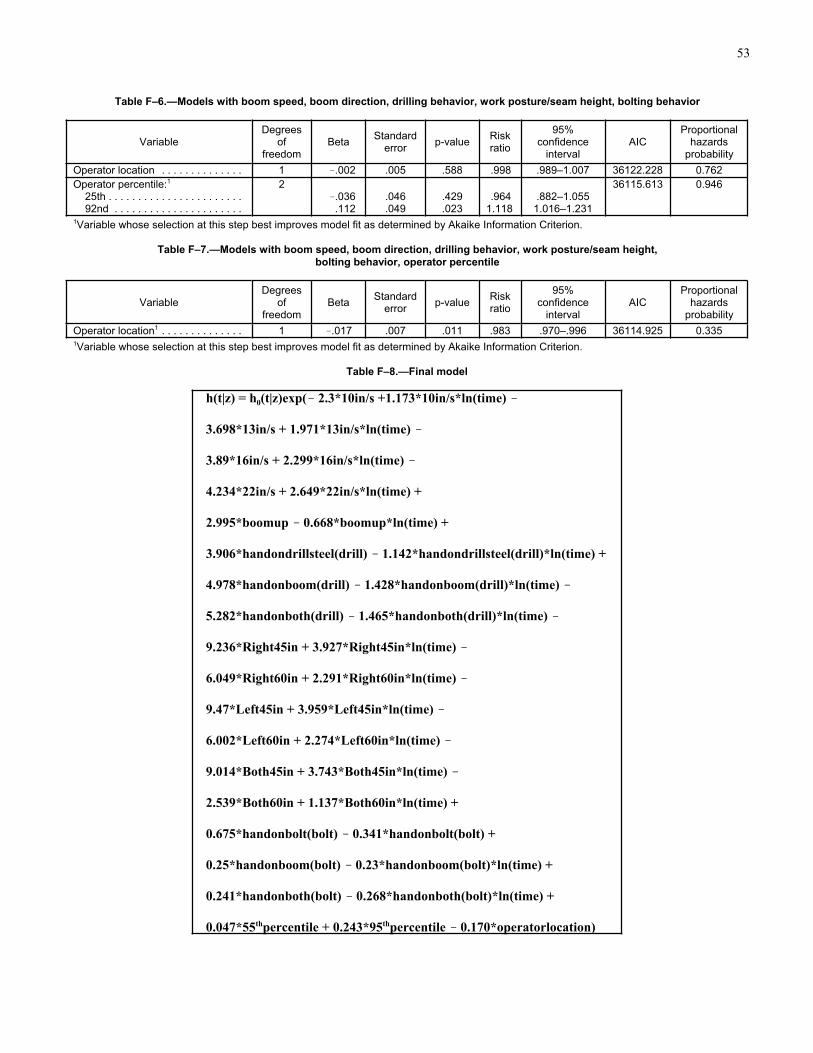
53
Table F–6.—Models with boom speed, boom direction, drilling behavior, work posture/seam height, bolting behavior
VariableDegrees
offreedom
BetaStandard
errorp-value
Riskratio
95%confidence
intervalAIC
Proportionalhazards
probability
Operator location . . . . . . . . . . . . . . 1 .002 .005 .588 .998 .989–1.007 36122.228 0.762
Operator percentile:1
25th . . . . . . . . . . . . . . . . . . . . . . . 92nd . . . . . . . . . . . . . . . . . . . . . .
2.036.112
.046
.049.429.023
.9641.118
.882–1.0551.016–1.231
36115.613 0.946
1Variable whose selection at this step best improves model fit as determined by Akaike Information Criterion.
Table F–7.—Models with boom speed, boom direction, drilling behavior, work posture/seam height,
bolting behavior, operator percentile
VariableDegrees
offreedom
BetaStandard
errorp-value
Riskratio
95%confidence
intervalAIC
Proportionalhazards
probability
Operator location1 . . . . . . . . . . . . . . 1 .017 .007 .011 .983 .970–.996 36114.925 0.3351Variable whose selection at this step best improves model fit as determined by Akaike Information Criterion.
Table F–8.—Final model
h(t|z) = h0(t|z)exp( 2.3*10in/s +1.173*10in/s*ln(time)
3.698*13in/s + 1.971*13in/s*ln(time)
3.89*16in/s + 2.299*16in/s*ln(time)
4.234*22in/s + 2.649*22in/s*ln(time) +
2.995*boomup 0.668*boomup*ln(time) +
3.906*handondrillsteel(drill) 1.142*handondrillsteel(drill)*ln(time) +
4.978*handonboom(drill) 1.428*handonboom(drill)*ln(time)
5.282*handonboth(drill) 1.465*handonboth(drill)*ln(time)
9.236*Right45in + 3.927*Right45in*ln(time)
6.049*Right60in + 2.291*Right60in*ln(time)
9.47*Left45in + 3.959*Left45in*ln(time)
6.002*Left60in + 2.274*Left60in*ln(time)
9.014*Both45in + 3.743*Both45in*ln(time)
2.539*Both60in + 1.137*Both60in*ln(time) +
0.675*handonbolt(bolt) 0.341*handonbolt(bolt) +
0.25*handonboom(bolt) 0.23*handonboom(bolt)*ln(time) +
0.241*handonboth(bolt) 0.268*handonboth(bolt)*ln(time) +
0.047*55thpercentile + 0.243*95thpercentile 0.170*operatorlocation)

54
APPENDIX G.—ILLUSTRATIONS OF OPERATOR'S WORK BEHAVIORS
Figure G–1.—45-in seam height and different work postures: operator's hand on the boom arm, hand on the drill steel, hand off
both boom arm and drill steel.

55
Figure G–2.—60-in seam height and different work postures: operator's hand on the boom arm, hand on the drill steel, hand off both
boom arm and drill steel.
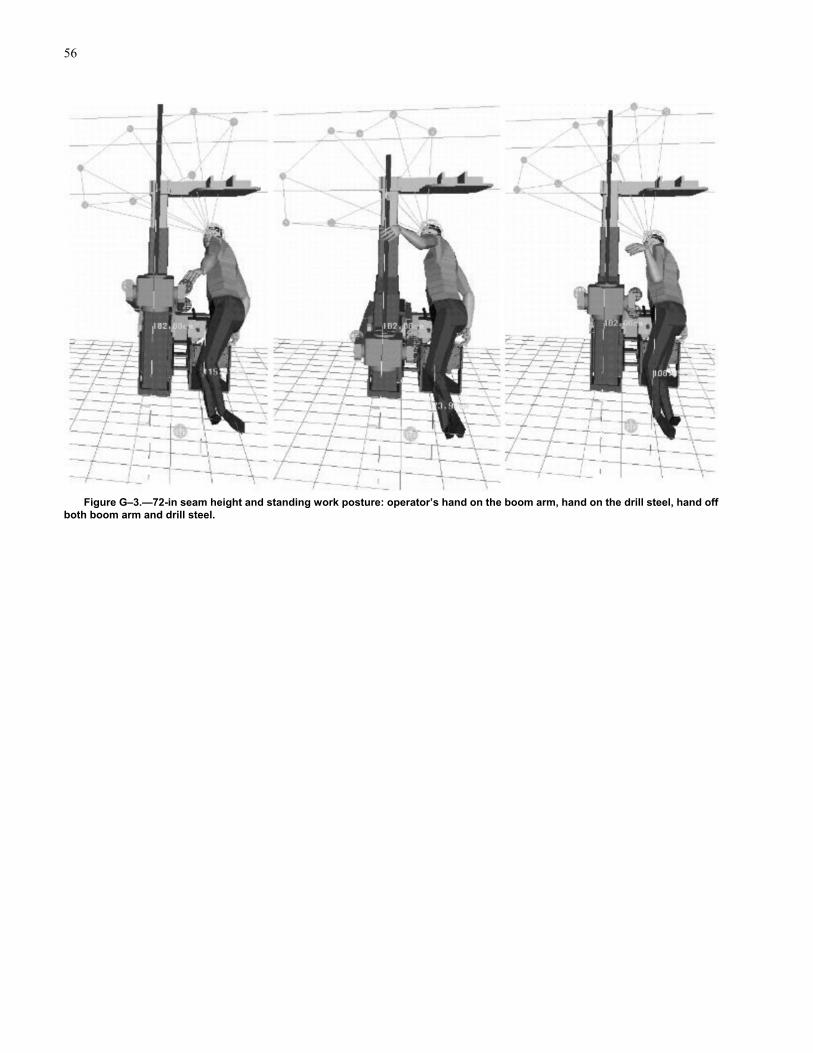
56
Figure G–3.—72-in seam height and standing work posture: operator’s hand on the boom arm, hand on the drill steel, hand off
both boom arm and drill steel.


![Management Information Circular 2015 FINAL (Sent to Printer) · SILVER WHEATON 2015 MANAGEMENT INFORMATION CIRCULAR [4] Proxy Summary Information Proxy Summary Information To assist](https://static.documents.pub/doc/80x56/60671ea7c32dc723276ab106/management-information-circular-2015-final-sent-to-printer-silver-wheaton-2015.jpg)


