UNITED STA TES INTERNATIONAL TRADE COMMISSION INFORMATION FOR USE IN DETERMINING WHETHER TO REMOVE PERMANENT-MAGNET DIRECT CURRENT MOTORS FROM THE LIST OF ARTICLES ELIGIBLE FOR THE GENERALIZED SYSTEM OF PREFERENCES Report to the President on Investigation No. 332-79(1) Under Section 332(g) of the Tariff Act of 1930, as Amended USITC Publication 802 Washington, D. c. . February 1977
Transcript
UNITED STA TES INTERNATIONAL TRADE COMMISSION
INFORMATION FOR USE IN DETERMINING WHETHER TO REMOVE PERMANENT-MAGNET DIRECT CURRENT MOTORS
FROM THE LIST OF ARTICLES ELIGIBLE FOR THE GENERALIZED SYSTEM OF PREFERENCES
Report to the President on Investigation No. 332-79(1)
Under Section 332(g) of the Tariff Act of 1930, as Amended
USITC Publication 802 Washington, D. c.
. February 1977
UNITED STATES INTERNATIONAL TRADE COMMISSION
COMMISSIONERS
Daniel Minchew, Chairman Joseph O. Parker, Vice Chairman Will E. Leonard George M. Moore Catherine Bedell Italo H. Ablondi
Kenneth R. Mason, Secretary to the Commission
This report was principally prepared by
Nelson J. Hogge, Metals Division George L. Deyman, Office of Economic Research
assisted by
Thomas L. Donnelly, Accounting Division Edward R. Easton, Office of the General Counsel
Address all communications to United States International Trade Commission
Washington, D. C. 20436
C 0 N T E N T S
Information obtained in the investigation: Introduction------------------------------------------------ 1 The product:
Description--------------------------------------------- 4 Uses---------------------------------------------------- 5 Manufacturing and technology---------------------------- 5 Like or directly competitive products------------------- 6
U.S. tariff treatment-----------~--------------------------- 8 GSP and the "competitive need" provisions--------------- 8
Domestic industry: U.S. producers------------------------------------------ 10 U.S. production----------------------------------------- 11 Capacity------------------------------------------------ 12 U.S. producers' shipments------------------------------- 13 U.S. producers' inventories----------------------------- 16 Apparent U.S. consumption------------------------------- 17 U.S. exports-------------------------------------------- 18 U.S. employment----------------------------------------- 19
Permanent-magnet DC motors of under 1/40 horse-power--------------------------------------------- 19
Permanent-magnet DC motors of 1/40 or more but not over 1/10 horsepower------------------~------- 20
Other employment------------------------~----------- 22 Adjustment assistance------------------------------- 22 Man-hours------------------------------------------- 23
Profit-and-loss experience of domestic producers-------- 24 Producers of motors of under 1/40 horsepower-------- 26 Producers of motors of 1/40 or more but not over
1/10 horsepower----------------------------------- 26 Representations by interested parties----------------------- 28 Foreign industry:
Japan--------------------------------------------------- 30 Hong Kong----------------------------------------------- 30 Singapore----------------------------------------------- 31 Republic of China--------------------------------------- 31 Dominican Republic-------------------------------------- 31 Mexico-------------------------------------------------- 32 Other countries----------------------------------------- 32
U.S. imports of electric motors of under 1/40 horsepower----- 33 U.S. imports from beneficiary countries------------------ 33 U.S. imports of permanent-magnet DC motors--------------- 34 U.S. imports of permanent~magnet DC motors from
beneficiary countries---------------------------------- 35 The ratio of imports to consumption---------------------- 36
ii
CONTENTS
U.S. imports of electric motors of under 1/40 horsepower--.Continued
U.S. imports of electric motors under TSUS item 807.00----- 36 Importers-------------------------------------------------- 37 Importers' inventories------------------------------------- 38 Importers' markets for permanent-magnet DC motors---------- 39
U.S. imports of electric motors of 1/40 or more but not over 1/10 horsepower---------------------------------------------- 42
U.S. imports from beneficiary countries-------------------- 42 U.S. imports of permanent-magnet DC motors----------------- 43 U.S. imports of permanent-magnet DC motors from
beneficiary countries------------------------------------ 44 The ratio of imports to apparent consumption--------------- 45 U.S. imports of electric motors under TSUS item 807.00----- 45 Importers-------------------------------------------------- 46 Importers' inventories------------------------------------- 47 Importers' markets for permanent-magnet DC motors---------- 47
Prices: Permanent-magnet DC motors of under 1/40 horsepower-------- 50 Permanent-magnet DC motors of 1/40 or more but not
over 1/10 horsepower------------------------------------- 53 Price effects of the GSP---------~---------------~--------- 56
Economic effect of duty-free treatment under the GSP on domestic producers of permanent-magnet DC motors of under 1/40 horsepower------------------------------------- 58
Economic effect of duty-free treatment under the GSP on domestic producers of permanent-magnet DC motors of 1/40 or more but not over 1/10 horsepower---------------~---- 60
Probable economic effects of withdrawal of the GSP benefits: Economic effect on domestic producers---------------------- 61 Economic effect on prospective establishment of
new or additional production----------------------------- 61 Economic effect on domestic producers of products utilizing
or incorporating permanent-magnet DC motors of under 1/40 horsepower---------------------------------------------- 62
Economic effect on domestic producers of products utilizing or incorporating permanent-magnet DC motors of 1/40 or more but not over 1/10 horsepower---------------------------- 63
Effects on GSP benefits by virtue of the competitive-need provisions of section 504(c)---------------------~----------- 64
Trade Agreement Digests---------------------------------------- 67 Appendix A. Statistical tables-------------------------------- 68 Appendix B. Probable effects statement of Trade ·Agreement
Digest No. 60276--------------------------------------------- 83 Appendix C. General Headnote 3(c) of the Tariff Schedules
of the United States Annotated------------------------------- 86
111
CONTENTS
Tables
1. Permanent-magnet DC motors of under 1/40 horsepower (TSUS item 682.25): U.S. producers' shipments, imports for consumption, exports, and apparent consumption , 1972-75, January-September 1975, and January-September 1976------------------------------------------------------ 69
2. Permanent-magnet DC motors of 1/40 or more but not over 1/10 horsepower (TSUS item 682.30): U.S. producers' shipments, imports for consumption, exports, and apparent consumption, 1972-75, January-September 1975, and January-September 1976------------------------------- 70
3. Fractional-horsepower DC motors: U.S. producers' shipments, by types, 1972-75------------------------------ 71
4. Fractional-horsepower motors: U.S. producers' shipments, by types, 1972-75----------------------------------------- 72
5. Electric motors of under 1/40 horsepower (TSUS item 682.25): U.S. imports for consumption, by principal sources, 1972-75, January-September 1975, and JanuarySeptember 1976-------------------------------------------- 73
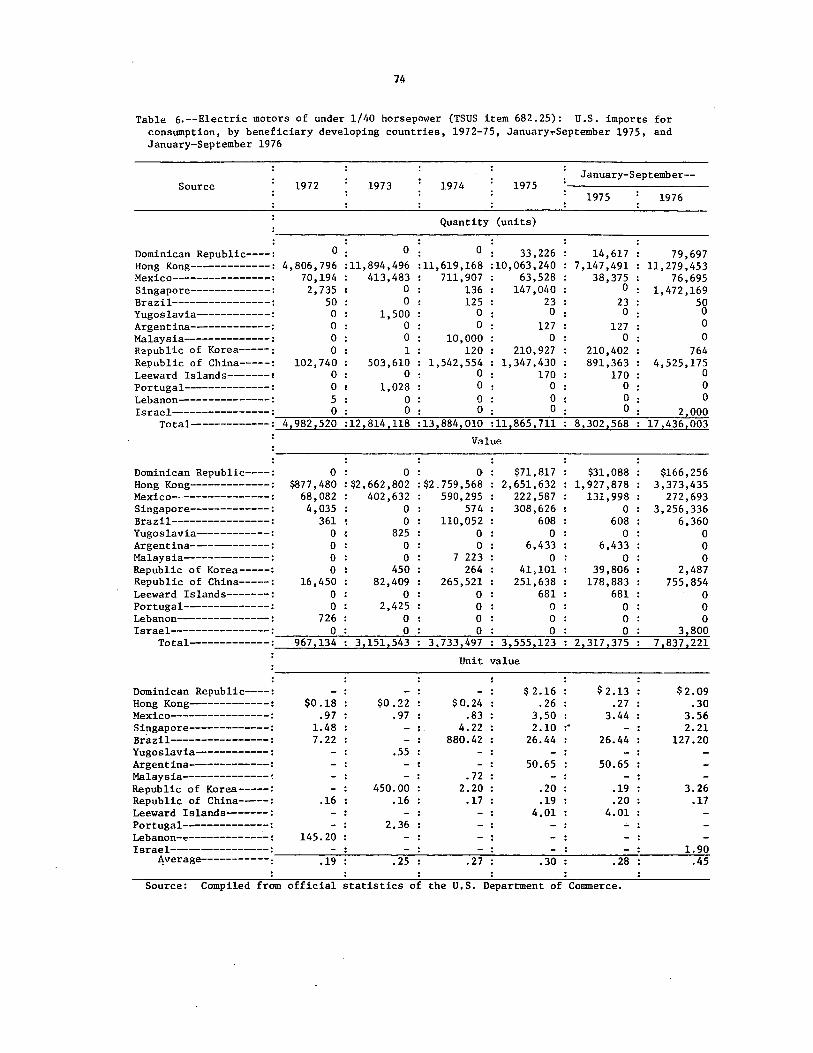
6. Electric motors of under 1/40 horsepower (TSUS item 682.25): U.S. imports for consumption, by beneficiary countries, 1972-75, January-September 1975, and JanuarySeptember 1976-------------------------------------------- 74
7. Electric motors of under 1/40 horsepower (TSUS item 682.25): U.S. imports for consumption, by types, 1972-75, JanuarySeptember 1975, and January- September 1976--------------- 75
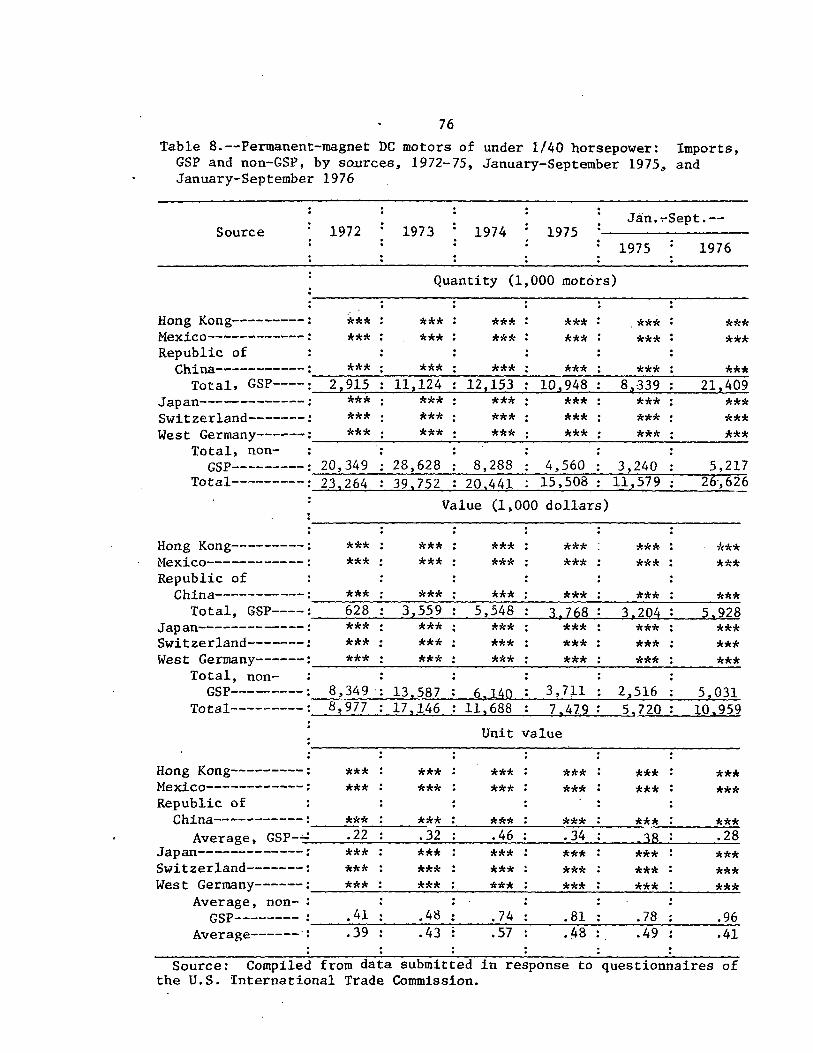
8. Permanent-magnet DC motors of under 1/40 horsepower: Imports, by sources, 1972-75, January-September 1975, and January-September 1976-------------------------------- 76
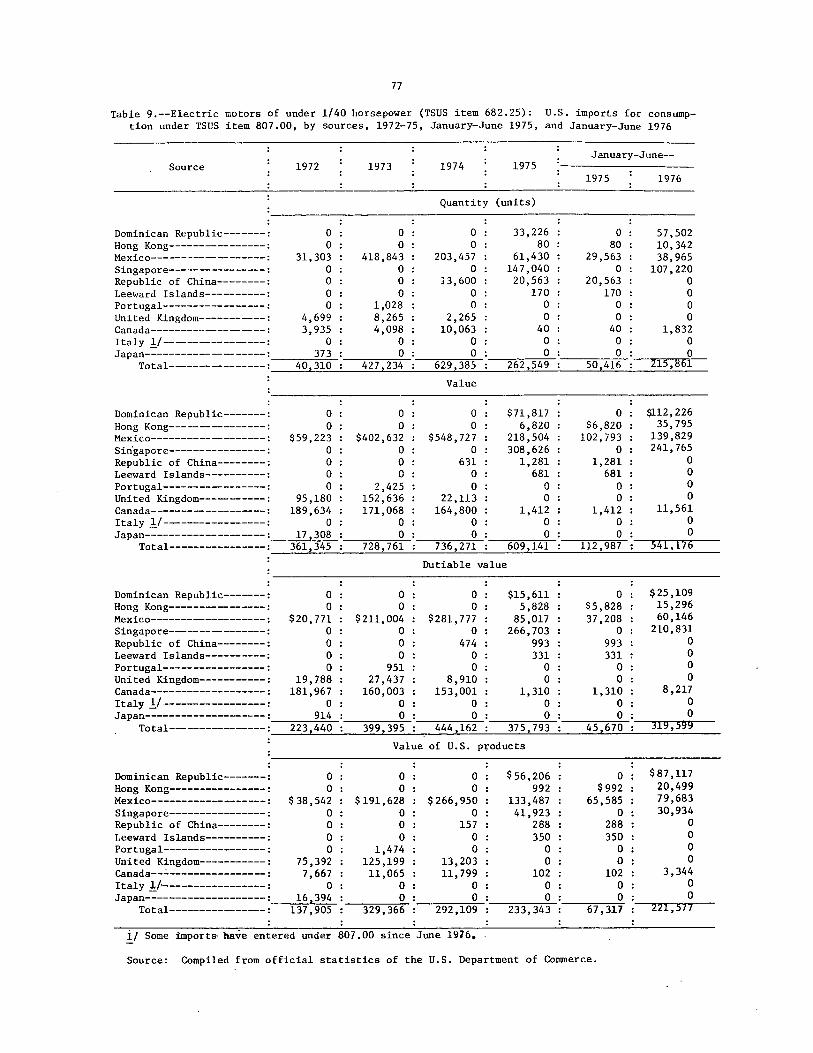
9. Electric motors of under 1/40 horsepower: (TSUS item 682.25): U.S. imports for consumption under TSUS item 807.00, by sources, 1972-75, January-June 1975, and January-June 1976----------------------------------------- 77
iv
CONTENTS
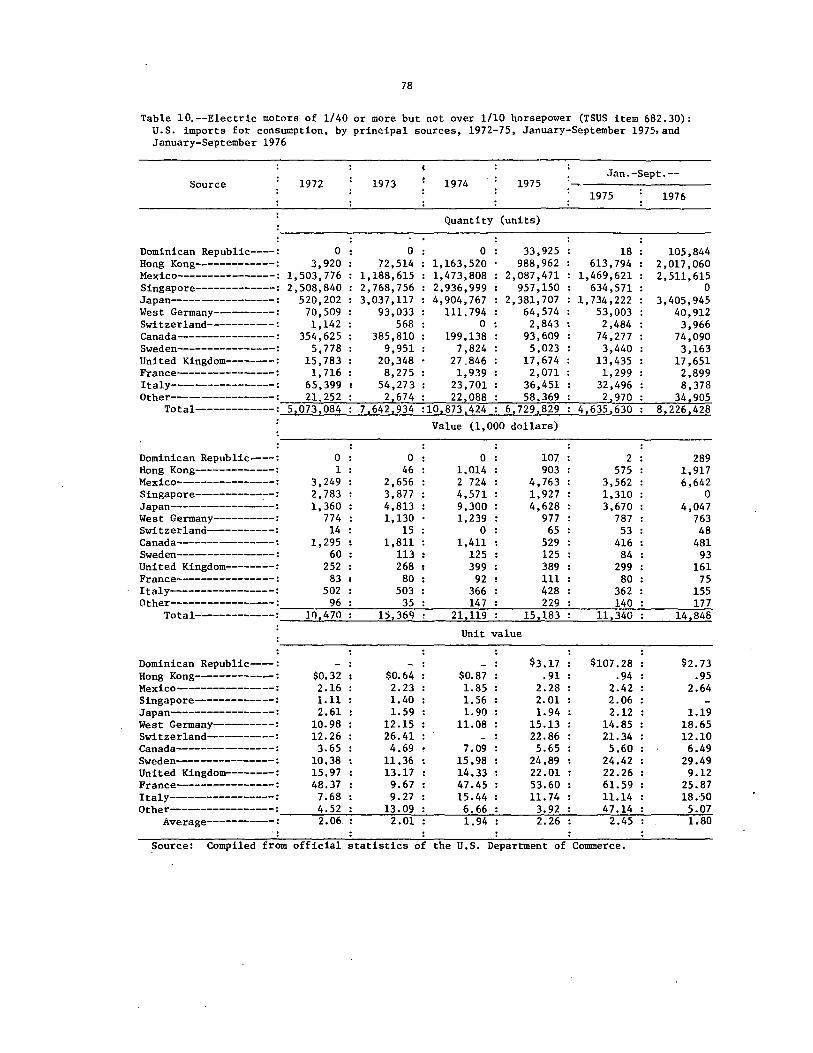
10. Electric motors of 1/40 or more but not over 1/10 horsepower (TSUS item 682.30): U.S. imports for consumption, by principal sources, 1972-75, January-September 1975, and January-September 1976~---------~---- 78
11. Electric motors·of 1/40 or more but not over 1/10 horsepower (TSUS item 682.30): U.S. imports for consumption, by beneficiary countries, 1972-75, January-September 1975, and January-September 1976--------------- 79
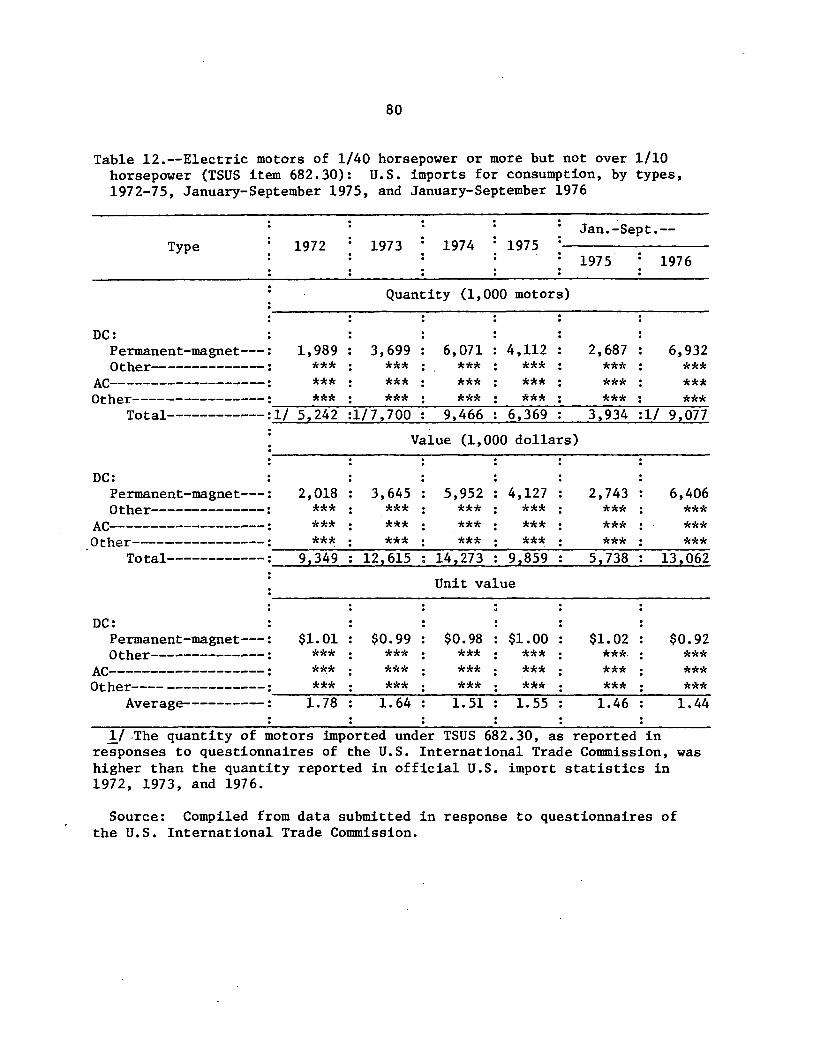
12. Electric motors of 1/40 or more.but not over 1/10 horse-power (TSUS item 682.30): U.S. imports for consumption, by type of motor, 1972-75, January-September 1975, and January-September 1976----------------------------------- 80
13. Permanent-magnet DC motors of 1/40 or more but not over 1/10 horsepower: Imports, by sources, 1972-75, JanuarySeptember 1975, and January-September 1916--------------- 81
14. Electric motors of 1/40 horsepower or more but not over 1/10 horsepower (TSUS item 682.30): U.S. imports for consumption under TSUS item 807.00, by sources, 1972-75, January-September 1975, and January-June 1976------------ 82
Note.--The whole of the Commission's report to the President may not be made public since it contains certain information that has been classified or would result in the disclosure of the operations of an individual concern. This published report is the same as the report to the President, except that the above-mentioned information has been omitted. Such omissions are indicated by asterisks.
v
REPORT TO THE PRESIDENT
To the President:
U.S. International Trade Connnission December 30, 1976
In accordance with the request contained in your letter of
September 14, 1976, the United States International Trade Connnission
reports herein the results of its investigation with respect to perma-
neut-magnet direct current motors. The pertinent portions of the text
of your letter are as follows:
In a recent executive branch review of the operation of the Generalized System of Preferences (GSP) the Trade Policy Staff Connnittee (TPSC) considered several petitions. from domestic producers to remove products from the list of articles eligible for duty-free treatment under the GSP. It was necessary to postpone a decision on some of the petitions, however, because of the absence of data on the amount of imports and domestic production or because of inadequate information on recent developments in the industry. To assist the Administration in assembling the needed information, I hereby request the Commission, pursuant to section 332(g) of the Tariff Act of 1930 to conduct investigations and report the results, as follows:
1. With respect to the petitions for the withdrawal of GSP benefits for permanent-magnet direct current motors classifiable in item numbers 682.25 and 682.30 of the Tariff Schedules of the United States (TPSC GSP case No. 76-34), an investigation and report (a) on the economic effect which the designation of those motors as articles eligible for duty-free treatment under the GSP has had on domestic producers of like or directly competitive motors; (b) the probable economic effect which withdrawal of GSP benefits would have on: (i) The domestic producers; (ii) the prospective establishment.of new or additional domestic production; and (iii) domestic producers of products that utilize or
vi
incorporate such motors; and (c) which countries, if any, would be eliminated from GSP benefits by virtue of the "competitive need" provisions of section 504(c) of the Trade Act of 1974 if items 682.25 and 682.30 were each subdivided into three new items, as follows: (i) AC motors; (ii) DC motors; and (iii) other motors.
I further request that the Commission make every effort to provide the reports as soon as possible but not later than 120 days of the receipt of this letter.
The investigation (No. 332-79(2)) was conducted by the Commission
under the authority of section 332(g) of the Tariff Act of 1930, as
amended (19 U.S.C. 1332(g)). Interested parties were afforded an
opportunity to be present, to produce evidence, and to be heard at
a public hearing. A transcript of the hearing and copies of the briefs
submitted by interested parties are attached.
The information for this report was obtained from fieldwork, ques-
tionnaires sent to domestic manufacturers and importers, the Commis-
sion's files, other Government agencies, evidence presented at the
hearings, briefs filed by interested parties, and other sources.
Introduction
On April 20, 1976, pursuant to title 15, chapter XX, part 2007,
of the Code of Federal Regulations (40 F.R. 251, Dec. 31, 1975),
International Components Corp. (ICC), Chicago, Ill., petitioned
the Trade Policy Staff Committee (TPSC) for withdrawal of permanent
magnet direct current (DC) motors of not over 1/10 horsepower as
eligible articles receiving duty-free treatment under the Generalized
System of Preferences (GSP). ICC asserted in its petition that it is
unable to establish a domestic plant in Durant, Okla., provided that
the subject articles continue to receive duty-free treatment under the
GSP. ICC further asserted that if the duty was restored, an ICC
plant to be located in Durant, Okla., could effectively compete with
foreign plants located in Mexico and Hong Kong. Permanent-magnet
DC motors of not over 1/10 horsepower are dutiable under .items 682. 25
and 682.30 of the Tariff Schedules of the United States (TSUS).
At a public hearing conducted by the TPSC on June 2, 1976,
ICC's petition was supported by Buehler Products, Inc., Kinston, N.C.,
which is both a subsidiary of a German firm and a U.S. producer of
permanent-magnet DC motors. The General Electric Co. (GE), although
not in attendance at the hearing, submitted a written statement
in support of the ICC petition, but strongly advised the TPSC of
GE's interest in the continued maintenance of alternating current (AC)
motors classified under TSUS items 682.25 and 682.30 as. eligible
articles under the GSP. The ICC petition was also supported by the
Chamber of Commerce of Durant, Okla.
1
2
After review and due consideration of the petition, members
of the TPSC concluded that they had insufficient trade data on which
they could base a reasonable determination in this matter. Permanent-
magnet DC motors are not separately provided for in the TSUS, Schedule
B, or the Standard Industrial Classification.
On September 14, 1976, the President, pursuant to section 332(g)
of the Tariff Act of 1930, as amended (19 U.S.C. 1332(g)), requested
the U.S. International Trade Connnission to conduct an investigation
to obtain the data necessary for the review by the TPSC. Specifically,
the President requested that the Connnission conduct and report the
results of the following investigation:
With respect to the petitions for the withdrawal of GSP benefits for permanent-magnet direct current motors classifiable in item numbers 682.25 and 682.30 of the Tariff Schedules of the United States (TPSC GSP case No. 76-34), an investigation and report (a) on the economic effect which the designation of these motors as articles eligible for duty-free treatment under the GSP has had on domestic producers of like or directly competitive motors; (b) the probable economic effect which withdrawal of GSP benefits would have on: (i) The domestic producers; (ii) the prospective establishment of new or additional domestic production; and (iii) domestic producers of products that utilize or incorporate such motors; and (c) which countries, if any, would be eliminated from GSP benefits by virtue of the "competitive need" provisions of section 504(c) of the Trade Act of 1974 if items 682.25 and 682.30 were each subdivided into three new items, as follows: (i) AC motors; (ii) DC motors; and (iii) other motors.
The President further requested that the Conunission provide the
subject report as soon as possibte but not later than January 12, 1977.
The Corrnnission instituted an investigation on September 21, 1976,
and notice of the institution of t"he investigation and of the public
3
hearing was issued. Copies of the notice were posted at the Com
mission's offices in Washington, D.C. and New York City and the
original notice was published in the Federal Register of September 24,
1976 (41 F.R. 187). The public hearing was held on November 16,
1976.
4
The Product
Description
An electric motor 1s an electromechanical device which converts
electrical energy into mechanical energy and is powered by either
alternating current or direct current. AC current is the type connnonly
supplied to households and factories, whereas DC current is the type
supplied by batteries or supplied on the output of a rectifying
apparatus using an AC source. Electric motors powered by AC current
are called AC motors, and those motors powered by DC current are called
DC motors. Certain electric motors, called universal motors, are
powered by either AC current or DC current.
DC motors are usually separated into two classes--permanent-magnet
DC motors and wound-field DC motors. Permanent-magnet DC motors are a
class of motors so named because the stationary field (stator) of the
motor consists of a permanent magnet. Wound-field DC motors are those
DC motors in which the stationary field is constructed from a number
of turns of magnet wire (solid copper wire with art enamel insulation).
Electric motors are most often rated in terms of horsepower or
watts (1 horsepower is equal to 746 watts). The product in the
instant case is thus a class of electric motors of not over 1/10
horsepower (74.6 watts) powered by DC current, with a stationary
field consisting of a permanent magnet.
5
Uses
Permanent-magnet DC motors are most often used in toys, automobiles
(windshield wipers and automatic door locks), cordless power tools,
electric hair dryers, and electric tooth brushes), and tape drivers.
Permanent-magnet DC motors are also being used in a number of new pro
ducts which have a large market potential, such as power-driven cookie
guns.
Manufacturing and technology
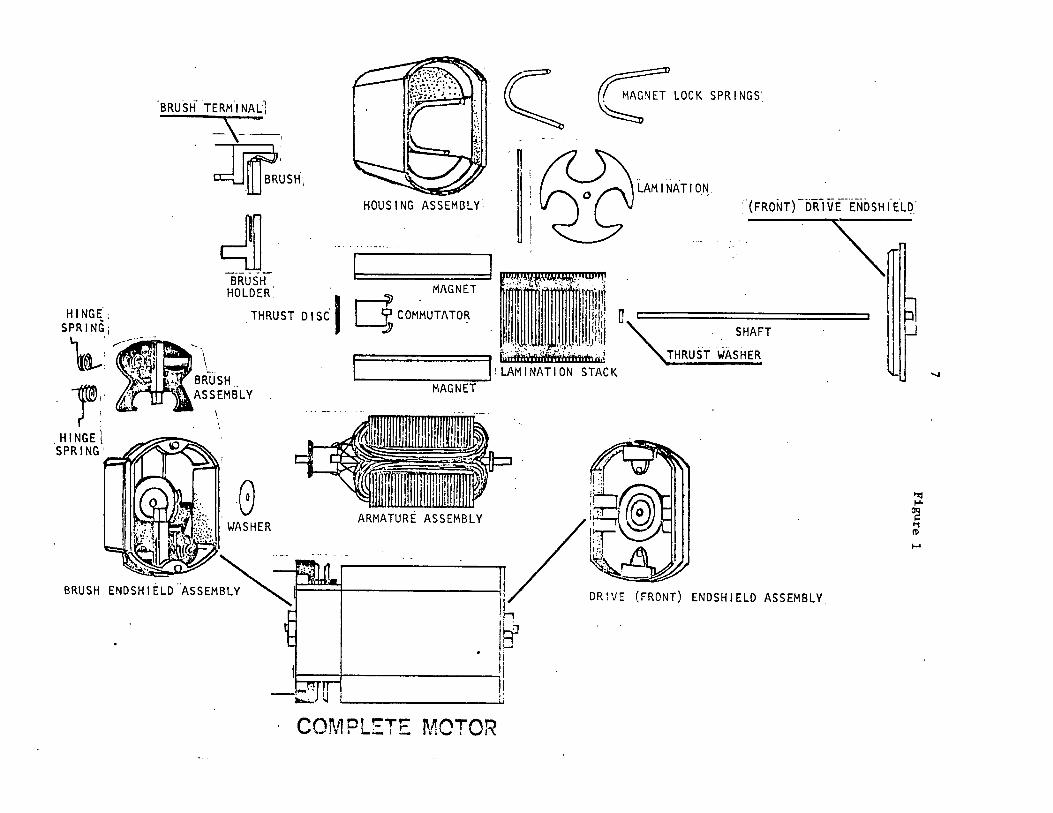
A permanent-magnet DC motor normally contains four principal sub
parts: The armature assembly, the drive (front) endshield assembly,
the brush endshield assembly, and the housing assembly (fig. l, p. 7).
The armature assembly, the most critical element of the motor, is
also the most costly and most labor-consuming subpart. The armature
assembly contains the commutator, the magnetic steel lamination
stack, and an armature field (turns of magnet wire) which is wound on
the lamination stack and soldered or welded to the commutator segments.
The armature assembly is adaptable to automation, and at least two
U.S. firms can supply equipment which, within seconds, can wind the
armature field and solder all field connections. A firm which does
not automate the production of its armature assembly is likely to have
little chance of producing at competitive prices.
6
The drive (front) endshield assembly contains the bearing plate
for one end of the armature shaft and the brush endshield assembly
contains the brush assembly and the remaining bearing plate. The
production of these subparts is not usually automated, but a number
of jigs and fixtures are required to provide for ease of assembly.
The housing assembly contains the permanent magnet and the permanent
magnet retainers, as well as provisions for mounting the endshield
and brush endshield assemblies. The production of the housing assembly
and the final assembly of the motors are not usually automated processes
but do require certain jigs and fixtures for ease of assembly.
Like or directly competitive products
A permanent-magnet DC motor is small, light in weight, and capable
of operating in battery-powered end products. Industry sources state
that there are no other like or directly competitive substitutes for
permanent-magnet DC motors. Wound-field DC motors are heavier and
larger in diameter and more costly to fabricate.
BRUSH
.BRUSl·f TERM.I NALi
-\---, ~USH
~-BRUSH , .
HOLDER .
. THRUST o 1 sc· I \
BRUSH .. /.;'f~ft. ASSEMBLY
I
'·
-~JU
HOUSING ASSEMaLY:
· COMPLE:TF MCTOR
~LOCK SPRINGS'
.. - . LAM I NAT I ON_
c I : :· (FRONT)-DRlVE{NDSH I ELq_
pom:nY.PX'tlllA!lW!•W•f!I
STACK
~ n ... r============::i
SHAFT
THRUST WASHER
ENDSHIELD ASSEMBLY
>zj
'"'" OQ I: 11 11>
.....
.....
8
U.S. Tariff Treatment
Permanent-magnet DC motors of not over 1/10 horsepower are provided
for in the TSUS under items 682.25 and 682.30 depending on horsepower
rating. Such motors of under 1/40 horsepower, item 682.25, when imported
from countries not entitled to GSP, are currently subject to duty at the
rate of 12.5 percent ad valorem. The 12.5-percent rate has been appli
cable since mid-1962 when a series of Customs Court rulings forced a
change in customs classification practice which had the effect of
reducing the duty from 25 percent ad valorem; the duty was not affected
by the Kennedy round of trade negotiations. Imports of permanent-magnet
DC motors from designated Communist countries are subject to a duty of
35 percent ad valorem.
Permanent-magnet DC motors of 1/40 or more but not over 1/10
horsepower, item 682.30, when imported from countries not entitled
to GSP are dutiable at the rate of 6 percent ad valorem; this rate
has been in effect since January 1, 1972, and represents the last of
a five~stage reduction negotiated during the Kennedy round. Imports
of such motors from designated Communist countries are dutiable at the
rate of 35 percent ad valorem.
All of the motors that are the subject of this investigation are
eligible for duty-free entry when imported from designated beneficiary
developing countries.
GSP and the "competitive need" provisions
The GSP, authorized by title V of the Trade Act of 1974, enables
products which are eligible articles and meet the conditions stipulated
9
in title V to be imported duty-free into the United States if imported
directly from a beneficiary country on or after January 1, 1976.
The "competitive need" provisions of section 504(c) of the Trade
Act provide that eligible articles will not receive duty-free treatment
if they are (1) the product of a beneficiary country which supplied
U.S. imports (of the said article) valued at $25 million 1/ or more in
the preceding year or (2) the product of a beneficiary country which in
the preceding calendar year accounted for 50 percent or more by value
of total U.S. imports of the article, unless the President has determined
that the article (or a like or directly competitive article) was not
produced in the United States on January 3, 1975.
Duty-free treatment of an eligible article does not apply when
less than 35 percent of the appraised value of the article is added in
the beneficiary developing country. In January-June 1976, imports
of electric motors of not over 1/10 horsepower continued to enter the
United States in significant quantities from certain beneficiary coun-
tries under item 807.00 rather than entering under the GSP. There
were little or no imports under TSUS item 806.30 during this period.
1/ The figure of $25 million is to be adjusted annually by a percentage whTch corresponds to the ratio of the gross national product of the United States for the preceding calendar year compared with the gross national product of the United States for 1974. The adjusted figure currently in use is $26.6 million.
10
Domestic Industry
U.S. producers
Industry sources indicate that about 30 firms in the United States
produce permanent-magnet DC motors of al~ horsepower ratings. On the
basis of responses to a Commission questionnaire and other communications
with the Commission staff, it is believed that about 30 firms produce
permanent-magnet DC motors of not over 1/10 horsepower. A number of
firms, such as * * * produce permanent-magnet DC motors exclusively
for their own use. Most domestic producers are single-establishment
firms which produce a variety of electric motors other than permanent
magnet DC motors, and some U.S. producers are also importers of
permanent-magnet DC motors.
U.S. and foreign producers of permanent-magnet DC motors generally
do not compete with one another in marketing their motors in the
United States. Foreign producers most often account for motors
incorporated in end products such as toys, cordless lawn-care tools,
hair dryers, and electric razors. Domestic producers most often
account for motors incorporated in end products such as automobiles
and special purpose end products which require a greater degree of
production precision and testing. Such applications are usually those
in which the cost of the motor is a small share of the cost of the end
product (such as computer applications, in which a motor failure is
likely to mean costly down time). Some domestic producers maintain
that the low end of the permanent-magnet DC motor business is economi
cally unattractive given the low prices offered by foreign producers.
11
The number of U.S. producers has remained fairly stable during
the period 1972-76. Rowe Industries, Inc., a large U.S. producer,
ceased production in the United States in 1974 and moved its entire
production facility to Mexico. Indiana General Division, Electronic
Memories and Magnetics Corp., moved its production of large, permanent
magnet DC motors to Mexico in 1976, but continues to produce permanent
magnet DC motors of not over 1/10 horsepower in El Paso, Texas.
***was a small producer in 1975, but indicates no U.S. production
during January-September 1976. Three U.S. firms, however, started
production during 1972-76. Buehler Products became a U.S. producer in
1974, and*** and* * * became U.S. producers in 1975.
U.S. producers are located largely in the north-central part of
the United States, principally in Ohio, Illinois, Indiana, and Wisconsin.
A large captive producer is located in the State of New York.
U.S. production
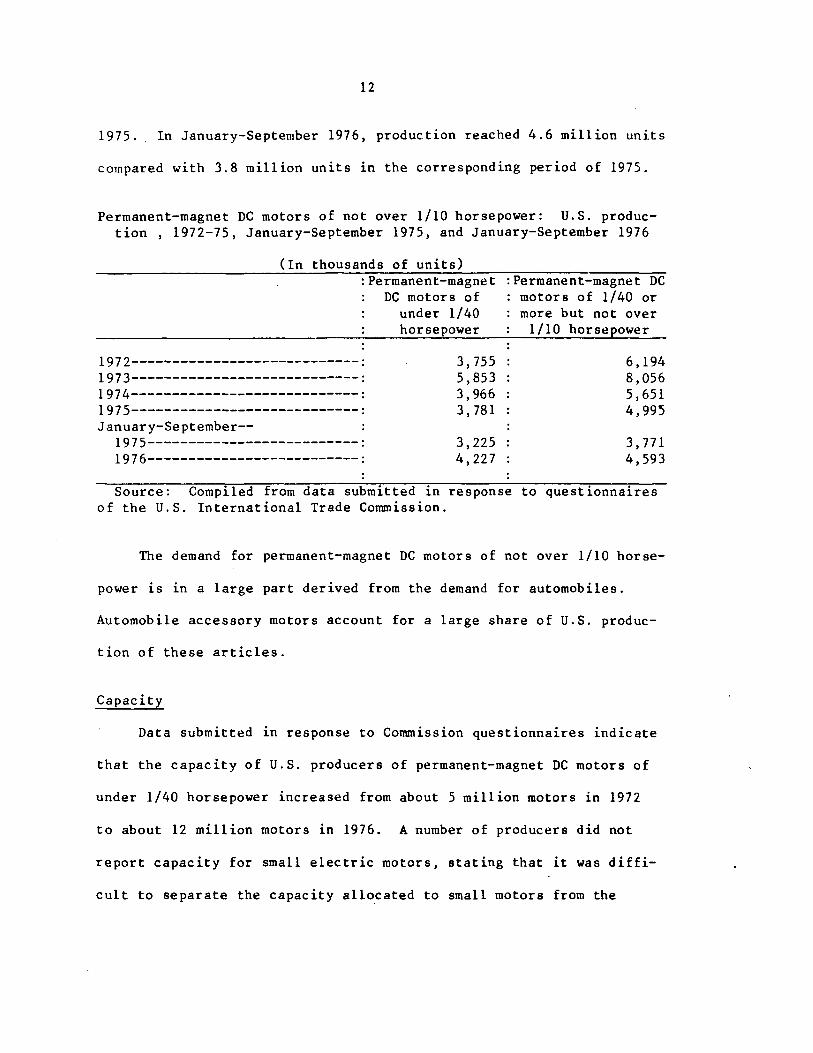
In terms of quantity, U.S. production of permanent-magnet DC motors
of under 1/40 horsepower increased from 3.8 million units in 1972 to
5.9 million units in 1973 before declining to 3.8 million units in
1975. In January-September 1976, production reached 4.2 million units
compared with 3.2 million units in the corresponding period of 1975.
U.S. production of permanent-magnet DC motors of 1/40 or more
but not over 1/10 horsepower increased from 6.2 million units in 1972
to 8.1 million units in 1973 before .declining to 5 million units in
12
1975. In January-September 1976, production reached 4.6 million units
compared with 3.8 million units in the corresponding period of 1975.
Permanent-magnet DC motors of not over 1/10 horsepower: U.S. production , 1972-75, January-September 1975, and January-September 1976
(In thousands of units) :Permanent-magnet :Permanent-magnet DC
Source: Compiled from data submitted in response to questionnaires of the U.S. International Trade Commission.
As evidenced in responses to Commission questionnaires, auto-
mobile accessory motors account for a substantial share of U.S.
producers' shipments of permanent-magnet DC motors of not over
l/lq horsepower. The data supplied in response to Commission question-
naires are supported also by official statistics of the U.S. Department
of Commerce (Current Industrial Report MA-36H) for the period 1972-75
(table 3). During the period 1972-75, automobile accessory motors,
in terms of quantity, accounted for about 82-86 percent of U.S.
producers' shipments of fractional-horsepower DC motors. DC fractional-
horsepower motors classified in MA-36H are believed to be largely
permanent-magnet DC motors. Data submitted in response to Commission
questionnaires for 1975 reveal that automobile accessory motors
account for about 38 percent of U.S. producers' shipments of permanent-
magnet DC motors of under 1/40 horsepower and account for 87 percent
of U.S. producers' shipments of permanent-magnet DC motors of 1/40 or
16
,-.;oi-l-' bi..;:: ;-,ot ov,:!r 1/10 horsepower. The value of annual production of
f·cactional-horsepower AC motors, however, is about twice the value of
annual production of fractional-horsepower DC motors (table 4).
U. S :___P._roducers' inventories
U.S. producers' inventories of permanent-magnet DC motors of
under 1/40 horsepower, in terms of quantity, increased from 487,000
units on December 31, 1972, to 1.2 million units in 1973 before
declining to 623,000 units in 1975. On September 30, 1976, inventories
totaled 944,000 units as compared with 601,000 units on the same date in
1975. During the periods under consideration, U.S. producers' inventories
inc lude<l a large number of motors which were imported from Japan
for sale both in the United States and foreign markets.
U.S. producers' inventories of permanent-magnet DC motors of 1/40
or more but not over 1/10 horsepower, in terms of quantity; increased
from 697,000 units on December 31, 1972, to 1.2 million units in 1973,
before declining to 709,000 units in 1975. On September 30, 1976,
inventories reached 718,000 units, compared with 708,000 units on the
corresponding date in 1975.
A significant number of U.S. producers of permanent-magnet DC
motors of not over 1/10 horsepower are job shoppers as opposed to
volume producers, and as such do not maintain inventories of their
products. A number of catalog items are freely offered by such pro
ducers, but these items are usually produced after the receipt of
an order and are shipped to the contracting source as soon as practicable.
17
Apparent U.S. consumption
Apparent U.S. consumption of permanent-magnet DC motors of under
1/40 horsepower increased from 25.8 million units, valued at $16.8
million, in 1972 to 43.7 million units, valued at $29.0 million, in
1973, then decreased to 17.5 million units, valued at $18.0 million, in
1975 (table 1). Consumption during January-September 1976 increased to
29.0 million units, valued at $22.l million. The fluctuations in
consumption are reflected mainly in the fluctuations in imports, which
account for approximately 90 percent of U.S. consumption by quantity.
and 50 percent by value.
Apparent U.S. consumption of permanent-magnet DC motors of 1/40 or
more but not over 1/10 horsepower increased from 8.1 million units,
valued at $41.l million, in 1972 to 11.8 million units, valued at $48.1
million, in 1974, but decreased to 8.9 million units, valued at $46.9
million, in 1975 (table 2). Consumption during January-September 1976
increased to 11.4 million units, valued at $48.3 million. Imports
accounted for 61 percent of U.S. consumption by quantity, and 13.3 by
value, during January-September 1976.
18
U.S. exports
U.S. exports of permanent-magnet DC motors of under 1/40 horsepower
rose steadily from 578,000 units, valued at $1.4 million, in 1972
to 1.2 million units, valued at $2.3 million, in 1975. During January
September 1976, exports reached 1 million units, valued at $1.9 million,
compared with 788,000 units, valued at $1.6 million, 1n the corresponding
period of 1975. A large share of these U.S. exports had previously been
imported into the United States from * * *
U.S. exports of permanent-magnet DC motors of 1/40 or more but
not over 1/10 horsepower increased from 84,000 units, valued at
$964,000, in 1972 to 136,000 units, valued at $1.6 million, in 1973,
before declining to 88,000 units, valued at $1.5 million, in 1975.
During January-September 1976, exports reached 88,000 units, valued at
$1.5 million, compared with 67,000 units, valued at $1.1 million, in the
corresponding period of 1975.
19
U.S. employment
Data on employment of production workers were compiled from U.S.
producers' responses to questionnaires of the U.S. International Trade
Connnission. Firms were requested to report the number of production and
related workers engaged in the production of (1) all products, and (2)
permanent-magnet DC motors of not over 1/10 horsepower, at the firm's
establishments where permanent-magnet DC motors of not over 1/10 horse-
power were produced.
Permanent-magnet DC motors of under 1/40 horsepower.--The numbe~
of production and related workers engaged in the production of permanent-
magnet DC motors of under 1/40 horsepower increased from 335 workers
in 1972 to 513 workers in 1973, decreased to 346 workers in 1975,
and increased again to 428 workers in January-September 1976, as shown
in the table below.
Permanent-magnet DC motors of under 1/40 horsepower: Average number of production and related workers employed in U.S. establishments, 1972-75, January-September 1975, and January-September 1976
Production and related workers engaged in the production of--
Permanent-magnet DC All products motors of under 1/40
3,204 3,834 3,321 2,601
2,519 3,208
horsepower
335 513 369 346
338 428
Source: Compiled from data submitted in response to questionnaires of the U.S. International Trade Connnission.
20
The total number of production and related workers producing
all products in those establishments where permanent-magnet DC motors
are produced is far higher than the total number of workers engaged
in the production of those motors alone. However, of the * * *
which are the largest known employers (based on responses to Commission
questionnaires) of workers producing permanent-magnet DC motors of
under 1/40 horsepower, a high percentage of their total workers (in
the same establishment) are engaged in the production of permanent
magnet DC motors of under 1/40 horsepower. * * *
Permanent-magnet DC motors of 1/40 or more but not over 1/10
horsepower.--The number of production and related workers engaged
in the production of permanent-magnet DC motors of 1/40 or more but
not over 1/10 horsepower, increased from 1,215 workers in 1972 to
1,455 workers in 1973, decreased to 970 workers in 1975, but increased
to 1,203 workers in January-September 1976, as shown in the table
on the following page.
1/ January-September 1976 data.
21
Permanent-magnet DC motors of 1/40 or more but not over 1/10 horsepower: Average number of production and related workers employed in U.S. establishments, 1972-75, January-September 1975, and January-September 1976
l 975-------------------------------: 1976-------------------------------:
Production and related workers engaged in the
production of--Permanent-magnet
All DC motors of 1/40 products or more but not
5,604 6,569 6,024 4,961
4, 967 5,031
:over 1/10 horsepower
1,215 1,455 1,167
970
968 1,203
Source: Compiled from data submitted in response to questionnaires of the U.S. International Trade Connnission.
The number of workers producing "all products" compared to those
producing only permanent-magnet DC motors of 1/40 or more but not over
1/10 horsepower is much larger.
•* * * * * * *
1 * * *
22
Other employment.--In addition to employees involved in the
production of permanent-magnet DC motors of not over 1/10 horsepower
in the United States, an indeterminate number of employees are engaged
in the production of end products (hair dryers, toys, and so forth)
which utilize such motors. There are indications that if GSP were
withdrawn on TSUS items 682.25 and 682.30, some of these end products
would be produced abroad rather than in the United States, with a
resulting loss of employment in the United States. One company
* * * feels that the withdrawal of GSP on TSUS items 682.25 and 682.JO
would likely jeopardize the jobs of up to 200 of its employees who are
presently engaged in the production of * * * Another company (the
* * *, indicated that ". the slightly lower price this year has
helped us develop a new item which we can wholesale in the neighborhood
of $4.00 each ... the lower duty has.
70 more people than we had last year."
.provided jobs for approximately
Adjustment assistance.--There have been three worker adjustment
assistance cases for fractional-horsepower motors under the Trade Act
of 1974. On September 22, 1975, adjustment assistance benefits were
·denied to workers producing automobile accessory motors at General
Motors Corp. in Rochester, New York. On October 29, 1975, adjustment
assistance benefits were denied to workers producing AC motors at
the Alliance Manufacturing Co. in Shenandoah, Virginia. However, on
September 27, 1976, 28 workers were certified as eligible for adjust
ment assistance at the Indiana General Division of Electronic Memories
and Magnetic Corp.
23
Man-hours
Man-hours worked by production and related workers engaged in
the production of permanent-magnet DC motors of not over 1/10 horse-
power are shown in the table below.
Permanent-magnet DC motors of not over 1/10 horsepower: Man-hours worked by production and related workers, 1972-75, JanuarySeptember 1975, and January-September 1976
Period
(In thousands of m.an-hour s) :Man-hours worked by production and
related workers in the production of--
:Permanent magnet Permanent magnet : DC motors of
:DC motors of under: 1/40 or more 1/40 horsepower but not over
Source: Compiled from data submitted in response to questionnaires of the U.S. International Trade Commission.
24
Profit-and-loss experience of domestic producers
The financial information was compiled from data submitted by
eight domestic producers of permanent-magnet DC motors of not over
1/10 horsepower. The producers were requested to submit data for the
period 1972-75 and January-September 1976. Only four producers
supplied data for January-September 1976; one producer supplied data
on permanent-magnet DC motors of under 1/40 horsepower, and three
producers supplied data on permanent-magnet DC motors of 1/40 or more
but not over 1/10 horsepower. The data supplied by the one producer of
permanent-magnet DC motors of 1/40 horsepower were not used in the table
on the following page. It is not known whether the producer is represen
tative of the industry.
25
Profit-and-loss experience of 5 domestic producers of permanentmagnet DC motors of under 1/40 horsepower, 1972-75 and JanuarySeptember 1976 1./
* * * * * * *
26
Producers of motors under 1/40 horsepower.--Five producers sub
mitted data for all periods under consideration. Only three producers
operated the full 4 years, and two started production after 1972,
one in 1974, and one in 1975. Considering the change in the number
of producers from year to year, the trend in sales and profits may
not be meaningful. Sales by these firms fluctuated between $4.2
million in 1972 and $7.0 million in 1975. Sales were $5.3 million
for three producers supplying data for January-September 1976. The
producers, in the aggregate, had net operating profits for 1972
and 1973 and losses in 1974 and 1975. The data for January-September
1976 showed a small profit (see table on page 25).
Producers of motors of 1/40 or more but not over 1/10 horse
power .--Only three producers of the above described motors submitted
usable profit-and-loss data for the 4 years. In total, the indus
try showed a profit in each year, although one company, * * *, had
losses in 3 of the 4 years. Sales rose sharply in 1973 by about
$7 million, declined by about $2.5 million in 1974, and remained
approximately the same in 1975. The ratio of net profit to net
sales remained steady during the period with a high of 12.7 per
cent in 1973 and a low of 9.4 percent in 1974. The dollar value
of profits amounted to $4.5 million in 1972, $6.1 million in 1973,
$4.3 million in 1974, and $4.8 million in 1975. Data for the one
company submitting 9-month data were not shown. Figures on profit
and-loss history for the group are shown in the following table.
27
Profit-and-loss experience of 3 domestic producers of permanent-magnet DC motors of 1/40 horsepower or more but not over 1/10 horsepower~ 1972-75
* * * * * * *
28
Representations by Interested Parties
Representations were made by interested parties at various stages
of the Commission's investigation. Firms responding to the producers'
questionnaire were asked to comment on the reasons underlying changes
between 1975 and 1976. Three firms (two of these firms were also
represented at the public hearing) urged the Commission to recommend to
the TPSC that duty-free treatment of _permanent-magnet DC motors of not
·over 1/10 horsepower be withdrawn. The three firms cited increased com
petitive pressures from producers in beneficiary countries. One of the
three firms strongly urged the Commission to recommend that AC motors
of under 1/40 horsepower be removed from the list of eligible articles
under the GSP. The firm expressed alarm over a recent loss of annual
production of about 500,000 AC motors for aquarium pumps to a Hong Kong
firm.
Eleven firms reported that they were either in the production of
high-quality, low-volume motors which required close liaison with the
end user, or they were in production of motors to be incorporated in
their own end products. Each of these eleven firms felt that the
duty-free treatment of permanent-magnet DC motors of not over 1/10
horsepower has had little effect on its markets. Five firms reported
that they produced automobile accessory motors or motors to be incor
porated in computers. These five firms reported that Japanese firms
are their major foreign competitors, and that changes in the levels
of small-motor production often resulted from chang~s in levels of
automobile production. One firm reported that production of motors
29
declined when the industrial customer which {t served ceased to produce
the end product. Presentations were made at the public hearing by a
former producer of permanent-magnet DC motors of not over 1/10 horse
power who favored withdrawal of duty-free treatm2n~ of these arti~!23
under the GSP.
A large number of U.S. toy producers (the largest U.S. toy producer
appeared at the public hearing) submitted written statements to the
Commission strongly urging the Commission to recommend to the TPSC that
permanent-magnet DC motors be retained as eligible articles under tve
GSP. The toy producers claimed that there are no U.S. producers of
motors for toys, and that a withdrawal of duty-free treatment would
only serve to increase the cost of toys and likely reduce sales and
employment 1n the toy industry. U.S. producers of such end products
as hair dryers, bilge pumps, defoggers, and refrigerators for
recreational vehicles also submitted statements requesting the main
tenance of permanent-magnet DC motors as eligible articles under the
GSP. These end-product producers cited the need for the GSP to com
pete with foreign producers in their end-product markets. A representa
tive of India submitted a statement requesting the continued maintenance
of small electric motors as eligible articles under the GSP because
India is attempting to establish a small-electric-motor industry,
and the continued eligibility of permanent-magnet DC motors is
necessary for India to compete in U.S. markets.
30
Foreign Industry
Activities by U.S. and Japanese multinational firms account
for a large share of the value of U.S. imports of electric motors
of not over 1/10 horsepower from beneficiary countries. Permanent
magnet DC motors are supplied by Japanese firms located in Hong Kong
and the Republic of China, and AC motors and wound-field DC motors
are supplied by U.S. firms located in· Singapore, the Dominican
Republic, and Mexico. Japanese firms located in Japan are large
suppliers of permanent-magnet DC motors.
Japan
* * * * * * *
31
Hong Kong
* * * * * * *
Singapore
* * * * * * *
Republic of China
* * *· * * * *
Dominican Republic
* * * * * * *
32
Mexico
* * * * * * *
Other countries
Other countries that supply U.S. imports under TSUS items
682.25 and 682.30 are primarily developed countries (not eligible
for GSP) such as West Germany, Switzerland, and the United Kingdom.
Foreign car producers and foreign business machine producers account
for a large share of the value of U.S. imports from these sources.
33
U.S. Imports of Electric Motors of Under 1/40 Horsepower
Total U.S. imports of electric motors of under 1/40 horsepower,
classified under item 682.25 (all types--AC, DC, and other), increased
from 27.8 million units, valued at $16.8 million, in 1972 to 33.8
million units, valued at $25.0 million, in 1973 before declining
to 19.7 million units, valued at $19.5 million, in 1975 (table 5).
During January-September 1976, imports reached 27.3 million units,
valued at $22.3 million, compared with 14.2 million units, valued at
$14.7 million, in the corresponding period of 1975.
Japan was the principal source of imports, by quantity, between
1972 and 1974. Hong Kong was the principal source, by quantity, in
1975 and January-September 1976. In terms of value, Japan was the
principal source throughout the 1972-September 1976 period.
U.S. imports from beneficiary countries
U.S. imports from beneficiary countries under item 682.25
(table 6) increased from 5.0 million units, valued at $1.0 million, in
1972 to 13.9 million units, valued at $3.7 million, in 1974 before
d~clining to 11.9 million units, valued at $3.6 million, in 1975.
During January-September 1976, imports reached 17.4 million units,
valued at $7.8 million, compared with 8.3 million units, valued at $2.3
million, in the corresponding period of 1975.
Hong Kong has been the principal source, both by quantity and by
value, of U.S. imports from beneficiary developing countries during
the 1972-September 1976 period. Singapore and- the Republic of China
are also major sources of imports, especially in 1976.
34
During the 1972-75 period (prior to GSP), imports from countries
subsequently designated as beneficiary countries increased by 6.9
million units, while imports from all other countries decreased by
14.9 million units. During January-September 1976 (since the GSP has
gone into effect), imports from beneficiary developing countries
increased by 9.1 million units over the corresponding period in 1975,
while imports from all other countries increased by 3.9 million units.
It is apparent that in recent years there has been a substantial shift
in imports of motors under 1/40 horsepower in favor of beneficiary •
developing countries. This shift is due to (1) the displacement of
Japanese production by Japanese companies setting up production
facilities in Hong Kong and the Republic of China, and (2) the estab
lishment of independent facilities in Hong Kong. The effect of GSP
on this shift is unclear at the present time.
U.S. imports of permanent-magnet DC motors
Permanent-magnet DC motors have accounted for most of the imports
of electric motors of under 1/40 horsepower, both by quantity and by
value, during the 1972-September 1976 period (table 7). U.S. imports
of permanent-magnet DC motors increased from 23.3 million units, valued
at $9.0 million, in 1972 to 39.8 million units, valued at $17.1
million, in 1973 before declining to 15.5 million units, valued at $7.5
million, in 1975. During January-September 1976, such imports increased
substantially to 26.6 million units, valued at $11.0 million, compared
with only 11.6 million units, valued at $5.7 million, in the correspond
ing period of 1975.
35
Japan was the principal source of U.S. imports of permanent-
magnet DC motors of under 1/40 horsepower in 1972 and 1973. Hong
Kong has been the principal supplier by quantity since 1974, and by
both quantity and value in January-September 1975 and January-September
1976.
U.S. imports of permanent-magnet DC motors from beneficiary countries
U.S. imports of permanent-magnet" DC motors of under 1/40
horsepower from beneficiary countries increased from 2.9 million
units in 1972 to 12.2 million units in 1974 before declining to
10.9 million units in 1975 (table 8). During January-September 1976,
imports from beneficiary countries increased substantially to 21.4
million units compared with 8.3 million units in the corresponding
period of 1975.
Hong Kong has been the principal source of imports, both by
quantity and by value, throughout the 1972-September 1976 period.
However, imports from the Republic of China increased substantially
in 1976.
During the 1972-75 period, imports of permanent-magnet DC motors
from beneficiary countries incr.eased by 8. 0 mil lion units, while
imports from all other countries decreased by 15.8 million units.
During the January-September 1976 period, imports from beneficiary
countries increased by 13.1 million units, while imports from all
other countries increased by 2.0 million units. The principal
reason for the shift in imports in favor of beneficiary developing
36
countries has been the displacement of Japanese production by Japanese
companies and other companies setting up production facilities in Hong
Kong and the Republic of China. The effect of the GSP on this dis-
placement is unclear.
The ratio of imports to consumption
For permanent-magnet DC motors of under 1/40 horsepower the
ratio of imports to consumption by value is substantially lower than
the ratio of imports to consumption by quantity, as indicated in the
table below.
Permanent-magnet DC motors of under 1/40 horsepower: Ratio of imports to apparent consumption, 1972-75, January-September 1975, and January-September 1976
(In percent) : Ratio of total Katiooti.mport-s---from- . :imports to apparent:GSP-eligible countries
Source: Compiled from data submitted in response to questionnaires of the U.S. International Trade Commission.
41
When the table on the previous page is compared with a similar
table for U.S. producers' shipments (see page 14), it is apparent that
a far greater proportion of the imported motors are used in the
manufacture of toys, games, and novelties, while a smaller proportion
of imported motors are used in automotive accessories.
The toy, game, and novelty market is by far the major.end user for
permanent-magnet DC motors of less than 1/40 horsepower. Nearly all of
the motors used in the manufacture of toys, games, and novelties are
low-priced motors from Hong Kong and Republic of China. The second
largest end use is in personal-care equipment; * * * supplies most of
these motors, and the* **began to supply them 1n 1976. * * * share
of the personal-care-equipment motors is apparently decreasing. The
third largest end use, in automotive accessories, is mainly supplied by
Japan; nearly all of the motors entering from Japan are produced by
* * * * * * *
42
U.S. Imports of Electric Motors of 1/40 or More but Not Over 1/10 Horsepower
Total U.S. imports of electric motors of 1/40 or more but not
over 1/10 horsepower (TSUS item 682.30) increased from 5.1 million
units, valued at $10.5 million, in 1972 to 10.9 million units,
valued at $21.1 million, in 1974 before declining to 6.7 million
units, valued at $15.2 million, in 1975 (table 10). During January-
September 1976, imports reached 8.2 million units, valued at $14.8
million, compared with 4.6 million units, valued at $11.3 million, in
the corresponding period of 1975.
Japan has been the principal source of imports by quantity every
year since 1973. In terms of value, Japan was the principal source
in 1973 and 1974, while Mexico was the principal source in 1975 and
January-September 1976.
U.S. imports from beneficiary countries
U.S. imports from beneficiary developing countries (table 11)
increased irregularly from 4.0 million units, valued at $6.0 million,
in 1972 to 5.6 million units, valued at $8.3 million, in 1974 before
declining to 4.1 million units, valued at $7. 7 million, in 1975. During
January-September 1976, imports reached 4.7 million units, valued at
$8.9 million, compared with 2.7 million units, valued at $5.5 million, in
the corresponding period of 1975.
Mexico and Singapore were the principal sources of ~.S. imports
from beneficiary countries between 1972 and 1975. During January-
September 1976, there were no imports from Singapore owing to a change
43
1n customs classification. * * * Mexico remained the principal
supplier during January-September 1976, although imports from Hong
Kong increased substantially.
During the 1972-75 period, imports from beneficiary countries
increased by only 40,000 units, while imports from all other countries
increased by 1.6 million units. During January-September 1976, imports
from beneficiary developing countries increased by 1.9 million units
over the corresponding period in 1975, while imports from all other
countries increased by 1.6 million units. Contrary to the situation
which has occurred in imports under TSUS item 682.25, under item
682.30 there has been little or no displacement of developed-country
imports by the beneficiary developing countries. Evidently, Japanese
firms have not moved production facilities offshore (to any large
extent) for this type of motor.
U.S. imports of permanent-magnet DC motors
Permanent-magnet DC motors have accounted for most of the motors
imported under TSUS item 682.30 by quantity, although not by value,
between 1972 and 1976 (table 12). U.S. imports of permanent-magnet DC
motors increased from 2.0 million units, valued at $2.0 million, in
1972 to 6.1 million units, valued at $6.0 million, in 1974 before
decreasing in 1975 to 4.1 million units, valued at $4.1 million.
During January-September 1976, imports increased substantially, rising
to 6.9 million units, valued at $6.4 million, compared with only 2.7
44
million units, valued at $2. 7 million, in the corresponding period of
1975. Japan was the principal supplier throughout the 1972-September
1976 period.
U.S. imports of permanent-magnet DC motors from beneficiary countries
U.S. imports of permanent-magnet DC motors from bene.ficiary develop-
ing countries under TSUS item 682.30 increased from 199,000 units, valued
at $150,000, in 1972 to 2. 7 million units, valued at $2.0 million, in 1974
before declining to 2.1 million units, valued at $1.6 million, in 1975
(table 13). During January-September 1976, imports from beneficiary
countries increased to 3.1 million units, valued at $2.3 million, com-
pared with 1.2 million units, valued at $0.8 million, in the correspond-
ing period of 1975.
Hong Kong and Mexico have been the principal sources of imports
throughout the 1972-September 1976 period. There are no known imports
from the Republic of China under TSUS item 682.30, in contrast to the
substantial amounts imported from that source under TSUS item 682.25.
During the 1972-75 period, imports of permanent-magnet DC motors
from beneficiary countries increased by 1.9 million units, while imports
from all other countries increased by 0.2 million units. During the
January-September 1976 period, imports from beneficiary developing
countries increased by 2.0 million units, while imports from all other
countries increased by 2.3 million units. There has been little, if
any, displacement of "other country" imports by imports of permanent-
magnet DC motors from beneficiary countries under TSUS item 682.30.
45
The ratio of imports to apparent consumption
For permanent-magnet DC motors of 1/40 or more but not over
1/10 horsepower, the ratio of imports to consumption by value is sub-
stantially lower than the ratio by quantity, as shown in the tabulation
below.
Permanent-magnet DC motors of 1/40 or more but not over 1/10 horsepower: Ratio of imports to apparent consumption, 1972-75, January-September 1975, and January-September 1976
Source: Compiled from data submitted in response to questionnaires of the U.S. International Trade Commission.
u.s·. imports of electric motors under TSUS 807.00
U.S. imports of electric motors of 1/40 or more but not over 1/10
horsepower under TSUS item 807.00, dutiable under TSUS item 682.30
(table 14), increased from 4.0 million units, valued at $6.5 million,
in 1972 to 4.5 million units, valued at $7.5 million, in 1974 before
declining to 3.1 million units, valu~d at $6.9 million, in 1975.
During January-June 1976, imports reached 1.4 million units, valued
46
at $4.5 million, compared with 1.2 million units, valued at $3.1
million, in the corresponding period of 1975. Mexico and Singapore
were principal sources of U.S. imports between 1972 and 1975 and
Mexico was by far the principal source in January-June 1976.
Dutiable value increased from $4.0 million in 1972 to $5.4 million
in 1974 and then decreased to $3.9 million in 1975. During January-
June 1976, dutiable value reached $1.9 million compared with $1.8 million
in the corresponding period of 1975. ·The value of U.S. products decreased
from $2.5 million in 1972 to $2.2 million in 1974 and then increased.to
$3.0 million in 1975. During January-June 1976, the value of U.S. pro
ducts reached $2.6 million compared with $1.3 million in the correspond
ing period of 1975. Imports under TSUS item 806.30 are minimal.
Importers
Ten firms are known to have imported permanent-magnet DC motors
under TSUS item 682.30 in the period 1972-September 1976. The four
largest, ranked according to 1976 imports, by quantity, are:
* * * * * * *
47
Importers' inventories
Importers' inventories of permanent-magnet DC motors imported
under TSUS 682.30 increased from 0.3 million units on December 31,
1972, to nearly 0.9 million units on December 31, 1974, then declined
to 0.4 million units on December 31, 1975. Inventories on September 30,
1976, had increased to nearly 1.0 million units. Hong Kong and Japan
are the major sources of imported motors held in inventory, as shown
in the table below.
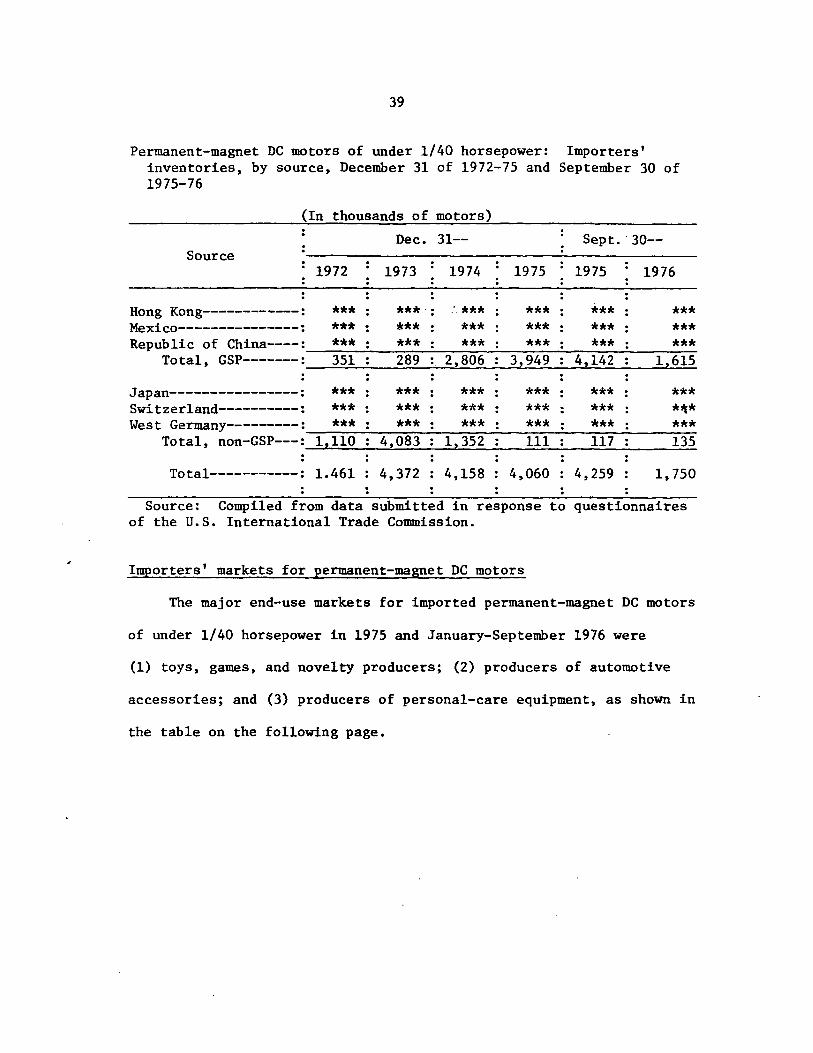
Permanent-magnet DC motors of 1/40 or more but not over 1/10 horsepower: Importers' inventories, by sources, Dec. 31 of 1972-75 and Sept. 30 of 1975 and 1976
--------Source: Compiled from data submitted in response to questionnaires of
the U~S. International Trade Commission.
Importers' markets for permanent-magnet DC motors
The two major end-uses for permanent-magnet DC motors imported under
TSUS item 682.30 are in (1) lawn-care equipment and (2) hair dryers, as
shown in the following table.
48
Permanent-magnet DC motors of 1/40 or more but not over 1/10 horsepower: U.S. imports for consumption, by end use and by principal sources, 1975 and January-September 1976
(In thousands of motors) . . End use :Hong Kong: Mexico Japan Total . .
Lawn care equipment: 19 7 5-----------------·--------: 1976 (January-September)-----:
Source: Compiled from data submitted in response to questionnaires of the U.S. International Trade Commission.
49
When the preceding table is compared with a similar table for U.S. pro
ducers' markets (p. 15), it is apparent that a far greater proportion
of imported motors are used in the manufacture of lawn-care equipment,
while only a few imported motors are used for automobile accessories.
The major sources of permanent-magnet DC motors imported for use
in lawn-care equipment are * * * and * * * Usage of imported
motors for lawn-care equipment increased for both countries in 1976.
In the hair-dryer market, usage of motors from*** increased in
1976, while usage of motors from * * * decreased.
50
Prices
Permanent-magnet DC motors of under 1/40 horsepower
Prices of both domestic and imported permanent-magnet DC motors
vary substantially, depending on the size, type, and quality of a
motor. The lowest priced permanent-magnet DC motors of under 1/40
horsepower are sold at about 16 cents per motor (delivered price);
these are imported motors used in toys. On the other hand, some of the
most sophisticated, precision motors are priced at $50.00 or more per
motor; such motors are most often produced by domestic firms.
Listed on the following page are lowest net wholesale prices
f.o.b. point of shipment in the United States of U.S. producers,
importers from beneficiary countries, and importers from Japan. All
prices are net selling prices, as reported on questionnaires returned
to the U.S. International Trade Commission. Prices shown do not
reflect "prices" (internal costs) at which U.S. captive producers
produce their motors.
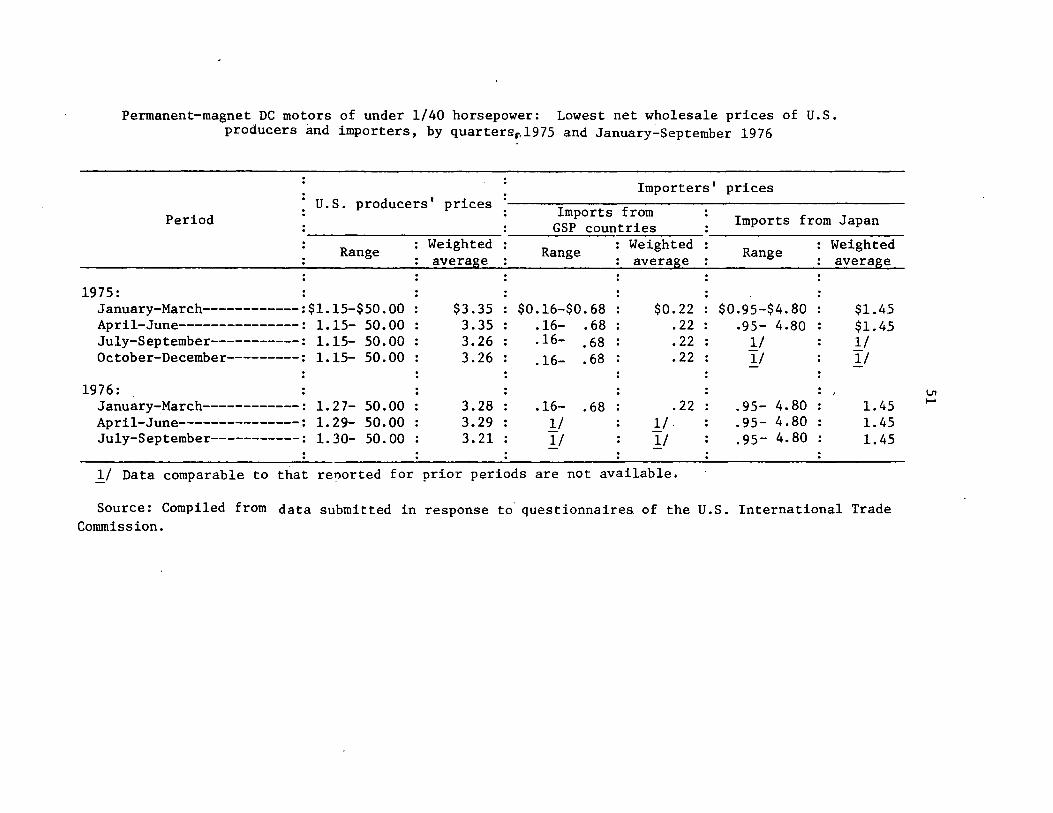
Permanent-magnet DC motors of under 1/40 horsepower: Lowest net wholesale prices of U.S. producers and importers, by quartersr-1975 and January~September 1976
Importers' prices U.S. producers' prices
Period Imports from GSP countries Imports from Japan
J./ Data comparable to that renorted for prior periods are not available.
Source: Compiled from data submitted in response to. questionnaires of the U.S. International Trade Commission.
\JI 1--'
52
Price ranges shown demonstrate the wide price variations which occur in
permanent-magnet DC motors of under 1/40 horsepower. The price range of
domestically produced motors is the widest--from $1.15 to $50.00 (it
is reported that some domestic motors sell for as little as $0.75, but
price data received on questionnaires from U.S. producers did not sub-
stantiate this). The price range of motors imported from beneficiary
countries is by far the narrowest. The average price charged by domestic
producers is approximately $3. 21, the· average price of imports from
beneficiary countries is about $0.22, and the average price of imports . from Japan .is about $1.02.
Price ranges by end-product usage are more useful than average
overall prices in determining the actual head-to-head price competition
between domestic producers and importers. However, domestically produced
and foreign-produced permanent-magnet DC motors of under 1/40 horsepower
do not compete for most end-product uses. Prices of U.S. producers and
importers from GSP countries for permanent-magnet DC motors of under 1/40
horsepower, by selected end uses, are as follows:
End use
U.S. producers: Hair dryer-----------------------------Electr ic toothbrush-------------------Electric shaver------------------------Calculator-----------------------------Automobile tape deck------------------
lmporters from GSP countries: Toys----------------------------------Hair dryers----------------------------
Price 1/
*** *** *** *** ***
*** ***
1/ Prices are lowest net wholesale prices for July-September 1976.
53
Permanent-magnet DC motors of 1/40 or more but not over 1/10 horsepower
There is also considerable price variation for permanent-magnet
DC motors of 1/40 or more but not over 1/10 horsepower, depending on
the size, type, and quality of the motor. The lowest priced permanent-
magnet DC motors of 1/40 or more but not over 1/10 horsepower were for
the July-September 1976 period, sold at 72 cents per motor (delivered
price); these motors are imported from*** for use in*** On
the other hand, some of the most sophisticated, precision motors
(domestically produced) are priced at $60.00 or more per motor.
Listed on the following page are lowest net wholesale prices
f.o.b. point of shipment in the United States of U.S. producers,
importers from beneficiary developing countries, and importers from
Japan. All prices are net selling prices, as reported on questionnaires
returned to the U.S. International Trade Commission. Prices do not
reflect "prices" (internal costs) at which U.S. captive producers pro-
duce their motors.
Permanent-magnet DC motors of 1/40 or more but not over 1/10 horsepower: Lowest net wholesale prices of U.S. producers and importers, by quarters, 1975 and January-September 1976
];./ Data comparable to that reported for prior periods are not available.
Source: Compiled from data submitted in response to questionnaires of the U.S. International Trade Commission.
V1 ..,.
55
The price range of domestically produced motors is by far the
widest, with prices in 1976 from $0.90 to $60.00 per motor.
The price range of motors imported from beneficiary countries is the
narrowest. The average price charged by domestic producers was $8.96
during the April-June 1976 period, the average price of imported
motors from beneficiary countries was $1.02 per motor, and the average
price of imported motors from Japan was $1.14 per motor.
56
Prices of U.S. producers and importers from GSP countries for
permanent-magnet DC motors of 1/40 or more but not over 1/10 horsepower,
by selected end uses, are as follows:
End-use
U.S. producers: Automobile windshield washer--------------Hedge trimmer-----------------------------Automotive accessory-----------------------
Importers from GSP countries: . Hair dryer---------------------------------Lawn-care equipment------------------------
Price 1/
*** 2/ ***
***
3/ *** ***
1/ Prices are lowest net wholesale prices for July-September 1976, unless indicated otherwise.
2/ Manufacturing cost. 3/ Delivered price.
Price effects of the GSP
Three major importers of permanent-magnet DC motors of not over
1/10 horsepower from GSP countries are reported to have reduced their
prices since the GSP became effective. Johnson Electric Industries,
a major importer from Hong Kong, reduced its prices on some motors
by the amount of the duty. * * *
57
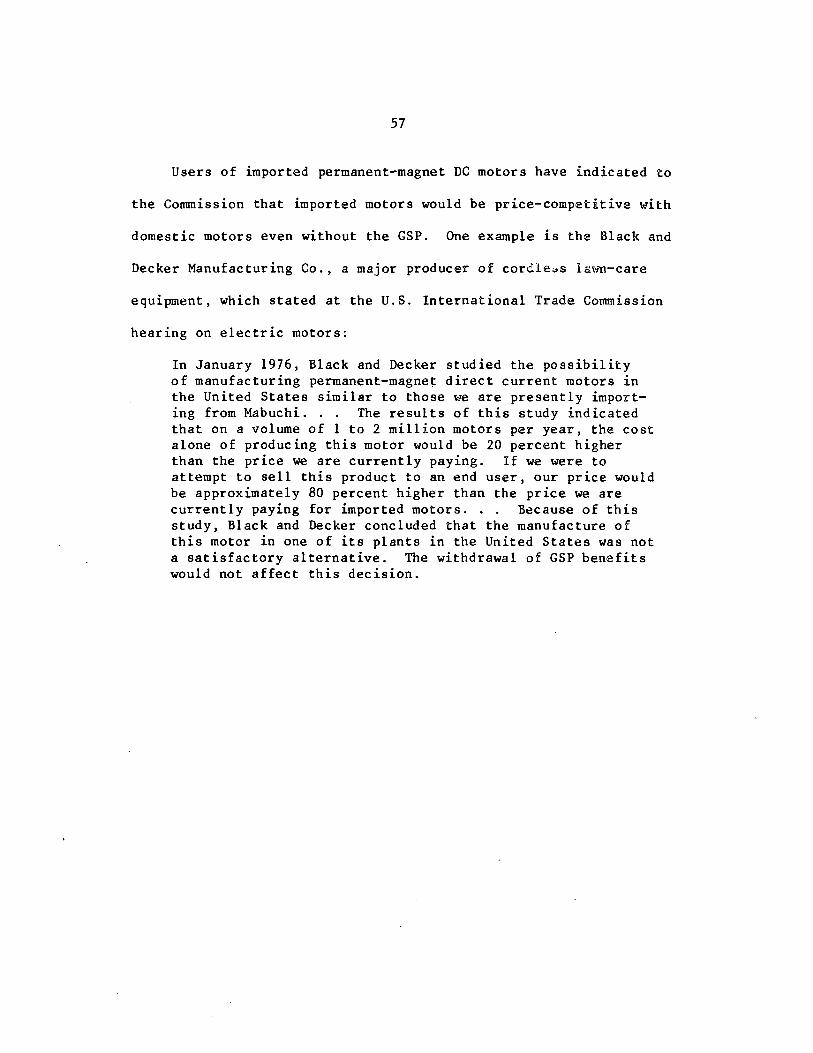
Users of imported permanent-magnet DC motors have indicated to
the Commission that imported motors would be price-competitive with
domestic motors even without the GSP. One example is the Black and
Decker Manufacturing Co., a major producer of corcleos la~-n-care
equipment, which stated at the U.S. International Trade Commission
hearing on electric motors:
In January 1976, Black and Decker studied the possibility of manufacturing permanent-magne~ direct current motors in the United States similar to those we are presently importing from Mabuchi. . . The results of this study indicated that on a volume of 1 to 2 million motors per year, the cost alone of producing this motor would be 20 percent higher than the price we are currently paying. If we were to attempt to sell this product to an end user, our price would be approximately 80 percent higher than the price we are currently paying for imported motors. . . Because of this study, Black and Decker concluded that the manufacture of this motor in one of its plants in the United States was not a satisfactory alternative. The withdrawal of GSP benefits would not affect this decision.
A-58 through A-63
* * * * * * *
64
Effects on GSP Benefits by Virtue of the Competitive-Need Provisions of Section S04(c)
Under the competitive need provisions of section S04(c) of the
Trade Act of 1974, an eligible article is afforded duty-free treatment
if the value of such articles from the beneficiary country is less
than $2S million 1/ when supplied by a beneficiary country in the
preceeding year, or if the value of such article is less than SO
percent of the total value of U.S. imports of the article in the
preceeding year. During January-September 1976, U.S. imports under
TSUS items 682.2S and 682.30 were valued at about $22.3 million and
$14.8 million, respectively, and during the period, no beneficiary
country accounted for SO percent or more of the entered value under
either item.
A subdivision of TSUS items 682.2S and 682.30 each into three
new items--(!) AC motors (2) DC motors (3) other motor--could eliminate
some GSP countries under the competitive need provisions. However,
responses to Commission questionnaires did not provide sufficient
data to make definitive determinations in all instances (see table
on p. 66). For the period January-September 1976, responses to Commis-
sion questionnaires accounted for $14.S million of U.S. imports under
TSUS item 682.2S and $13.1 million of U.S. imports under TSUS item
682.30 compared with $22.3 million and $14.8 million, respectively, as
reported in official statistics of the U.S. Department of Commerce.
On the basis of data compiled in response to Commission ques-
tionnaries, no beneficiary country would lose its duty-free status
1/ See footnote 1, p. 9.
65
as a supplier of DC motors under either item 682.25 or 682.30. How
ever, Singapore would likely lose its duty-free status as a supplier
of AC motors under item 682.25, and Mexico would likely lose its
duty-free status as a supplier of AC motors under item 682.30. A
determination cannot be made with respeet to other motors since data
compiled in response to Commission questionnaires showed only a small
value of imports of other motors.
The analysis above covers the period January-September 1976.
The competitive need provisions, however, are based on the entered
value of imports during the preceeding year. It is assumed that the
distribution of AC motors, DC motors, and other motors which will enter
the U.S. during October-December 1976 is the same distribution that
entered during January-September 1976.
66
Electric motors of under 1/40 horsepower (TSUS item 682.25): U.S. imports for consumption, by sources. January-September 1976
(In thousands of dollars) Electric motors of under 1/40
!/ Value reported in response to Commission questionnaires is higher than the value reported in official statistics of the U.S. Department of Commerce.
!:_/ Value of $9.8 million in U.S. imports from GSP and non-GSP countries was not reported in response to Commission questionnaires.
Source: Compiled from data submitted in response to questionnaires of the U.S. International Trade Commission.
Electric motors of 1/40 or more but not over 1/10 horsepower (TSUS item 682.30): U.S. imports for consumption, by sources, JanuarySeptember 1976
Source
(In thousands of dollars) Electric motors of 1/40 or more but
]-_/ Value reported in response to Commission questionnaires is higher than the value reported in official statistics of the U.S. Department of Commerce.
2/ Value of $1.2 million in U.S. imports from GSP and non-GSP countries was not reported in response to Commission questionnaires.
Source: Compiled from data submitted in response to questionnaires of the U.S. International Trade Commission.
67
* * * * * * *
68
APPENDIX A
STATISTICAL TABLES
Table !.--Permanent-magnet DC motors of under 1/40 horsepower (TSUS item 682.25): U.S. producers' shipments, imports for consumption, exports, and apparent consumption, 1972-75, January-September 1975, and January-September 1976
(Quantity in thousands of units; value in thousands of dollars)
Source: Compiled from data submitted in response to questionnaires of the U.S. International Trade Commission.
°' \0
Table 2.--Permanent-magnet DC motors of l/40'or more but not over 1/10 horsepower (TSUS item 682.30): U.S. producers' shipments, imports for consumption, exports, and apparent consumption, 1972-75, January-September 1975, and January-September 1~76
______________ __,(._.Q~ua_n_t_i_t.._y_i_n_th_ou_.;;.sa"""n_d_s_o_f_un_ its; -~l!ll!e in thousands of dollars)
Year
. Imports • . : . Producers'· : : . Ratio (percent) ·Ratio (percent) of shipments : : From : Exports : Apparent : of total imports : imports from GSP-
Total :GSP-eligible : :consumption: to apparent :eligible countries countries : : : consumption : to apparent
Source: Estimated by the U.S. International Trade Commission from official statistics of the U.S. Department of Commerce.
73
Table S.--Electric motors of under 1/40 horsepower (TSUS item 682.2S): U.S. imports for. consumption, by principal sources, 1972-7S, January-September 197S,and JanuarySeptember 1976
Source: Compiled from official statistics of the U.S. Department of Commerce.
Table 6.--Electric motors of under 1/40 horsepower (TSUS item 682.2S): U.S. imports for consumption, by beneficiary developing countries, 1972-7S, January~September 197S, and January-September 1976
Source: Compiled from official statistics of the u.s. Department of Commerce.
,75
Table 7.--Electric motors of under 1/40 horsepower (TSUS item 682.25): U.S. imports for consumption, by types, 1972-75, January-September 1975, and January-September 1976
1/ Responses to questionnaires of the U.S. International Trade Commission did not indicate any AC-motor imports under TSUS item 682.25 in the * * * period; however, it is believed that some AC motors were indeed imported from importers that were not surveyed.
'.!:_/ Imports reported in U.S. International Trade Commission questionnaires were higher than officially reported imports in 1973 and 1976.
Source: Compiled from data submitted in response to questionnaires of the U.S. International Trade Commission.
76
Table 8.--Permanent-magnet DC motors of under 1/40 horsepower: Imports, GSP and non-GSP, by so~rces, 1972-75, January-September 1975~ and January-September 1976
Source
Hong Kong---------: Mexico------------: Republic of
Source: Compiled from data submitted in response to questionnaires of the U.S. International Trade Commission.
77
Table 9.--Electric motors of under 1/40 horsepower (TSUS item 682.25): U.S. imports for consumption under TSUS item 807.00, by sources, 1972-75, January-June 1975, and January-June 1976
];_/ Some imports have entered under 807.00 since June 1976.
0 $ 992
65,585 0
288 350
0 0
102 0 0
67,317
Source: Compiled from official statistics of the U.S. Department of Commerce.
$87,117 20,499 79,683 30,934
0 0 0 0
3,344 0 0
221,577
78
Table 10.--Electric motors of 1/40 or more but not over 1/10 horsepower (TSUS item 682.30): U.S. imports for consumption, by principal sources, 1972-75, January-September 1975.and January-September 1976
Source: Compiled from official statistics of the U.S. Department of Commerce.
79
Table 11.--Electric motors of 1/40 or more but not over 1/10 horsepower (TSUS item 682.30): U.S. imports for consumption, by beneficiary developing countries, 1972-7S, JanuarySeptember 197S,and January-September 1976
Source: Compiled from official statistics of the U.S. Department of Commerce.
: : :
1976
105,844 2,017,060 2,Sll,61S
0 23
0 0 0 0 0 0
26,397 3,lSO
4 4,664,093
$289,3S6 1, 917, 111 6,642,304
0 SS9
0 0 0 0 0 0
29,518 6,623
2S8 8,88S,729
$2.73 .9S
2.64
24.30
1.19 2.10
64.SO 1.91
80
Table 12.--Electric motors of 1/40 horsepower or more but not over 1/10 horsepower (TSUS item 682.30): U.S. imports for consumption, by types, 1972-75, January-September 1975, and January-September 1976
1:_/ .The quantity of motors imported under TSUS 682.30, as reported in responses to questionnaires of the U.S. International Trade Co1Illllission, was higher than the quantity reported in official U.S. import statistics in 1972, 1973, and 1976.
Source: Compiled from data submitted in response to questionnaires of the U.S. International Trade Commission.
81
Table 13.--Permanent-magnet DC motors of 1/40 or more but not over 1/10 horsepower: Imports, GSP and non-GSP, by sources, 1972-75, JanuarySeptember 1975, and January-September 1976
Source: Compiled from data submitted in response to questionnaires of the U.S. International Trade Commission.
82
Table 14.--Electric motors of 1/40 horsepower or more but not over 1/10 horsepower (TSUS item 682.30): U.S. imports for consumption under TSUS item 807.00, by sources, 1972-75, JsnuaryJune 1975, and January-June 1976
Source: Compiled from official statistics of the U.S. Department of Co111Derce.
$123,288 2,420,408
0 14,977
2,558,673
83
APPENDIX B
PROBABLE EFFECTS STATEMENT OF TRADE AGREEMENT DIGEST NO. 60276
84
* * * * * * *
85
* * * * * * *
86
APPENDIX C
GENERAL HEADNOTE 3(C) OF THE TARIFF SCHEDULES OF THE UNITED STATES ANNOTATED
87
TARIFF SCHEDULES OF THE UNITED STATES ANNOTATED (1976)
GENERAL HEADNOTES AND RULES OF INTERPRETATION
T~.-;.. r'?·Jt:.ent o.f: 1r-;:ior+r.:I ArTi~IBs. All articles :""'portud ir-:-o ;~e C'Jst•.:i:. Tcrr-itor'/ c.f- the Ur,ftcd States frc":'" ~ ~t,: '.'1 ~ 1ri;~:ri: df ~ .s...iu .. cct : -, d•Jty er e;.~er;:.pt therefroM '.ls prc..,c.r:~'-j n 9e ... eral ~1Aa'~notc 3.
2. c ... -,tc. .... ::; ~. ,.,...i+-·ry ;-, .. tlie 1...:n:ta:i S+ates. Tlie +er'T"l '' r:~s to...-::; +-r;-,.. • + ~, / Jt t · r-: !.;n i te::l States", as used in the sd1~::::· ... Jc.-,, i,..,-: 1 uJ~"S c'lly tt:f".! Stutes, the District of Co-1,_, ... :.,;J, -J~~ r·ue--t::> r:ic.o.
3. Pates of l>1ty. The rates of dJty in t!":e "Rates of Out 1" col J ... no; n.J'"'b-.rcd 1 and 2 ".)f th"! schedu I es app I y to ari ;clcs ; .... ,:J')rtc.:1 ;!lto the ci.jsto"".$ territ<Jry of the United State.._, ~J ... "'H"C'i.,atter provided in this headnote:
: a) ?.- Jjucts of I nsu I ar Posr:•~ss ions. : · ) ':xcept as p rC'J i jed in headnote 6 of schedu I e
7, oa~ t 2, sub;:iGl ... t E, [and] 3xcept a:; pr::vided in ,__.eaor..,+ ~ t. v ... .,;,.::1edu'e !, oart 7, subpart A, articles ir-:icrt".lJ +re• i"·;ular po:,jessi0'1S ot the United States .. :·1c~ ···c e;Jt_,idc +he t:Jstc. ... <.. territory cf the United S ~ Jte"' .J"'C ::.Jt:. je:t to the rdh~s Jf d~ty set fo ... th in ·:olt. ..... n nu.,..,t,'-..... e~. 1 of the :::;::hej: .. di:.::.:., ~...:cept that al I ~u:h a,...t;cle:. the :Jrowt~. or product of anv :::;uch possessix:, c,... "'11'1..;~~:tur"'j or pro:.luced in any such possession frc"" "'latPrial~ +hn gr'lwth, pr!:>:luct, or r'lan·1f~cture of J .. ( '..:i .ich p.:JSSP.:-:. ion or of .. he cust'Jflls terr i t0ry of the J ... · te1 ~tat es, or of both, which do not co'lta in foreign f"!£2+~rial: r::J l.ie va! 11e -:f ,...ore than 50 per:e'lt 0f 1 heir t-:ita I va I ue (or rr.ore than 70 percP.nt of their 1ota I va I .Je Ni tr respect to watches and watch moveMerits}, c:::Min3 to the CJstc""s terr:tory of the Unite<l )+ates ~ire-:tly from an1 ., ... ,.~ pcsst~sc;ion, and al I 3:-ticlc:; p ... 1;vio•13ly irr:purte'.:l irta ne customs territory 0f tri" Jr.'+1Jd $+-ates wi ... h r.r..:yMer.t cf di I applicable duties ,-..nd tax J i rrpased upon or by reas.::ir, of i r'lportat ion which w~re ship;;-:?1 fro."" the Uriited State:., without remission, refund, or drawback o~ s Jch :l'Jt i 135 or taxes, direct I y to the :JCS5ession from ,,.hich they are bein9 returned by -Ji r"'::t sh i prient, are exe.,.pt froM duty.
( i i ) In j13term in i r:g wr.ether :in art i c I e produced or ma .. 1uf 'Kt .... rec i ri any such i nsu I ar possession contains fo .. e i g., r- Jier i a Is to the va I ue of rore than 50 percent, no riat:irial shal I be considered foreign which, at the +irre su:h a .... ticle is entered, may te imported into the c.Jstor-i~ torr i tory from a foreign country, other than C'.J~d or tre Pt-i I ipplne Repuol ic, and entered free of d"ty.
Ci ii l Subjec+ to t .. e I 1..-·+a-rions i""lposed under .... e::tion :.:J3(~) and 504(:J "Jf the Tr1de Act of 1974, articles Jesigriatej eligi~le or ti:les under section 503 vf c;uc~ Act whict, '3re ir-porte: fro:"! an insular possess i o:i of the Uni trd States ~h J 11 receive duty treatr-ent no le~s favc.rable than the treatment afforded su::::h articles il"":ported fretr a beneficiary developing COJntr·( t.ndP.r title V of S.Jr...h Act.
( b) Products of Cubd. Products of Cuba imported into the C'JSto,.,..3 territory of the United States, whether imported direct I y 0r indirect I y. are subject to the rates of duty set forth in column nu .... bered 1 of the schedules. Preferential rates of duty for such products app I y on I y as shown in the said r:olurr'l 1. lf
1/ By virtue of section 401 of the Tariff Classification Act' of 19t.L., the application to products of Cuba of either ea prefere1tial or other reduced rate of duty in column 1 is S:JSpt!rded. See general headnore 3Ce), infra.
Page 3
(c) Products of Countries Designated Beneficiary Developing Countries for Purposes of the Generalized System of Preferences <GSP).
{ i) The fo1 lowing countries and territories are designated beneficiary deve I oping countries for purposes of the Genera I i zed Syste"l of Preferences, prov I ded for in Title V of the Trade Act of 1974 (88 ~tat. 2066, 19 U.~.C. 2461 £!~.):
Independent Countries
Afghanistan Angola Argentina Bahamas Bahrain Bang ltldesh ljarbados
E)9enin Bhutan Bo! ivia Botswana Brazi I Burma Burun1 i Cameroon Cape Verde Central African Republic Chad Chi le Colanbi <:i
Congo (Brazzavi I le) Costa R'ica
eCyprus iJOMinicnn Republic Egypt EI Sa I vado:Equator i a I Gu I nea Ethiopia Fiji Ga'Tlbia Ghana Grenada Guat~a la Sui nea Guinea Bissau Guyana Ha lti Honduras India Israel Ivory Coast Jamaica Jordan K~nya
E)~~~=~~n Repub I i c of
Lesotho Liberia Ma I agasy Repub I i c
~alawi
Malaysia Maldive Islands Mali Malta :.:auritania Mauritius MPXico f.1orocco Mozarnb i que Nauru Nepal Nicaragua Niger Oman Pakistan Panania Papua New Guinea Paraguay Peru Phi I ipplnes
fl} Portugal fl Re pub I ic of China
Romania Rwanda Sao Tome and Principe Senega I Sierra Leo:ie Singapore Serna I i a Sri Lanka Sudan Surinam Swazi land
GI.Syria ~anzania
Thailand Togo Tonga Trinidad and Tobago Tunisia Turkey Upper Vol ta Uruguay Western Samoa Yemen Arab Republic Yugoslavia Zaire Zambia
(3rd supp. 10/1/76)
88
TARIFF SCHEDULES OF THE UNITED STATES ANNOTATED (1976)
General Headnotes and Rules of Interpretation
P e4
Non- Independent Countrl es & Terr I tori es
Afars and I ssas, French Territory of the
Antigua Bell ie Bermuda British Indian Ocean
Territory British Solomon Islands Brunei Cayman Is I ands Christmas !~land
(Austra Ii al Cocos (Kee II ng l Is I ands Ccmoro Is I ands Cook Islands Dcminica Falkland Islands
<Malvinasl and Oependenc i es
French Polynesia Gibraltar
Hong Kong Macao Montserrat Nether I ands Anti I I es New Caledonia New Hebrides Condominium Niue Norfolk Island Pitcairn Island Portuguese Timar Saint Chr I stopher-Nev Is-
Angu i I la Saint Helena Saint Lucia Saint Vincent Seyche 1 les Spanish Sahara Tokefau Islands Trust Territory of the
Pacific lsl~rnds
E)Gi lbert Islands Turks and Cai cos Is I ands
E)Tuvalu Heard Is I and and McDona Id
Islands Virgin Islands, British Wal I is and Futuna Islands
(ill Articles for which the designations "A11 or 11A• 11
appear:- in the column ent 1 t I ed 11GSP11 of the schedules are those designated by the President to be e I i g i b I e art i c I es for puo;-poses of the GSP pursuant to Section 503 of the Trade Act. The designation "A" signifies that al 1 beneficiary developing countries are eligible for preferential treatment with respect to al I articles provided for in the designated TSUS item. wh I le the designation "A*" indicates that certain beneficiary developing countries, specifically e:numerated in subdivision (c)(iii) of this headnote. are not e 11gib1 e for such preferent I a I treatnent with regard to any article provided for In the designated TSUS i+em. Whenever an eligible article is imported Into the custows territory of. the United States directly from a coun+ry or territory I isted in subdivision (c)( I) of this headnote. it sha I I rece 1 ve duty-free treatment, unless excluded from such treatment by StJbdivlsion Cc)( iii> of this headnote, provided that, In accordance with regulations promulgated by the Secretary of the Treasury:
(Al the sum of ( ll the cost or value of the materials produced In the benef I cl ary deve I op! ng country p I us < 2> the d I rect costs of processing ooerat I ans per-formed in such country Is not I ess than 35 percent of the ap?raised value of such article at the time of Its entry Into the customs territory of the United States; or
<B> the sum of ( ll the cost or value of the materials produced In t-..o or more beneficiary developing countries which are members of the same association of countries which is treated as one country under Section 502(a)(3) of the Trade Act, plus (2) the direct cost of processing operations performed in such countries Is not less than 50 percent of the appraised value of such article at the time of Its entry into the customs territory of the United States;
and prov I ded further that, for the purposes of (Al above, the term "cou.ntry" does not Include an association of countries which Is treated as one country under Section 502(a)(3) of the Trade Act, but does Include a country wh I ch Is a member of any such assoc I at I on.
0< 11 ll The fol lowing designated el lglble articles provided for In TSUS Item numbers preceded by the desl!~natfon "A*", If imported from a beneficiary deve I op Ing country set oppos I te the TSUS Item numbers listed below, are not entitled to the duty-free treatment provided for In subdivision (cl<lil of this headnote:
TSUS item
Number Country or terr I tory
107 .45 .•.• Braz I I 110. 45 •••• Argent Ina 121.52 •••• India 121. 54 .••• Ind I a 130.40 ••.• Mexico 130.63 .••• Mexico 131.35 •••• Hong Kong 132.55 •••• Mexlco 135. 80 •••• Nicaragua 135.90 •••• Mexico 135.94 •.•• Mexico 136.00 ••.. Domlnlcan Republic 136.80 •.•• Mexico 136.98 •••• Dominican Republic 136.99 •••• Republic of Chl"1iE) 137.75 •••• Costa Rica 138. 05 •••• Mexico 140,09 •••• Thal land 140.14 •••. Thal land 141. 35, ... Turkey 141.55 ..•• Dominican Republ le !41. 70 .••• Republic of Chin<f) 145.09 .••• Dominican Republic 145. 24 •... Mexico 145. 52 ••.• Portuga I 145.53,, .. Turkey 145.60 .••• Republic of Chin<E) 146.12 •... Argentina 146.44 ••.. Phi I lppine Republic
E)146. 66 ..•. Portuga I 147 .33 ..•• Jamaica 147.80 •••• Mexico 147.85 •••. Braz I I 147.92 ..•. India 148. 72 •.•. Chi le 148. 77 •••• Republic of Korea 149.15 •••• Dominican Republic 149.50 •••. Dominican Republic 152.43 •••• Dominican Republic 152.58 •••• lndia 152. 72 .•.. Honduras 153.02 ••.• Dominican Republic 153. 28 •••• Portuga I 154.40 •••. Republic of Chln<E)
Argentina Braz I I Republic of Chin<E) Colombia Dominican Republic EI Salvador
155.20.. Guyana I ndla amatca
Nicaragua Panama Peru Phi llppine Republic
hat land 155. 35. • • • arbados 161. 83 .••• Mexico 162.11 •••• India 166. 30 •••• I srae I 166.40 •••. Mexico 168.15 •••• Trinidad
el68.23 •••• Peru 175.51 •••• Romania
TSUS Item
Number Country or territory e . E)l76. I 5 .••• Braz I I
176. 33 •••• Ma lays! a 186.40 ..••• Republic of Chin<f) 192. 85 •••• Mex I co 202.60 •..• Thal land 202.62 •••• Mexloo 203. 20 •••• SI ngapore 206.45 •••• Phl llpplne Republic 206. 60 •••• Mex I co 206.95 •••• Haiti
0220.10 •••• Portuga I E)220. 15 •••• Portuga I
1220. 20 •••• Portuga I 220. 25 .•.. Portuga I 220. 35 .••. Portuga I 220. 37 ••.• Portuga I 220. 41 .•.. Portuga I 220. 48 ••.. Portuga I 220. 50 •.•• Portuga I 222. 10 ••.. Hong Kong 222.32 •••• Republlc of Chin<E) 222. 42 •••• Hong Kong 240.02 •••• Phi 1 lppine Republic 240. 10 •.•• Repub I le of Korea 240. 12 •.•. Braz I I 240.38 •••• Phi 1 lpplne Republ le 240.40 .•.• Phi I lpplne Republic 251. 30 •••• Mex I co 256.60 •••• Republic of Korea 256.85 ...• Mexico 304.40 •.•. Thal land 304.48 •.•. Republlc of Chin<E) 304.58 •••• lndla 305.20 •..• India 305.22 •••• India 305.28 •••• India 305. 40 •••• Ph 111 pp I ne Repub Ii c
E)305. 50 •.•• Portuga I 306. 53 •••• Peru 308.80 ••.• Thal land 319.01 •••• lndla 319.03 •••• India 319.05 •••• lndla 319.07 •••• India 335.50 •••• lndla 347·.28 •••• Hong Kong 347.30 ..•• India 360. 35 ••.• I ndla 364.18 ••.• Republic of Chin<E) 416.10 .•.• Turkey 419.60 •••• Chi le 420.24 .••• Israel 420. 78 •••• Argentina 420.84 •••• Romania 421. 06 •••• Co I omb i a 422. 76 •••• Mexico 425. 74 •••• Braz I I 425.84 •••. Netherlands Anti 1 les 426. 78 •.•• Israel 437.16 •••• India 437.51 .••• Brazl I 437.64 •••• Braz I I 455.16 •••• Mexico 455. 30 •••• Mexico 460.60 •.•• India 460. 70 •••• Repub 11 c of Ch I naE)
(3rd supp. 10/1/76)
TSUS item
Number Country or territory
421. 90 •••• Peru 422. 76 •••• Mexico 425.32 •••• Mexico 426.94 •••• Israel 428.92 •••• Mexico 437.16 •.•• India 437. 64 •••. Braz I I 446. I 0 •••• Ma I ays I a 455.16 •••• Nicaragua 461.05 •••. Israel 461. I 5 •••• Bermuda 465. 70 •••• Argentina 470. 57 •••• Argent Ina 472.48 •••• Cyprus 473. 36 •••• Cyprus 473.52 •••• Mexlco 473.56 •••• Mexico 493.20 •••• Republ le of China
l 516. 73 •••• India 516.76 •••. lndla 517.21 •.•• Malagasy Republ le
1 517.24 •••• Malagasy Republ le ! 518.41 .••• Mexico : 520.35 •••• Thal land I 520.37 •••• Hong Kong I 523.61 •••• Mexico ; 531.04 •••• Yugoslavia ; 535.31 •••• Mexico i 540.47 •••• Mexlco i 544.11 •••• Republ le of China : <Taiwan) i 545. 53 •••• Mexico \ 545.65 •••• Mexico ~ 547.51 ••• ~xlco '602.30 ••• Peru
hi I ipplne Republic 603.45 •••• Republ le of Korea 605.60 •••• Mexico 610.56 •••• India
612.03 ••• ~i le Peru
612.06... I le · ugoslavia
613.18 •••• Israel 618.29 •••• Republic of Korea 624.42 •••• Mexico 628.90 •••• Chi le 646. 06 •••• Hong Kong 646.82 •••• Republ le of China
· <Taiwan) 646. 86 •••• Hong Kong 646.98 •••• Mexico 647.10 •••• Mexico 649.37 •••• Mexico 650.87 •••• Hong Kong 651. 01 •••• Hong Kong 652.36 •••• Hong Kong 653.85 •••• Republ le of China
<Taiwan> 656.20 •••• Hong Kong 661.65 •••• Israel 672. I 0 •••• Hong Kong 676.20 •••• Mexico 676.52 •••• Mexico 678.50 •••• Republic of China
<Ta iwanl 683.80 •••• Hong Kong 684. 50 •••• Hong Kong 685.24;. uepublic of China
(Taiwan) Hong Kong Republ le of Korea. Singapore
89
TARIFF SCHEDULES OF THE UNITED STATES Al'J-WOTATED (19'70)
General Hea<!notes and Rnles of Into&"p;;:-oi':'.tlcrn
TSUS item
~ Country or terr I tory
685.90 •••• Mexico 686.30 •••• Republic of China
<Taiwan) 688.10 •••• Republ le of China
<Taiwan> 688 • 40 •••• Hong Kong 692.27 •••• Maxlco 694.60 •••• Mexico 696.35 •••• Republic of China
<Ta lwanl 702.08 •••• Republ le of China
<Ta l>tanl 702.14 •••• Hong Kong 702.35 •••• Mexico 702.45 •••• "'8xlco 703.20 •.•• Mexico 703.65 •••• Mexico 706. 40 •••• Hong Kong 708.41 •••• Hong Kong 710.30 •••• Mexico 713.05 •••• Israel 713.19 •••• Mexico 722. 14 •••• Hong Kong 725.20 •••• Pakistan 726. 70 •••• Mexico 730.27 •••• Brazi I 730.39 •••• Braz I I 730.41 •••• Brazl I 730.65 •••• Yugos I avl a 731.30 •••• Republic of China
<Taiwan) 731.50 •••• Republ le of Korea 734.10 •••• Republ le of China
<Ta !wan) 734.25 •••• Hong Kong 734.30 •••• Hong Kong 734. 34 •••• Hong Kong 734. 40 •••• Repub I le of Ch Ina
<Taiwan) 734.51 •••• Republ le of China
<Taiwan) 734.54 •••• Republ le of Korea 734.56 •••• Haiti 734.60 •••• Republ le of China
<Taiwan) 137 .40 •••• Hong Kong 73 7 • 50 •••• Hong Kong 737 .95 •••• Hong Kong 740.05 •••• Mexico 740.30 •••• Hong Kong 740. 70 •••• Yugos I av la 7 4 I. 20 •••• Hong Kong 745.08 •••• Hong Kong 7 48. 20 •••• Hong Kong 748.40 •••• Republic of China
(Taiwan) 150.05 ••. • Hong Kong 750.35 •••• Republic of China
<Taiwan) 7 50. 40 •••• Hong Kong 751.05 •••• Republic of China
(Taiwan) 751.20 •••• Republic of China
<Taiwan) 760.65 •••• Republic of China
<Taiwan) 771.05 •••• Mexico 772.03 •••• Hong Kong 772.35 •••• Republic of Ch1na
<Taiwan) 772. 97 •••• Hong Kong 773.10 •••• Hong Kong 773.20 •••• Republ le of Korea 774.20 •••• India 774.60 •••• Hong Kong 790.07 •••• Hong Kong 790.39 •••• Republ le of China
<Taiwan> 790.70 •••• Republlc of Korea 791.20 •••• Brez I I 792.50 •••• Phil lpplne Republic 792. 60 •••• Hong Kong 792. 75 •••• Hong Kong
Cd) Products of Canada. ( I l Products of Canada ll'lpoded Into tho cusi"o:;is
territory of the United States, "h:ither Imported directly or Indirectly, are subj<l:Ct to the rates of duty s:i"i' forth in co I u::m numb0red I of tha schodu I es. Th:i rotes of duty for a Canodlan article, as defln0d In subdivision (d)(l ll of this h3adnote, apply only os sho\1n In the said co I umn numbered ! •
(ii) Tha tarm "C.madlan article", as used In th<il schedules, n:sans an article \'lhlch Is ·cho product of Conoda, but does not Include any artlcla produced t!lth th::> use of materials Imported Into Canada t1hlch aro products of any foreign country (except r.:aterlals produced 11ithln the customs terr I tory of tha Un I tad Statss r, If tho aggregate value of such .Imported materials 11hon landed ot the Canad I an pert of entry (that Is, the actuo I pure ho so price, or If not purchased, the sxport value, of such rraterlals, plus, If not Included therein, the cost of transporting such materials to C&nada but excluslva of any landing cost and Canadian duty> ttas --
<Al ttlth r0gard to any n:otor vehicle or automob I I e truck tractor entered on or before Dece.'llber 31 , 1967, more than 60 porcant of the appraised value of the article Imported Into the custo:ns territory of the United States; and
<Bl ttlth regard to any other ari"lclo (Including any ir.otor vehicle or auto:ilObl le truck tractor entered after Dace:r.bar 31, 1967), n:ore than 50 percent of the appra I sed va I ue of the ·article Imported into the customs territory of th"' Un I ted States.
(el _Products of Corr.munlst Countries. Nohilthsfondlng any of the foregoing provisions of this hc•dncte, the ratos of duty sho11n In column numbered 2 shol I apply to products, tthether Imported d I ract I y or Ind I ract I y, of the fo I Io" Ing countr I es and areas pursuant to sect I on 40 I of tho Tariff Classlflcatlon Act of 1962, to section 231 or 257CelC2l of tha Trade Expansion Act of 1962, or to action taken by the President ·chareundor: I/
Albania -Bulgaria Ch Ina <any part of wh lch ro.ay be under
Commun I st dom I nat I on or contro I l Cuba 2/ CzechOs I ova k I a Estonia Garmany (the Sov·let zone and the Soviet
sector of Berl lnl Hungary I ndoch Ina <any part of Cambod I a, Laos, or
VI etnam 11h I ch may be under Com:nun I st domination or control l
Korea (any part of tthlch may be under Co:r.:nunlst do:nlnatlon or control l
Kur I le Islands Latvia Lithuania Ou for rq,ngo I I a Southern Sakha I in Tanna Tuva Tibet Union of Sovl0t Socia I 1st Republ lcs and the
area In East Prussia under the provisional administration of tho Union of Soviet Social 1st Republ lcs.
(fl Products of Al I Other Countries. Products of al I countries not prGvlously mentioned In this headnote lmportod Into th0 custo.71s territory of the Unltod States ara subject to the rates of duty set forth In co I umn n"'1bored I of tho schedules.
y In Procloo:ition 4369, dutotl April 24, 1975, tho P..asidont, actin!l undor m.1tho'!'ity of •action 404(n) of the Tredo Act of 1974 (80 Stat. 1970) n=ndod i;onowl hcodnoto 3(o) by delotin!l "R=ia", offcctivo AutJU!lt 3, 1g75, tho elute on t>hich written ru>ticos of acceptonco "oro oitchon!Jcd, follo;,ina adoption on July 26, 1975 by tho Cengrosn of a concurt"ont resolution ol! oi;;provnl ontcndin!l nondincrioiruitory tro::itcont to tho producto of tho Socialist lbpl!.l>lic of Ro=in.
y In Procl=tion 3447, dntcd Fobrll!lry 3, 19o>2, tho Prosidcmt, ncting undoi' cuthodty of occUon 620(a) ol! tl'!:i Foi'oign Ansbtanco Act ol! lUl (75 Stat. 445), O!l =O:::d, prohibi tod tho icya?tntion into tho United Statos oil all (itll>d!l of Cub'.lll orl13in u.'11\ all ~D icyo?to:I K'llc:i or thro~ CUl>cl, subject to Ot!ch oitCC')tions as tho Socrotary ol! tho Trcaslli'Y detolfi:'~~co to bo eoruJistoat ~ith tho ol!ilcctivo opoirotion ol! tho c:3:ll'fi0.
90
TARIFF SCHEDULES OF THE VNITED,STATES ANNOTATED (1ll76)
General Headnotea and Rules of Interpretation
Cgl Effective Date; Exceptions - Staged Rates of ~. 1J Except as specified below or as may be specified elsewhere, pursuant to section 50!(a) of the Tariff Classlf!catlon Act of 1962 <P.L. 67-456, approved May 24, 1962), the rates of duty In columns numbered I and 2 becane effective with respect to articles entered on or after the 10th day following the date of the President's proc!1WD11tlon provided for In sect!0n 102 of the said Act. If, In column numbered I, any rate of duty or part thereof Is set forth In parenthesis, the effective date sha! I be governed as fol lows:
CI l It the rate In ex>! umn numbered I has only one part Cl.a., 6¢ C 10¢) per !b.l, the parenthetical rate Cv!z., 10¢ per lb.) shal I be effective as to articles entered before July I, 1964, and the other rate (viz., 6¢ per lb.l shal I be effective as to articles entered on or after July I, 1964.
(II l It the rate In column numbered I has two or more parts C I.e., 5¢ per lb.+ SOj ad val.) and. has a parenthetical rate for either or both parts, each part of the rate sha II be governed as It It were a one-part rate. For example, If a rate Is expressed as "4¢ (4.5¢) per lb. + 6i C9%l ad val.", ·the rate applicable to articles entered before July I, 1964, would be "4.5¢ per lb.+ 9~ ad val."; the rate applicable to articles entered on or after July !, 1964, would be "4¢ per lb.+ 6~ ad val.".
Cl I!) It the rate In column numbered I Is marked with an asterisk C*l, the foregoing provisions of C ll and C 11 l sha! I apply except that "January I, 1964" sha! I be substituted for "July I, 1964", wherever this latter date appears.
4. Modification or Amendment of Rates of Duty. Except as otherwise provided In the Appendix to the Tariff Schedules --
Cal a statutory rate of duty supersedes and tennlnates the existing rates of duty In both column numbered I and column numbered 2 unless otherwise specified In the amending statute;
Cbl a rate of duty proclaimed pursuant to a concession granted In a trade agreement shall be reflected In column numbered I and, If higher than the then existing rate In column numbered 2, also In the latter column, and shall supersede but not tenn!nate the then existing rate (or rates>. In such column (or columns);
(cl a rate of duty proclaimed pursuant to section 336 of the Tariff Act of 1930 sha! I be reflected In both column numbered I and column numbered 2 and she! I supersede but not tenn!nate the then existing rates In such ex>lumns; end
(d) whenever a proclaimed rate Is terminated or suspended, the rate sha 11 revert, un I ess otherw l se prov I dad, to the next Intervening proclaimed rate previously superseded but not terminated or, If none, to the statutory rate.
5, lntanglbles. For the purposes of headnote I -(a) corpses, together with their coffins and
· accompany l ng t lowers, (bl currency <metal or paper> In current clrcu-
1 at I on l n any country end Imported for monetary purposes,
Cc) electrlclty, Cdl. securities end slml !er evidences of value, and (el vessels which ere not "yachts or pleasure boats"
within the purview of subpart D, pert 6, of schedule 6,"
ere not articles subject to the provisions of these schedules.
6. Containers or Holders for !nported Merchandise. For the purposes of the tariff schedules, ex>ntelners or holders ere subject to tariff treatment es follows:
Cal lmoorted Empty: Containers or holders If lll)l>Orted empty are subject to tar! ff treatment es Imported articles and es such are subject to duty unless they are within the purview of a provision which specif lea! ly exempts than t ran duty.
(bl Not Imported Emoty: Containers or holders If Imported containing or holding articles are subject to tar! ff trea1ment es fol lows:
1/ The purpose of headnote 3(1) was to provide for an effective date for the rates of duty lni tial ly contained in the Tariff Schoclules of the United States. By Presidenti-1 Procluation 3548 of Aupt 21, 1963, these rates of duty, except as noted in subparqraphs (1) , (ii) , md (iii) of headnote 3(1), becue effective on Auaust 31, 1963.
Ul The usual or ordinary types of shipping or. transportation containers or holders,· rt not designed tor, or capable of, reuse, and containers of usual types ordlnarl ly sold at retal I with their contents, are not subject to treatment as Imported articles. Their cost, however, Is, under section 402 or section 402a of the tar! ff act, a part of the va I ue of the! r contents and If the Ir contents are subject to an ad va!orem rate of duty such containers or holders are, in effect, dutiable at the same rate as the i r contents, except that the I r cost Is deductible from dutiable value upon submission of satisfactory proof that they are products·of the United States which are being returned without having been advanced In value or Improved In condition by any means while abroad. . .
(Ill The usual or ordinary types of shipping or transportation containers or holders, if designed for, or capable of, reuse, are subject to treatment as Imported articles separate and distinct from their contents. Such ho I ders or conta I ners are not part of the dutiable value of their contents and are separately subject to duty upon each and every Importation Into the customs territory of the United States unless within the scope of a provision specifical !y exempting them from duty.
CI ill In the absence of context which requires otherwise, al I other containers or holders are subject to the same treatment as spec If I ed In <I I l above for usual or ordinary types of shipping or transportation containers or holders designed for, or capable of, reuse.
7. Corrrningllng of Articles. Cal Whenever.articles sub-ject to d I fferent rates of duty are so packed together or mingled that the quantity or value of each class of articles cannot be read I ly ascertained by customs officers (without physical segregation of the shipment or the contents of any entire package thereof), by one or more of the following means:
C !l sampling, Cl!l verification of packing lists or other docu
ments f I I ed at the t I me of entry, or (! ! ll evidence showing performance of conrnerc!a!
sett I ement tests genera 11 y accepted In the trade and fl led In such time and manner as may be prescribed by regulations of the Secretary of the Treasury,
the conmlngled articles shai I be subject to the highest rate of duty applicable to any part thereof unless the consignee or his agent segregates tt\e articles pursuant to subdivision (bl hereof.
Cbl Every segregation of articles made pursuant to this headnote shal I be accomp! !shed by the consignee or his agent at the risk and expense of the consignee wlthl n 30 days (unless the Secretary authorizes In writing a longer time) after the date of personal del Ivery or ma! I Ing, by such amp lbyee 11s the Secretary of the Treasury sha! I des !gnate, of written notice to the consignee that the articles are conmingled and that the quantity or value of each class of articles cannot be readl_ly ascertained by customs officers. Every such segregation sha! I be accomp! !shed under customs supervision, and the compensation-and expenses of the supervising customs officers sha! I be relmburs"ed to the Government by the cons! gnee under such regu I at Ions 11s the Secretary of the Treasury may proser! be.
(cl The foregoing provisions of this headnote do not apply with respect ta any part of a shipment If the consignee or his agent furnishes, In such time and manner as may be prescribed by regulations of the Secretary of the Treasury, satisfactory proof -
(!)that such part CAl Is canmerclal!y neg!lg!ble, <Bl ls not capable of segregation without excessive cost, and CC> wl 11 not be segregated prior to Its use In 11 manuf11ctur!ng process or otherwise, and
<Ill that the comn!ngllng was not Intended to avoid the payment of lawful duties.
Any article with respect to which such proof Is furnished sha! I be considered for el I customs purposes as a part of the article, subject to the next lower rate of duty, with which It Is conmlngled.
Cdl The foregoing provisions of this headnote do not apply wHh respect to any shipment If the consignee or his agent sh11! I furnish, In such time and manner as may be prescribed by regu!11tlons of the Secretary of the Treasury, s11t!sfactory proof -- .
< !l that the value of the conning led articles ls less than the aggregate v11!ue would be If the shipment were segregated;
Library Cataloging Data
U.S. International Trade Commission, Information for use in determining
whether to remove permanent-magnet direct current motors from the list of articles eligible for the generalized system of preferences. Report to the President on investigation no, 332-79 (1) under section 332 (g) of the T~riff act of 1930, as amended. Washington, 1977.
90 p. illus. 27 cm, (US ITC Publication 802)
1. Electric motors, direct current I Title
UNITED STATES
iNTERNATIONAL TRADE COMMISSION WASHINGTON. D.C. 20436
OFFICIAL BUSINESS
ADDRESS CORRECTION REQUESTED
ADDRESS CHANGE O Remove from List O Change as Shown
Please detach address label and mail to address shown above.