1 Information Fusion and Performance Modeling with Distributed Sensor Networks November 20, 2009 KC Chang SEOR Dept., George Mason University 4400 Univ. Dr., MS 4A6, Fairfax, VA 22030 [email protected](703) 993-1639 Fax (703) 993-1521
Transcript
1
Information Fusion and Performance Modeling with Distributed Sensor
• GMU Research on Information Fusion– Distributed Tracking and Fusion with Sensor Networks– Predictive Situation Awareness with Probabilistic Ontology– Information Fusion Performance Modeling
• Classification Performance Modeling with Bayesian network• Efficient inference in hybrid model
– Kinematics • Fusion Performance in Dynamic Sensor Networks
• Future Research
George Mason UniversityGeorge Mason University
• Just 25 minutes from Washington DC, George Mason is in the heart of region that defines US policy, technology, information, politics, economics, and business
• Our proximity to government & defense agencies, government contractors and public policy makers defines the nature of our programs, our research, and our students
• Established as independent VA university: 1972• About 32,500 students in 4 campuses.• Niches of excellence:
– Information Technology & Engineering– Law & Public Policy– Visual and Performing Arts– Economics – Life Sciences
George Mason UniversityGeorge Mason University
George Mason University George Mason University
• Ranked number 1 on U.S. News and World Report's new list of “Up-and-Coming Schools” published in August 2008.
• Ahead of Clemson (no. 2)University of Southern California (no. 3)Arizona State University (no. 4)
• Ranked number 2 university to watch in 2009
• Established 1985. First PhD in IT in U.S. • Focus on:
– Integration of information into engineering– Interdisciplinary nature of modern IT
• 4200 students (2000 graduate)• Six departments:
– Applied IT
– Computer Science
– Statistics
– Electrical and Computer Eng.
– Civil Environmental & Infrastructure Eng.
– Systems Engineering & Operations Research
• Moved to new building (May, 2009)– Long and Kimmy Nguyen Engineering Building
VolgenauVolgenau School of IT&ESchool of IT&E
The SEOR DepartmentThe SEOR Department
• The SEOR Department at Mason is in the heart of the region with the highest concentration of systems engineers and operations research practitioners in the US
• We have a strong tradition of responding to needs of industry/government while maintaining academic rigor
• SEOR Degree Programs– BS in Systems Engineering– MS in Systems Engineering– MS in Operations Research– PhD in Systems Engineering & Operations Research
• Began Spring 09• SEOR also participant in School-wide PhD in IT
– Graduate Certificates• Military Operations Research• Command, Control, Communications, Computing and Intelligence (C4I)• Architecture-Based Systems Engineering
Sensor Fusion Lab
99
Distributed Fusion in Net-Centric Warfare
• Operational challenges– Net-centric environment involves interoperation among systems
(military, civilian, federal and state agencies, and NGOs) using incompatible formats and vocabularies
– Timely and accurate information sharing is essential to mission success
• Requirements for data fusion and predictive situation awareness– Free human operators from information overload and low-level
manual tasks– Provide decision makers with actionable
information that accounts for uncertainty
• GMU distributed fusion research – Target tracking and sensor management– Distributed data fusion– Fusion Performance modeling and
analysis– Predictive situation assessment
10
Current Research Projects
• Image-based Tracking Algorithms for Unmanned Aerial Vehicles– STTR project sponsored by AFOSR– Ground target tracking in urban environment, UVA route planning
• Distributed Fusion in Sensor Networks with Information Genealogy – D&I grant sponsored by ONR– Information fusion and dissemination in Ad Hoc sensor networks
• Information Fusion and Performance Modeling– Basic Research grant sponsored by AFOSR– Fusion performance modeling and analysis
• Predictive Situation Awareness with Multi-Entity Probabilistic Ontologies– Research project sponsored by ONR– Dependable prediction for level 2+ naval SA
Distributed Fusion Performance Modeling
• Performance Modeling for Information Fusion– Fusion performance modeling and analysis – Team members: Dr. Wei Sun (research faculty), Rommel
Carvalho (PhD), Ashirvad Naik (MS)
• Research & Development Goals– Develop analytical modeling for both kinematics and
classification performance in distributed sensor networks– Develop fusion performance modeling methodologies based on
explicit links of spatial and temporal relationships between target and sensor observations
– Develop efficient and scalable hybrid inference algorithms for high level situation assessment
– Develop software prototype and simulation environment to validate the proposed methodologies
Performance Evaluation for Multisensor Classification Systems
• Evaluate classification performance of a multisensor system– Define sensor model and target model – Model a multisensor fusion system with a Bayesian network– Develop theoretical model to evaluate the classification performance– Off-line calculation to answer What-if question– Provide decision makers a cost/benefit trade-off measure to
determine the best allocation strategy• Efficient Inference and Evaluation Algorithms
– Based on hybrid stochastic simulation and exact algorithms– Define global confusion matrix based on local confusion matrices– Conduct theoretical convergence analysis
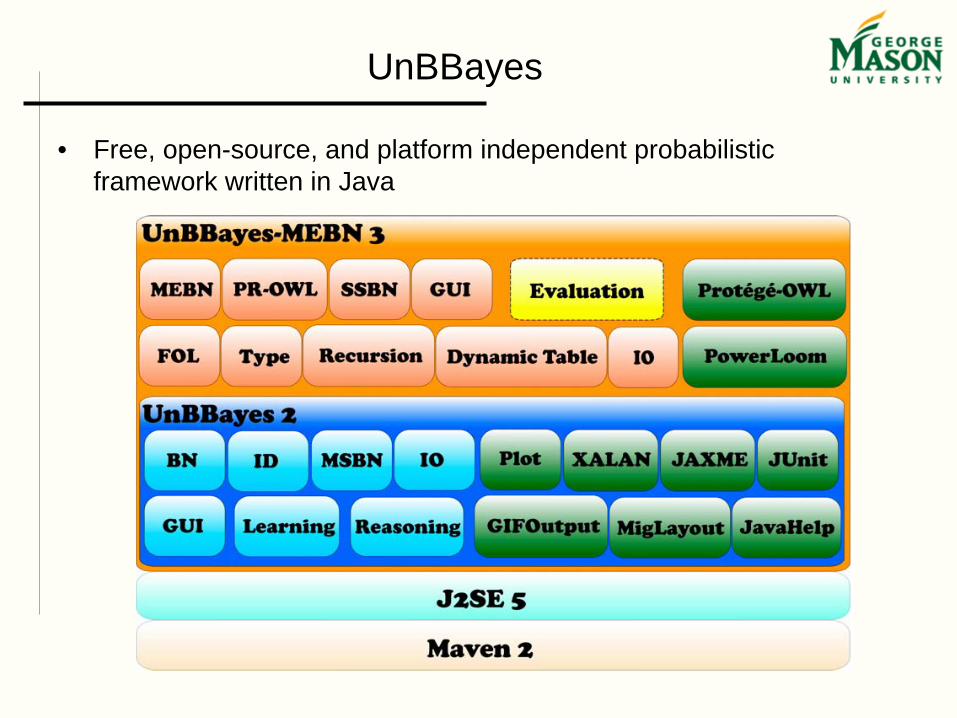
• Software Development– Integrated with an open-source BN framework, UnBBayes– Platform independent (Java based)– Select proper sensor suites according to requirements and
constraints
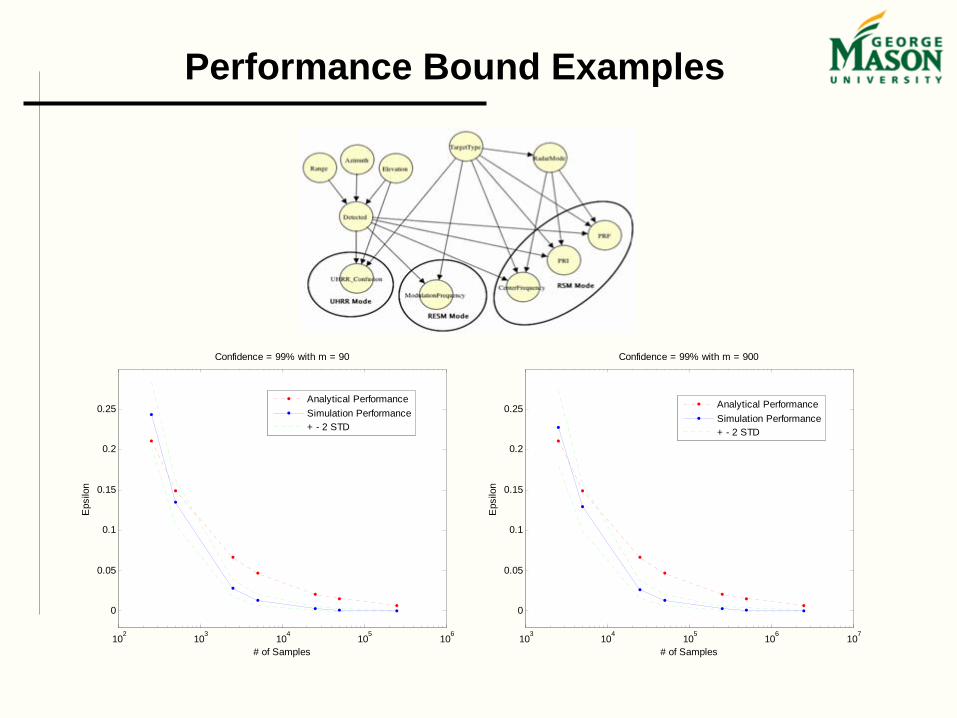
Classification Performance Model Example
• How good is the model? What is the value of each sensor’s data?• What is a good performance metric to evaluate the classification system?
Confusion Matrix Example - Local sensor confusion matrix
• Free, open-source, and platform independent probabilistic framework written in Java
Performance Evaluation Tool
Classification Performance Model
Performance ModelThe classification performance can be defined as the average correct classification probability
Compute the correct classification probability (global confusion table) based on local sensor confusion matrices (LCM) and the overall model
)|Pr(1 iIDTrueiIDInferredN
Pi
CC === ∑
∑
∑==≈
====
==
Obs
Obs
jIDTrueObsObsiIDInferred
jIDTrueObsjIDTrueObsiIDInferredjIDTrueiIDInferred
)|Pr()|Pr(
)|Pr(),|Pr()|Pr(
Performance Prediction
• Performance Prediction Methodology- Need to compute global confusion matrix (GCM) in a dynamic
setting - The classification performance depends on the local target
level confusion matrix (LCM)
• Convergence Criteria- The GCM always converge to an identity matrix
(when time -> infinity) as long as the rows of the LCM are different (discriminatory)
- The speed of convergence depends on the discrimination ability (eg., KL distance between rows)
)|Pr( IDTrueObs
Performance Prediction - Single Sensor
1
1 12
s ijni j i
D KL⎛ ⎞⎜ ⎟ = = +⎝ ⎠
= ∑ ∑
Ds is the average symmetric KL distance of the sensor confusion matrix
• A metric to judge a sensor’s value– Quantify its discriminatory power– Ability to distinguish targets– Measured by KL-distance between rows of the LCM– Determine the rate of convergence toward correct
classification
Ex: 1 1
2 2
0.4 0.6( ) 0.0704
0.2 0.8
0.5 0.2 0.30.1 0.5 0.4 ( ) 0.26930.3 0.1 0.6
s
s
A D A
A D A
⎡ ⎤= ⇒ =⎢ ⎥⎣ ⎦⎡ ⎤⎢ ⎥= ⇒ =⎢ ⎥⎢ ⎥⎣ ⎦
LCM Examples
⎥⎦
⎤⎢⎣
⎡ −8.02.0
1 1111
2
1
21
aaTT
True
TTObserved
LCM
Determinant of GCM
6.0257.0070.0019.00.0029.08.06.04.03.02.01.0
*12
11
KLa
*Symmetric KL distance based on harmonic mean – greater the KL distance, faster the convergence
Predict Kinematics Fusion Performance in Dynamic Sensor Networks
• Analytical Formulations for Predicting Sensor Network Performance in “Real World” Conditions is Important
– In general, very little has been done to develop theoretical and analytical solutions for sensor networks with imperfect communications
– Existing theory assumes perfect network performance, but typical tactical networks experience significant message losses
• Prediction of Steady State Performance for Decentralized Sensor Network with Imperfect Communications
– Deployed sensor networks must deal with issues such as multipath fading, limited communications range, etc.
– Exact solution in nondeterministic networks is complex and computationally intensive – currently requires Monte Carlo (MC) simulation
– Determine Performance Across Range of Parameter Values (Covariance Ratios, Network Size, Network Topology, etc.)
Goal & Approach
• Goal: Develop Analytical Methods to Evaluate Steady State Performance of Sensor Networks with Imperfect Communications
– Formulation should be analytically and computationally simple– Must be able to incorporate non-deterministic factors– Must be reliable across the range of typical operating conditions• Simplified Prediction Formulations can Enable Better
Development and Design of Sensor Networks– Derive theoretical formulations and evaluate performance relative to a
MC simulation model– Start with simple network models to understand performance
characteristics with respect to message loss rates, covariance ratios, network size, network topology
• Choice of fusion algorithm has always been based on the network architecture, communication constraints, node processing capabilities – The network structure and communication pattern create path
link redundancies – Choosing the right fusion algorithm is based on the need to
minimize the estimation errors• Many scalable fusion algorithms are available
• Performance Modeling for Information Fusion– Fusion performance modeling and analysis – For both kinematics and classification performance in distributed
sensor networks
• Evaluate classification performance of a multisensor system– Model a multisensor fusion system with a Bayesian network– Define GCM as a performance metric – Develop analytical model to evaluate the classification
performance off-line
• Kinematics Fusion Performance – Develop analytical and efficient simulation approach– Provide performance bounds dynamic ad hoc sensor networks
Future Directions
• Current Research in Wireless Networking and Sensing is Focusing on Adaptation and Cognitive Mechanisms– Achieve reliability and performance gains– Enable energy efficient strategies for sensing
• Cognitive and Adaptive Mechanisms Need Flexible Information Fusion and Management– Mobile wireless devices need to cooperate across the network– Need flexibility but also energy and bandwidth efficiency
• Cognitive Information Fusion– Apply Adaptive and Cognitive Processes to the Information Fusion– Enable each fusion node to make trades on fusion performance
vs. communications demands and processing loads in real time– Develop methodologies for adaptive model resolution to balance
Fusion Algorithms,” to appear in IEEE Trans. on Aerospace and Electronic Systems. – Todd Martin and KC Chang, “Performance of Decentralized Information Fusion in
Ad Hoc Communications Networks,” submitted to Journal of Advances in Information Fusion.
– Wei Sun and KC Chang, “Message Passing for General Hybrid Bayesian Networks: Representation, Propagation and Integration”, to appear in IEEE Trans. on Aerospace and Electronic Systems, Oct., 2009.
• Conference Proceedings Papers– Rommel Carvalho and KC Chang, “A Performance Evaluation Tool for Multi-Sensor
Classification Systems,” in Proc. 12th International Conference on Information Fusion, Seattle, July, 2009. Received one of the top 12 student paper travel award.
– Shozo Mori, CY Chong, and KC Chang, “Track Association and Fusion Using Janossy Measure Density Functions,” in Proc. 12th International Conference on Information Fusion, Seattle, July, 2009.
– KC Chang and Vikas Kotari, “An Epidemic Model for Biological Data Fusion in Ad Hoc Sensor Networks,” in Proc. SPIE Defense and Security Symposium, Orlando, Florida, April, 2009.
– KC Chang, “Distributed Autonomous and Scalable Data Fusion and Dissemination in Net-Centric World,” in Proc. Fusion 2008, Cologne, Germany, July, 2008.
– KC Chang, CY Chong, and Shozo Mori, “On Scalable Distributed Sensor Fusion,” in Proc. Fusion 2008, Cologne, Germany, July, 2008. Runner-up, Best Paper award.