33
| Date post: | 11-Aug-2014 |
| Category: |
Data & Analytics |
| Upload: | trina-chiasson |
| View: | 6,522 times |
| Download: | 32 times |
Information Graphics for EveryoneTrina Chiasson, @trinachi


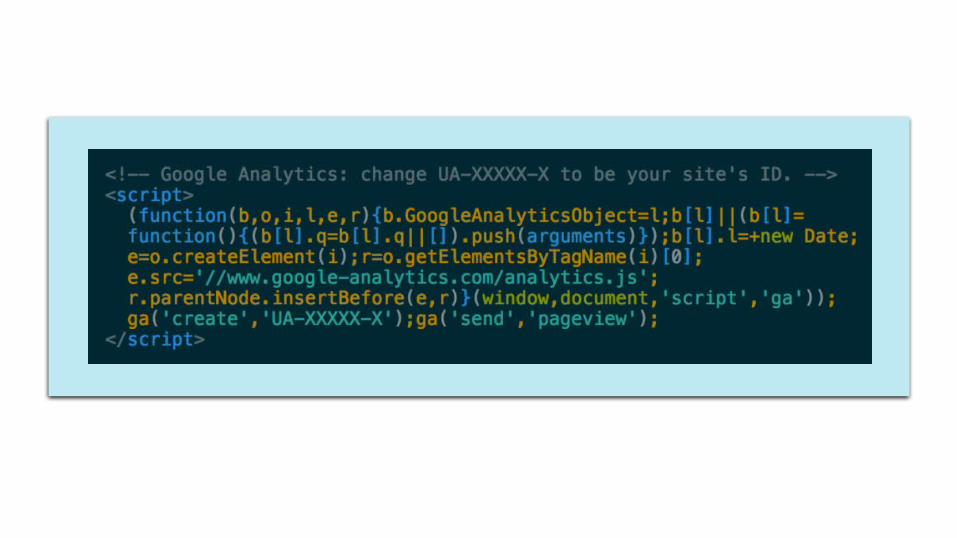
I did nonprofit stuff
We had lots of data


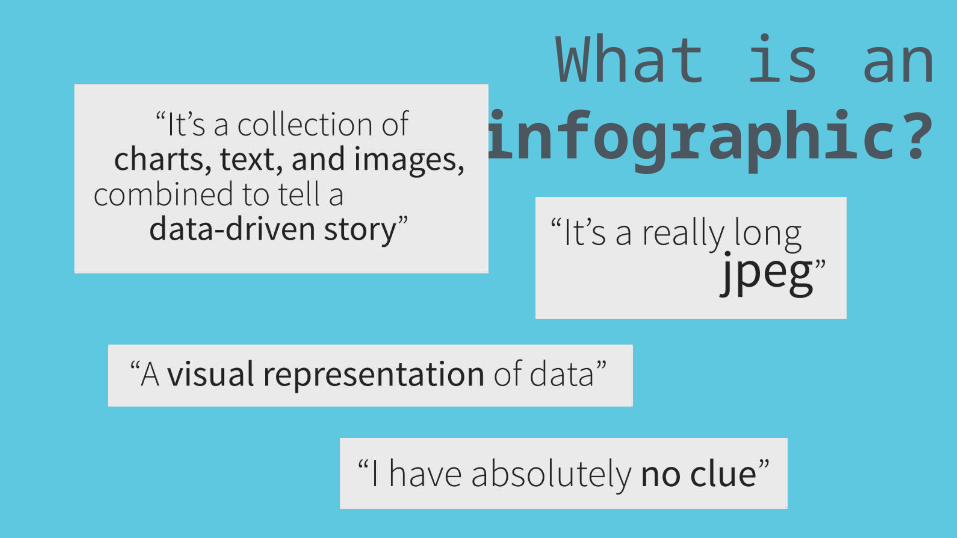
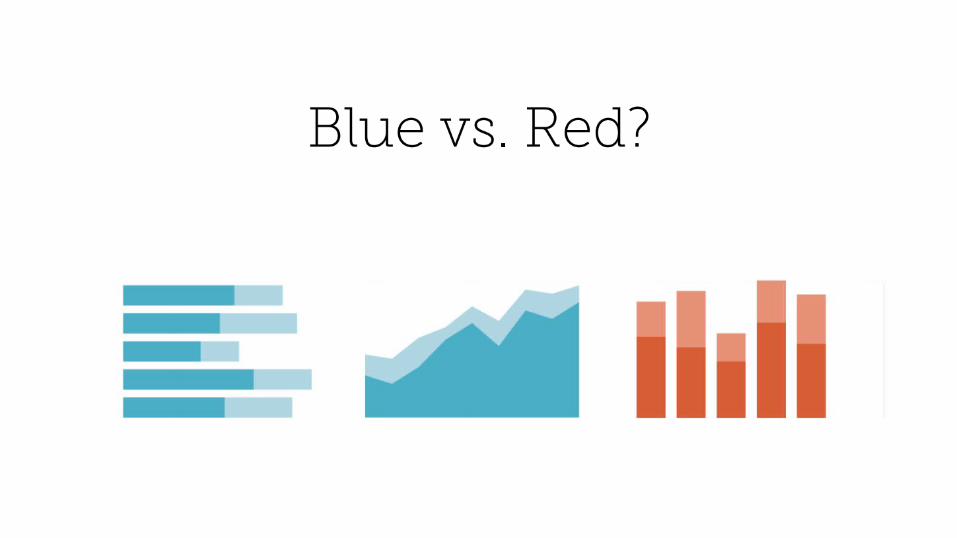
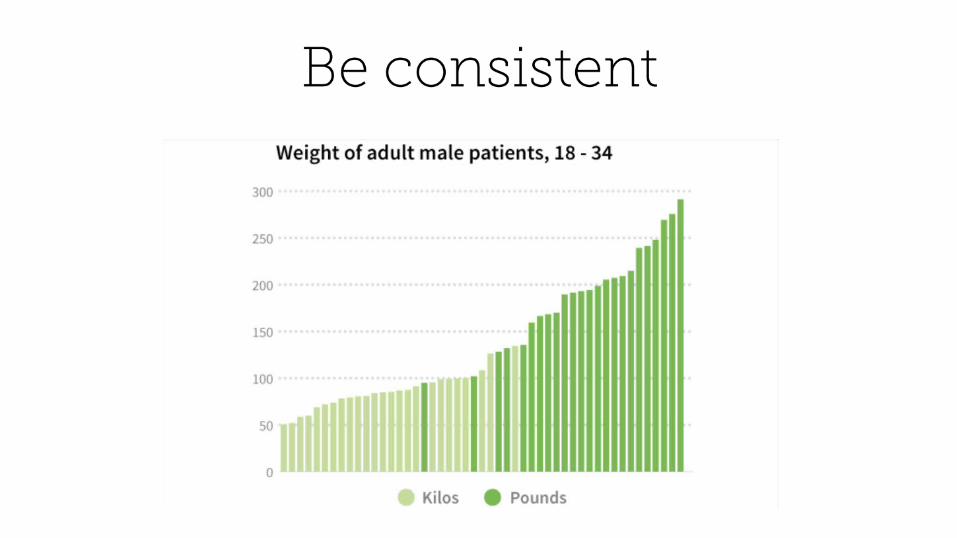
What is aninfographic?
A graphic that presents data
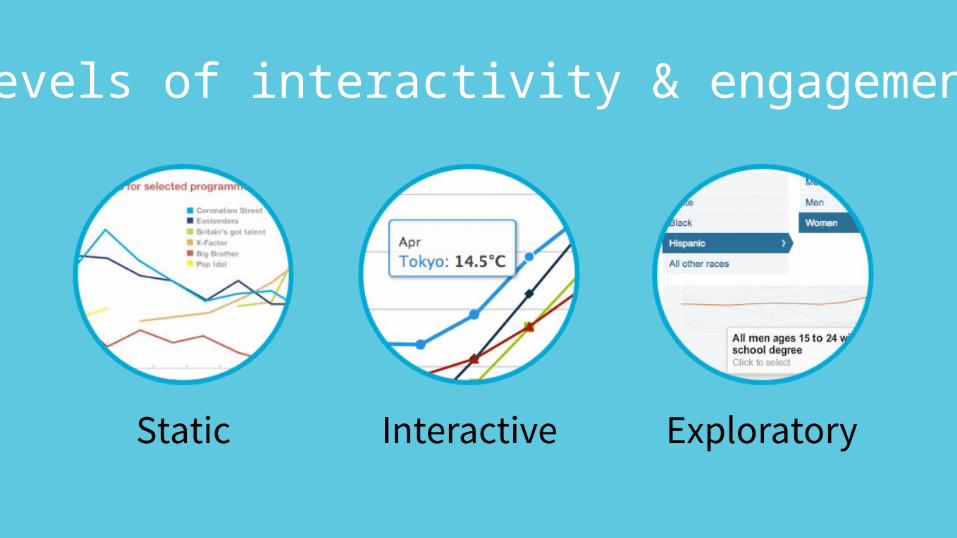
Levels of interactivity & engagement
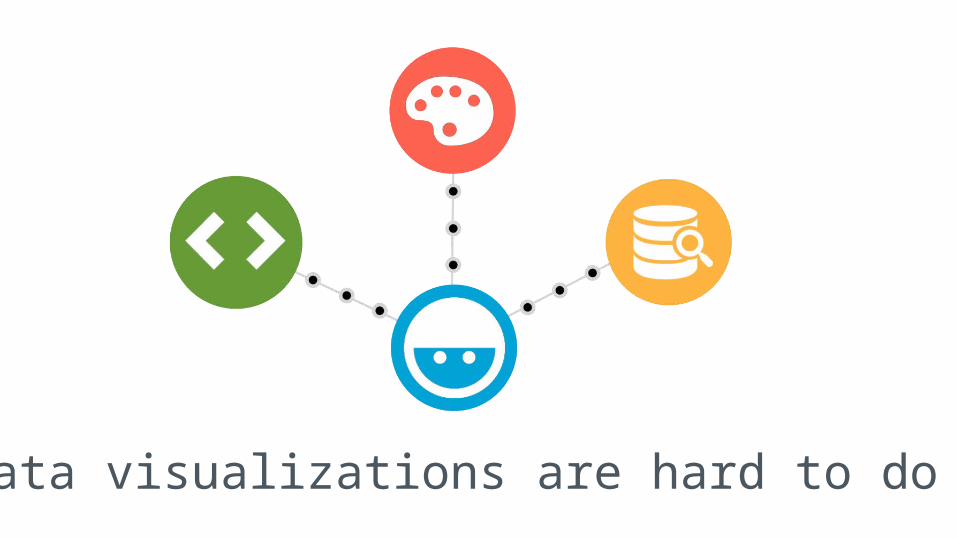
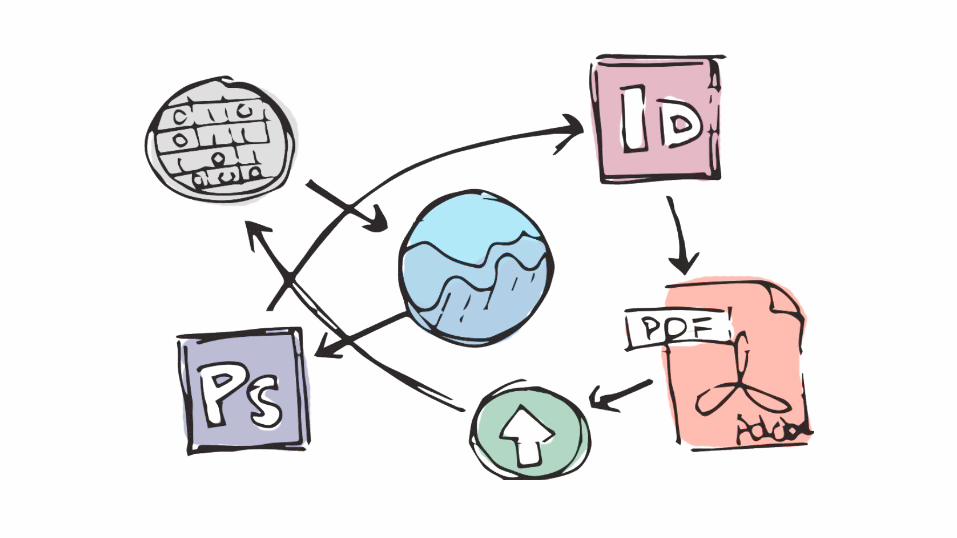
Data visualizations are hard to do

Can software help?
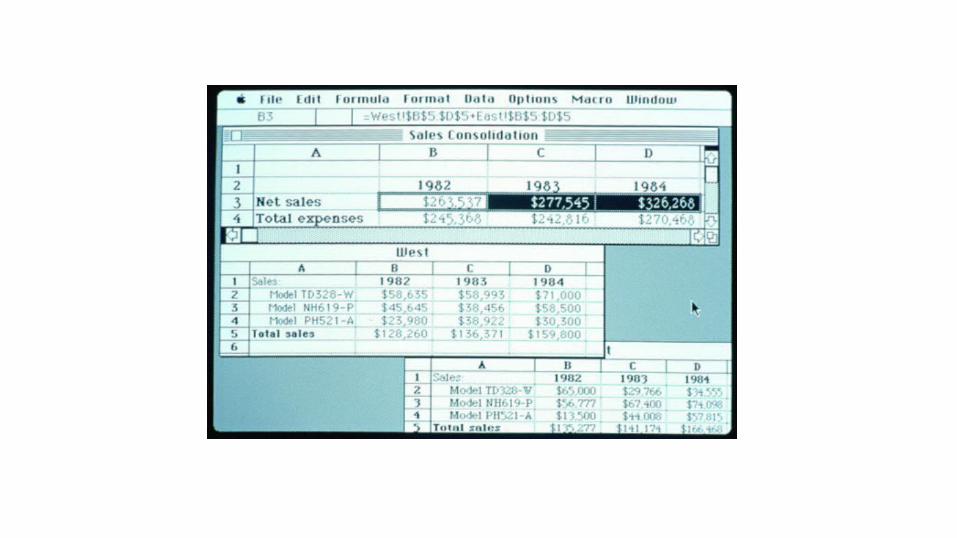
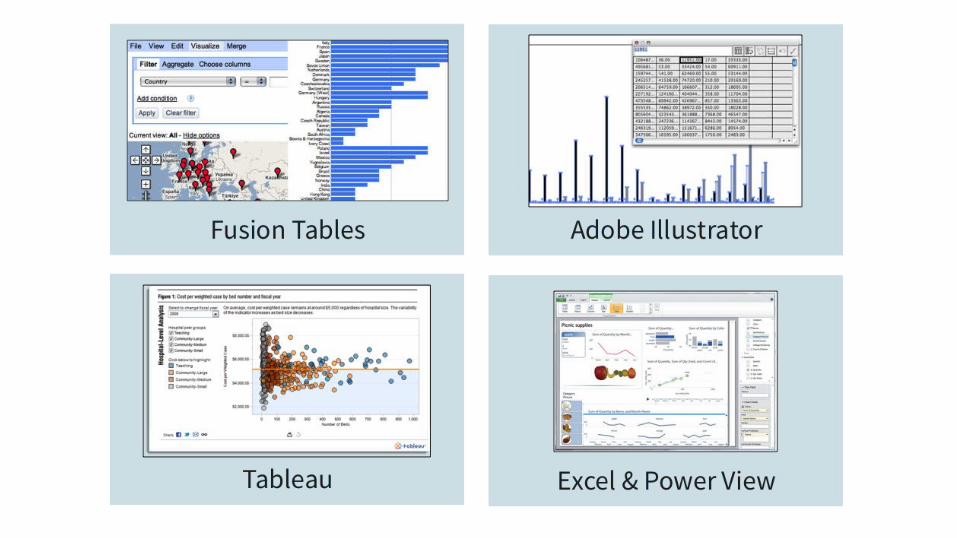
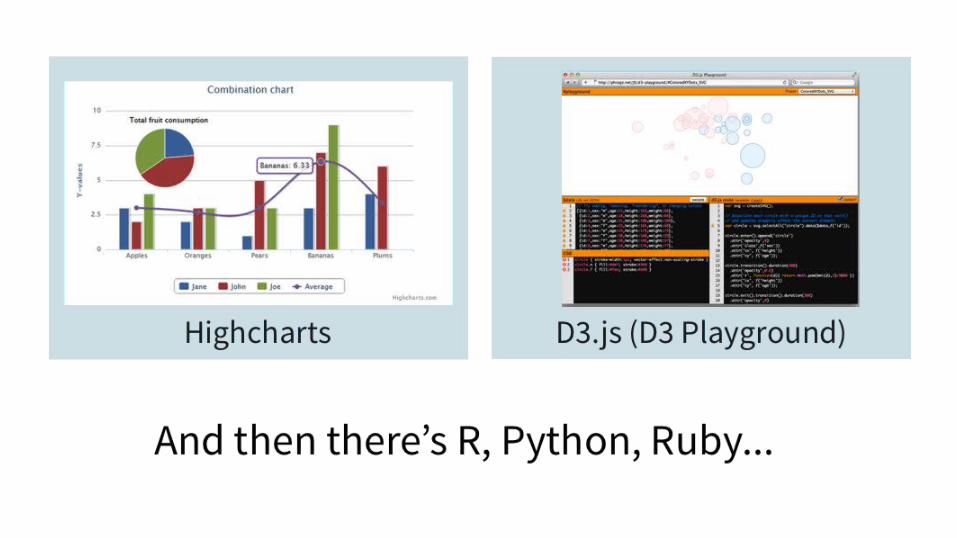
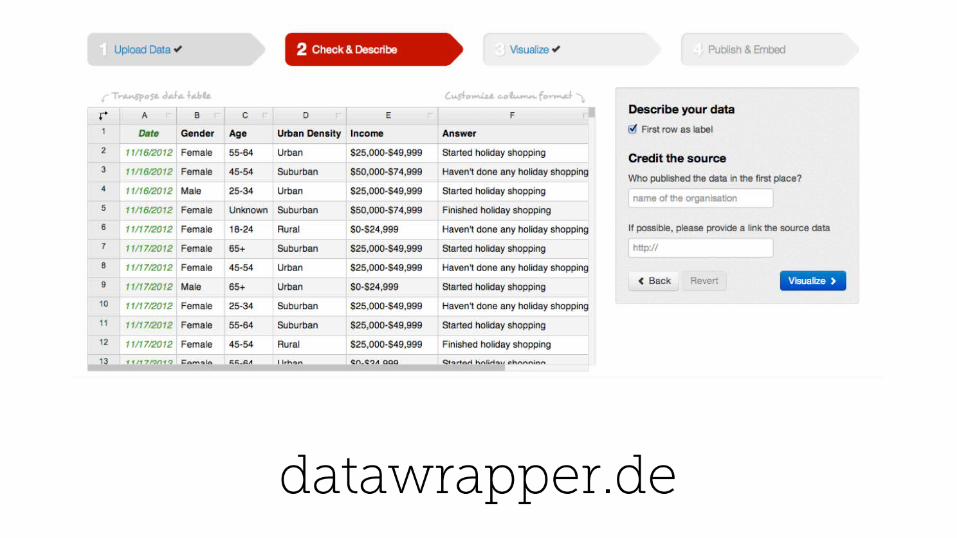
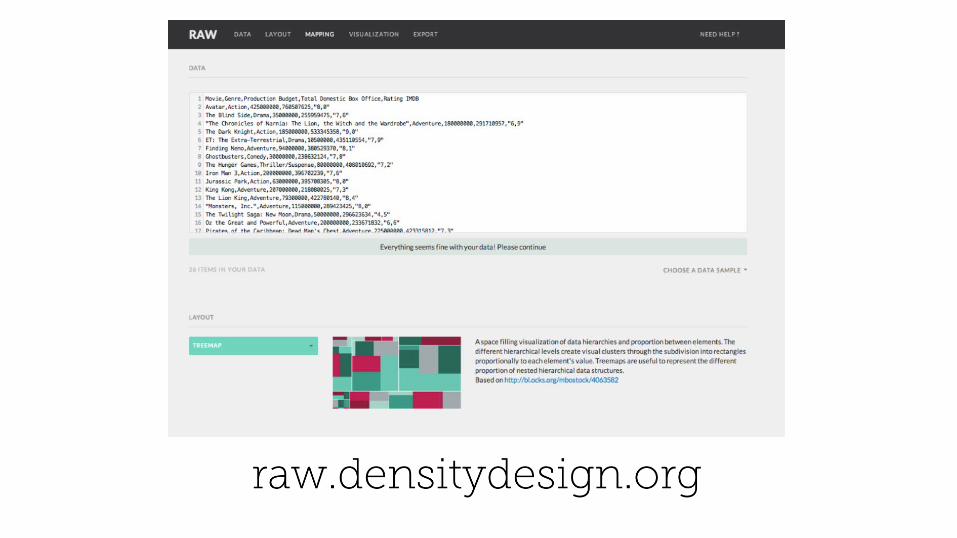

The perfect software doesn’t exist
Adventures in building datavis software:
infoactive.co
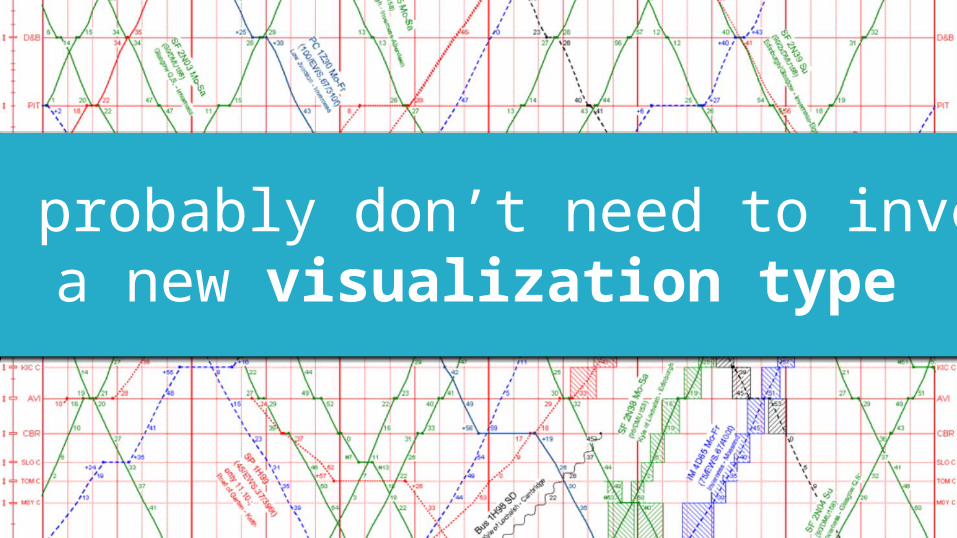
You probably don’t need to inventa new visualization type
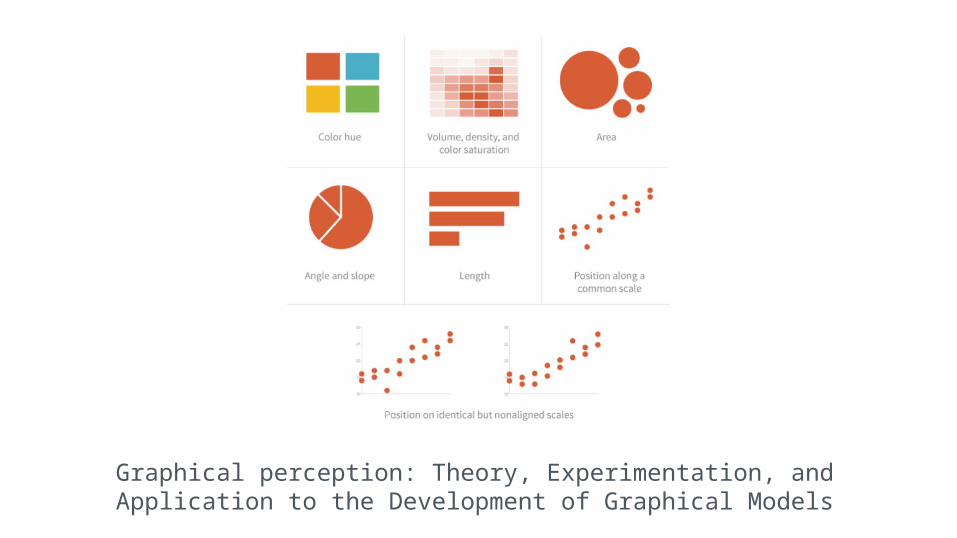
Graphical perception: Theory, Experimentation, and Application to the Development of Graphical Models
Questions?
infoactive.co/ebook • @DataDesignBook • @Infoactive
Trina Chiasson • [email protected] • @trinachi


