34
Heatmap – MySuper products November 2019 INFORMATION PAPER INFORMATION PAPER
Heatmap – MySuper products November 2019
INFORMATION PAPER
INFORMATION PAPER

AUSTRALIAN PRUDENTIAL REGULATION AUTHORITY 2
Disclaimer and Copyright
While APRA endeavours to ensure the quality of this publication, it does not accept any responsibility for the accuracy, completeness or currency of the material included in this publication and will not be liable for any loss or damage arising out of any use of, or reliance on, this publication.
© Australian Prudential Regulation Authority (APRA)
This work is licensed under the Creative Commons Attribution 3.0 Australia Licence (CCBY 3.0). This licence allows you to copy, distribute and adapt this work, provided you attribute the work and do not suggest that APRA endorses you or your work. To view a full copy of the terms of this licence, visit https://creativecommons.org/licenses/by/3.0/au/

AUSTRALIAN PRUDENTIAL REGULATION AUTHORITY 3
Contents
Executive summary 4
Chapter 1 - Introduction 6
Chapter 2 - Heatmap – objectives and use 8
Chapter 3 - Heatmap – elements and presentation 10
Chapter 4 - Investment performance 13
Chapter 5 - Fees 18
Chapter 6 - Sustainability of member outcomes 21
Chapter 7 - Ongoing work to improve member outcomes 24
Appendix A - Heatmap metrics 26
Appendix B – Indices 29
Appendix C – Example SRP calculation 32

AUSTRALIAN PRUDENTIAL REGULATION AUTHORITY 4
Executive summary
In its 2019 Corporate Plan1, APRA identified improved member outcomes in superannuation as one of the key strategic outcomes it is seeking to deliver for the Australian community. APRA is seeking to do this through four mutually-reinforcing streams of work:
- strengthening its prudential standards2;
- intensifying its supervision approach3;
- enhancing its superannuation data collection4; and
- improving industry transparency.
The MySuper product heatmap (“the Heatmap”) provides a major enhancement to industry transparency. The Heatmap is designed to provide stakeholders with insights into the outcomes being delivered by Registrable Superannuation Entity (RSE) licensees, in particular for investment returns and fees and costs, by providing information that is credible, clear and comparable for all MySuper products. The Heatmap enables like-for-like comparisons of outcomes and seeks to foster a culture of continuous improvement across the superannuation industry. The primary users of the Heatmap will be RSE licensees. However, the insights the Heatmap provides will benefit a wide range of stakeholders including policymakers, advisers and employers.
APRA is integrating the Heatmap into its risk assessment and supervisory intensity model, which is aligned with its new enforcement approach. This ensures that the insights provided in the Heatmap lead to a level of supervisory intensity and oversight that appropriately reflects the quality of the outcomes being delivered by each RSE licensee and that RSE licensees with continued areas of underperformance are subject to more intense supervisory action.
The Heatmap provides information on measures that APRA considers central to member outcomes – investments, fees and sustainability. The sustainability measures seek to provide an indication of an RSE licensee’s ability to provide sound member outcomes in future and to address areas of underperformance.
In developing the Heatmap, APRA has included metrics that reflect outcomes relative to peers and appropriate benchmarks. For investment performance, measures of performance relative to benchmark portfolios provide additional insights into the value that RSE licensees add in setting and implementing the investment strategy for their MySuper products.
1 2019 – 2023 APRA Corporate Plan 2 Prudential Standard SPS 515 Strategic Planning and Member Outcomes (SPS 515). 3 Media Release APRA releases new Enforcement Approach. 4 Media Release APRA’s Superannuation Data Transformation to enhance industry transparency and accountability.

AUSTRALIAN PRUDENTIAL REGULATION AUTHORITY 5
The default view for the Heatmap is a concise view, which highlights a subset of metrics that APRA considers most informative and useful to consider in assessing the outcomes being delivered by RSE licensees. However, the concise view can be expanded to view a wider suite of metrics that APRA has developed, which provide additional insights into the outcomes RSE licensees and their MySuper product(s) are delivering to their members.
APRA will periodically refresh the Heatmap to incorporate new data submitted to APRA. As work on assessment of member outcomes evolves, APRA will also develop metrics for insurance, as this is another important component of member outcomes. Over time, APRA will also extend its assessment to Choice products as additional data becomes available. APRA welcomes feedback from all stakeholders as it progresses its member outcomes assessment work.

AUSTRALIAN PRUDENTIAL REGULATION AUTHORITY 6
Chapter 1 - Introduction
In recent years, APRA has sought to focus RSE licensees’ attention on improving overall outcomes for their superannuation members. In doing this, APRA has increased its supervisory focus on RSE licensees that are not consistently delivering quality member outcomes, or have governance, risk, operational, or financial management arrangements that fall short of sound practice. APRA will continue to intensify its efforts in this regard, to address the issues highlighted by the Royal Commission5 and Productivity Commission6 and drive long-term and sustained improvements in industry practice. Through this work, APRA will seek to engender a culture of continuous improvement across the superannuation industry.
To facilitate this, APRA is strengthening its prudential standards. APRA has recently released Prudential Standard SPS 515 Strategic Planning and Member Outcomes (SPS 515) to lift industry standards and practices in these important areas.7 SPS 515 requires an RSE licensee to manage its business operations in a sound and prudent manner, including rigorously assessing performance across its business operations. To this end, SPS 515 requires an RSE licensee to undertake annually a holistic assessment of its performance across its business operations, services and products, including considering whether it expects to continue to be able to deliver quality outcomes to its members into the future (Business Performance Review).
APRA is intensifying its supervision approach by devoting more resources to supervision, realigning its supervision teams into a single superannuation supervision division and, where necessary, employing a ‘constructively tough’ enforcement approach. APRA will also continue to seek enhancements in industry practices by undertaking ‘deep dives’ into areas where improvements can be made and publishing the findings of these reviews. To further enhance transparency APRA will increase the entity level information that is published following these reviews, on both better practices and areas for improvement.
APRA is in the process of significantly enhancing its superannuation data collection and improving its data capabilities through its Superannuation Data Transformation (SDT) program- a three phase, multi-year program of work that seeks to expand, deepen and refine the data collected from the industry. The SDT program is being undertaken in parallel with replacement of APRA’s data collection tool with a modern, fit for the future system for industry to use when delivering data to APRA.
APRA is improving transparency across the superannuation industry. The release of the Heatmap is one major step in this process by providing credible, clear and comparable information for all MySuper products. This will enable stakeholders to hold RSE licensees accountable for the member outcomes they deliver and it is expected to lead to improved
5 The Royal Commission into Misconduct in the Banking, Superannuation and Financial Services Industry. 6 The Productivity Commission inquiries into Superannuation: Assessing Efficiency and Competitiveness and
Competition in the Australian Financial System. 7 SPS 515 commences on 1 January 2020.

AUSTRALIAN PRUDENTIAL REGULATION AUTHORITY 7
member outcomes, particularly for those RSE licensees with products that are underperforming. APRA will further enhance transparency on RSE licensee operations and the outcomes they deliver as the SDT program progresses.
Collectively, these four mutually-reinforcing streams of work will enable APRA to drive a culture of continuous improvement delivering enhanced member outcomes and supporting improved financial performance and efficiency across the entire superannuation industry.

AUSTRALIAN PRUDENTIAL REGULATION AUTHORITY 8
Chapter 2 - Heatmap – objectives and use
The objective of the Heatmap is to provide credible, clear and comparable insights into the outcomes provided by MySuper products in a number of key areas. The Heatmap is expected to drive improvements in outcomes for members by holding RSE licensees publicly accountable for their performance, and in particular highlighting areas of underperformance.
Consistent with the requirements of SPS 515, APRA expects RSE licensees to look beyond the Heatmap to also consider:
• a broader range of metrics appropriate to their business operations;
• qualitative factors relevant to the delivery of outcomes, such as governance, risk, operational and financial management practices (including strategic and business planning); and
• outcomes being achieved for members with particular characteristics or needs, for example in relation to insurance, using cohort analysis.
Extending the consideration of performance in line with SPS 515 will enable RSE licensees to make a holistic assessment of their overall performance and the outcomes being delivered across their business operations, services and products.
APRA expects that, through consideration of the Heatmap and meeting the requirements of SPS 515, RSE licensees will take action to improve member outcomes. As a result, the quality of MySuper products and the outcomes being provided to members across the entire industry should be enhanced.
The insights provided by the Heatmap can also be used by other stakeholders, such as policymakers and other regulators. It will assist employers and advisers in selecting appropriate products for their employees or clients, and members in better understanding the outcomes being provided by their RSE licensee and MySuper product.
It is important to note that the Heatmap does not provide information on all the relevant factors that should be considered in assessing the performance or appropriateness of a particular MySuper product. Accordingly, the Heatmap should not be used in insolation to inform decisions regarding an individual employer, adviser or member’s choice of a MySuper product.8
APRA will use the Heatmap to inform its supervision priorities, in conjunction with other information on relevant areas of RSE licensees’ operations, including governance, risk and control frameworks. APRA supervisors undertake risk assessments of RSE licensees covering a wide range of areas, including their performance in the broader context of member outcomes. This enables supervisors to identify areas of concern or requiring
8 Useful information for consumers seeking to better understand superannuation can be found on the Australian Securities and Investments Commission’s MoneySmart website.

AUSTRALIAN PRUDENTIAL REGULATION AUTHORITY 9
improvement, and to seek to have them addressed promptly. If an RSE licensee is unable or unwilling to respond appropriately, APRA will consider options for greater coercive action to ensure its concerns are addressed and member outcomes are improved. In some cases, where the RSE licensee is unable to demonstrate a sustainable pathway into the future, this may require the RSE licensee to restructure or exit the industry.

AUSTRALIAN PRUDENTIAL REGULATION AUTHORITY 10
Chapter 3 - Heatmap – elements and presentation
The Heatmap metrics
The Heatmap represents the culmination of over 12 months of analysis, and builds on earlier work on performance assessment undertaken by APRA in 2017/18.9
The Heatmap metrics are based primarily on APRA reported data from RSE licensees, and include:
• investment performance metrics over three and five-year time horizons for MySuper products, and for each lifecycle stage (where relevant);
• administration and total fees metrics covering representative member account balances of $10,000, $25,000, $50,000, $100,000 and $250,000; and
• sustainability metrics, including member account and net cash flow measures that provide an insight into the ability for an RSE licensee to continue to provide appropriate member outcomes.
The Heatmap metrics apply to all MySuper products, including lifecycle products.10 This is to ensure that the multiple investment strategies of each MySuper lifecycle product are appropriately reflected in APRA’s assessment approach.
APRA engaged external consultants to review the methodology supporting the selection and calculation of the Heatmap metrics. The consultants supported APRA’s approach and, in some areas such as the use of reference benchmark portfolios, considered it to be better practice. Suggested areas for future improvement largely require improved data that APRA is actioning as part of its SDT program, particularly to include Choice products and investment options.
Displaying the metrics
To improve the ability of stakeholders to interpret the Heatmap, APRA has considered better practice in data visualisation. As such, the Heatmap is presented with a colour overlay that seeks to provide stakeholders with a visual illustration of the outcomes provided by MySuper products relative to peers and appropriate benchmarks. The colour overlay particularly focuses on areas of products that are underperforming relative to other products or the selected benchmarks.
9 31 August 2017 APRA letter: Assessing quality member outcomes in the superannuation industry. 10 Lifecycle products contain investment strategies that change based on a member’s age to reflect the member’s
overall risk profile based on industry averages.

AUSTRALIAN PRUDENTIAL REGULATION AUTHORITY 11
The colour overlay has a continuous colour gradient rather than a small number of discrete colours. This approach has been taken so that the Heatmap emphasises areas of material underperformance, and is not categorising products as ‘good’ or ‘poor’ overall. The Heatmap metrics have been mapped to the ‘heat’ colour scale using thresholds that best reflect each individual metric. Further detail on these scales is outlined in each of the chapters on investment performance, fees and sustainability of member outcomes.
Viewing the Heatmap
The Heatmap has two views, a concise view and an expanded view. The concise view of the Heatmap shows eight key metrics that APRA considers particularly important for assessing member outcomes based on underlying analysis of the data. APRA will review these metrics over time to ensure the most relevant and important measures of member outcomes are highlighted.
Table 1. Concise view metrics
Area Concise View Metric
Investment Performance
5 year net investment return (NIR)
5 year NIR relative to simple reference portfolio
Fees
Administration fees on a $10,000 representative balance
Administration fees on a $50,000 representative balance
Total fees on a $10,000 representative balance
Total fees on a $50,000 representative balance
Sustainability
Adjusted total accounts growth rate
Net cash flow ratio
The Heatmap in its expanded view shows 21 metrics that APRA uses to evaluate the outcomes of MySuper products based on data provided by RSE licensees. The expanded view provides stakeholders with broader insights into investment performance and the impact of fees for different member account balances.

AUSTRALIAN PRUDENTIAL REGULATION AUTHORITY 12
Table 2. Expanded view metrics
Area Expanded View Metrics
Investment Performance
3 and 5 year net return (for $50,000 representative balance)
3 and 5 year net investment return (NIR)
3 and 5 year NIR relative to a simple reference portfolio
3 and 5 year NIR relative to the strategic asset allocation benchmark portfolio
Fees
Administration fees on all representative balances ($10,000, $25,000, $50,000, $100,000 and $250,000)
Total fees on all representative balances ($10,000, $25,000, $50,000, $100,000 and $250,000)
Sustainability
Adjusted Total accounts growth rate
Net cash flow ratio
Net rollover ratio
Future development of the Heatmap
The Heatmap will be released at least annually. For each iteration of the Heatmap APRA will:
• review the metrics to ensure appropriate benchmarks and thresholds are being applied to appropriately reflect improvements across the industry;
• establish which metrics should be displayed in the concise view to ensure that the key metrics at the time the Heatmap is released are highlighted; and
• incorporate additional or alternative metrics and/or products and investment options to reflect subsequent improvements in collected data. For example, APRA expects to incorporate insurance metrics in the next iteration of the Heatmap.
To assist in developing subsequent iterations of the Heatmap, APRA welcomes input and feedback from stakeholders on areas where the Heatmap can be improved, or additional metrics that could be incorporated to provide greater insights into the performance of RSE licensees and the outcomes they are delivering to their members.

AUSTRALIAN PRUDENTIAL REGULATION AUTHORITY 13
Chapter 4 - Investment performance
When evaluating investment performance, each product has its own unique membership, return objectives and risk profile, which will influence its investment strategy and, ultimately, the investment returns that are achieved for members. To account for these differences, APRA has analysed a number of different investment metrics to assess performance on a risk-adjusted basis and to consider an RSE licensee’s performance relative to peers.
The Heatmap measures investment performance over three and five-year time horizons using data reported to APRA, where this history exists. APRA notes that long-term investment performance is a critical driver of outcomes for members, and that performance over different time periods provides insights into the sustainability and consistency of investment performance over time. APRA has used five-year performance as the longest period currently available, given the commencement of most MySuper products on 1 January 2014. As APRA builds its time series of investment performance, future releases of the Heatmap are expected to include longer time horizons (e.g. seven years and ten years).
Benchmark portfolio metrics
APRA has constructed benchmark portfolios as part of the analysis to provide risk-adjusted insights into the performance of each product/lifecycle stage. The Net Investment Return (NIR) of each MySuper product/lifecycle stage has been measured against a Simple Reference Portfolio (SRP) and a Strategic Asset Allocation (SAA) benchmark portfolio; both portfolios are product-specific and tailored to reflect the investment strategy and level of risk of the product or lifecycle stage.
Reference and benchmark portfolios are the primary measures APRA uses to evaluate the investment performance of MySuper products. APRA considers these measures to be objective and to provide useful insights into an RSE licensee’s ability to add value for its members. Where an RSE licensee’s investment process utilises active management, makes tilts to its asset allocation or invests in illiquid or complex assets, it is expected to be able to demonstrate the value add (after fees, costs and taxes) from these activities over time.
The returns on both the SRP and benchmark portfolio have been calculated using SAA data reported to APRA on a quarterly basis, to reflect any changes an RSE licensee may have made to the SAA over time.
Appendix A provides the formulae used to calculate the returns for the SRP and listed SAA benchmark portfolio.
Simple Reference Portfolio The SRP is a notional, “a priori” portfolio of passive, low cost and liquid investments. The purpose of the SRP is to measure the value an RSE licensee has generated for its members through its value adding activities, such as its strategic asset allocation decisions. A bespoke SRP is created for each product/lifecycle stage to appropriately reflect its own risk profile. The risk profile of each product/lifecycle stage has been established by applying a consistent

AUSTRALIAN PRUDENTIAL REGULATION AUTHORITY 14
definition of growth and defensive assets as outlined in Table 4 below, to the SAA reported to APRA. APRA considers this an appropriate basis on which to benchmark performance and the ability of an RSE licensee to develop and implement an effective investment strategy. It is important to note that the SRP is not intended to be an indicator of how an RSE licensee should invest; rather it provides a benchmark to assess performance that is suitable for the long time horizon of superannuation and is based on the product’s target risk-return expectations.
The SRP consists of a growth portfolio and a defensive portfolio utilising only equities, bonds and cash (Refer Table 3 below).
Table 3. Growth and Defensive Portfolio (Asset breakdown)
Growth Portfolio % Defensive Portfolio %
Australian equity 50 Australian fixed interest 40
International equity (hedged) 25 International fixed interest 40
International equity (unhedged) 25 Australian Cash 20
A return is calculated for both the growth portfolio and the defensive portfolio by applying index returns (see Appendix B for details of indices used) for each asset class and the weightings in Table 3.
The returns on the growth and defensive portfolios are then combined to determine the benchmark return for each product using the specific growth / defensive asset allocation for each product/lifecycle stage.
Table 4. Growth/Defensive Classification
SAA Asset Class Growth / Defensive classification
Equity, Listed Property, Listed Infrastructure 100% Growth
Unlisted Property, Unlisted Infrastructure 75% Growth, 25% Defensive
Commodities, Other 50% Growth, 50% Defensive
Fixed Interest, Cash 100% Defensive
Assets reported by RSE licensees with a “Not Applicable” classification have been treated as being “Listed”.
The NIR for each product/lifecycle stage is then compared to the return on its bespoke SRP to determine the performance of the product/lifecycle stage relative to the SRP over the period (i.e. whether it under/outperformed the benchmark).
Appendix C provides an illustrative example of how the return of the SRP is calculated and measured relative to a product’s net investment return.

AUSTRALIAN PRUDENTIAL REGULATION AUTHORITY 15
Listed SAA benchmark portfolio The purpose of the listed SAA benchmark portfolio is to assess the value generated through an RSE licensee’s implementation of its investment strategy. The listed SAA benchmark portfolio has been created using the reported SAA for each product/lifecycle stage. The benchmark portfolio assumes investment in listed passive benchmarks for each asset class, consistent with the objective of MySuper being a simple, cost-effective product.
In undertaking its analysis, APRA has made a number of assumptions when mapping the reported SAA’s. In particular, a benchmark of 50% domestic and 50% international has been used for asset classes where no domicile has been reported. APRA has also used the reported currency hedging ratios for the International Equities asset class in calculating the performance of the SAA reference portfolio. Fully hedged benchmarks have been used by APRA for international property, infrastructure and fixed interest, where industry practice is that hedging is close to 100%.
Adjustments To ensure an appropriate comparison can be made between the performance of products/lifecycle stages to the reference and benchmark portfolios, APRA has incorporated adjustments in areas such as taxes and fees into the calculations of reference and benchmark portfolio performance. In particular:
• Each asset class benchmark has been adjusted to take into account long term assumptions for actual and accrued tax, based on respective income and capital components. The Australian equity benchmark has also been adjusted to reflect franking credits. See Appendix B for the tax assumptions used in this analysis.
• Where available, APRA has selected global indices that are adjusted to reflect the withholding taxes applicable for an Australian institutional investor, to remove any potential understatement of index performance arising from the presence of double taxation treaties. APRA considers the use of these benchmarks to be good practice; particularly where there are wider implications such as the payment of performance based fees and remuneration.
• Fee assumptions have been incorporated into the index returns to reflect the fees that would be payable by an institutional investor investing passively. Estimates were derived using relevant exchange traded funds (ETFs) as a reference point. See Appendix B for the fee assumptions used in this analysis.
Net return and net investment return metrics The comparison of absolute performance across MySuper products should take into account the investment objectives and level of risk for each product/lifecycle stage to enable a like-for-like assessment of performance. To reflect the varying risk profiles in the industry, the colours in the Heatmap indicate the performance of each product/lifecycle stage relative to the performance of its peers based on the growth asset allocation of each product/lifecycle stage. To do this, APRA has taken the performance of each product/lifecycle stage and plotted it against their average allocation to growth assets over the appropriate timeframe to inform a peer-derived trend line (see 5 year NIR vs growth asset allocation chart below). The relative performance of each product/lifecycle stage is measured based on the difference

AUSTRALIAN PRUDENTIAL REGULATION AUTHORITY 16
between its performance and the appropriate reference point on the trend line. This provides a method of comparing the performance of each MySuper product/lifecycle stage in the industry on a risk-adjusted basis.
APRA views this approach as superior to the standard industry practice of evaluating peer relative performance based on relatively wide growth allocation bands, which tends to unfairly disadvantage products at the lower end of each band.
Lifecycle strategies
A lifecycle MySuper product is one that aims to manage investment risk throughout a member’s lifetime. The investment strategy of a lifecycle product is broadly characterised by its 'glidepath', which seeks to reflect a member’s risk profile by having a larger exposure to growth assets when a member is young and de-risking to a higher proportion of defensive assets as a member is approaching retirement. Assessing the performance of lifecycle MySuper products that are implemented through a number of lifecycle stages is challenging, given the investment period analysed is generally shorter than the glidepath. In addition, comparing the performance of lifecycle products is complex due to the variability in design and implementation approaches across different products.
The Heatmap assesses the performance of each lifecycle stage based on the various metrics and also provides an overall assessment at the lifecycle product level. To assess performance at a product level, APRA has assumed that members invest in lifecycle products from age 20 to age 65. This is calculated using a weighted average of the performance of the underlying lifecycle stages; the weights for each lifecycle stage are based on the time spent in each lifecycle stage and an assumed contribution experience (a single annual contribution each year from 20 to 65).

AUSTRALIAN PRUDENTIAL REGULATION AUTHORITY 17
Colour overlay
The colour scale displayed in the Heatmap is based on the performance of the product/lifecycle stage relative to different metrics. The method for colouring each metric is as follows:
Net Return: Net Return relative to the appropriate reference point in the Net Return / growth asset allocation trend line
• Net Investment Return (NIR): NIR relative to the appropriate reference point in the NIR / growth asset allocation trend line
• SRP: NIR relative to the SRP
• Listed SAA benchmark portfolio: NIR relative to the listed SAA benchmark portfolio
Colours are applied based on the level of relative performance and in line with the colour scale below:
Adopting this approach provides a way of easily distinguishing products/lifecycle stages that are outperforming their reference points and highlights the products/lifecycle stages with performance below the relevant reference points. The highest concentration of colour is applied to the products/lifecycle stages that are experiencing returns of more than 0.75% below the corresponding reference point, which indicates significant underperformance.
The concise view
The investment metrics contained in the concise view of the Heatmap are the NIR (5 yr), measured on a peer relative determined basis as outlined above, and the NIR relative to a SRP (5 yr). NIR was chosen for the concise view as it measures the actual investment return that the product/lifecycle stage has generated for members. The NIR relative to the SRP was chosen for the concise view due to the clear, simple insights it can provide an RSE licensee on the value added from its investment process, including SAA, tactical asset allocation and active management.
0.00% -0.38% -0.75%

AUSTRALIAN PRUDENTIAL REGULATION AUTHORITY 18
Chapter 5 - Fees
The Heatmap provides insights into an RSE licensee’s fee structure and its impact on outcomes for members with different account balances. The Heatmap includes metrics for administration fees and total fees of MySuper products reported in Superannuation Reporting Form 703.0 Fees Disclosed (SRF 703.0).11 APRA expects that these fee metrics will serve as a starting point for RSE licensees when assessing the outcomes delivered to members.
The level of fees paid by a member will vary depending on the fee structure (flat or percentage based and fee caps) adopted by an RSE licensee and the individual account balance of the member. The Heatmap therefore shows fees for a range of account balance levels. The range of account balances used has been determined based on the distribution of MySuper member accounts in the industry: $10,000; $25,000; $50,000; $100,000 and $250,000 provides coverage of the majority of account balances in the MySuper population.
APRA acknowledges that different investment approaches and strategies incur different levels of investment fees and indirect costs. This needs to be considered when assessing the overall outcomes delivered to members given the particular investment strategy adopted.
When assessing total fees, APRA notes the varying application of ASIC’s Regulatory Guide 97 Disclosing fees and costs in PDSs and periodic statements across the industry and that this presents challenges in comparability.
Assessing the fees for lifecycle products is complex due to different investment fees and Indirect Cost Ratios (ICR) charged at the life stage level.12 The Heatmap adopts a simplified approach and displays the product-level administration fee and uses a representative lifestage (with the highest number of member accounts) for total fees reported under SRS 703.0. This allows for a more comparable product-level assessment of the member’s fee experience between single-strategy and lifecycle products.
Adjustments Based on a review of MySuper product disclosure statements (PDS), APRA identified some bespoke fee structures that are not accurately captured in reporting under SRS 703.0. As a result, adjustments have been made to ensure they are appropriately reflected in the Heatmap.
APRA also notes that some lifecycle products have a distinct ICR for each lifecycle stage, which cannot be reported under SRS 703.0. APRA has used ICR data for each lifecycle stage from the latest MySuper PDS for the product for the Heatmap to provide a more holistic basis for assessing the fees for these products.
11 Total Fees and Costs includes Administration Fees, Investment Fees and Indirect Cost Ratio. 12 The Indirect cost ratio represents the ratio of the total of the indirect costs for a MySuper product, to the total
average net assets of the superannuation entity attributed to the MySuper product.

AUSTRALIAN PRUDENTIAL REGULATION AUTHORITY 19
Colour overlay
The colour scale has been applied for the fees for the representative account balances of $10,000; $25,000; $50,000; $100,000 and $250,000 using statistical methods to define thresholds. The graduating colour scale for fees shows the relative positioning of a product’s fees based on Median Absolute Deviations (MAD). MAD is used as the measure of variability, to reduce the impact of distortion of outlier values that impact measures such as standard deviation.
Table 5. Distributions across the representative member account balances*
Representative Member Account Balance
Colour Graduation for Administration fees
Administration fees disclosed (% of $10,000 account balance)
1.00% 1.20% 1.40%
Administration fees disclosed (% of $25,000 account balance)
0.50% 0.65% 0.80%
Administration fees disclosed (% of $50,000 account balance)
0.35% 0.48% 0.60%
Administration fees disclosed (% of $100,000 account balance)
0.25% 0.38% 0.50%
Administration fees disclosed (% of $250,000 account balance)
0.20% 0.30% 0.40%
Total fees disclosed (% of $10,000 account balance)
1.80% 2.00% 2.20%
Total fees disclosed (% of $25,000 account balance)
1.30% 1.45% 1.60%
Total fees disclosed (% of $50,000 account balance)
1.15% 1.28% 1.40%
Total fees disclosed (% of $100,000 account balance)
1.05% 1.18% 1.30%
Total fees disclosed (% of $250,000 account balance)
1.00% 1.10% 1.20%
* Colour graduation is based on the distribution of the most recently reported fee data. Threshold levels will be reviewed for each subsequent release of the Heatmap.

AUSTRALIAN PRUDENTIAL REGULATION AUTHORITY 20
The concise view
To provide the most meaningful insights into fees it is important to consider the impact of both administration fees and overall fees for different account balances. The concise view of the Heatmap shows fees for a $10,000 account balance, a representative low account balance13, and a $50,000 account balance, which reflects a representative member in the MySuper Product Dashboard. The $10,000 account balance assesses the impact of administration fees on low account balances, for which these are typically the largest component of Total Fees. The $50,000 account balance enables an assessment of fees for a representative account balance where investment fees and ICR typically account for a larger component of Total Fees.
13 Due to the skewed distribution of member account balances currently in the MySuper population towards lower account balances.

AUSTRALIAN PRUDENTIAL REGULATION AUTHORITY 21
Chapter 6 - Sustainability of member outcomes
Sustainability of member outcomes refers to an RSE licensee’s ability to sustain its member outcomes into the future and address areas requiring improvement. The sustainability metrics, in themselves, are not a direct measure of performance or outcomes, but instead are an indicator of an RSE licensee’s likely ability to continue to deliver quality member outcomes into the future.
For example, an RSE that is experiencing a significant loss of members leading to negative account growth may as a consequence, see a decline in its fee revenue. As a result, the RSE licensee may have to take steps to address the loss of revenue that may impact the outcomes they are providing to its members, including changing the fee model, reducing the services provided to members, or increasing investment in technological capabilities.
Scale as a driver of sustainability
Scale of an RSE can influence an RSE licensee’s ability to optimise investment outcomes through access to a range of asset classes, as well as its ability to spread fixed costs across a broader member base. Accordingly, APRA has used two representative scale measures (outlined below) to provide a baseline for considering how trend metrics may hinder the ability of an RSE licensee to continue to deliver quality member outcomes in the longer term.
• The net assets available for members' benefits includes defined contribution member balances in both the Accumulation and Pension phases, defined benefit entitlements and reserves.
• The total number of member accounts, as the number of member accounts will have a material impact on an RSE licensee’s ability to spread its fixed costs, affecting its operating efficiency and the appropriateness (or otherwise) of its ongoing fee structure.
Rolling 3-year trend metrics
The Heatmap contains the following rolling 3-year trend metrics – Total Accounts Growth Rate, Net Cash Flow Ratio and Net Rollover Ratio. These three metrics provide insights into trends that are likely to impact sustainability of member outcomes, particularly when considering scale.
The trend metrics are presented on a 3-year rolling average basis to limit the impact of the data from a single abnormal year and the influence of past data, which may no longer have a bearing on the future direction of the RSE, on determining an RSE’s sustainability.
Adjusted Total Accounts Growth Rate The Adjusted Total Accounts Growth Rate metric provides a measure of the member growth rate of an RSE over the preceding 3 years. The metric has been adjusted to remove the
AUSTRALIAN PRUDENTIAL REGULATION AUTHORITY 22
impact of one-off items, including account consolidations and successor fund transfers (SFTs), to provide a more reliable indicator of the underlying trend. Such items should be considered separately, in the context of the RSE licensee’s strategic and business plans.
Net Cash Flow Ratio The Net Cash Flow Ratio metric is a measure of an RSE’s overall growth in member benefits, which is based on data relating to member and employer initiated transactions, such as Superannuation Guarantee (SG) contributions.14 Using data relating to member and employer initiated transactions provides an understanding of how the total assets of an RSE are growing (or reducing) as a result of employers’ and members’ active decisions and engagement with the RSE.
Net Rollover Ratio Rollovers represent amounts transferred between different RSEs (excluding SFTs). The Net Rollover Ratio metric provides a measure of net member benefit flows due to active decisions made by members to transfer into or out of the RSE. It is an indicator of the ability of the RSE to attract and retain members.
Colour overlay
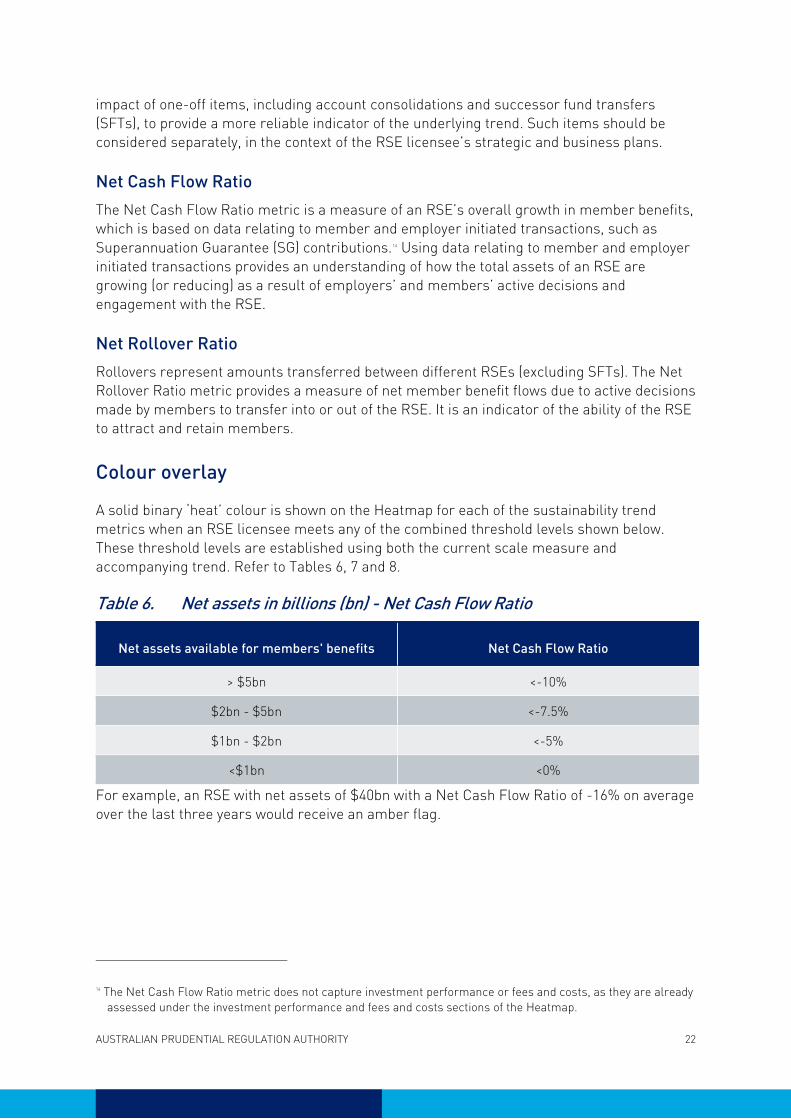
A solid binary ‘heat’ colour is shown on the Heatmap for each of the sustainability trend metrics when an RSE licensee meets any of the combined threshold levels shown below. These threshold levels are established using both the current scale measure and accompanying trend. Refer to Tables 6, 7 and 8.
Table 6. Net assets in billions (bn) - Net Cash Flow Ratio
Net assets available for members' benefits Net Cash Flow Ratio
> $5bn <-10%
$2bn - $5bn <-7.5%
$1bn - $2bn <-5%
<$1bn <0%
For example, an RSE with net assets of $40bn with a Net Cash Flow Ratio of -16% on average over the last three years would receive an amber flag.
14 The Net Cash Flow Ratio metric does not capture investment performance or fees and costs, as they are already assessed under the investment performance and fees and costs sections of the Heatmap.

AUSTRALIAN PRUDENTIAL REGULATION AUTHORITY 23
Table 7. Net assets - Net Rollover Ratio
Net assets available for members' benefits Net Rollover Ratio
> $5bn <-10%
$2bn - $5bn <-7.5%
$1bn - $2bn <-5%
<$1bn <0%
For example, an RSE with net assets of $4bn with a Net Rollover Ratio of -8% on average over the last three years would receive an amber flag.
Table 8. Total Accounts - Total Accounts Growth
Total Accounts Adjusted Total Account Growth
>20,000 <-10%
15,000 – 20,000 <-7.5%
10,000 – 15,000 <-5%
<10,000 <0%
For example, an RSE with 9,000 accounts with an average annual adjusted total account growth rate of -1% over the last three years would receive an amber flag.
The concise view
The metrics included in the concise view for sustainability of member outcomes provide a link between the current position of the relevant metric and its expected future value, hence capturing key trends. The expected future values are a key input for RSE licensees into their assessment of the sustainability of the member outcomes.

AUSTRALIAN PRUDENTIAL REGULATION AUTHORITY 24
Chapter 7 - Ongoing work to improve member outcomes
Improving the data
APRA has been working with the industry to improve the quality and consistency of reported superannuation data since 2013, and has recently commenced consultation on an expanded and improved data collection.15 APRA is also currently undertaking a major project to transform the way in which data is collected, stored and accessed for all APRA-regulated industries.
The SDT program will enhance the scope, quality and depth of reported superannuation information. APRA anticipates that this enhanced data collection will ultimately provide a greater understanding of the underlying differences between RSE licensees, their products and key drivers of outcomes and performance - raising levels of transparency and supporting meaningful assessment of the outcomes delivered by RSE licensees.
Providing insights into other areas of member outcomes
RSE licensees are required under the Superannuation Industry (Supervision) Act 1993 (SIS Act) to have an insurance strategy and ensure that insurance does not inappropriately erode members’ balances. RSE licensees are also required to assess their insurance offering under SPS 515, to ensure it provides appropriate outcomes to members. Given these obligations, APRA views it as important to develop appropriate metrics for insurance outcomes. However, there are challenges in doing this due to the varying nature, design and cost of insurance arrangements provided in superannuation.
As a starting point, APRA will consider the measures set out in Prudential Practice Guide SPG 516 Outcomes Assessment, including but not limited to premium levels and costs relative to benchmarks for assessing the erosion of retirement benefits such as a proportion of the superannuation guarantee contribution or the balance of a member’s account. APRA will also consider metrics relating to the extent to which members engage with and claim on their insurance, such as opt-out rates for default members, claims payout ratios, claims handling procedures and processing times, the number of insurance-related disputes, the time taken to resolve disputes, and policy lapsing rates. These metrics, in conjunction with product design and premium costs, will be critical in assisting RSE licensees and APRA in forming a view as to whether changes to the insurance offering would improve outcomes for certain cohorts of members or the membership overall. APRA will also consider the outcomes of ASIC’s project on measuring value in default insurance in developing benchmarks for insurance.
15 APRA’s Superannuation Data Transformation to enhance industry transparency and accountability. The Phase 1 Discussion Paper and the first topic paper on RSE Structure and Profile are available at: https://www.apra.gov.au/consultation-on-apras-superannuation-data-transformation

AUSTRALIAN PRUDENTIAL REGULATION AUTHORITY 25
Capturing the performance of the entire business operations of RSE licensees
Over recent years, APRA has been seeking to focus RSE licensees on improving the outcomes for their members by improving their overall business practices. SPS 515 has imposed new requirements on RSE licensees to assess their past performance (taking into account the legislated outcomes assessment) and be forward-looking in identifying improvements to enhance their business operations and drive the sustainable delivery of quality outcomes to members.
Consistent with its expectations for RSE licensees, APRA will consider broader aspects of performance and outcomes, including for Choice products and options. While APRA’s superannuation data collection is being enhanced for Choice products, APRA will consider other data sources and alternative approaches for obtaining insights into the outcomes being provided by these products, noting that the heterogeneity that exists across Choice products will add complexity to this task.

AUSTRALIAN PRUDENTIAL REGULATION AUTHORITY 26
Appendix A - Heatmap metrics
Metric Formula Purpose
Investment Performance Metrics
Net return p.a. 𝑛𝑛 𝑦𝑦𝑦𝑦𝑦𝑦𝑦𝑦 𝑁𝑁𝑁𝑁 𝑝𝑝.𝑦𝑦. = ��(1 +
𝑛𝑛
𝑡𝑡=1
𝑁𝑁𝑁𝑁𝑡𝑡)�
1𝑛𝑛
− 1
Where NRt is the Net Return for year t and n is either 3 years or 5 years
Return of the product/lifecycle stage after all fees, costs and taxes have been deducted for the $50,000 representative member.
Net investment return p.a. 𝑛𝑛 𝑦𝑦𝑦𝑦𝑦𝑦𝑦𝑦 𝑁𝑁𝑁𝑁𝑁𝑁 𝑝𝑝. 𝑦𝑦. = ��(1 +
𝑛𝑛
𝑡𝑡=1
𝑁𝑁𝑁𝑁𝑁𝑁𝑡𝑡)�
1𝑛𝑛
− 1
Where 𝑁𝑁𝑁𝑁𝑁𝑁𝑡𝑡 is the Net Investment Return for year t and n is either 3 years or 5 years
Return of the product/lifecycle stage after investment-related fees, costs and taxes have been deducted.
Net investment return relative to SRP p.a.
𝑃𝑃𝑦𝑦𝑦𝑦𝑃𝑃𝑃𝑃𝑦𝑦𝑃𝑃𝑦𝑦𝑛𝑛𝑃𝑃𝑦𝑦 𝑦𝑦𝑦𝑦𝑟𝑟𝑦𝑦𝑟𝑟𝑟𝑟𝑟𝑟𝑦𝑦 𝑟𝑟𝑃𝑃 𝑠𝑠𝑟𝑟𝑃𝑃𝑝𝑝𝑟𝑟𝑦𝑦 𝑦𝑦𝑦𝑦𝑃𝑃𝑦𝑦𝑦𝑦𝑦𝑦𝑛𝑛𝑃𝑃𝑦𝑦 𝑝𝑝𝑃𝑃𝑦𝑦𝑟𝑟𝑃𝑃𝑃𝑃𝑟𝑟𝑟𝑟𝑃𝑃= 𝑛𝑛 𝑦𝑦𝑦𝑦𝑦𝑦𝑦𝑦 𝑁𝑁𝑁𝑁𝑁𝑁 𝑝𝑝.𝑦𝑦.− 𝑛𝑛 𝑦𝑦𝑦𝑦𝑦𝑦𝑦𝑦 𝑆𝑆𝑟𝑟𝑃𝑃𝑝𝑝𝑟𝑟𝑦𝑦 𝑁𝑁𝑦𝑦𝑃𝑃𝑦𝑦𝑦𝑦𝑦𝑦𝑛𝑛𝑃𝑃𝑦𝑦 𝑃𝑃𝑃𝑃𝑦𝑦𝑟𝑟𝑃𝑃𝑃𝑃𝑟𝑟𝑟𝑟𝑃𝑃 𝑦𝑦𝑦𝑦𝑟𝑟𝑟𝑟𝑦𝑦𝑛𝑛 𝑝𝑝. 𝑦𝑦. where 𝑛𝑛 𝑦𝑦𝑦𝑦𝑦𝑦𝑦𝑦 𝑆𝑆𝑟𝑟𝑃𝑃𝑝𝑝𝑟𝑟𝑦𝑦 𝑁𝑁𝑦𝑦𝑃𝑃𝑦𝑦𝑦𝑦𝑦𝑦𝑛𝑛𝑃𝑃𝑦𝑦 𝑃𝑃𝑃𝑃𝑦𝑦𝑟𝑟𝑃𝑃𝑃𝑃𝑟𝑟𝑟𝑟𝑃𝑃 𝑦𝑦𝑦𝑦𝑟𝑟𝑟𝑟𝑦𝑦𝑛𝑛 𝑝𝑝. 𝑦𝑦.
= ��[1 + (𝑊𝑊𝐺𝐺,𝑡𝑡−1
4𝑛𝑛
𝑡𝑡=1
× 𝑁𝑁𝐺𝐺,𝑡𝑡) + (𝑊𝑊𝐷𝐷,𝑡𝑡−1 × 𝑁𝑁𝐷𝐷,𝑡𝑡)]�
1𝑛𝑛
− 1 𝑊𝑊𝐺𝐺,𝑡𝑡−1and 𝑊𝑊𝐷𝐷,𝑡𝑡−1 are the product or life stage’s strategic allocation to growth and defensive assets at end of quarter t -1 (or start of quarter t); 𝑁𝑁𝐺𝐺,𝑡𝑡 and 𝑁𝑁𝐷𝐷,𝑡𝑡 is the quarterly index return of the growth and defensive portion of the SRP (adjusted for fees and taxes) to time t; n is either 3 years or 5 years The SRP assumes rebalancing on a quarterly basis. The return on the growth portfolio is calculated as:
𝑁𝑁𝐺𝐺,𝑡𝑡 = ��𝑁𝑁𝑛𝑛𝐼𝐼𝑦𝑦𝐼𝐼𝑙𝑙,𝑡𝑡 − 𝐹𝐹𝑦𝑦𝑦𝑦𝑙𝑙� × (1 − 𝐸𝐸𝐸𝐸𝑁𝑁𝑙𝑙) × 𝑤𝑤𝐺𝐺,𝑙𝑙
3
𝑙𝑙=1
Indexl,t is the quarterly return on the index chosen to reflect asset class l for quarter t; Feel is the fee assumed for asset class l; ETRl is the assumed effective tax rate for asset class l; wG,l is the weight to asset class l in the Growth portfolio. The asset classes in Growth portfolio are Australian equities, International equities (hedged) and International equities (unhedged).
This metric creates a bespoke reference portfolio for the product based on its allocation to growth assets (based on a consistent definition). The reference portfolio is a notional, simple, low cost portfolio consisting only of equities, bonds and cash.

AUSTRALIAN PRUDENTIAL REGULATION AUTHORITY 27
Metric Formula Purpose
The return on the defensive portfolio is calculated as:
𝑁𝑁𝐷𝐷,𝑡𝑡 = ��𝑁𝑁𝑛𝑛𝐼𝐼𝑦𝑦𝐼𝐼𝑙𝑙,𝑡𝑡 − 𝐹𝐹𝑦𝑦𝑦𝑦𝑙𝑙� × (1 − 𝐸𝐸𝐸𝐸𝑁𝑁𝑙𝑙) × 𝑤𝑤𝐷𝐷,𝑙𝑙
3
𝑙𝑙=1
Indexl,t is the quarterly return on the index chosen to reflect asset class l for quarter t; Feel is the fee assumed for asset class l; ETRl is the assumed effective tax rate for asset class l; wD,l is the weight to asset class l in the Defensive portfolio. The asset classes in Defensive portfolio are Australian fixed interest, International fixed interest (hedged) and Cash.
Net Investment Return relative to listed SAA benchmark portfolio p.a.
𝑃𝑃𝑦𝑦𝑦𝑦𝑃𝑃𝑃𝑃𝑦𝑦𝑃𝑃𝑦𝑦𝑛𝑛𝑃𝑃𝑦𝑦 𝑦𝑦𝑦𝑦𝑟𝑟𝑦𝑦𝑟𝑟𝑟𝑟𝑟𝑟𝑦𝑦 𝑟𝑟𝑃𝑃 𝑟𝑟𝑟𝑟𝑠𝑠𝑟𝑟𝑦𝑦𝐼𝐼 𝑆𝑆𝑆𝑆𝑆𝑆 𝑏𝑏𝑦𝑦𝑛𝑛𝑃𝑃ℎ𝑃𝑃𝑦𝑦𝑦𝑦𝑚𝑚 𝑝𝑝𝑃𝑃𝑦𝑦𝑟𝑟𝑃𝑃𝑃𝑃𝑟𝑟𝑟𝑟𝑃𝑃= 𝑛𝑛 𝑦𝑦𝑦𝑦𝑦𝑦𝑦𝑦 𝑁𝑁𝑁𝑁𝑁𝑁 𝑝𝑝. 𝑦𝑦.− 𝑛𝑛 𝑦𝑦𝑦𝑦𝑦𝑦𝑦𝑦 𝐿𝐿𝑟𝑟𝑠𝑠𝑟𝑟𝑦𝑦𝐼𝐼 𝑆𝑆𝑆𝑆𝑆𝑆 𝑏𝑏𝑦𝑦𝑛𝑛𝑃𝑃ℎ𝑃𝑃𝑦𝑦𝑦𝑦𝑚𝑚 𝑝𝑝𝑃𝑃𝑦𝑦𝑟𝑟𝑃𝑃𝑃𝑃𝑟𝑟𝑟𝑟𝑃𝑃 𝑦𝑦𝑦𝑦𝑟𝑟𝑟𝑟𝑦𝑦𝑛𝑛 𝑝𝑝. 𝑦𝑦.
where 𝑛𝑛 𝑦𝑦𝑦𝑦𝑦𝑦𝑦𝑦 𝐿𝐿𝑟𝑟𝑠𝑠𝑟𝑟𝑦𝑦𝐼𝐼 𝑆𝑆𝑆𝑆𝑆𝑆 𝑏𝑏𝑦𝑦𝑛𝑛𝑃𝑃ℎ𝑃𝑃𝑦𝑦𝑦𝑦𝑚𝑚 𝑝𝑝𝑃𝑃𝑦𝑦𝑟𝑟𝑃𝑃𝑃𝑃𝑟𝑟𝑟𝑟𝑃𝑃 𝑦𝑦𝑦𝑦𝑟𝑟𝑟𝑟𝑦𝑦𝑛𝑛 𝑝𝑝. 𝑦𝑦.
= ���1 + ��𝑆𝑆𝑆𝑆𝑆𝑆𝑙𝑙,𝑡𝑡−1 × 𝑁𝑁𝑙𝑙,𝑡𝑡�𝐴𝐴
𝑙𝑙=1
�4𝑛𝑛
𝑡𝑡=1
�
1𝑛𝑛
− 1
𝑆𝑆𝑆𝑆𝑆𝑆𝑙𝑙,𝑡𝑡−1 is the strategic asset allocation to asset class l at end of quarter t -1 (or start of quarter t); 𝑁𝑁𝑙𝑙,𝑡𝑡 is the return on the index chosen to reflect asset class l for quarter t after adjustments for the impact of fees and taxes; n is either 3 years or 5 years; A is equal to the total number of asset classes 𝑁𝑁𝑙𝑙,𝑡𝑡 = �𝑁𝑁𝑛𝑛𝐼𝐼𝑦𝑦𝐼𝐼𝑙𝑙,𝑡𝑡 − 𝐹𝐹𝑦𝑦𝑦𝑦𝑙𝑙� × (1 − 𝐸𝐸𝐸𝐸𝑁𝑁𝑙𝑙) 𝑁𝑁𝑛𝑛𝐼𝐼𝑦𝑦𝐼𝐼𝑙𝑙,𝑡𝑡 is the quarterly return on the index chosen to reflect asset class l for quarter t, 𝐹𝐹𝑦𝑦𝑦𝑦𝑙𝑙 is the fee assumed for asset class l, 𝐸𝐸𝐸𝐸𝑁𝑁𝑙𝑙 is the assumed effective tax rate for asset class l
This metric assesses the value added through an RSE licensee’s implementation of the SAA relative to listed benchmarks.
Fee and Cost Metrics
Administration fees 𝑀𝑀𝑟𝑟𝑛𝑛𝑟𝑟𝑃𝑃𝑟𝑟𝑃𝑃�100 ×
$ 𝑦𝑦𝐼𝐼𝑃𝑃𝑟𝑟𝑛𝑛 𝑃𝑃𝑦𝑦𝑦𝑦𝑦𝑦𝑃𝑃𝑃𝑃𝑃𝑃𝑟𝑟𝑛𝑛𝑟𝑟 𝑏𝑏𝑦𝑦𝑟𝑟𝑦𝑦𝑛𝑛𝑃𝑃𝑦𝑦 + % 𝑦𝑦𝐼𝐼𝑃𝑃𝑟𝑟𝑛𝑛 𝑃𝑃𝑦𝑦𝑦𝑦,
$ 𝑦𝑦𝐼𝐼𝑃𝑃𝑟𝑟𝑛𝑛 𝑃𝑃𝑦𝑦𝑦𝑦 𝑃𝑃𝑦𝑦𝑝𝑝𝑦𝑦𝑃𝑃𝑃𝑃𝑃𝑃𝑟𝑟𝑛𝑛𝑟𝑟 𝑏𝑏𝑦𝑦𝑟𝑟𝑦𝑦𝑛𝑛𝑃𝑃𝑦𝑦� The forward-looking
impact of administration fees a member can expect to be charged on their account balance.
Total fees Administration fee (% of account balance) + ICR (% of account balance + Investment fee disclosed (% of account balance)
Provides a forward-looking lens on the total fees members can expect to be charged on their account balance.

AUSTRALIAN PRUDENTIAL REGULATION AUTHORITY 28
Metric Formula Purpose
Sustainability of Member Outcomes Metrics
Total accounts * 3 year adjusted total account growth rate
=13�
[(Total Accountst
3
t= 1+ Consolidated Accountst − SFT Int + SFT Outt) / Total Accountst−1 − 1]
Average inherent growth rate of total member accounts over last 3 years, adjusted for consolidations and SFTs.
Net Cash Flow Ratio* 3 𝑦𝑦𝑦𝑦𝑦𝑦𝑦𝑦 𝑁𝑁𝑁𝑁𝐹𝐹 𝑦𝑦𝑦𝑦𝑟𝑟𝑟𝑟𝑃𝑃 =
13 �
[(𝑀𝑀𝑦𝑦𝑃𝑃𝑏𝑏𝑦𝑦𝑦𝑦 𝑏𝑏𝑦𝑦𝑛𝑛𝑦𝑦𝑃𝑃𝑟𝑟𝑟𝑟 𝑃𝑃𝑟𝑟𝑃𝑃𝑤𝑤𝑠𝑠 𝑟𝑟𝑛𝑛𝑡𝑡
3
𝑡𝑡= 1+ 𝑁𝑁𝑛𝑛𝑠𝑠𝑟𝑟𝑦𝑦𝑦𝑦𝑛𝑛𝑃𝑃𝑦𝑦 𝑦𝑦𝑦𝑦𝑟𝑟𝑦𝑦𝑟𝑟𝑦𝑦𝐼𝐼 𝑟𝑟𝑛𝑛𝑃𝑃𝑟𝑟𝑃𝑃𝑤𝑤𝑠𝑠𝑡𝑡− 𝑁𝑁𝑛𝑛𝑠𝑠𝑟𝑟𝑦𝑦𝑦𝑦𝑛𝑛𝑃𝑃𝑦𝑦 𝑦𝑦𝑦𝑦𝑟𝑟𝑦𝑦𝑟𝑟𝑦𝑦𝐼𝐼 𝑃𝑃𝑟𝑟𝑟𝑟𝑃𝑃𝑟𝑟𝑃𝑃𝑤𝑤𝑠𝑠𝑡𝑡− 𝑀𝑀𝑦𝑦𝑃𝑃𝑏𝑏𝑦𝑦𝑦𝑦 𝑏𝑏𝑦𝑦𝑛𝑛𝑦𝑦𝑃𝑃𝑟𝑟𝑟𝑟 𝑃𝑃𝑟𝑟𝑃𝑃𝑤𝑤𝑠𝑠 𝑃𝑃𝑟𝑟𝑟𝑟𝑡𝑡) / 𝑁𝑁𝑦𝑦𝑠𝑠ℎ𝑃𝑃𝑟𝑟𝑃𝑃𝑤𝑤 𝑦𝑦𝐼𝐼𝑎𝑎𝑟𝑟𝑠𝑠𝑟𝑟𝑦𝑦𝐼𝐼 𝑛𝑛𝑦𝑦𝑟𝑟 𝑦𝑦𝑠𝑠𝑠𝑠𝑦𝑦𝑟𝑟𝑠𝑠𝑡𝑡]
Measure of an RSE’s asset growth removing the impact of investment returns and fees and costs.
Net Rollover Ratio*
3 𝑦𝑦𝑦𝑦𝑦𝑦𝑦𝑦 𝑁𝑁𝑦𝑦𝑟𝑟 𝑁𝑁𝑃𝑃𝑟𝑟𝑟𝑟𝑃𝑃𝑟𝑟𝑦𝑦𝑦𝑦 𝑁𝑁𝑦𝑦𝑟𝑟𝑟𝑟𝑃𝑃
=13 �
[(𝑁𝑁𝑃𝑃𝑟𝑟𝑟𝑟𝑃𝑃𝑟𝑟𝑦𝑦𝑦𝑦𝑠𝑠 𝑟𝑟𝑛𝑛𝑡𝑡 − 𝑁𝑁𝑃𝑃𝑟𝑟𝑟𝑟𝑃𝑃𝑟𝑟𝑦𝑦𝑦𝑦𝑠𝑠 𝑃𝑃𝑟𝑟𝑟𝑟𝑡𝑡) 3
𝑡𝑡= 1/ 𝑁𝑁𝑦𝑦𝑠𝑠ℎ𝑃𝑃𝑟𝑟𝑃𝑃𝑤𝑤 𝑦𝑦𝐼𝐼𝑎𝑎𝑟𝑟𝑠𝑠𝑟𝑟𝑦𝑦𝐼𝐼 𝑛𝑛𝑦𝑦𝑟𝑟 𝑦𝑦𝑠𝑠𝑠𝑠𝑦𝑦𝑟𝑟𝑠𝑠𝑡𝑡]
Measure of members’ preference for an RSE and level of active decisions to roll money into or out of an RSE. This measure provides additional insights into the net cash flows of an RSE.
* Where a 3-year average is not available, a 2-year or current year measure is substituted.

AUSTRALIAN PRUDENTIAL REGULATION AUTHORITY 29
Appendix B – Indices
The following indices16 were used when creating the reference and benchmark portfolios:
Asset Class Index Fee Assumption
Assumed effective tax rate
Australian Equity S&P/ASX 300 0.05% 0.00%
International Equity (hedged)
MSCI All Country World Ex-Australia Equities Index with Special Tax (100% hedged to AUD)
0.11% 14.00%
International Equity (unhedged)
MSCI All Country World Ex-Australia Equities Index with Special Tax (unhedged in AUD)
0.09% 14.00%
Australian Property S&P/ASX 300 A-REIT Index 0.12% 14.00%
International Property FTSE EPRA/NAREIT developed ex Australia rental hedged to AUD
0.22% 14.00%
Australian Infrastructure
FTSE Developed Core Infrastructure Index hedged to AUD
0.26% 14.00%
International Infrastructure
FTSE Developed Core Infrastructure Index hedged to AUD
0.26% 14.00%
Australian Fixed Interest
Bloomberg Ausbond Composite 0+ Index 0.10% 15.00%
International Fixed Interest
Bloomberg Barclays Global Aggregate Index (hedged in AUD)
0.10% 15.00%
Australian Cash Bloomberg Ausbond Bank Bill Index 0.04% 15.00%
International Cash Bloomberg Ausbond Bank Bill Index 0.04% 15.00%
Other (assets categorised as Other / Commodities)
25% International Equity (hedged), 25% International Equity (unhedged), 50% International Fixed Interest
As per the underlying asset classes
The benchmarks chosen are considered to be representative of the investable market, appropriate for MySuper and relevant to an Australian superannuation investor. Total return indices (that is, returns inclusive of dividends as well as capital gains) have been used.
16 Indices will be reviewed on a regular basis for appropriateness.

AUSTRALIAN PRUDENTIAL REGULATION AUTHORITY 30
Index provider acknowledgements Source: Bloomberg Index Services Limited. BLOOMBERG® is a trademark and service mark of Bloomberg Finance L.P. and its affiliates (collectively “Bloomberg”). BARCLAYS® is a trademark and service mark of Barclays Bank Plc (collectively with its affiliates, “Barclays”), used under license. Bloomberg or Bloomberg’s licensors, including Barclays, own all proprietary rights in the Bloomberg Barclays Indices. Neither Bloomberg nor Barclays approves or endorses this material, or guarantees the accuracy or completeness of any information herein, or makes any warranty, express or implied, as to the results to be obtained therefrom and, to the maximum extent allowed by law, neither shall have any liability or responsibility for injury or damages arising in connection therewith.
Source: London Stock Exchange Group plc and its group undertakings, including FTSE International Limited (collectively, the “LSE Group”), European Public Real Estate Association ("EPRA”), and the National Association of Real Estate Investments Trusts (“Nareit”) (and together the “Licensor Parties”). © LSE Group 2019. FTSE Russell is a trading name of certain LSE Group companies. “FTSE®” and “Russell®” are a trade mark(s) of the relevant LSE Group companies and are used by any other LSE Group company under license. “Nareit®” is a trade mark of Nareit, "EPRA®" is a trade mark of EPRA and all are used by the LSE Group under license. All rights in the FTSE EPRA NAREIT Global Real Estate index(es) or data vest in the Licensor Parties. The Licensor Parties do not accept any liability for any errors or omissions in the indexes or data and no party may rely on any indexes or data contained in this communication. No further distribution of data from the LSE Group is permitted without the relevant LSE Group company’s express written consent. The Licensor Parties do not promote, sponsor or endorse the content of this communication.
Source: London Stock Exchange Group plc and its group undertakings (collectively, the “LSE Group”). © LSE Group 2019. FTSE Russell is a trading name of certain of the LSE Group companies. “FTSE®” “Russell®” and “FTSE Russell®”, and other service marks and trademarks related to the FTSE or Russell indexes are trademarks of the relevant LSE Group companies and are used by any other LSE Group company under license. All rights in the FTSE Russell indexes or data vest in the relevant LSE Group company which owns the index or the data. Neither LSE Group nor its licensors accept any liability for any errors or omissions in the indexes or data and no party may rely on any indexes or data contained in this communication. No further distribution of data from the LSE Group is permitted without the relevant LSE Group company’s express written consent. The LSE Group does not promote, sponsor or endorse the content of this communication.
Source: The S&P/ASX 300 Index and S&P/ASX 300 A-REIT Index (“Index”) is a product of S&P Dow Jones Indices LLC, its affiliates and/or their licensors and has been licensed for use by APRA. Copyright © 2019 S&P Dow Jones Indices LLC, its affiliates and/or their licensors. All rights reserved. Redistribution or reproduction in whole or in part are prohibited without written permission of S&P Dow Jones Indices LLC. For more information on any of S&P Dow Jones Indices LLC’s indices please visit www.spdji.com. S&P® is a registered trademark of Standard & Poor’s Financial Services LLC and Dow Jones® is a registered trademark of Dow Jones Trademark Holdings LLC. Neither S&P Dow Jones Indices LLC, Dow Jones Trademark Holdings LLC, their affiliates nor their third party licensors make any representation or warranty, express or implied, as to the ability of any index to accurately represent the asset class or market sector that it purports to represent and neither S&P Dow Jones Indices LLC, Dow Jones Trademark Holdings LLC, their affiliates nor their third party licensors shall have any liability for any errors, omissions, or interruptions of any index or the data included therein.

AUSTRALIAN PRUDENTIAL REGULATION AUTHORITY 31
Source: The blended returns are calculated by APRA using end of day index level values licensed from MSCI (“MSCI Data”). For the avoidance of doubt, MSCI is not the benchmark “administrator” for, or a “contributor”, “submitter” or “supervised contributor” to, the blended returns, and the MSCI Data is not considered a “contribution” or “submission” in relation to the blended returns, as those terms may be defined in any rules, laws, regulations, legislation or international standards. MSCI Data is provided “AS IS” without warranty or liability and no copying or distribution is permitted. MSCI does not make any representation regarding the advisability of any investment or strategy and does not sponsor, promote, issue, sell or otherwise recommend or endorse any investment or strategy, including any financial products or strategies based on, tracking or otherwise utilizing any MSCI Data, models, analytics or other materials or information.

AUSTRALIAN PRUDENTIAL REGULATION AUTHORITY 32
Appendix C – Example SRP calculation
Product A’s strategic asset allocation (SAA) is listed in the table below and has remained unchanged over the analysed period. Based on Product A’s SAA, its allocations to growth and defensive assets, based on the definition used in this analysis, are as follows:
Asset class SAA Growth asset allocation
Defensive asset allocation
Australian Equity 25% 25% 0%
International Equity (hedged) 15% 15% 0%
International Equity (unhedged) 15% 15% 0%
Australian Unlisted Property 10% 7.5% 2.5%
Australian Unlisted Infrastructure
5% 3.75% 1.25%
Australian Fixed Interest 10% 0% 10%
International Fixed Interest 10% 0% 10%
Cash 5% 0% 5%
Other 5% 2.5% 2.5%
Total 100% 68.75% 31.25%

AUSTRALIAN PRUDENTIAL REGULATION AUTHORITY 33
The returns on the Growth and Defensive portfolios within the SRP are calculated as follows:
Asset class Allocation Sample annualised index returns (net of fees and taxes)
Return calculation
International Equity (unhedged) 25% 10% 25% x 10% = 2.5%
International Equity (hedged) 25% 12% 25% x 12% = 3%
Australian Equity 50% 8% 50% x 8% = 4%
Return on Growth Portfolio 9.5% p.a.
Australian Fixed Interest 40% 5% 40% x 5% = 2%
International Fixed Interest 40% 6% 40% x 6% = 2.4%
Cash 20% 2% 20% x 2% = 0.4%
Return on Defensive Portfolio 4.8% p.a.
The return on the bespoke SRP for Product A over the period is 8.0% p.a. (68.75% x 9.5% + 31.25% x 4.8% = 8.0% p.a.).
Assuming Product A has a Net Investment Return of 9.0% p.a. over the period, its performance relative to SRP is 1.0% p.a. (9.0% - 8.0% = 1.0% p.a.).


![arXiv:1909.01203v1 [cs.CV] 3 Sep 2019 · 2019-09-04 · arXiv:1909.01203v1 [cs.CV] 3 Sep 2019. fusion layer camera 1 camera 2 gt heatmap detected heatmap detected heatmap fused fused](https://static.documents.pub/doc/80x56/5f1d4476c377703551130c2e/arxiv190901203v1-cscv-3-sep-2019-2019-09-04-arxiv190901203v1-cscv-3.jpg)


