104
Conferences in Research and Practice in Information Technology Volume 116 Information Security 2011 Australian Computer Science Communications, Volume 33, Number 4

Conferences in Research and Practice in
Information Technology
Volume 116
Information Security 2011
Australian Computer Science Communications, Volume 33, Number 4
Client: Computing Research & Education Project: IdentityJob #: COR09100 Date: November 09


Information Security 2011
Proceedings of theNinth Australasian Information Security Conference(AISC 2011), Perth, Australia,17-20 January 2011
Colin Boyd and Josef Pieprzyk, Eds.
Volume 116 in the Conferences in Research and Practice in Information Technology Series.Published by the Australian Computer Society Inc.
Published in association with the ACM Digital Library.
acmacm
iii

Information Security 2011. Proceedings of the Ninth Australasian Information Security Conference(AISC 2011), Perth, Australia, 17-20 January 2011
Conferences in Research and Practice in Information Technology, Volume 116.
Copyright c©2011, Australian Computer Society. Reproduction for academic, not-for-profit purposes permittedprovided the copyright text at the foot of the first page of each paper is included.
Editors:
Colin BoydFaculty of Information TechnologyQueensland University of TechnologyBrisbane Q4001AustraliaEmail: [email protected]
Josef PieprzykDepartment of ComputingMacquarie UniversityNSW 2109AustraliaEmail: [email protected]
Series Editors:Vladimir Estivill-Castro, Griffith University, QueenslandSimeon J. Simoff, University of Western Sydney, NSWEmail:[email protected]
Publisher: Australian Computer Society Inc.PO Box Q534, QVB Post OfficeSydney 1230New South WalesAustralia.
Conferences in Research and Practice in Information Technology, Volume 116.ISSN 1445-1336.ISBN 978-1-920682-96-5.
Printed, January 2011 by University of Western Sydney, on-line proceedingsDocument engineering by CRPITCD Cover Design by Dr Patrick Peursum, Curtin University of TechnologyCD Production by Snap St Georges Terrace, 181 St Georges Terrace, Perth WA 6000,http://www.stgeorges.snap.com.au/
The Conferences in Research and Practice in Information Technology series disseminates the results of peer-reviewedresearch in all areas of Information Technology. Further details can be found at http://crpit.com/.
iv

Table of Contents
Proceedings of the Ninth Australasian Information Security Conference (AISC2011), Perth, Australia, 17-20 January 2011
Preface . . . . . . . . . . . . . . . . . . . . . . . . . . . . . . . . . . . . . . . . . . . . . . . . . . . . . . . . . . . . . . . . . . . . . . . . . . . . . . . . vii
Programme Committee . . . . . . . . . . . . . . . . . . . . . . . . . . . . . . . . . . . . . . . . . . . . . . . . . . . . . . . . . . . . . viii
Organising Committee . . . . . . . . . . . . . . . . . . . . . . . . . . . . . . . . . . . . . . . . . . . . . . . . . . . . . . . . . . . . . . ix
Welcome from the Organising Committee . . . . . . . . . . . . . . . . . . . . . . . . . . . . . . . . . . . . . . . x
CORE - Computing Research & Education . . . . . . . . . . . . . . . . . . . . . . . . . . . . . . . . . . . . . . xi
ACSW Conferences and the Australian Computer ScienceCommunications . . . . . . . . . . . . . . . . . . . . . . . . . . . . . . . . . . . . . . . . . . . . . . . . . . . . . . . . . . . . . . . . . . xii
ACSW and AISC 2011 Sponsors . . . . . . . . . . . . . . . . . . . . . . . . . . . . . . . . . . . . . . . . . . . . . . . . . . xiv
Contributed Papers
An Anonymous Authentication Protocol with Single-database PIR . . . . . . . . . . . . . . . . . . . . . . . . . . . . . . 3Toru Nakamura, Shunsuke Inenaga, Kensuke Baba, Daisuke Ikeda and Hiroto Yasuura
Cube Attack in Finite Fields of Higher Order . . . . . . . . . . . . . . . . . . . . . . . . . . . . . . . . . . . . . . . . . . . . . . . . . 9Andrea Agnesse and Marco Pedicini
Secure Two-Party Association Rule Mining . . . . . . . . . . . . . . . . . . . . . . . . . . . . . . . . . . . . . . . . . . . . . . . . . . . 15Md. Golam Kaosar, Russell Paulet and Xun Yi
Detection of Anomalies from User Profiles Generated from System Logs . . . . . . . . . . . . . . . . . . . . . . . . . 23Malcolm Corney, George Mohay and Andrew Clark
Identification of Potential Malicious Web Pages . . . . . . . . . . . . . . . . . . . . . . . . . . . . . . . . . . . . . . . . . . . . . . . 33Van Lam Le, Ian Welch, Xiaoying Gao and Peter Komisarczuk
IEEE 802.11 Chipset Fingerprinting by the Measurement of Timing Characteristics . . . . . . . . . . . . . . . 41Gnther Lackner and Peter Teufl
A Modal Logic for Information System Security . . . . . . . . . . . . . . . . . . . . . . . . . . . . . . . . . . . . . . . . . . . . . . . 51Yun Bai and Khaled Khan
Detection of Fast Flux Service Networks . . . . . . . . . . . . . . . . . . . . . . . . . . . . . . . . . . . . . . . . . . . . . . . . . . . . . 57Scott Campbell, Steve Chan and Jason Lee
Development and Evaluation of a Secure, Privacy Preserving Combinatorial Auction . . . . . . . . . . . . . . 67Ben Palmer, Kris Bubendorfer and Ian Welch
Comparison of Low-Latency Anonymous Communication Systems - Practical Usage and Performance 77Thorsten Ries, Radu State and Andriy Panchenko
Author Index . . . . . . . . . . . . . . . . . . . . . . . . . . . . . . . . . . . . . . . . . . . . . . . . . . . . . . . . . . . . . . . . . . . . . . . . 87

vi

Preface
The Australasian Information Security Conference (AISC) 2011 was held on 18th-19th January 2011 inPerth, Australia, as a part of the Australasian Computer Science Week 2011. AISC grew out of the Aus-tralasian Information Security Workshop and officially changed the name to Australasian InformationSecurity Conference in 2008. The main aim of the AISC is to provide a venue for Australasian and otherresearchers to present their work on all aspects of information security and promote collaboration betweenacademic and industrial researchers working in this area.
This year we received 22 submissions from Austria, Australia, Germany, Italy, Japan, Luxembourg, NewZealand and United States. After a thorough refereeing process we accepted 10 papers for presentation atAISC 2011. We extend our thanks to all the AISC 2011 authors for their quality submissions and all themembers of the Program Committee and additional referees for their expert reviews.
Following AISC tradition from previous years, we have selected a paper for the Best Student PaperPrize. Papers can be considered for this award only if the major contribution is due to a student author, whomust be the first author of the paper. This year the award went to Ben Palmer from the Victoria Universityof Wellington for the paper ”Development and Evaluation of a Secure, Privacy Preserving CombinatorialAuction” by Ben Palmer, Kris Bubendorfer and Ian Welch. Our hearty congratulations to Ben and hisco-authors on this fine achievement!
The invited keynote address for AISC 2011 was presented by Gene Tsudik, Professor of ComputerScience at the University of California, Irvine. We are very grateful to Gene for supporting AISC anddelivering his lecture on usable security.
Special thanks go to Gleb Sechenov for his excellent work on maintaining the AISC 2011 website. Weused Easychair software to manage the AISC submissions and reviews. We found this software very helpfuland easy to use and we thank the maintainers of the service for this opportunity.
Last but not least we extend our gratitude to the ACSW 2011 chair Mihai Lazarescu and other membersof the organising committee for their hard work and their continuous and invaluable support throughoutthe preparation of the conference.
Colin BoydQueensland University of Technology
Josef PieprzykMacquarie University
AISC 2011 Programme ChairsJanuary 2011
vii

Programme Committee
Chairs
Colin Boyd, Queensland University of Technology, AustraliaJosef Pieprzyk, Macquarie University, Australia
Members
Joonsang Baek, Institute for Infocomm Research, SingaporeLynn Batten, Deakin University, AustraliaLjiljana Brankovic, University of Newcastle, AustraliaRaymond Choo, Australian Institute of Criminology, AustraliaAsha Rao, RMIT University, AustraliaJason Reid, Queensland University of Technology, AustraliaRay Hunt, University of Canterbury, New ZealandRon Steinfeld, Macquarie University, AustraliaJill Slay, University of South Australia, AustraliaWilly Susilo, University of Wollongong, AustraliaClark Thomborson, The University of Auckland, New ZealandIan Welch, Victoria University of Wellington, New ZealandHuaxiong Wang, Nanyang Technology University, SingaporeDuncan S. Wong, City University of Hong Kong, Hong Kong SAR, ChinaYang Xiang, Deakin University, AustraliaXun Yi, Victoria University, Australia
viii

Organising Committee
Chair
Assoc. Prof. Mihai Lazarescu
Co-Chair
Assoc. Prof. Ling Li
Finance
Mary SimpsonMary Mulligan
Catering and Booklet
Mary MulliganDr. Patrick PuersumAssoc. Prof. Mihai Lazarescu
Sponsorship and Web
Dr. Patrick PeursumDr. Aneesh Krishna
Registration
Mary MulliganDr. Patrick Puersum
DVD and Signage
Dr. Patrick PeursumMary Mulligan
Venue
Dr. Mike Robey
Conference Bag
Dr. Sieteng Soh
ix

Welcome from the Organising Committee
On behalf of the Australasian Computer Science Week 2011 (ACSW2011) Organising Committee, we wel-come you to this year’s event hosted by Curtin University. Curtin University’s vision is to be an internationalleader shaping the future through its graduates and world class research. As Western Australia’s largestuniversity, Curtin is leading the state in producing high quality ICT graduates. At Curtin Computing, weoffer both world class courses and research. Our Computing courses cover three key areas in IT (ComputerScience, Software Engineering and Information Technology), are based on the curricula recommendationsof IEEE Computer Society and ACM, the largest IT professional associations in the world, and are accred-ited by the Australian Computer Society. Curtin Computing hosts a top level research institute (IMPCA)and offers world class facilities for large scale surveillance and pattern recognition.
We welcome delegates from over 18 countries, including Australia, New Zealand, USA, U.K., Italy,Japan, China, Canada, Germany, Spain, Pakistan, Austria, Ireland, South Africa, Taiwan and Thailand.We hope you will enjoy the experience of the ACSW 2011 event and get a chance to explore our wonderfulcity of Perth. Perth City Centre is located on the north bank of the Swan River and offers many funactivities and a wealth of shopping opportunities. For panoramic views of Perth and the river, one can visitKings Park or enjoy a relaxing picnic in one of the many recreational areas of the park.
The Curtin University campus, the venue for ACSW2011, is located just under 10km from the PerthCity Centre and is serviced by several Transperth bus routes that travel directly between Perth and CurtinUniversity Bus Station, as well as several other routes connecting to nearby train services.
ACSW2011 consists of the following conferences:
– Australasian Computer Science Conference (ACSC) (Chaired by Mark Reynolds)– Australasian Computing Education Conference (ACE) (Chaired by John Hamer and Michael de Raadt)– Australasian Database Conference (ADC) (Chaired by Heng Tao Shen and Athman Bouguettaya)– Australasian Information Security Conference (AISC) (Chaired by Colin Boyd and Josef Piepryzk)– Australasian User Interface Conference (AUIC) (Chaired by Christof Lutteroth)– Australasian Symposium on Parallel and Distributed Computing (AusPDC) (Chaired by Jinjun Chen
and Rajiv Ranjan)– Australasian Workshop on Health Informatics and Knowledge Management (HIKM) (Chaired by Ker-
ryn Butler-Henderson and Tony Sahama)– Computing: The Australasian Theory Symposium (CATS) (Chaired by Taso Viglas and Alex Potanin)– Australasian Computing Doctoral Consortium (ACDC) (Chaired by Rachel Cardell-Oliver and Falk
Scholer).
The nature of ACSW requires the co-operation of numerous people. We would like to thank all thosewho have worked to ensure the success of ACSW2011 including the Organising Committee, the ConferenceChairs and Programme Committees, our sponsors, the keynote speakers and the delegates. Many thanks goto Alex Potanin for his extensive advice and assistance and Wayne Kelly (ACSW2010 chair) who providedus with a wealth of information on the running of the conference. ACSW2010 was a wonderful event andwe hope we will live up to the expectations this year.
Assoc. Prof. Mihai Lazarescu and Assoc. Prof. Ling LiDepartment of Computing, Curtin University
ACSW2011 Co-ChairsJanuary, 2011

CORE - Computing Research & Education
CORE welcomes all delegates to ACSW2011 in Perth. CORE, the peak body representing academic com-puter science in Australia and New Zealand, is responsible for the annual ACSW series of meetings, whichare a unique opportunity for our community to network and to discuss research and topics of mutual in-terest. The original component conferences ACSC, ADC, and CATS, which formed the basis of ACSWinthe mid 1990s now share this week with six other events - ACE, AISC, AUIC, AusPDC, HIKM, ACDC,which build on the diversity of the Australasian computing community.
In 2011, we have again chosen to feature a small number of plenary speakers from across the discipline:Heng To Shen, Gene Tsudik, ans Dexter Kozen. I thank them for their contributions to ACSW2011. I alsothank the keynote speakers invited to some of the individual conferences. The efforts of the conferencechairs and their program committees have led to strong programs in all the conferences again, thanks. Andthanks are particularly due to Mihai Lazarescu and his colleagues for organising what promises to be astrong event.
In Australia, 2009 saw, for the first time in some years, an increase in the number of students choosingto study IT, and a welcome if small number of new academic appointments. Also welcome is the news thatuniversity and research funding is set to rise from 2011-12. However, it continues to be the case that per-place funding for computer science students has fallen relative to that of other physical and mathematicalsciences, and, while bodies such as the Australian Council of Deans of ICT seek ways to increase studentinterest in the area, more is needed to ensure the growth of our discipline.
During 2010, CORE continued to negotiate with the ARC on journal and conference rankings. A keyaim is now to maintain the rankings, which are widely used overseas as well as in Australia. Management ofthe rankings is a challenging process that needs to balance competing special interests as well as addressingthe interests of the community as a whole.
COREs existence is due to the support of the member departments in Australia and New Zealand, and Ithank them for their ongoing contributions, in commitment and in financial support. Finally, I am gratefulto all those who gave their time to CORE in 2010; in particular, I thank Alex Potanin, Jenny Edwards,Alan Fekete, Aditya Ghose, Leon Sterling, and the members of the executive and of the curriculum andranking committees.
Tom Gedeon
President, COREJanuary, 2011

ACSW Conferences and theAustralian Computer Science Communications
The Australasian Computer Science Week of conferences has been running in some form continuouslysince 1978. This makes it one of the longest running conferences in computer science. The proceedings ofthe week have been published as the Australian Computer Science Communications since 1979 (with the1978 proceedings often referred to as Volume 0 ). Thus the sequence number of the Australasian ComputerScience Conference is always one greater than the volume of the Communications. Below is a list of theconferences, their locations and hosts.
2012. Volume 34. Host and Venue - RMIT University, Melbourne, VIC.
2011. Volume 33. Host and Venue - Curtin University of Technology, Perth, WA.
2010. Volume 32. Host and Venue - Queensland University of Technology, Brisbane, QLD.2009. Volume 31. Host and Venue - Victoria University, Wellington, New Zealand.2008. Volume 30. Host and Venue - University of Wollongong, NSW.2007. Volume 29. Host and Venue - University of Ballarat, VIC. First running of HDKM.2006. Volume 28. Host and Venue - University of Tasmania, TAS.2005. Volume 27. Host - University of Newcastle, NSW. APBC held separately from 2005.2004. Volume 26. Host and Venue - University of Otago, Dunedin, New Zealand. First running of APCCM.2003. Volume 25. Hosts - Flinders University, University of Adelaide and University of South Australia. Venue
- Adelaide Convention Centre, Adelaide, SA. First running of APBC. Incorporation of ACE. ACSAC heldseparately from 2003.
2002. Volume 24. Host and Venue - Monash University, Melbourne, VIC.2001. Volume 23. Hosts - Bond University and Griffith University (Gold Coast). Venue - Gold Coast, QLD.2000. Volume 22. Hosts - Australian National University and University of Canberra. Venue - ANU, Canberra,
ACT. First running of AUIC.1999. Volume 21. Host and Venue - University of Auckland, New Zealand.1998. Volume 20. Hosts - University of Western Australia, Murdoch University, Edith Cowan University and
Curtin University. Venue - Perth, WA.1997. Volume 19. Hosts - Macquarie University and University of Technology, Sydney. Venue - Sydney, NSW.
ADC held with DASFAA (rather than ACSW) in 1997.1996. Volume 18. Host - University of Melbourne and RMIT University. Venue - Melbourne, Australia. CATS
joins ACSW.1995. Volume 17. Hosts - Flinders University, University of Adelaide and University of South Australia. Venue -
Glenelg, SA.1994. Volume 16. Host and Venue - University of Canterbury, Christchurch, New Zealand. CATS run for the first
time separately in Sydney.1993. Volume 15. Hosts - Griffith University and Queensland University of Technology. Venue - Nathan, QLD.1992. Volume 14. Host and Venue - University of Tasmania, TAS. (ADC held separately at La Trobe University).1991. Volume 13. Host and Venue - University of New South Wales, NSW.1990. Volume 12. Host and Venue - Monash University, Melbourne, VIC. Joined by Database and Information
Systems Conference which in 1992 became ADC (which stayed with ACSW) and ACIS (which now operatesindependently).
1989. Volume 11. Host and Venue - University of Wollongong, NSW.1988. Volume 10. Host and Venue - University of Queensland, QLD.1987. Volume 9. Host and Venue - Deakin University, VIC.1986. Volume 8. Host and Venue - Australian National University, Canberra, ACT.1985. Volume 7. Hosts - University of Melbourne and Monash University. Venue - Melbourne, VIC.1984. Volume 6. Host and Venue - University of Adelaide, SA.1983. Volume 5. Host and Venue - University of Sydney, NSW.1982. Volume 4. Host and Venue - University of Western Australia, WA.1981. Volume 3. Host and Venue - University of Queensland, QLD.1980. Volume 2. Host and Venue - Australian National University, Canberra, ACT.1979. Volume 1. Host and Venue - University of Tasmania, TAS.1978. Volume 0. Host and Venue - University of New South Wales, NSW.

Conference Acronyms
ACDC Australasian Computing Doctoral ConsortiumACE Australasian Computer Education ConferenceACSC Australasian Computer Science ConferenceACSW Australasian Computer Science WeekADC Australasian Database ConferenceAISC Australasian Information Security ConferenceAUIC Australasian User Interface ConferenceAPCCM Asia-Pacific Conference on Conceptual ModellingAusPDC Australasian Symposium on Parallel and Distributed Computing (replaces AusGrid)CATS Computing: Australasian Theory SymposiumHIKM Australasian Workshop on Health Informatics and Knowledge Management
Note that various name changes have occurred, which have been indicated in the Conference Acronyms sections
in respective CRPIT volumes.
xiii

ACSW and AISC 2011 Sponsors
We wish to thank the following sponsors for their contribution towards this conference.
Client: Computing Research & Education Project: IdentityJob #: COR09100 Date: November 09
CORE - Computing Research and Education,www.core.edu.au
Perth Convention Bureau,www.pcb.com.au
Australian Computer Society,www.acs.org.au
Curtin University of Technology,www.curtin.edu.au
QUT Information Security Institute,www.isi.qut.com
xiv

Contributed Papers
Proceedings of the Ninth Australasian Information Security Conference (AISC 2011), Perth, Australia
1

CRPIT Volume 116 - Information Security 2011
2

An Anonymous Authentication Protocol with Single-database PIR
Toru Nakamura1 Shunsuke Inenaga1 Kensuke Baba2 Daisuke Ikeda1
Hiroto Yasuura1
1 Graduate School/Faculty of Information Science and Electrical Engineering,Kyushu University
Moto’oka 744, Nishi-ku, Fukuoka, 819-0395, JapanEmail:{toru, inenaga, yasuura} @soc.ait.kyushu-u.ac.jp
[email protected] Research and Development Division, Kyushu University Library
10-1, Hakozaki 6, Higashi-ku, Fukuoka, 812-8581, JapanEmail:[email protected]
Abstract
This paper focuses on anonymous authentication systemsin multi-service environment, in which service providerscommunicate with the central manager in every authenti-cation. Such systems have a merit that the central managercan easily update the database of user information by com-parison to the existing anonymous authentication systemswithout communications between service providers andthe central manager. The purpose of this paper is to realizea practical authentication protocol for such systems whichsatisfies four requirements for security and privacy protec-tion, that is,correctness, impersonation resistance againstpassive insider,anonymity against central manager, andanonymity against service providers. The existing pro-tocol consists of a multi-database PIR scheme, in whichthere are copies of the same database and none of thesecopies are allowed to communicate with each other. Thispaper proposes an authentication protocol which consistsof the single-database PIR scheme proposed by Kushile-vitz and Ostrovsky. This protocol also realizes all theserequirements in the random oracle model. This proto-col is more practical since using a single database impliesthe above-mentioned assumptions for multi-database PIRschemes are not required any more.
1 Introduction
With the increase of the number of services, users areforced to manage more pairs of a user ID (pseudonym)and a password. Hence much attention is recently paidto authentication systems in multi-service environment,which enable each user to have only a pair in order touse multiple services with a central manager. For ex-ample, single-sign-on systems such as Microsoft’s .NETPassport, Shibboleth, and OpenID, have been popular. Inthis paper, we focus on issues about user privacy such thatactivity or preference of a user can be revealed by (1) ser-vice providers or (2) a central manager. If a user submitshis/her ID to multiple service providers and the centralmanager, information about what, when, and how oftena user accesses can be collected. In order to solve suchissues, an authentication protocol with anonymity against(1) service providers and (2) a central manager is essential.
Authentication systems in multi-service environmentcan be classified according to which service providers
Copyright c⃝2011, Australian Computer Society, Inc. This paper ap-peared at the 9th Australasian Information Security Conference (AISC2011), Perth, Australia, January 2011. Conferences in Research andPractice in Information Technology (CRPIT), Vol. 116, Colin Boyd andJosef Pieprzyk, Ed. Reproduction for academic, not-for-profit purposespermitted provided this text is included.
must communicate with the central manager in every au-thentication. With respect to authentication systems with-out such communications, some protocols to realize theboth kinds of anonymity are known, such as group signa-ture schemes (Chaum & van Heyst 1991), anonymous cre-dential schemes (Camenisch & Lysyanskaya 2002), anddynamic ID based anonymous authenticated key exchangeschemes (Liao & Wang 2009). However, such protocolshave a drawback that it is difficult for the central managerto deal with frequent queries to update the database of userinformation. Hence we focus on authentication systemswith communications between service providers and thecentral manager. The requirements for an authenticationsystem considered in this paper are the following.
• Correctness: if a user sends an authentication requestwith the valid password, every service provider ac-cepts the request.
• Impersonation resistance against passive insider1:even if an adversary is a service provider, the adver-sary cannot impersonate a legitimate user.
• Anonymity against service provider: it is difficult forany service providers to obtain any information abouta user ID.
• Anonymity against central manager: it is difficult forany central manager to obtain any information abouta user ID.
There are few schemes which satisfy the previous re-quirements, as far as we know. Nakamuraet al. (Naka-mura et al. 2009) proposed an anonymous authenticationprotocol which satisfies all the requirements previouslydescribed. This protocol is based onprivate informationretrieval (PIR) schemes (Chor et al. 1998)(Kushilevitz &Ostrovsky 1997). PIR schemes contribute for protectingprivacy of a client who makes a query to a database server.Using a PIR scheme, the client can reconstruct an elementfrom the answer which the database server has generatedwith the query, without the index of the element being re-vealed to the database server. The authentication proto-col consists of a multi-database PIR scheme (Chor et al.1998). This scheme requires the assumption that there arecopies of the same database and none of these copies areallowed to communicate with each other. However, theassumption is not practical.
In this paper, we propose an authentication proto-col with a single-database PIR scheme, which does notrequire copies of the same database. The protocol iscalledSingle-database PIR based Anonymous Authentica-tion Protocol(SPAAP for short). The first single-database
1In this paper, a “passive and insider adversary” means that an adversary whois restricted to eavesdropping on messages that the service provider obtains.
Proceedings of the Ninth Australasian Information Security Conference (AISC 2011), Perth, Australia
3

PIR scheme, which is based on the quadratic residuos-ity assumption, is proposed by Kushilevitz and Ostro-vsky (Kushilevitz & Ostrovsky 1997). The basic ideaof realizing the authentication protocol is that (1) a usermakes the query related his/her ID and encrypts the querywith the public-key of the central manager, (2) the centralmanager decrypts the query and makes the answer relatedto the information to verify the user, and (3) the serviceprovider reconstructs the information from the answer,where IDs correspond to indices of the database. If the ser-vice provider can obtain the ID, it is impossible to realizeanonymity against service providers. However, originalKushilevitz and Ostrovsky’s single-database PIR schemerequires an index to reconstruct the element from the an-swer. Hence the single-database PIR scheme cannot be ap-plied to our protocol. In this paper, we use the special ver-sion of Kushilevitz and Ostrovsky’s single-database PIR,in which an element of the database can be reconstructedwithout the index. Furthermore, we prove that SPAAP sat-isfies all the requirements under the quadratic residuosityassumption and the random oracle assumption (Bellare &Rogaway 1993).
SPAAP is more practical than the existing proto-col (Nakamura et al. 2009) since using a single databaseimplies the assumptions for multi-database PIR schemesare not required any more. Therefore, this paper con-tributes development of anonymous authentication sys-tems in which service providers need to communicate withthe central manager from the view point of reducing theimpractical assumption.
The organization of this paper is shown as follows. Insection 2, we provide some necessary definitions. In sec-tion 3, we introduce the definitions of the four require-ments of anonymous authentication protocols. In section4, we show the definition of the special version of single-database PIR and the detail of SPAAP. In section 5, weprove that SPAAP satisfies all the requirements.
2 Preliminaries
2.1 Notations
Let Z denote the set of integers andN denote the set ofnatural numbers. For a finite setX, let |X| denote thenumber of elements whichX contains. Forx ∈ Z, let∥x∥ denote the binary length ofx. For k ∈ N, let [k] ={1, 2, ..., k}. Fora, b ∈ Z, let a|b mean thatb is divisibleby a. Letx ◦ y be the concatenation of bit stringsx andy.We denote any polynomial ofn ∈ N by p(n), and somepolynomial bypoly(n).
An interactive Turing machine(ITM) (Goldreich 2001)is a Turing machine which has a pair ofcommunicationtapesin addition to a common input tape, a local inputtape, an output tape, and a work tape. Ajoint computationof two ITMs is a sequence of pairs of the local configu-rations. The output of a joint computation is the outputof one of the ITMs. The output of a Turing machineAon an inputx is denoted byA(x). We denote by⟨A,B⟩a joint computation of Turing machinesA andB, and by⟨A(y),B(z)⟩(x) its output on a common inputx, a lo-cal inputy for A, and a local inputz for B. We some-times omit the brackets if the input is empty. In the restof this paper, we sometimes call a Turing machineA an“algorithm” A and a joint computation⟨A,B⟩ a “proto-col” ⟨A,B⟩. The idea of a joint computation of two ITMscan be extended straightforwardly to that of three ITMs bytwo pairs of communication tapes.
For random variablesX,Y distributed over a setZ, let
Pr[X = Y ] =∑
x,y∈Z
Pr[X = x] · Pr[Y = y] · χ(x, y),
whereχ is a predicate such thatχ(a, b) = 1 if a = b, andχ(a, b) = 0 otherwise. The output of a probabilistic algo-rithmA is determined by given inputs and random sources(called coin tosses). Assuming that coin tosses are givenas local inputs, we can regard a probabilistic algorithm asa deterministic algorithm. LetAD be a deterministic al-gorithm corresponding to a probabilistic algorithmA. Weassume that coin tossesr is a t-bit string. For randomvariablesX,Y distributed over a setZ andx, y ∈ Z, let
Pr[A(x) = y] =|{r|AD(x, r) = y}|
2t,
Pr[A(X) = y] =∑x∈Z
Pr[X = x] · Pr[A(x) = y], and
Pr[A(X) = Y ] =∑
x,y∈Z
Pr[X = x] · Pr[Y = y]·
Pr[A(x) = y].
2.2 Indistinguishability
Definition 1 For any m ∈ N, two sequences of ran-dom variablesX = (X(1), X(2), . . . , X(m)) and Y =(Y (1), Y (2), . . . , Y (m)) whose elements are distributedover{0, 1}poly(k) are (computationally)indistinguishableif for any k ∈ N, any probabilistic polynomial-time algo-rithmB,
|Pr[B(1k, X(1), X(2), . . . , X(m)) = 1]
− Pr[B(1k, Y (1), Y (2), . . . , Y (m)) = 1]| < 1
p(k).
Definition 2 A sequence of random variablesX whichare distributed over{0, 1}poly(k) is constructibleif thereexists a probabilistic polynomial-time algorithmS suchthat for anyk ∈ N, the sequence of random variablesS(1k) andX are identically distributed.
Lemma 1 For any k ∈ N, any m ∈ poly(k),any constructible sequences of random variablesX =(X(1), X(2), . . . , X(m)) andY = (Y (1), Y (2), . . . , Y (m))distributed over{0, 1}poly(k), if for any i ∈ [m], X(i)
andY (i) are indistinguishable, thenX andY are indis-tinguishable.
proof: This can be proven easily by the standard hybridargument (Goldreich 2001).
2
2.3 Quadratic Residuosity Assumption
For a ∈ Z, let [[a]] = {x ∈ Z|x ≡ a mod n} ([[a]]is called theresidue classmodulon containinga). Forn ∈ N, let
Z∗n = {x|1 ≤ x ≤ n, gcd(n, x) = 1}.
Thequadratic residuosity predicateWn is defined as fol-lows:
Wn(y) =
{0 if ∃w ∈ Z∗
n such thatw2 = y mod n1 otherwise
.
For a positive oddn, let(xn
)denotethe Jacobi symbol
of x mod n. Let
Z+1n = {x ∈ Z∗
n|(xn
)= +1}.
CRPIT Volume 116 - Information Security 2011
4

Let QR+1n = {x ∈ Z+1
n |Wn(x) = 0}, QNR+1n = {x ∈
Z+1n |Wn(x) = 1}.
Informally, the Quadratic Reduosity Assumption is theassumption that there is no probabilistic polynomial-timealgorithm for computing the predicateWn(x). We showthe definition of the assumption as follows.
Definition 3 (Quadratic Reduosity Assumption) Fork ∈ N, let Ik = {n|n = α ·β, α andβ are distinct primes,∥α∥ = ∥β∥ = k}. For any k ∈ N, any probabilisticpolynomial-time algorithmB,
Pr[B(N,X) =WN (X)] <1
2+
1
p(k),
whereN is a random variable uniformly distributed overIk andX is a random variable uniformly distributed overZ+1N .
3 Requirements of Anonymous Authentication Pro-tocol
In this section, we introduce the authentication modelwhich we assume in this paper and the definitions of thefour requirements of anonymous authentication protocols.
3.1 Authentication Model
In this paper, we assume an authentication model whichconsists of the following three types of entities.
• User: Letm be the number of the users. Each useris assigned the uniqueidentifier i ∈ [m] and has apasswordxi ∈ {0, 1}ℓ for a natural numberℓ. (Notethatℓ is a polynomial of a security parameterk. )
• Service provider: A service provider verifieswhether the entity who has sent an authentication re-quest is truly the legitimate user.
• Central manager: A central managerstores the se-quencex = (x1, x2, ..., xm) of the passwords of theusers. We assume that each password is a randomstring.
Throughout this paper, we assume that
• each user can communicate only with serviceproviders,
• each service provider can communicate with usersand the central manager, and
• the central manager can communicate only with ser-vice providers.
Fig.1 is the authentication model that describes whichpairs of entities can communicate each other.
We define an authentication protocol as a joint com-putation⟨P,V,M⟩. P,V, andM mean the behaviors ofa user, a service provider, and a central manager, respec-tively. P takes a pair of an identifieri and acandidatepasswordz ∈ {0, 1}ℓ as inputs, andM takesx as an in-put. After running the authentication protocol,V outputs1/0.
3.2 Requirements
We show the four requirements which an anonymous au-thentication protocol⟨P,V,M⟩ should satisfy as follows.
U
S C
…
…
…
……
…
…
…
U
S C
…
…
…
……
…
…
…
Figure1: The authentication model describes which pairsof entities can communicate each other. (U : a user,S: aservice provider,C: a central manager)
• Correctness: for anyk, ℓ,m ∈ N, any i ∈ [m], anyx = {xi | i ∈ [m], xi ∈ {0, 1}ℓ},
Pr[⟨P(1k, i, xi),V(1k),M(1k, x)⟩ = 1] > 1− 1
p(k).
• Impersonation resistance against passive insider: foranyk, ℓ,m ∈ N any i ∈ [m], and any probabilisticpolynomial-time algorithmB,
Pr[⟨B(1k, T1),V(1k),M(1k, X)⟩ = 1] <1
p(k),
whereX is a random variable uniformly distributedover ({0, 1}ℓ)m andT1 is a random variable whichmeans a transcript ofV ’s local tape and read tapesafter running⟨P(i, x),V,M(x)⟩wherex is a samplefromX.
• Anonymity against central manager: for anyk, ℓ,m ∈ N, any i, j ∈ [m], any z, z′ ∈ {0, 1}ℓ,and any probabilistic polynomial-time algorithmB,
|Pr[B(1k, T2) = 1]− Pr[B(1k, T3) = 1]| < 1
p(k),
whereX is a random variable uniformly distributedover ({0, 1}ℓ)m andT2 is a random variable whichmeans a transcript ofM’s local tape and read tapesafter running⟨P(i, z),V,M(x)⟩ wherex is a sam-ple from X. Similarly, T3 means a transcript afterrunning⟨P(j, z′),V,M(x)⟩.• Anonymity against service provider: for anyk, ℓ,m ∈ N, any i, j ∈ [m], any z, z′ ∈ {0, 1}ℓ,and any probabilistic polynomial-time algorithmB,
|Pr[B(1k, T4) = 1]− Pr[B(1k, T5) = 1]| < 1
p(k),
whereX is a random variable uniformly distributedover ({0, 1}ℓ)m andT4 is a random variable whichmeans a transcript ofV ’s local tape and read tapesafter running⟨P(i, z),V,M(x)⟩ wherex is a sam-ple from X. Similarly, T5 means a transcript afterrunning⟨P(j, z′),V,M(x)⟩.
Proceedings of the Ninth Australasian Information Security Conference (AISC 2011), Perth, Australia
5
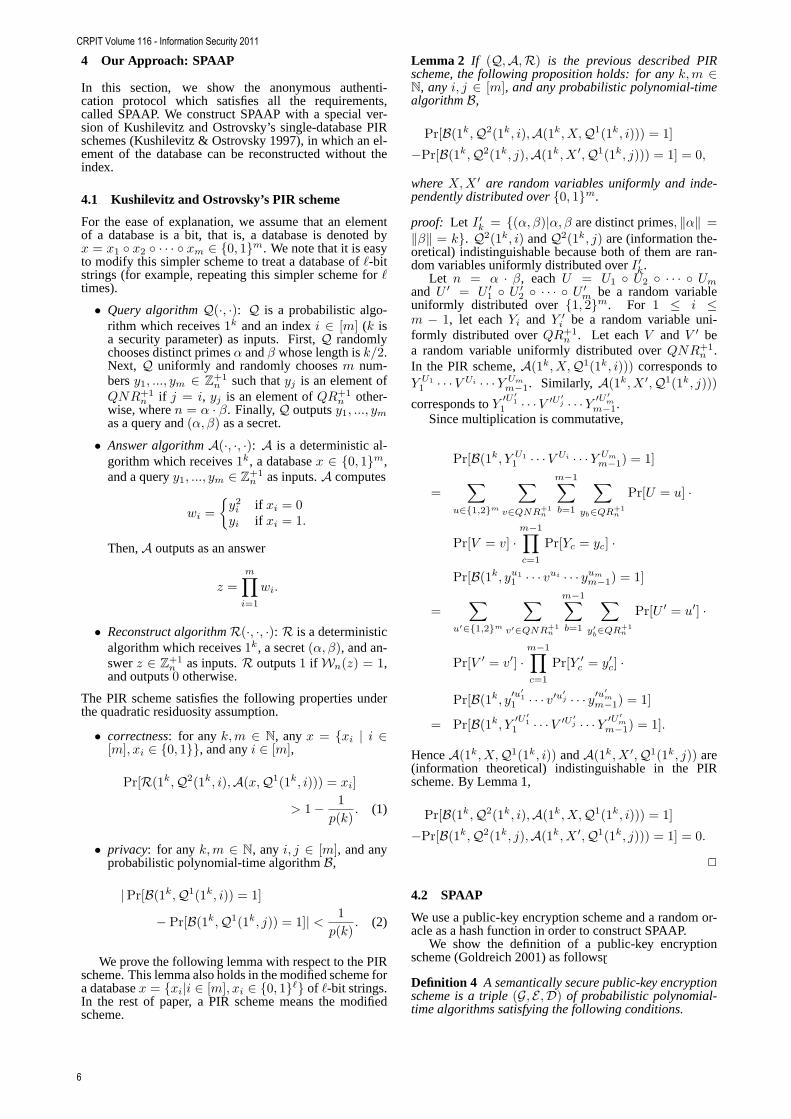
4 Our Approach: SPAAP
In this section, we show the anonymous authenti-cation protocol which satisfies all the requirements,called SPAAP. We construct SPAAP with a special ver-sion of Kushilevitz and Ostrovsky’s single-database PIRschemes (Kushilevitz & Ostrovsky 1997), in which an el-ement of the database can be reconstructed without theindex.
4.1 Kushilevitz and Ostrovsky’s PIR scheme
For the ease of explanation, we assume that an elementof a database is a bit, that is, a database is denoted byx = x1 ◦ x2 ◦ · · · ◦ xm ∈ {0, 1}m. We note that it is easyto modify this simpler scheme to treat a database ofℓ-bitstrings (for example, repeating this simpler scheme forℓtimes).
• Query algorithmQ(·, ·): Q is a probabilistic algo-rithm which receives1k and an indexi ∈ [m] (k isa security parameter) as inputs. First,Q randomlychooses distinct primesα andβ whose length isk/2.Next, Q uniformly and randomly choosesm num-bersy1, ..., ym ∈ Z+1
n such thatyj is an element ofQNR+1
n if j = i, yj is an element ofQR+1n other-
wise, wheren = α · β. Finally,Q outputsy1, ..., ymas a query and(α, β) as a secret.
• Answer algorithmA(·, ·, ·): A is a deterministic al-gorithm which receives1k, a databasex ∈ {0, 1}m,and a queryy1, ..., ym ∈ Z+1
n as inputs.A computes
wi =
{y2i if xi = 0yi if xi = 1.
Then,A outputs as an answer
z =m∏i=1
wi.
• Reconstruct algorithmR(·, ·, ·): R is a deterministicalgorithm which receives1k, a secret(α, β), and an-swerz ∈ Z+1
n as inputs.R outputs1 if Wn(z) = 1,and outputs0 otherwise.
The PIR scheme satisfies the following properties underthe quadratic residuosity assumption.
• correctness: for anyk,m ∈ N, anyx = {xi | i ∈[m], xi ∈ {0, 1}}, and anyi ∈ [m],
Pr[R(1k,Q2(1k, i),A(x,Q1(1k, i))) = xi]
> 1− 1
p(k). (1)
• privacy: for anyk,m ∈ N, any i, j ∈ [m], and anyprobabilistic polynomial-time algorithmB,
|Pr[B(1k,Q1(1k, i)) = 1]
− Pr[B(1k,Q1(1k, j)) = 1]| < 1
p(k). (2)
We prove the following lemma with respect to the PIRscheme. This lemma also holds in the modified scheme fora databasex = {xi|i ∈ [m], xi ∈ {0, 1}ℓ} of ℓ-bit strings.In the rest of paper, a PIR scheme means the modifiedscheme.
Lemma 2 If (Q,A,R) is the previous described PIRscheme, the following proposition holds: for anyk,m ∈N, anyi, j ∈ [m], and any probabilistic polynomial-timealgorithmB,
Pr[B(1k,Q2(1k, i),A(1k, X,Q1(1k, i))) = 1]
−Pr[B(1k,Q2(1k, j),A(1k, X ′,Q1(1k, j))) = 1] = 0,
whereX,X ′ are random variables uniformly and inde-pendently distributed over{0, 1}m.
proof: Let I ′k = {(α, β)|α, β are distinct primes,∥α∥ =∥β∥ = k}. Q2(1k, i) andQ2(1k, j) are (information the-oretical) indistinguishable because both of them are ran-dom variables uniformly distributed overI ′k.
Let n = α · β, eachU = U1 ◦ U2 ◦ · · · ◦ Umand U ′ = U ′
1 ◦ U ′2 ◦ · · · ◦ U ′
m be a random variableuniformly distributed over{1, 2}m. For 1 ≤ i ≤m − 1, let eachYi and Y ′
i be a random variable uni-formly distributed overQR+1
n . Let eachV and V ′ bea random variable uniformly distributed overQNR+1
n .In the PIR scheme,A(1k, X,Q1(1k, i))) corresponds toY U11 · · ·V Ui · · ·Y Um
m−1. Similarly, A(1k, X ′,Q1(1k, j)))
corresponds toY ′U ′1
1 · · ·V ′U ′j · · ·Y ′U ′
mm−1.
Since multiplication is commutative,
Pr[B(1k, Y U11 · · ·V Ui · · ·Y Um
m−1) = 1]
=∑
u∈{1,2}m
∑v∈QNR+1
n
m−1∑b=1
∑yb∈QR+1
n
Pr[U = u] ·
Pr[V = v] ·m−1∏c=1
Pr[Yc = yc] ·
Pr[B(1k, yu11 · · · vui · · · yum
m−1) = 1]
=∑
u′∈{1,2}m
∑v′∈QNR+1
n
m−1∑b=1
∑y′b∈QR+1
n
Pr[U ′ = u′] ·
Pr[V ′ = v′] ·m−1∏c=1
Pr[Y ′c = y′c] ·
Pr[B(1k, y′u′1
1 · · · v′u′j · · · y′u
′m
m−1) = 1]
= Pr[B(1k, Y ′U ′1
1 · · ·V ′U ′j · · ·Y ′U ′
mm−1) = 1].
HenceA(1k, X,Q1(1k, i)) andA(1k, X ′,Q1(1k, j)) are(information theoretical) indistinguishable in the PIRscheme. By Lemma 1,
Pr[B(1k,Q2(1k, i),A(1k, X,Q1(1k, i))) = 1]
−Pr[B(1k,Q2(1k, j),A(1k, X ′,Q1(1k, j))) = 1] = 0.
2
4.2 SPAAP
We use a public-key encryption scheme and a random or-acle as a hash function in order to construct SPAAP.
We show the definition of a public-key encryptionscheme (Goldreich 2001) as follows.
Definition 4 A semantically secure public-key encryptionscheme is a triple(G, E ,D) of probabilistic polynomial-time algorithms satisfying the following conditions.
CRPIT Volume 116 - Information Security 2011
6

• Oninput1k, algorithmG outputs a pair of bit strings.
• For any pair of(e, d) in the range ofG(1k), and anyγ ∈ {0, 1}∗,
Pr[D(d, E(e, γ)) = γ] = 1. (3)
• For any k ∈ N any x, y ∈ {0, 1}poly(k), and anyprobabilistic polynomial-time algorithmB,
|Pr[B(G1(1k), E(G1(1k), x)) = 1]
− Pr[B(G1(1k), E(G1(1k), y)) = 1]| < 1
p(k). (4)
In this paper, we assume that we can regard any hashfunction as a random oracle (that is, the random oraclemodel) (Bellare & Rogaway 1993). This assumption iscalled therandom oracle assumption. In the random ora-cle model, all entities can interact with a random oracleH,that is a single function which is uniformly chosen fromall possible functions. We note that if the random oracleH receives the same input,H answers the same output.We assume that the random oracle outputsm bit stringson inputsℓ bit strings, whereℓ andm are polynomials ofa security parameterk. The following lemma holds.
Lemma 3 For anyk ∈ N, anyx, y ∈ {0, 1}poly(k)(x =y),and probabilistic polynomial-time algorithmB,
|Pr[B(1k,H(x)) = 1]− Pr[B(1k,H(y)) = 1] = 0.
SPAAP ⟨P,V,M⟩, which satisfies the all require-ments; correctness, impersonation resistance against pas-sive insider, anonymity against central manager, andanonymity against service provider, is shown as follows,where(Q,A,R) is the Kushilevitz and Ostrovsky’s PIRscheme which described in the previous section.
1. M computes(e, d)← G(1k) and publishese.
2. P computes(q, s)← Q(1k, i) and sends(E(e, q), s)to V.
3. V sendsE(e, q) toM.
4. M obtainsq by decryptingE(e, q). M randomlychoosesc ∈ {0, 1}ℓ and for anyj ∈ [m] computesx′j ← H(xj , c). Let x′ = (x′
1, x′2, . . . , x
′m). M
computesa← A(1k, x′, q) and sends(c, a) to V.
5. V computesx′i ← R(1k, s, a) = H(xi, c) and sends
c toP.
6. P computesz′ ← H(z, c) wherez is a candidatepassword, and sendsz′ to V.
7. V outputs1 if z′ = x′i, and outputs0 otherwise.
5 Security Analysis
Theorem 1 SPAAP has correctness under the quadraticresiduosity assumption and the random oracle assump-tion.
proof: In Step 2,q is always decrypted by Equality (3).In Step 5, the probability thatx′
i = H(xi, c) is higherthan1 − 1/p(k) by Inequality (1). Hence ifz = xi, theprobability thatz′ = x′
i is higher than1− 1/p(k). 2
Theorem 2 SPAAP has impersonation resistance againstpassive insider under the quadratic residuosity assump-tion and the random oracle assumption.
proof: The main idea of this proof is that an adversarywho has no pre-knowledge can simulate the transactionwhich is given to the service provider.
We prove that by contradiction. It is clearly (in-formation theoretic) hard for any adversary to imper-sonate a legitimate user, if the adversary can obtain nopre-knowledge aboutx. That is, for any probabilisticpolynomial-time algorithmB,
Pr[⟨B(1k),V(1k),M(1k, X)⟩ = 1] =1
2ℓ<
1
p(k), (5)
whereX is a random variable uniformly distributed over({0, 1}ℓ)m.
The random variableT1 is {E(G1(1k),Q1(i)),Q2(i),c,A((H(x1, c), ...,H(xm, c)),Q1(i)),H(z, c)},where x1, . . . xm are samples from {0, 1}ℓ,and c is a sample from {0, 1}ℓ. Let T ′
1 be{E(G1(1k), 1|Q1(i)|),Q2(i), c,A(y1, . . . ym,Q1(i)), u},where y1, . . . ym are samples from{0, 1}ℓ, and cand u are samples from{0, 1}ℓ. By Inequality(4), E(G1(1k),Q1(i)) and E(G1(1k), 1|Q1(i)|) areindistinguishable. By the basic property of a ran-dom oracle, A(H(x1, c), ...,H(xm, c),Q1(i)) andA(y1, . . . , ym,Q1(i)) are indistinguishable. ByLemma 1,T1 andT ′
1 are indistinguishable.We assume that SPAAP does not have impersonation
resistance against passive insider, that is, there exists somepolynomialq and some probabilistic polynomial-time al-gorithmD such that
Pr[⟨D(1k, T1),V(1k),M(1k, X)⟩ = 1] ≥ 1
q(k). (6)
We derive contradiction by constructing a probabilisticpolynomial-time algorithmD′ which takes1k as an inputand uses the algorithmD as a subroutine.D′ proceeds asfollows.
1. D′ computes(e, d) ← G(1k) and randomly choosesc, y, u.
2. D′ computes t2 = {E(G1(1k), 1|Q1(i)|),Q2(i), c,A(y,Q1(i)), u}.
3. D′ outputsD(1k, t2).By Inequality (6), it holds that
Pr[⟨D′(1k),V(1k),M(1k, X)⟩ = 1] ≥ 1
q(k),
becauseT1 andT ′1 areindistinguishable. This contradicts
to Inequality (5). 2
Theorem 3 SPAAP has anonymity against central man-ager under the quadratic residuosity assumption and therandom oracle assumption.proof: We prove that by contradiction. The random vari-ableT2 is {G2(1k), E(G1(1k),Q1(i))} and random vari-ableT3 is {G2(1k), E(G1(1k),Q1(j))}. We assume thatSPAAP does not have anonymity against central manager,that is, there exists some polynomialq and some proba-bilistic polynomial-time algorithmD such that
|Pr[D(1k, T2) = 1]− Pr[D(1k, T3) = 1]| ≥ 1
q(k). (7)
We derive contradiction by constructing a probabilis-tic polynomial-time algorithmD′ which takes1k and yas inputs and uses the algorithmD as a subroutine.D′
proceeds as follows.
Proceedings of the Ninth Australasian Information Security Conference (AISC 2011), Perth, Australia
7

1. D′ computes(e, d)← G(1k).
2. D′ outputsD(d, E(e, y)).
By Inequality (7), it holds that
|Pr[D(1k,Q1(1k, i)) = 1]
− Pr[D(1k,Q1(1k, j)) = 1]| ≥ 1
p(k).
Thiscontradicts to Inequality (2). 2
Theorem 4 SPAAP has anonymity against serviceprovider under the quadratic residuosity assumption andthe random oracle assumption.
proof: The random variable T4 is{E(G1(1k),Q1(i)),Q2(i), c,A((H(x1, c), ...,H(xm, c)),Q1(i)),H(z, c)}, and the random variableT5 is{E(G1(1k),Q1(j)),Q2(j), c,A((H(x1, c), ...,H(xm, c)),Q1(j)),H(z′, c)} where x1, . . . xm are samples from{0, 1}ℓ, and c is a sample from{0, 1}ℓ. By Inequality(4), E(G1(1k),Q1(i)) andE(G1(1k),Q1(j)) are indistin-guishable. By Lemma 2 and the basic property of a ran-dom oracle, Q2(i),A((H(x1, c), ...,H(xm, c)),Q1(i))and Q2(j),A((H(x1, c), ...,H(xm, c)),Q1(j)) are in-distinguishable. By Lemma 3,H(z, c) andH(z′, c) are(information theoretical) indistinguishable. Therefore,T4andT5 are indistinguishable by Lemma 1.
2
6 Conclusions
In this paper, we proposed SPAAP, which consists of thespecial version of the single-database PIR scheme pro-posed by Kushilevitz and Ostrovsky, in which an ele-ment of the database can be reconstructed without the in-dex. We proved that SPAAP satisfies all the requirements;correctness, impersonation resistance against passive in-sider, anonymity against central manager, and anonymityagainst service providers under the quadratic residuosityassumption and the random oracle assumption. SPAAP ismore practical than the existing protocol (Nakamura et al.2009) since using a single database implies the assump-tions for multi-database PIR schemes are not required anymore.
Acknowledgements
This work was in part supported by CREST-DVLSI ofJST. We are grateful for their support.
References
Bellare, M. & Rogaway, P. (1993), Random oracles arepractical: A paradigm for designing efficient protocols,in ‘In Proc. 1st ACM Conference on Computer andCommunications Security’, ACM Press, pp. 62–73.
Camenisch, J. & Lysyanskaya, A. (2002), Dynamic ac-cumulators and application to efficient revocation ofanonymous credentials,in ‘Advances in Cryptology―CRYPTO 2002’, LNCS, Springer-Verlag, pp. 101–120.
Chaum, D. & van Heyst, E. (1991), Group signatures,in‘Advances in Cryptology - EUROCRYPT 1991’, Vol.547 ofLNCS, Springer-Verlag, pp. 257–270.
Chor, B., Goldreich, O., Kushilevitz, E. & Sudan, M.(1998), ‘Private information retrieval’,Jornal of theACM45, 965–982.
Goldreich, O. (2001),Foundations of Cryptography, Cam-bridge University.
Kushilevitz, E. & Ostrovsky, R. (1997), Replication is notneeded: Single database, computationally-private infor-mation retrieval,in ‘the 38th Annual Symposium onFoundations of Computer Science’, pp. 364–373.
Liao, Y.-P. & Wang, S.-S. (2009), ‘A secure dynamicID based remote user authentication scheme for multi-server environment’,Computer standards and inter-faces31(1), 24–29.
Nakamura, T., Inenaga, S., Ikeda, D., Baba, K. & Yasuura,H. (2009), Anonymous authentication systems basedon private information retrieval,in ‘The First Confer-ence on ‘Networked Digital Technologies’(NDT2009)’,pp. 53–58.
CRPIT Volume 116 - Information Security 2011
8

Cube attack in finite fields of higher order
Andrea Agnesse1 Marco Pedicini2
1 Dipartimento di Matematica, Universita Roma TreLargo San Leonardo Murialdo 1, Rome, Italy
2 Istituto per le Applicazioni del Calcolo “Mauro Picone”Consiglio Nazionale delle Ricerche
Viale Manzoni 30, 00185 Rome, ItalyEmail: [email protected]
Abstract
We present in full details a version of the Dinur-Shamir Cube Attack (Dinur & Shamir 2009) for ageneric finite field of order q. In particular, when ap-plied to multivariate monomials of degree d in k < dvariables, the attack acts exactly in the same way ifthe selected monomial was using the degree k mono-mial in the same k variables.
Keywords: Algebraic cryptanalysis, Cube Attack.
1 Introduction
The Cube Attack is a new cryptographic attackbased on multivariate polynomials over F2, suitablefor both block and stream ciphers. In (Dinur &Shamir 2009), authors introduced this methodologyas a variant of algebraic attacks at aiming a way todistill from a cryptographic encoding function a setof linear relations involving secret parameters (e.g.,key bits) by means of tweakable ones (e.g., plaintextor initial vectors). The basic requirement for the at-tack is the possibility of describing the cryptographicscheme as a function in m + n variables that can bepartitioned in public x1, . . . , xn (i.e., that can be cho-sen during the attack, therefore tweakable in accordwith (Dinur & Shamir 2009)) and private variablesk1, . . . , km (i.e., those variables that have to be deter-mined during the attack). Note that public variablescan represent bits of the initial vector but in otherscenarios, they could be bits of the key, or bits of theplaintext, see for instance (Aumasson et al. 2009),(Joux 2009).
As usual, the goal of the attack is to find the valueof the private variables: by obtaining from the enci-phering function enough linear relations that have tobe satisfied by these variables and having a way toconnect them with ciphertext. Whenever the numberof independent linear relations is equal to the numberof variables, the system can be solved. In order to dothis the attacker has to evaluate the enciphering func-tion by choosing assignments for both public and pri-vate variables. The values to be used are determinedas an application of the following two theorems:
Theorem 1 For every polynomial p and for any sub-
Copyright c©2011, Australian Computer Society, Inc. Thispaper appeared at the 9th Australasian Information SecurityConference (AISC 2011), Perth, Australia, January 2011. Con-ferences in Research and Practice in Information Technology(CRPIT), Vol. 116, Colin Boyd and Josef Pieprzyk, Ed. Re-production for academic, not-for-profit purposes permitted pro-vided this text is included.
set of indices of variables I, we define
pI :=∑v∈CI
p|v, (1)
where CI is the set of n-tuples such that the elementsof index i ∈ I take all the possible combinations ofvalues 0/1, while the ones with index i 6∈ I remain un-determined as a variable xi. So each element of CIis a formal combination of boolean values and vari-ables, and pI is a polynomial which does not dependon variables with index in I.
Then pI = pS(I) where pS(I) is the quotient of theeuclidean division of p by tI :=
∏i∈I xi.
The quotient pS(I) is called superpolynomial of theterm tI . If for some index set I, the correspondingpolynomial pS(I) is linear, then tI is called maxtermof p, and the following holds:
Theorem 2 Let tI be a maxterm of a polynomial p,so that its superpoly is pS(I) = a0 +a1x1 + . . .+anxn,and let X and Xj be the sets X = {x ∈ Fn2 : xi = 0for all i 6∈ I} and Xj =
{x ∈ Fn2 : xi = 0 for all
i 6∈ I ∪ {j} and xj = 1}
. Then
1. a0 =∑x∈X
p|x;
2. aj = a0 +∑x∈Xj
p|x for all j 6∈ I.
The two theorems above can be easily proven con-sidering that in F2 the sum equals the difference andthe fact that the characteristic of the field is 2. In thenext sections we show how the theorems can be easilygeneralized to every finite field Fq.
In Section 2, we introduce the attack as presentedin (Dinur & Shamir 2009). In Section 3, we describethe various phases of the attack when the polynomialrepresentation of the enciphering function is available,while in Section 4 we describe a strategy to performthe attack in a realistic scenario, i.e., when we do nothave the explicit expression of the polynomial but wehave only access to it. Therefore, it can be accessed asa “black box” function. In Section 5, we present theoriginal contribution of this paper by discussing thecube attack in Fq that was only claimed as possiblein (Dinur & Shamir 2009).
2 Scenario of the attack
The basic requirement for the attack is that the cryp-tographic scheme can be expressed as a multivari-ate function in m + n variables over F2. Then we
Proceedings of the Ninth Australasian Information Security Conference (AISC 2011), Perth, Australia
9

may think this enciphering function as a polynomialp(v1, . . . , vm, x1, . . . , xn). The crucial point in thecube attack is that there are variables that can bechosen, these variable are here denoted by v1, . . . , vmand they are called public variables. These variablesare for instance, known plaintext variables or they arevariables associated to bits of the initial vector. Onthe other hand, there are variables that the attackercannot control, they are denoted by x1, . . . , xn andin typical cases they are the secret variables whichcontain the key bits.
The aim of the attack is to “solve” the polynomial,i.e., to find the values of the secret variables.
The attack can be divided in two distinct phases:in the preprocessing phase the goal is to derive fromthe polynomial p enough linear relations containingonly the secret variables to create a solvable linearsystem of equations; at this scope the attacker canevaluate the polynomial by suitably choosing bothpublic and secret variables. The matrix associated tothe found linear system can easily be inverted. Then,in the online phase, secret variables can be attackedby using the ciphertext to compute known terms ofthe system: these are combinations of known cipher-text values, these combinations are formed in accordto the terms which appear in the sums of cubes onthe public variables used in the offline phase to findthe linear relations, Equation (1).
In this way the secret variables, which are set tothe key bits, can be determined by multiplication ofthe inverse matrix with the vector of combinations ofciphertext.
Note that the offline phase has to be carried onjust once, since the linear relations (i.e., the matrix)are proper to the enciphering function.
3 The attack
In the first part of this section, up to Theorem 3, wedo not need to distinguish between public and secretvariables, so we consider a polynomial in n variables,p(x1, . . . , xn), for the sake of simplicity of notations.
Let p be a multivariate polynomial over F2. Due tothe field equation x2 = x we know that each variablexj appears in the polynomial with exponent at most1, so we can identify each monomial with the subsetof the indices of the variables appearing in it.
We denote the term xi1· · ·xik as tI , where I ={i1, . . . , ik} ⊆ {1, . . . , n}.
For each term tI we can factor the polynomial pas p = tI · pS(I) + qI , where each term in pS(I) doesnot have any of the variables with indices in I and thepolynomial qI is the sum of those terms which are notdivisible for tI . We call pS(I) the superpoly of I in p.We are interested in those terms which have a linearnon-constant superpoly.
Definition 1 A term tI is a maxterm if deg(pS(I)) ≡1.
Given a subset I of indices of size k, say I ={i1, . . . , ik}, we define the cube CI as the set of n-tuples such that the elements of index j ∈ I takesall the possible combinations of values 0/1, while theones with index j 6∈ I remain undetermined as a vari-able xj . So each element of CI is a formal combi-nation of boolean values and variables1. For each el-
1For instance: if n = 3 and I = {1, 2}, then
CI = {(0, 0, x3), (0, 1, x3), (1, 0, x3), (1, 1, x3)}.
ement v ∈ CI we denote by p|v the polynomial inn − k variables p(v), which does not depend on thevariables xi1 , . . . , xik .
The main result of this section is stated in thefollowing theorem.
Theorem 3 For every polynomial p and for any sub-set of variables I we define pI :=
∑v∈CI p|v. Then
pI = pS(I).
Proof: We want to show the equivalence
pS(I) =∑v∈CI
p|v =∑v∈CI
(tI · pS(I) + qI
)|v .
We know that the variables in I do not appear in thesuperpoly pS(I), so, since tI is different from 0 (andequals 1) only in the top vertex v∗ of the cube CIsuch that v∗j = 1 for all j ∈ I, the superpoly pS(I)
remains unevaluated and is added only once, i.e.,∑v∈CI
p|v =∑v∈CI
(tI · pS(I)
)|v +
∑v∈CI
qI |v =
= pS(I) +∑v∈CI
qI |v.
Moreover, every term tJ of qI misses at least oneof the variables in I, so tJ does not change its valuewhen it is calculated on elements of the cube whichdiffer only in the variables not in J . This means thateach different evaluation of the term tJ is added aneven number of times, and so vanishes in the sum. �
Now we come back to the original model, in whichwe distinguish the variables in public and secret ones,p(v1, . . . , vm, x1, . . . , xn).
Since the goal of our attack is finding the valuesof the n secret variables actually used to make theencryption, and in the online phase we can tweak onlythe public ones, we are interested in maxterms whichare product of only public variables, tI = vi1 · · · vik ,k 6 d − 1, while their superpolies are sums of onlysecret variables. This last condition is easily satisfiedby setting all the public variables not in the maxtermtI to zero (or to any other chosen value).
To proceed with the attack, the first step is to findenough (at least n) maxterms, tI1 , . . . , tIη , all con-taining solely public variables. For each maxterm tIjwe calculate the superpoly pS(Ij)(x1, . . . , xn), whichcan be evaluated in the key k = (k1, . . . , kn) witha chosen-plaintext attack, using Theorem 3, whichstates that
pS(Ij)(k) = pIj (k) =∑
v∈CIj
p|v(k).
For each superpoly pS(Ij) we store the non con-stant part p′S(Ij)
(x1, . . . , xn) and the free term p′i =p′S(Ii)
(0, . . . , 0), so that we can set up the linear sys-temp′S(I1)(x1, . . . , xn) = pS(I1)(k)− p′1 = p′S(I1)(k)p′S(I2)(x1, . . . , xn) = pS(I2)(k)− p′2 = p′S(I2)(k)
...p′S(Iη)(x1, . . . , xn) = pS(Iη)(k)− p′η = p′S(Iη)(k)
(2)which, if it has a unique solution, once solved givesdirectly the key k.
CRPIT Volume 116 - Information Security 2011
10

Note 1 Note that the search of the matrix of coeffi-cients A of system (2) (and its eventually inversion)can be done in a preprocessing phase, since it is inde-pendent of the key used in the encryption.
Example 1 Let us consider the polynomial
p(v1, v2, v3, v4, x1, x2) = v1v2v3 + v1v2v4 + v1v3v4++ v2v3v4 + v1v2x2 + v1v3x1 + v1v3x2 + v2v3x1+
+ v1v4x2 + v3x1x2 + v4x1x2 + v1v2 + v1v3++ v3v4 + v4x1 + v1 + v3 + x1 + x1x2 + 1
over F2. We want to recover the key k = (0, 1).In the preprocessing phase we look for max-
terms which are product of only the public variablesv1, . . . , v4. Such maxterms are
t1,2 = v1v2, t2,3 = v2v3,
t1,3 = v1v3, t1,4 = v1v4,
while their superpolies, with the eventually other pub-lic variables set to zero, are
pS(1,2) = x2 + 1, pS(2,3) = x1,
pS(1,3) = x1 + x2 + 1, pS(1,4) = x2.
Among them, we choose two superpolies in order tocreate a square linear system with a unique solution.In this example we choose pS(1,2) and pS(1,3).The preprocessing phase ends by setting out the sys-tem {
x2 = pS(1,2)(k) + 1x1 + x2 = pS(1,2)(k) + 1 (3)
and calculating the inverse of the matrix of coeffi-cients,
A−1 =(
1 11 0
)∈M2(F2) .
In the online phase we can evaluate the polynomialin some chosen values of only the public variables, andit is sufficient to find the free terms of the system (3),as
pS(1,2)(k) =∑
v∈C1,2
p|v(k)
andpS(1,3)(k) =
∑v∈C1,3
p|v(k).
Finally, we are able to recover the key used by solv-ing system (3) in polynomial time with the use of thematrix A−1 previously calculated,
k = A−1
(11
)= (0, 1).
Generic ciphers usually implement the Shannonidea of confusion/diffusion and they have very com-plicated and huge polynomial representations; as aconsequence, any polynomial representing a ciphershould be so chaotic that it is correct to suppose thatits structure is indistinguishable from a random poly-nomial of a certain degree d, i.e., polynomial in whicheach monomial of degree at most d can occur withprobability 1
2 . We actually need only a weaker condi-tion on the polynomial, since we are merely interestedin maxterms which are products just of public vari-ables.
Definition 2 A polynomial p of m public variables,n secret variables and degree d is a d-random poly-nomial if each term of degree d which is the productof d − 1 public variables and one secret variable isindependently chosen to occur with probability 1
2 .
Note that in a d-random polynomial each termbeing product of d− 1 public variables is a maxtermwith probability 1− 2−n, as it is not a maxterm onlyif all the terms which contain the same d − 1 publicvariables and any secret variables do not appear in p.
Thus, with the hypothesis above, written the sys-tem (2) as Ax = b, we can suppose that every entryin the binary matrix A is chosen randomly. So, inorder to estimate the probability that A is invertible,we use the following lemma:
Lemma 1 The probability that a random matrix A ∈
Mn(F2) is invertible isn∏i=1
(1− 1
2i
).
Proof: We recall that a square matrix A of order nis invertible if and only if its rank is maximum andequals to n, i.e., if all its rows are linearly indepen-dent. This means that, for i = 1, . . . , n, the ith rowmust be linearly independent from all the previousones, so that it can be chosen in 2n − 2i−1 differentways out of the 2n possible n-tuples of elements inF2. Thus, the probability that A is invertible is
n∏i=1
(2n − 2i−1
2n
)=
n∏i=1
(1− 1
2n−i+1
)=
n∏i=1
(1− 1
2i
).
�
Remark 1 It is easy to show that the sequence Sn =∏ni=1
(1− 1
2i
)is decreasing and converge to a positive
value, as stated by the equivalence
∞∏i=1
(1− θi) > 0 ⇐⇒∞∑i=1
θi <∞ ,
where θi ∈ [0, 1]. As you can see from Figure 1, thisvalue is approximated by 0.28879.
æ
æ
ææ
æ æ æ æ æ æ æ æ æ æ æ
0 2 4 6 8 10 12 140.0
0.1
0.2
0.3
0.4
0.5
Figure 1: Probability Pr [det(A) 6= 0] expressed as afunction of the order of the matrix A.
This means that the probability that system (2) hasa unique solution can be made arbitrary close to 1 in-creasing the number of maxterms taken into account.
Proceedings of the Ninth Australasian Information Security Conference (AISC 2011), Perth, Australia
11

4 The “black box” attack
If the polynomial expression is not available, for in-stance because we have to deal with a huge polyno-mial or because the internal structure of the cipherhas been kept secret, we have to find the requiredmaxterms in a more complex way. In this case, infact, we have to proceed with a random walk tweak-ing both public and secret variables, which can alwaysbe done in the preprocessing phase. This is possiblebecause of the following theorem, in which we do notdistinguish between public and secret variables.
Theorem 4 Let tI be a maxterm in a poly-nomial p(x1, . . . , xn), so that its superpoly ispS(I)(x1, . . . , xn) = a0 + a1x1 + . . . + anxn, and letX and Xj be the sets X = {x ∈ Fn2 : xi = 0 for alli 6∈ I} and Xj =
{x ∈ Fn2 : xi = 0 for all i 6∈ I ∪ {j}
and xj = 1}
. Then
1. a0 =∑X
p(x);
2. aj = a0 +∑Xj
p(x) for all j 6∈ I.
Proof: We recall that, given the maxterm tI , the poly-nomial p can be written as p = tIpS(I) + qI .
1.∑X
p(x) =∑X
[tI(x)pS(I)(x) + qI(x)
]=
=∑X
tI(x)pS(I)(x) +∑X
qI(x) =
= pS(I)(0, . . . , 0) = a0
since the second sum is zero modulo 2 because,as already mentioned, each term in qI is a mono-mial that lacks at least a variable with index inI. As a consequence, the values obtained whenthe monomial is evaluated on CI are summed aneven number of times. On the other hand, in thefirst sum, the result is that only in one case theterms tI(x)pS(I)(x) take a value different from 0,namely when tI is evaluated to 1: in this case,since the superpoly does not contain any variablewith index in I, it is evaluated only with its n−karguments all equal to zero.
2.∑Xj
p(x) =∑Xj
[tI(x)pS(I)(x) + qI(x)
]=
=∑Xj
tI(x)pS(I)(x)+∑Xj
qI(x) = a0+aj
since the second sum is zero and in the first onethe only term summed is the one for which tI =1, but in this case the top vertex element v∗ hasa 1 also in the jth position, so, with the free termof the superpoly pS(I) also the coefficient of theterm xj is summed.
�
In Algorithm 4.1, we report the strategy presentedin (Dinur & Shamir 2009), which can be applied whenthe polynomial representation of the cryptosystemcan not be assumed to be a d-random polynomial.
For what concern the testing of the linearity ofthe superpoly, Dinur and Shamir suggest to use aprobabilistic linearity test, as for instance the BLRtest, which consists in choosing independently and
Algorithm 4.1 Random walk for the Cube Attack.Require: the number m of public variables
(†) choose a random value k such that 1 6 k 6 mchoose a subset I of indices such that |I| = k(‡) compute the superpoly with Theorem 4if pS(I) is a constant {I is too large} then
drop a variable from I and go to (‡)end ifif pS(I) is nonlinear {I is too small} then
add a public variable to I and go to (‡)end ifcorrect choice for I are between the two casesabove; if such an I does not exist go to (†)end when enough suitable maxterms have been col-lected
randomly vectors a,b ∈ Fn2 and verifying the con-dition
pS(I)(a) + pS(I)(b) + pS(I)(0, . . . , 0) = pS(I)(a + b) .
5 Cube attack in Fq
We consider a polynomial p ∈ Fq[x1, . . . , xn] of degreed = deg(p) (without distinguishing between publicand secret variables) and a monomial t = xr1i1. . . x
rkik
,where 0 6 ri < q for 1 ≤ i ≤ k. For any monomial t,we can factor p as before
p = t · pS(t) + qt
where qt ∈ Fq[x1, . . . , xn] is the sub-polynomial of pwhich is the sum of all the terms of p which are notdivisible by t. Note that, differently from the caseF2, the superpoly pS(t) can actually contain some ofthe variables of t, while both pS(t) and qt can evenhave terms containing all the variables xi1 , . . . , xik ;we denote this sub-polynomial of qt as q′t.
Example 2 Let us consider the monomial t = x21x
22
and the polynomial p ∈ F8[x1, . . . , x5]:
p = x31x
22x
53 + x2
1x32x4 + x2
1x32 + x2
1x22x3+
+ x21x
22x4 + x2
1x2 + x1x2x3 + x31x
43x
25 + x2
5 + x32 + 1 =
= x21x
22(x1x
53 + x2x4 + x2 + x3 + x4) + x2
1x2+
+ x1x2x3 + x31x
43x
25 + x2
5 + x32 + 1.
In this case
pS(t) = x1x53 + x2x4 + x2 + x3 + x4 ,
qt = x21x2 + x1x2x3 + x3
1x43x
25 + x2
5 + x32 + 1
and
q′t = x21x2 + x1x2x3 .
We have a similar result as in (Dinur & Shamir2009), by considering the k-dimensional Boolean cube
Ct ={
(x1, . . . , xn) : xi ∈ {0, 1} ⊂ Fqfor each variable appearing in t
}.
For each element v ∈ Ct we denote by p|v the poly-nomial in n − k variables p(v). Moreover, we definethe top vertex v∗ of the cube Ct as
v∗i :={xi if xi does not appear in t1 if xi appears in t.
CRPIT Volume 116 - Information Security 2011
12

Let us denote by WH(v) the number of ones in v,i.e., it would be like the Hamming weight if we werein F2, but here we have vectors with elements whichare 1, 0 or variables. Note that the weight of the topvertex is k by definition WH(v∗) = k.
Analogously to Theorem 3 we have the followingresult:
Theorem 5 Let us define
pt :=∑v∈Ct
(−1)w(v)p|v (4)
with w(v) := WH(v∗) +WH(v) = k +WH(v).Then
pt =(pS(t) + q′t
)|v∗ .
Proof: In a way similar to the proof of Theorem 3,we obtain∑
v∈Ct
(−1)w(v)p|v =∑v∈Ct
(−1)w(v)[t · pS(t) + qt
]|v
=∑v∈Ct
(−1)w(v)(t · pS(t)
)|v +
∑v∈Ct
(−1)w(v)qt|v.
For all v ∈ Ct except v∗, t|v = 0, so, the contribu-tion of the first sum in pt corresponds exactly to theevaluation of pS(t) on v∗,∑
v∈Ct
(−1)w(v)(t · pS(t)
)|v = pS(t)(v∗).
For what concerns the second sum, any term appear-ing in q′t contains all variables in t, so it is summedonly once (in the top-vertex v∗). All the other termsof qt lack at least one of the variables in t, so theycontribute an even number of times to the sum, halftimes with a positive sign and the other half with anegative one, thus globally they vanish and therefore∑
v∈Ct
(−1)w(v)qt|v = q′t(v∗).
�
Note 2 Note that w(v) has been defined with the“correcting value” k so that the element in the sumwhich corresponds to the top-vertex v∗ has always apositive sign. This correction is also present in thedefinitions of w in Theorem 6.
Example 3 Let us continue with Example 2; we al-ready have the superpoly
pS(t)(x1, . . . , x5) = x1x53 + x2x4 + x2 + x3 + x4,
andq′t(x1, . . . , x5) = x2
1x2 + x1x2x3.
Then we consider the evaluation of p on the cube
Ct = { (0, 0, x3, x4, x5),(0, 1, x3, x4, x5),(1, 0, x3, x4, x5),(1, 1, x3, x4, x5) }
in order to compute pt. Thus
pt = p(0, 0, x3, x4, x5)− p(0, 1, x3, x4, x5)+− p(1, 0, x3, x4, x5) + p(1, 1, x3, x4, x5)
Thus
pt = (x25 + 1)− (x2
5 + 1 + 1)− (x43x
25 + x2
5 + 1)+
+ (x53 + x4 + 1 + x3 + x4 + 1 + x3+
+ x43x
25 + x2
5 + 1 + 1) =
= (x53 + x4 + 1 + x3 + x4) + (1 + x3) =
= pS(t)(v∗) + q′t(v∗) .
Hereby, we consider the problem of determining allthe coefficients of the sub-polynomial pS(t) + q′t whenit is linear and p is given as a black box function.With respect to the case in F2, the main differenceis that whatever the monomial is, the polynomial weobtain evaluating p as in Theorem 4 is always thelinear part of pS(t0), where t0 is the monomial whichis product of all the variables in t taken with exponent1, t0 = xi1· · ·xik . This is due to the fact that, calledI = {i1, . . . , ik} the set of the indices of the variableappearing in t, evaluating p on the sets X =
{x ∈
Fnq : xi = 0 if i 6∈ I and xi ∈ {0, 1} if i ∈ I}
andXj =
{x ∈ Fnq : xi = 0 if i 6∈ I∪{j}, xi ∈ {0, 1} if i ∈ I
and xj = 1}
we can only obtain the coefficients of thelinear part of (pS(t) + q′t)|v∗ (which is a polynomial inn−k variables, all but xi1 , . . . , xik), i.e., this sum candistinguish if a variable is present in the monomial butcannot determine its degree.
We denote with x∗ (and respectively x∗j) the el-ement of X (respectively of Xj) such that x∗i = 1(respectively x∗ji = 1) for all i ∈ I. Then, we have:
Theorem 6 Let t = xr1i1· · ·xrkik
be a monomial, andlet I be the subset of indices which appear in t as de-noted above. If the polynomial (pS(t) +q′t)|v∗ is linear,(pS(t) + q′t)|v∗ = a0 + a1x1 + . . .+ anxn, then
1.a0 =
∑X
(−1)w(x)p(x)
where w(x) = WH(x∗) +WH(x);
2.aj = −a0 +
∑Xj
(−1)w(x)p(x)
where w(x) = WH(x∗j) +WH(x) and j 6∈ I.
Besides, denoting with t0 the monomial xi1. . . xik ,then
pS(t0)|v∗ = (pS(t) + q′t)|v∗ .Proof:
1. ∑X
(−1)w(x)p(x) =
=∑X
(−1)w(x)[t(x)pS(t)(x) + qt(x)
]=
=∑X
(−1)w(x)t(x)pS(t)(x)+∑X
(−1)w(x)qt(x)
in the first sum the only (possibly) nonzero termis the one corresponding to x∗ ∈ X, which issummed with a positive sign thus we have∑
X
(−1)w(x)t(x)pS(t)(x) = pS(t)(x∗)
Proceedings of the Ninth Australasian Information Security Conference (AISC 2011), Perth, Australia
13
in the second sum all the terms containing othervariables than xi1 , . . . , xik are obviously zero,and all the other terms are summed an even num-ber of times (and vanish since they take oppositesigns in pairs), except the ones which containsall (and only) variables xi1 ,. . . , xik , which aresummed only once (in x∗) with a positive sign:∑
X
(−1)w(x)qt(x) = q′t(x∗).
Therefore we obtain the claimed result:∑X
(−1)w(x)p(x) = pS(t)(x∗) + q′t(x∗).
2. ∑Xj
(−1)w(x)p(x) =
=∑Xj
(−1)w(x)[t(x)pS(t)(x) + qt(x)
]=
=∑Xj
(−1)w(x)t(x)pS(t)(x)+∑Xj
(−1)w(x)qt(x) =
= pS(t)(x∗j) + q′t(x∗j)
similarly to the previous case, only coefficients ofthe terms which contain all the variables in t andpossibly xj are summed.
Besides, to show the last equality, it is sufficient tonotice that
• t · pS(t) + q′t = t0 · pS(t0)
• the sums above return only the free terms andthe coefficients of the linear terms xj , j 6∈ I, oncethat all the variables xi1 , . . . , xik are set to 1.
�
Example 4 Let us consider the polynomial p ∈F3[x1, x2, x3, x4], then we have
p = x21x
22x3 + 2x2
1x22x4 + x3
1x22+
+ x1x22 + 2x1x4 + x2
2x3 + x1 + 1
and the maxterm t = x21x
22, so that
pS(t) = x3 + 2x4 + x1 and q′t = x1x22 .
With the sums above we obtain a0 = 2, a3 = 1 anda4 = 2, which are the free term and the coefficients ofthe polynomials
(pS(t) +q′t)|v∗ = pS(t0)|v∗ = x3 +2x4 +2 ∈ F3[x3, x4] .
We conclude by stating the following lemma,which can be used to estimate the probability of suc-cess of the attack.
Lemma 2 Given a random matrix A ∈ Mn(Fq),then the probability that A is invertible isn∏i=1
(1− 1
qi
).
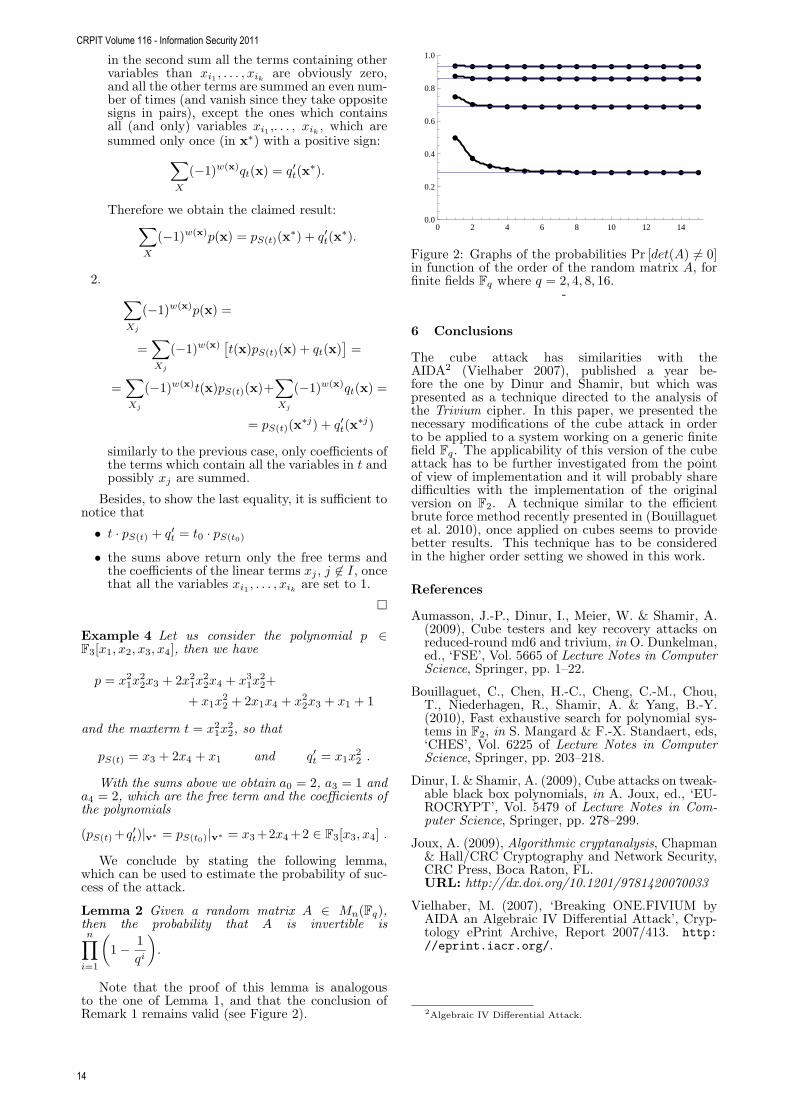
Note that the proof of this lemma is analogousto the one of Lemma 1, and that the conclusion ofRemark 1 remains valid (see Figure 2).
æ
æ
ææ æ æ æ æ æ æ æ æ æ æ æ
æ
æ æ æ æ æ æ æ æ æ æ æ æ æ æ
æ æ æ æ æ æ æ æ æ æ æ æ æ æ æ
æ æ æ æ æ æ æ æ æ æ æ æ æ æ æ
0 2 4 6 8 10 12 140.0
0.2
0.4
0.6
0.8
1.0
Figure 2: Graphs of the probabilities Pr [det(A) 6= 0]in function of the order of the random matrix A, forfinite fields Fq where q = 2, 4, 8, 16.
-
6 Conclusions
The cube attack has similarities with theAIDA2 (Vielhaber 2007), published a year be-fore the one by Dinur and Shamir, but which waspresented as a technique directed to the analysis ofthe Trivium cipher. In this paper, we presented thenecessary modifications of the cube attack in orderto be applied to a system working on a generic finitefield Fq. The applicability of this version of the cubeattack has to be further investigated from the pointof view of implementation and it will probably sharedifficulties with the implementation of the originalversion on F2. A technique similar to the efficientbrute force method recently presented in (Bouillaguetet al. 2010), once applied on cubes seems to providebetter results. This technique has to be consideredin the higher order setting we showed in this work.
References
Aumasson, J.-P., Dinur, I., Meier, W. & Shamir, A.(2009), Cube testers and key recovery attacks onreduced-round md6 and trivium, in O. Dunkelman,ed., ‘FSE’, Vol. 5665 of Lecture Notes in ComputerScience, Springer, pp. 1–22.
Bouillaguet, C., Chen, H.-C., Cheng, C.-M., Chou,T., Niederhagen, R., Shamir, A. & Yang, B.-Y.(2010), Fast exhaustive search for polynomial sys-tems in F2, in S. Mangard & F.-X. Standaert, eds,‘CHES’, Vol. 6225 of Lecture Notes in ComputerScience, Springer, pp. 203–218.
Dinur, I. & Shamir, A. (2009), Cube attacks on tweak-able black box polynomials, in A. Joux, ed., ‘EU-ROCRYPT’, Vol. 5479 of Lecture Notes in Com-puter Science, Springer, pp. 278–299.
Joux, A. (2009), Algorithmic cryptanalysis, Chapman& Hall/CRC Cryptography and Network Security,CRC Press, Boca Raton, FL.URL: http://dx.doi.org/10.1201/9781420070033
Vielhaber, M. (2007), ‘Breaking ONE.FIVIUM byAIDA an Algebraic IV Differential Attack’, Cryp-tology ePrint Archive, Report 2007/413. http://eprint.iacr.org/.
2Algebraic IV Differential Attack.
CRPIT Volume 116 - Information Security 2011
14

Secure Two-Party Association Rule Mining
Md. Golam Kaosar Russell Paulet Xun Yi
School of Engineering and ScienceVictoria University, Australia
Email: [email protected], [email protected], [email protected]
Abstract
Association rule mining algorithm provides a meansfor determining rules and patterns from a large col-lection of data. However, when two sites want toengage in an association rule mining, data privacyconcerns are raised. These concerns include loosinga competitive edge in the market place and breach-ing privacy laws. Techniques that have addressed thisproblem are data perturbation and homomorphic en-cryption. Homomorphic encryption based solutionsproduce more accurate results than data perturba-tion. Most previous solutions for privacy preservingassociation rule mining require the disclosure of in-termediate mining results such as support counts anddatabase size to determine frequent itemset. To over-come this weakness we propose a secure comparisontechnique based on state-of-the-art fully homomor-phic encryption scheme, by which we build securetwo-party association rule mining protocol. Our so-lution preserves complete privacy of both parties andit is more efficient than other solutions because thereis no need for exponentiation of numbers.
1 Introduction
Data mining algorithms discover patterns and inter-esting trends from large amount of data, which arecritical to business success. Usually, the database isdistributed across different sites and owned by differ-ent organisations. For example, two hospitals, eachhaving patient records, want to discover common dis-ease patterns from their joined data. In this case theprivacy issue is raised, because privacy law does notpermit the patient data to be disclosed. It is a chal-lenge for them to perform data mining algorithms ontheir union data without disclosing the patient data.
The first privacy preserving data mining algorithmwas introduced by Lindell and Pinkas in 2000 (Lindell& Pinkas 2000). The authors presented a protocolthat produced a decision tree using the ID3, pro-posed by Quinlan (Quinlan 1990), whereby the en-tropy or information gain is computed privately. Thisis achieved through the use of garbled circuit of Yao(Yao 1986) and 1-out-of-2 oblivious transfer (Even,Goldreich & Lempel 1985). The main overhead inthe protocol is the oblivious transfer, since this canbe expensive to compute depending on the public keycryptosystem used. Our work presents a similar data
Copyright c©2011, Australian Computer Society, Inc. Thispaper appeared at the 9th Australasian Information SecurityConference (AISC 2011), Perth, Australia, January 2011. Con-ferences in Research and Practice in Information Technology(CRPIT), Vol. 116, Colin Boyd and Josef Pieprzyk, Ed. Re-production for academic, not-for-profit purposes permitted pro-vided this text is included.
mining solution, but is an association rule mining so-lution instead of a data classifier as in the case ofLindel and Pinkas.
Association rule mining is a data mining algorithmthat provides a way to determine rules from data.The algorithms are based on calculating the support,and confidence. This is trivial when the data is inone site. Efficient algorithms (Agrawal & Srikant Sep1994) can be used to generate association rules atuser specified thresholds. However, when the data isdistributed across many sites, privacy concerns areintroduced. Hence we need tools to mitigate theseprivacy concerns.
Generally speaking, the meaning of privacy in datamining algorithms is to prevent data misuse (Clifton,Kantarcioglu & Vaidya 2002). Since there is difficultto assume a fully trusted third party, it is impossibleto simply transfer all data to one site and performthe necessary mining process. Since, in most cases,it not possible to trust people with the data becausecontrol of data distribution is very difficult once re-leased. Therefore, tools need to be developed in orderto achieve mutual beneficial result without disclosingdata.
General tools for the job include either usingdata perturbation (Kantarcioglu & Clifton 2004), orsome kind of homomorphic encryption (Paillier 1999,El Gamal 1985) scheme in order to calculate the to-tal counts from different sites. Adding randomnessto the data actually reduces the accuracy of the re-sult, whereas homomorphic encryption allows to op-erate on ciphertext and those operations representedin the plaintext. Therefore, it is possible to increasethe accuracy of the result by using the actual valuesconcealed by the encryption.
Adding randomness has been shown to reduce pri-vacy concerns (Clifton, Kantarcioglu, Vaidya, Lin &Zhu 2003, Kantarcioglu & Clifton 2004). This ran-domness confuses the actual data values. Hence mak-ing the process of determining the actual values dif-ficult because the random distribution would need tobe known. Adding randomness to the data actuallyreduces the accuracy of the outcome of the algorithm.This is true even if both parties use the same distri-bution, and remove it at the end.
Homomorphic properties of encryption schemesenable to perform calculations in the ciphertext,and have those operations represented in the plain-text (Rivest, Shamir & Adleman 1978, El Gamal1985, Paillier 1999). A mixture of data pertuba-tion and homomorphic encryption has also been con-sidered (Ouyang & Huang 2006, Zhan, Matwin &Chang 2007). This is to both confuse the result froman adversary, and allow the adversary to still oper-ate on the data. Up until recently, all known homo-morphic encryption schemes were only partially ho-
Proceedings of the Ninth Australasian Information Security Conference (AISC 2011), Perth, Australia
15

momorphic. Partially homomorphic means that theyare only homomorphic under one operation. Dijk2010et al. (Dijk, Gentry, Halevi & Vaikuntanathan 2010)presented a scheme that was fully homomorphic onbinary data. This enables the operations of data,represented as binary circuits, to be executed in itsciphertext form.
Using this result, this paper aims to provide a solu-tion that evaluates counts without any intermediateresult. This removes the issue of one party learn-ing the other party’s input as the actual result hasbeen masked. It is shown that this is secure based onthe security assumptions of the underlying securityscheme with secure parameters.
2 Background
This section encompasses the scope of the research byintroducing necessary background knowledge, termsand concepts. This section will provide better under-standing about the foundations of the research.
2.1 Association Rule Mining (ARM)
Association rule mining (ARM) is popular and ef-fective way to discover correlations (known as rules)among variables in a large database. Based on inter-estingness ARM is capable to discover some knowl-edge from a huge transactional database which is ap-parently intelligible. As for an example an ARM maydiscover a rule {sugar, flour}⇒yeast from a super-market transactional data which implies that if a cus-tomer buys sugar and flour then most probably he willbuy yeast. If this correlation is revealed to the super-market authority, they might put all these items insame aisle to increase sales.
Let us consider I as the set of items in a database,where each transaction T ⊆ I. Any combinationof items are known as itemset. That is, an itemsetIs = {I1
⋃I2...
⋃Ik} where, Ii ⊆ I. An itemset with
length k is known as k-itemset. Typical form of anassociation rule is X ⇒ Y , where X ⊆ I, Y ⊆ I andX ∩Y = Φ. The support of X ⇒ Y is the probabilityof a transaction in the database contains both X andY . On the other hand confidence of X ⇒ Y is theprobability of a transaction containing X will containY too. Usually it is the interest of the data vendorto find all association rules having support and confi-dence greater than or equal to a minimum thresholdvalue. Let us illustrate the definitions of support andconfidence for another instance of an association ruleAB ⇒ C,
SupportAB⇒C = s =∑sites
i=1 SupportCountABCi∑sitesi=1 DatabaseSizei
(1)
SupportAB =∑sites
i=1 SupportCountABi∑sitesi=1 DatabaseSizei
(2)
ConfidenceAB⇒C = c = SupportAB⇒C
SupportAB(3)
More detail on association rule mining process isavailable in (Han & Kamber 2006, Tan, Steinbach& Kumar 2006).
Association rule mining process consists of twomajor parts (Han & Kamber 2006). First part isto find frequently large itemsets which have supportand confidence values more than a threshold numberof times. Second part is to construct association rulesfrom those large itemsets.
1. Generate frequent itemset:To determine frequent itemsets within a
database, it is necessary to compare all possi-ble itemsets. In many research works some so-lutions are provided to reduce this number ofcandidate itemsets as well as number of compar-isons. Apriori algorithm is one of the leadingalgorithms, which determines all frequent largeitemsets along with their support counts froma database efficiently. This algorithm was pro-posed by Agrawal (Agrawal & Srikant Sep 1994)which is discussed here in brief: Let us say Li bethe frequent i-itemsets. Apriori algorithm findsLk from Lk−1 in two stages: joining and pruning.
• Joining: Generates a set of k-itemsetsCk, known as candidate itemsets by join-ing Lk−1 and other possible items in thedatabase.
• Pruning: Any (k − 1)-itemsets cannot be asubset of a frequent k -itemsets which is notfrequent. Therefore it should be removed.
Apriori algorithm reduces the number of candi-date itemsets and comparisons due to its two dis-tinguishing features: (1) it traverses the itemsetlattice one level at a time and (2) at each itera-tion new candidate itemsets are generated fromthe frequent itemsets of previous iteration sup-port of which must be greater than or equal tothe minimum support value. If kmax is the max-imum size of the largest frequent itemset thennumber of iterations in the Apriori algorithm iskmax + 1.
2. Generate association rules from frequent item-sets:Collection of frequently large itemsets with min-imum support value (defined in Equation 1) arethe inputs and association rule with minimumconfidence value (defined in Equation 3) are theoutputs in this process. Following simple stepswould generate all possible association rules withminimum support and confidence:
• For each frequently large itemsets f, gener-ate subset s such that f ′ 6= φ.
• For each f ′ generate the as-sociation rule f ′ ⇒ (f − f ′)such that Confidencef ′⇒(f−f ′) ≥minimum confidence
Support of f ′ is not needed to be considered incomputation, since Supportf ′ ≥ Supportf .
2.2 Fully Homomorphic Encryption System
Homomorphic encryption is a special form of encryp-tion where one can perform a specific algebraic oper-ation on the plain-text by applying the same or dif-ferent operation on the cipher-text. If X and Y aretwo numbers and E and D denotes encryption anddecryption function respectively, then homomorphicencryption holds following condition for an algebraicoperation such as ’+’:
D[E(X) + E(Y )] = D[E(X + Y )] (4)
Most homomorphic encryption system such as RSA(Rivest et al. 1978), ElGamal (El Gamal 1985), Be-naloh (Clarkson 1994), Paillier (Paillier 1999) etc arecapable to perform only one operation. But fully ho-momorphic encryption system can be used for manyoperations (such as, addition, multiplication, divisionetc.) at the same time.
CRPIT Volume 116 - Information Security 2011
16

2.2.1 Fully Homomorphic Encryption for Bi-nary Bits
The work in (Dijk et al. 2010) proposes a new cryp-tosystem that provides fully homomorphic encryptionover integer ciphertext. If a cryptosystem is fully ho-momorphic, then it has the ability to perform bothaddition and multiplication over the ciphertext andthese operations are represented in plaintext. Hence,a untrusted party is able to operate on private or con-fidential data, without the ability to know what datathe untrusted party is manipulating.
The fully homomorphic scheme (Dijk et al. 2010)is a simplification of an earlier work involving ideallattices (Gentry 2009). It encrypts a single bit (inthe plaintext space) to an integer (in the ciphertextspace). When these integers are added and multi-plied, the hidden bits are added and multiplied (mod-ulo 2). The symmetric version of the encryption func-tion is given by c = pq + 2r + m, where p is theprivate key, q and r are chosen randomly, and m isthe message m ∈ {0, 1}. The decryption is simply(c mod p)mod 2, which recovers the bit. Hence, whenwe add or multiply the ciphertext, the message is ma-nipulated accordingly.
Using the symmetric version of the cryptosystem,it is possible to construct an asymmetric version. Theasymmetric version is far more useful to the associ-ation rule application, since another party must beable to encrypt in order to use the homomorphic prop-erty of the cryptosystem. The following functions de-fine the asymmetric version of the cryptosystem (Dijket al. 2010).
KeyGen(λ): Choose a random n-bit odd integer p asthe private key.Using the private key, generate the public keyas xi = pqi + 2ri where qi and ri are chosenrandomly, for i = 0, 1, ..., τ . Relabel so that x0 isthe largest
Encrypt(pk,m ∈ {0, 1}): Choose a random subsetS ⊆ {1, 2, ..., τ} and a random integer r, andoutput c = (m+ 2r + 2
∑i∈S xi)(mod x0).
Decrypt(sk, c): Output m = (c mod p)mod 2
This asymetric version still achieves the same levelof correctness as the symmetric version. The additionand multiplication of ciphertexts result in additionand multiplication being acted on the message bit.This produces the correspondence between ciphertextspace and the plaintext space, as addition in the ci-phertext space reduces to exclusive OR (⊕) in theplaintext space and multiplication in the ciphertextspace reduces to AND (∧). This correspondence (ho-momorphism) between these two operations, additionand multiplication, are shown in Equations 5 and 6,respectively.
E(m1) + E(m2) = E(m1 ⊕m2) (5)
E(m1) · E(m2) = E(m1 ∧m2) (6)
Hence, from this correspondence, it is possible toconstruct very complicated binary circuits to evaluateon the data, without exposing the actual data. Moredetails regarding implementation can be found in theoriginal paper (Dijk et al. 2010).
2.2.2 Fully Homomorphic Encryption for In-tegers
The association rule mining algorithms does not op-erate on binary data, however. They operates on val-ues in the integer space. Hence we need to extendthe underlying cryptosystem to accommodate integernumbers. This is achieved by representing the integeras a binary vector and encrypting each bit. For in-stance, an 8-bit integer z can be encrypted as shownin Equation 7, using the encryption function from theasymmetric version of the fully homomorphic encryp-tion scheme.
Epk(z) =
[Epk(v7), Epk(v6), Epk(v5), Epk(v4),
Epk(v3), Epk(v2), Epk(v1), Epk(v0)]
where z ∈ Z
(7)
Using this format it is possible to encrypt twointegers and apply binary AND and XOR to eachrespective encrypted binary value, with the con-sequence of the homomorphic property of the en-cryption scheme. Let us consider two integers uand l, which can be represented as binary num-bers u = [un−1, un−2, . . . , ui, . . . , u0] and l =[ln−1, ln−2, . . . , li, . . . , l0] respectively. This is illus-trated in Figure 1, where ci refers to the carry bit.
Figure 1: Displays the carry bit operation
Computer architecture implements the carry bitto perform regular addition (Brookshear 2005) andtherefore the homomorphic encryption must accom-modate this requirement. This is trivial since thecarry bit can be calculated with the following expres-sion in Equation 8 using the homomorphic propertyof the cryptosystem, starting with the least significantbit.
ci = (li ∧ ui) ∨ ((li ⊕ ui) ∧ ci−1) (8)
where li and ui refer to the lower and upper binaryvector respectively, ∧ and ∨ represent AND and ORrespectively, and ci representing the carry bit. Thecarry bit is initially zero c0 = 0. In this expression thebinary OR ∨ is represented by (p⊕q)⊕(p ·q) where ⊕and · refer to XOR and AND operations respectively.This substitute is needed because binary OR is notdirectly available as part of the homomorphism of thecryptosystem. The output bit for that position in thebinary vector is calculated using Equation 9.
oi = li ⊕ ui ⊕ ci−1 (9)
Using Equation 9, it is possible to add any twon-bit integers represented as binary vectors. This has
Proceedings of the Ninth Australasian Information Security Conference (AISC 2011), Perth, Australia
17

demonstrated how to perform addition on integers.For completeness, multiplication must be also imple-mented. Multiplication can be simply performed interms of multiple addition, which avoids the need forcomplicated binary circuits, including bit shifting.
This simple scheme can be extended to providemore functionality, such that we are able to discoverassociation rules in a privacy preserving setting.
2.2.3 Homomorphic Function Abstraction
Using this abstraction for integers, it is now possibleto define functions in terms of n-bit integers. Theencryption and decryption functions for (abstracted)integers are as follows.
Epk(i): Encrypts a n-bit integer i using the publickey pk, returning a encrypted n-bit integer c asciphertext.
Dsk(c): Decrypts a n-bit integer c using the privatekey sk, returning a plaintext n-bit integer i
The purpose of these functions is to convert aninteger between the plaintext and ciphertext. Dueto the abstraction of binary bits into integers, it willassist the creation of a higher level protocol. Thefunctions for such a protocol are defined next.
• Homomorphic Binary AND Operation:HomAND(x, y): Receives two encrypted n-bitintegers x and y, and returns a third encryptedn-bit integer z. The output is calculated bit-by-bit using the homomorphic property, that iszj = xiANDyi, where AND is evaluated usingEquation 6, for i = j.
• Homomorphic Binary XOR:HomXOR(x, y): Receives two encrypted n-bitintegers x and y, and returns a third encryptedn-bit integer z. The output is calculated bit-by-bit using the exclusive OR property of thehomomorphic encryption, that is zj = xiXORyi,where XOR is evaluated using Equation 5, fori = j.
• Homomorphic Addition:HomAdd(x, y): Receives two encrypted n-bit in-tegers x and y and returns a third n-bit integerz. Where zi is calculated using Equations 9 and8 for the current column and carry bit calcula-tion respectively. Figure 1 illustrates this doublecalculation of carry bit and column bit for eachbit of the integer.
3 Proposed Solution
This section describes motivations for our proposedsolution along with the model definition, necessaryfunction development and finally, the proposed algo-rithm.
3.1 Motivation and Model Definition
Let us consider two data sites Alice(A) andBob(B) possess two horizontally partitioned trans-actional database DB1 and DB2 of size |DB1|and |DB2| respectively, where, combined databaseDB = {DB1
⋃DB2}. Let us, also assume I =
{i1, i2, ...., in} is the set of items where each transac-tion T ⊆ I. Therefore, any itemsets to be frequentlylarge, it’s support must be greater than or equal to
the minimum support threshold denoted by s. Sim-ilarly for an association rule to be selected, it’s con-fidence must be greater than or equal to a minimumconfidence threshold denoted by c.
To highlight the significance of our proposed so-lution; let us consider some simple ARM algorithmsteps necessary to determine, whether an itemset withcounts c1 and c2 in A and B respectively are frequentor not:
• Step 1: Data site A sends count c1 and |DB1| toother party B.
• Step 2: Data site B sends count c2 and |DB2| toother party A.
• Step 3: Both A and B can compute whetherc1+c2
|DB1|+|DB2| ≥ s. If true then the itemset is fre-quent.
Most privacy preserving solutions either for two par-ties or for multiple parties have following weaknesses:
• Privacy of individual itemset counts c1 and c2are preserved, but their summation (c1 + c2) isdisclosed. This should not be considered as fullyprivacy preservation. Sometimes this would helpthe adversary guess some counts. In fact for twoparty: the privacy is not preserved at all.
• Privacy of individual database sizes |DB1| and|DB2| are preserved, but their summation(|DB1| + |DB2|) is disclosed. This again is con-sidered as violation of privacy.
• During the generation of association rules fromfrequently large itemsets, the total count of item-sets are disclosed too.
• Mining result provides association rules alongwith their support and confidence values (e.g.AB ⇒ C, s = .32 and c = .25). This disclosesthe privacy too.
This paper proposes a solution which would preservethe privacy in all these cases. No such intermediateresults would be disclosed to any party as opposed tomost privacy preserving ARM solutions.
Let us, consider Alice(A) has public and secretkeys pk and sk respectively generated according tothe key generation process mentioned in Section 2.2.Bob(B) performs cryptographic operations using pk,but he cannot decrypt the result since he does notknow sk. Data encryption and decryption is per-formed according to the fully homomorphic encryp-tion system discussed in Section 2.2. These par-ties communicate through a private channel whichis protected by a standard secret key cryptosystem,such as DES (FIPS-PUB.46 1977) or AES (FIPS-PUB.197 2001). It is also assumed, A and B aresemi-honest which implies - they follow the protocolbut they are allowed to record intermediate compu-tation for future use to break privacy of other entity.
3.2 Secure Comparison of Two Integers
This section proposes a solution to compare two num-bers privately. Let us, consider two n bit long integernumbers M and N . This proposed technique com-pares M and N and determines whether M is equalor less than or greater than N without revealing thevalue of M or N themselves.
Let us, consider the first version of the algorithm(Algorithm 1) which performs the comparison with-out preserving the privacy (This basic technique can
CRPIT Volume 116 - Information Security 2011
18

be found in many computer architecture books suchas (Harris & David 2007)):
Algorithm 1 Comparison of two integers (M andN) without privacy concern
input : integers M,Noutput : (One bit output. If output = 0 then M ≥N otherwise M < N .)Begin
Y ← M + N + 1 /* Subtraction of M and Ngives the clue about their relative size. Two’s com-plement of a number is equivalent to the negativeof the same number. Therefore, Y = M −N .*/
R← Y AND 2n−1
return MSB(R) /* returns the most significantbit (MSB) of R. This is actually is the sign bit ofthe subtracted result*/End
With the consideration of fully homomorphic func-tions - HomXOR, HomAdd and HomAND derivedin Section 2.2; this proposed solution would do thesame comparison as in Algorithm 1 with preservingprivacy. Let us say Alice and Bob have their secretnumbers encrypted α ← Epk(M) and β ← Epk(N)respectively. Secure comparison between α and β isproposed in Algorithm 2.
Algorithm 2 Secure comparison of two encryptedintegers (M and N)
input : ciphertexts α, βoutput : ciphertextR′ (One bit encrypted output.If R = Dsk(R′) = 0 then M ≥ N otherwise M <N .)Begin
β ← HomXOR(β,Epk(2n − 1)) /* Binarynegation of α*/Y ′ ← HomAdd(α, β) /* Homomorphic addition
of α and β*/Y ′ ← HomAdd(Y ′, Epk(1))R′ ← HomAND(Y ′, Epk(2n−1)) /* The result
is encrypted and only Alice can decrypt that*/return MSB(R′) /* returns the sign bit or theMost Significant Bit (MSB) of R′.*/End
In summary; a function can be defined -HomComparison(α, β) which would compare two en-crypted integers and returns an encrypted one bit re-sult R′ which can be decrypted only by the owner ofthe secret key (in this case - Alice). If R = Dsk(R′) =0 then M ≥ N else M < N .
3.3 Secure Comparison of Fraction Numbers
In the comparison of support and confidence of anitemset and an association rule respectively, it is nec-essary to compare two fractional numbers. The gen-eral form of both cases is to determine whether α
β ≥ γis true, where α and β are two integers and γ is a frac-tional number. This section presents a way to performthe comparison without performing homomorphic di-vision operation. α
β ≥ γ can be simplified as follows:αβ ≥ γ ≡ α ≥ γ × β ≡ α × 10n ≥ γ × β × 10n ≡α× 10n ≥ ε× βWhere, n =number of digits in γ after decimal pointsand ε = γ × 10n
We propose Algorithm 3 to perform above mentioned
comparison securely where α and β are encrypted.Let us say α′ = Epk(α) and β′ = Epk(β)
Algorithm 3 Secure comparison of two fractionalnumbersinput : ciphertext α′, β′, threshold γoutput : R′ (One bit encrypted output. If R =Dsk(R′) = 0 then α
β ≥ γ, otherwise αβ < γ)
Beginη ← number of digits in γ after decimalε← γ × 10η
TempAlpha← 0for i = 1 to 10η do
TempAlpha ← HomAdd(TempAlpha, α′) /*iterative addition to avoid multiplication*/
end forTempBeta← 0
for i = 1 to ε doTempBeta ← HomAdd(TempBeta, β′) /*
iterative addition to avoid multiplication*/end forR′ ← HomComparison(TempAlpha, TempBeta)
return MSB(R′) /* returns the sign bit or themost significant bit (MSB) of R′.*/End
In summary; a function can be defined -HomFractionComparison(α, β, γ) which determineswhether α
β > γ is true or not. If R = Dsk(R′) = 0
then αβ ≥ γ, else α
β < γ
3.4 Proposed Two Party ARM
Let us, say among the two parties (Alice(A) andBob(B), A has public and secret keys pk and skrespectively.Epk and Esk denotes fully homomorphicencryption and decryption respectively discussed inSection 2.2. Let us consider following operations areperformed initially:
A :D1 ← Epk(|DB1|)SendToB(D1)
B :D2 ← Epk(|DB2|)π′ ← HomAdd(D1, D2)
Let us consider for kth iteration in the Apriori algo-rithm where, Lk and Ck represents large k-itemsetand candidate k-itemset respectively. Following algo-rithm illustrates necessary steps in both sides (A andB) to generate frequently large itemsets:
Proceedings of the Ninth Australasian Information Security Conference (AISC 2011), Perth, Australia
19

Algorithm 4 Large itemset generation between Aand Binput of A : Lk with countsinput of B : Lk with counts, π′, soutput : Lk+1BeginBoth Alice(A) and Bob(B)
Ck+1 ← GenerateCandidate(Lk)for Allρ ∈ Ck+1 do
Alice(A)ω1 ← count(ρ)ω1′ ← Epk(ω1)SendToB(ρ, ω1′) /* transmits itemset and
its encrypted count to B*/Bob(B)FrequencyDBofA ←{FrequencyDBofA
⋃(ρ, ω1′)} /* B stores
all encrypted counts of itemsets sent by A.These information would be necessary in itemsetgeneration in Algorithm 5.*/
ω2 ← count(ρ)ω2′ ← Epk(ω2)ω′ ← HomAdd(ω1′, ω2′)R′ ← HomFractionComparison(ω′, π′, s)SendToA(R′)
Alice(A)R← Dsk(R′) /* result is only decrypted by
A*/if R = 0 then
Lk+1 ← {Lk+1
⋃ρ} /* itemset satisfies
minimum support requirement*/SendToB(ρ)
end ifBob(B)
Lk+1 ← {Lk+1
⋃ρ}
end forEnd
Repeated use of above mentioned Algorithm 4generates all frequently large global itemsets Lg ={L1, L2, ..., Lm}, where m = maximum number ofitems present in any large itemsets.
Figure 2 illustrates the flow diagram of Algorithm4 with the assumption that counts of an itemset in Ais c1 and in B is c2.
Figure 2: Algorithmic steps for itemset generation
Now, all association rules with minimum confi-dence c are to be generated from Lg preserving pri-vacy. If Equations 1, 2 and 3 are combined together,
following simplification may be achieved:
ConfidenceAB⇒C = c = SupportAB⇒C
SupportAB
=
∑sitesi=1 SupportCountABCi∑sites
i=1 DatabaseSizei∑sitesi=1 SupportCountABi∑sites
i=1 DatabaseSizei
=∑sites
i=1 SupportCountABCi∑sitesi=1 SupportCountABi
(10)
Following algorithm generates association rules fromall frequently large itemsets in Lg.
Algorithm 5 Association rule generation
input of B : Lg, c, FrequencyDBofAoutput : AR (Set of all association rules)BeginBoth Alice(A) and Bob(B)for All(Li ∈ Lg) do
Bob(B)Split Li into all possible ı1 and ı2 such
that,Li = {ı1⋃ı2} and {ı1
⋂ı2} = φ /* to gener-
ates all possible combinations of association rulesfrom Li*/
α1 ← Epk(count(Li)) /* Local count in B*/α2 ←
encryptedcount(Li) from FrequencyDBofA/* Encrypted counts of A stored in B duringitemset generation stage*/
α← HomAdd(α1, α2)β1 ← Epk(count(ı1)) /* Local count in B*/
β2 ←encryptedcount(ı1) from FrequencyDBofA
β ← HomAdd(β1, β2)R′ ← HomFractionComparison(α, β, c)
/* Tests whether satisfy minimum confidence re-quirement*/
SendToA(R′)Alice(A)
R = Dsk(R′)if R = 0 then
AR← {AR⋃ı1 ⇒ ı2} /* The association
rule satisfies conditions and added to the finaloutput*/
SendToB(ı1 ⇒ ı2)end ifBob(B)
AR← {AR⋃ı1 ⇒ ı2}
end forEnd
4 Analysis
Since the protocol is created under a semi-honestmodel, it is assumed that both parties cannot deviatefrom protocol. This means the only way to circum-vent the security of the protocol is if one party has theability to decrypt the ciphertext. It is also assumedthat the parameters of the cryptographic scheme arechosen from secure ranges(Dijk et al. 2010). The anal-ysis will consider the security from both Alice’s andBob’s point of view.
The security of Alice’s data is satisfied if Bob candetermine her value. Since her value is encrypted asciphertext using the fully homomorphic encryptionscheme, Bob is unable to determine her value unlesshe can decrypt the ciphertext. This would mean thatBob would have to break the approximate-gcd prob-lem (Dijk et al. 2010). That is, given ciphertext de-termine the private key. Since the encryption scheme
CRPIT Volume 116 - Information Security 2011
20

is a probabilistic cipher, it provides semantic security.Fundamentally, this means there are many ciphertextto the same plaintext, this makes the encryption ofthe actual number indistinguishable from the encryp-tion of a random number.
Conversely, the security of Bob’s data is satisfied ifAlice cannot determine his value. Since Bob is calcu-lating the sign bit of the difference homomorphicallyand transmitting that bit, Alice does not have accessto any number besides the encrypted sign bit, whichshe can decrypt. Therefore, Bob’s security is satisfied.
Taken together, both Alice and Bob cannot de-termine each other’s value, while still being able toperform meaningful calculations to produce accurateARM rules.
5 Conclusion
This paper has presented a 2-party association rulemining algorithm using fully homomorphic encryp-tion (Dijk et al. 2010). The protocol was shownto be secure under the semi-honest model of muti-party computation. This security is based on theapproximate-gcd problem associated with the fullyhomomorphic encryption system. The main contri-bution was to calculate the support and confidenceof association rules homomorphically, and returninga single bit.
This greatly improves the security over previoushomomorphic public key cryptosystems. Classicalcryptosystems like the RSA and El Gamal are onlypartially homomorphic, and after a calculation hasbeen performed homomorphically, one party has todecrypt the ciphertext to obtain a meaningful result.In the proposed solution, however, the actual datavalue is reduced to a single bit.
Future work regarding privacy preserving datamining would include; improving the efficiency ofby removing unnecessary communication; expandingon the number of parties to a multi-party computa-tion interaction; and applying the fully homomorphicencryption system to other data mining algorithms.Further work is also required to improve both the ef-ficiency and security of the underlying cryptosystem.
References
Agrawal, R. & Srikant, R. (Sep 1994), ‘Fast algo-rithms for mining association rules’, Proceed-ings of the 20th International Conference onVery Large Data Bases. Santiago, Chile: VLDBpp. 487–499.
Brookshear, J. G. (2005), Computer Science: AnOverview, Addison Wesley.
Clarkson, J. B. (1994), Dense probabilistic encryp-tion, in ‘In Proceedings of the Workshop on Se-lected Areas of Cryptography’, pp. 120–128.
Clifton, C., Kantarcioglu, M. & Vaidya, J. (2002),Defining privacy for data mining, in ‘in NationalScience Foundation Workshop on Next Genera-tion Data Mining’, pp. 126–133.
Clifton, C., Kantarcioglu, M., Vaidya, J., Lin, X. &Zhu, M. Y. (2003), ‘Tools for privacy preservingdistributed data mining’, ACM SIGKDD Explo-rations 4, 2003. Read.
Dijk, M. V., Gentry, C., Halevi, S. & Vaikuntanathan,V. (2010), ‘Fully homomorphic encryption overthe integers’, Eurocrypt 2010 .
El Gamal, T. (1985), A public key cryptosystem anda signature scheme based on discrete logarithms,in ‘Proceedings of CRYPTO 84 on Advancesin cryptology’, Springer-Verlag New York, Inc.,New York, NY, USA, pp. 10–18.
Even, S., Goldreich, O. & Lempel, A. (1985), ‘A ran-domized protocol for signing contracts’, Com-mun. ACM 28, 637–647.
FIPS-PUB.197 (2001), ‘Advanced encryption stan-dard’, Federal Information Processing Stan-dards Publications, US Department of Com-merce/N.I.S.T., National Technical InformationService .
FIPS-PUB.46 (1977), ‘Data encryption standard’,National Bureau of Standards, US Departmentof Commerce .
Gentry, C. (2009), Fully homomorphic encryption us-ing ideal lattices, in ‘STOC ’09: Proceedingsof the 41st annual ACM symposium on The-ory of computing’, ACM, New York, NY, USA,pp. 169–178.
Han, J. & Kamber, M. (2006), Data Mining Conceptsand Techniques, Second Edition, Elsevier Inc.
Harris & David (2007), Digital Design and ComputerArchitecture : From Gates to Processors, Else-vier, Burlington 2007.
Kantarcioglu, M. & Clifton, C. (2004), ‘Privacy-preserving distributed mining of associationrules on horizontally partitioned data’, IEEETrans. on Knowl. and Data Eng. 16(9), 1026–1037.
Lindell, Y. & Pinkas, B. (2000), ‘Privacy preservingdata mining’, Advances in Cryptology (Crypto2000) Proceedings, LNCS 1880, Springer-Verlag15(3), 20–24.
Ouyang, W. & Huang, Q. (2006), Privacy preservingassociation rules mining based on secure two-party computation, in D.-S. Huang, K. Li &G. Irwin, eds, ‘Intelligent Control and Automa-tion’, Vol. 344 of Lecture Notes in Control andInformation Sciences, Springer Berlin / Heidel-berg, pp. 969–975.
Paillier, P. (1999), Public-key cryptosystems based oncomposite degree residuosity classes, in ‘IN AD-VANCES IN CRYPTOLOGY EUROCRYPT1999’, Springer-Verlag, pp. 223–238.
Quinlan, J. R. (1990), Induction of decision trees, inJ. W. Shavlik & T. G. Dietterich, eds, ‘Readingsin Machine Learning’, Morgan Kaufmann.
Rivest, R. L., Shamir, A. & Adleman, L. (1978),‘A method for obtaining digital signaturesand public-key cryptosystems’, Commun. ACM21(2), 120–126.
Tan, P. N., Steinbach, M. & Kumar, V. (2006), In-troduction to Data Mining, Pearson Education,Inc.
Yao, A. C.-C. (1986), How to generate and exchangesecrets, in ‘Proceedings of the 27th Annual Sym-posium on Foundations of Computer Science’,IEEE Computer Society, Washington, DC, USA,pp. 162–167.
Proceedings of the Ninth Australasian Information Security Conference (AISC 2011), Perth, Australia
21

Zhan, J., Matwin, S. & Chang, L. (2007), ‘Privacy-preserving collaborative association rule mining’,Journal of Network and Computer Applications30(3), 1216 – 1227.
CRPIT Volume 116 - Information Security 2011
22
Detection of Anomalies from User Profiles Generated from System
Logs
Malcolm Corney George Mohay Andrew ClarkInformation Security Institute
Queensland University of Technology
PO Box 2434, Brisbane QLD 4001, Australia
[email protected], [email protected], [email protected]
Abstract
We describe research into the identification of anomalous
events and event patterns as manifested in computer
system logs. Prototype software has been developed with
a capability that identifies anomalous events based on
usage patterns or user profiles, and alerts administrators
when such events are identified. To reduce the number of
false positive alerts we have investigated the use of
different user profile training techniques and introduce
the use of abstractions to group together applications
which are related. Our results suggest that the number of
false alerts that are generated is significantly reduced
when a growing time window is used for user profile
training and when abstraction into groups of applications
is used.
Keywords: User profiling, insider misuse, abstraction.
1 Introduction1
Computer crime continues to be problematic for both
public and private sectors not only in Australia but at an
international level. Over 50% of respondents to the 2006
Computer Security Institute/FBI Computer Crime and
Security Survey (Gordon, Loeb et al. 2006) reported
unauthorized use of computer systems. In an equivalent
Australian survey, the 2006 Australian Computer Crime
and Security Survey (AusCERT 2006), 22% of
respondents reported experiencing one or more electronic
attacks.
The field of computer forensics has been rapidly
expanding in the past twenty years in an effort to combat
the continuing increase in the incidence of criminal
activity involving computers. This field is normally
defined around the identification, securing and analysis of
evidence for eventual presentation in a court of law. Few
cases result in a criminal prosecution and a broader
definition of computer forensics can be made that simply
attempts to detect, secure and analyse evidence from
computer systems. This may be done by an organization,
for instance, in response to a security incident, internal or
external.
Copyright © 2011, Australian Computer Society, Inc. This
paper appeared at the 9th Australasian Information Security
Conference (AISC 2011), Perth, Australia. Conferences in
Research and Practice in Information Technology (CRPIT),
Vol. 116. C. Boyd and J. Pieprzyk, Eds. Reproduction for
academic, not-for profit purposes permitted provided this text is
included.
The surveys highlight that the most common types of
criminal activity are the results of virus, worm or Trojan
infections. Insider abuse of Internet access, email or
computer system resources, however, is the third most
common type of misuse in the United States of America
(Gordon, Loeb et al. 2006) and the second most common
type of misuse in Australia (AusCERT 2006).
Insider misuse can be defined as the performance of
activities where computers and networks in an
organization are deliberately misused by those who are
authorized to use them. Some activities which can be
categorized as insider misuse include:
unauthorized access to information which is an
abuse of privileges
unauthorized use of software or applications for
purposes other than carrying out one’s duties
theft or breach of proprietary or confidential
information
theft or unauthorized use of staff or customer’s
access credentials
computer facilitated financial fraud
This paper reports on work aimed at detecting
anomalous events that may be indicators of insider
misuse. More specifically we attempt to detect
unauthorized use of software applications by users from
within an organization. Our general approach has been to
build user profiles from computer security audit logs
which record the applications used. In particular, we
have used the security audit log from computers running
the Windows XP operating system for this work.
While we have based this research on a specific
operating system, the approach may be generalised to any
operating system or computer system, such as an ERP
system, which records user’s activities as events.
We have created user profiles from data recorded in
the Windows Security log by identifying the processes or
applications run by a computer user. The events recorded
in the Windows security audit log can be correlated to
determine when a process was started and terminated by
the user or the system. Data from the correlated events
can be stored and queried for post hoc investigation of a
user’s activities on the computer. User profiles include
information on which times of the day or week the
various applications were used by an individual and also
record the first time an application was used by the user.
Users in an organization may have specific duties
which they carry out on a routine basis at various times of
the working day or week. A sudden departure from
routine may be an indicator that the user is not carrying
Proceedings of the Ninth Australasian Information Security Conference (AISC 2011), Perth, Australia
23

out their routine duties. Use of applications outside of
regular working hours may also be an indicator of misuse
of the computer system.
The first use of an application may be an indicator of a
user installing software which is outside of an
organization’s Standard Operating Environment (SOE) if
they have the privileges to do so. It may also simply be
the user using an application from the SOE for the first
time.
We define an alert for this work as the result of
detecting a user instigated event which is atypical for that
user given their past usage history based on certain
criteria. The criteria we have used for generating alerts
are based on the situations mentioned above, i.e. first use
of an application and usage of an application at times
outside the norm for the user.
When the use of new applications or use of
applications outside of a user’s typical profile is detected
alerts can be generated but many of these are likely to be
false positives. Any approach which aims to detect
anomalous usage must also concentrate on reduction in
the number of false positives to have any benefit to an
organization.
It is likely that a user’s profile will not remain static
but will vary as the user’s duties change or the
organization’s SOE changes. It is therefore a requirement
of such a system which detects anomalous usage that it be
flexible or dynamic in its generation of user profiles. In
this paper we present two options for the generation of
dynamic user profiles.
The options for creation or training of user profiles
and the possibilities for making a user profile dynamic
are discussed in Section 2.2.
After user profiles have been generated, each profile
can be used as the basis for comparing that user’s
activities in the period following that on which the profile
was created. Any activity out of the ordinary for a
profiled user can be flagged to generate an alert to system
administrators.
A potential problem in work of this nature is that a
large number of alerts may be generated by the simple
alert types we defined, and furthermore, many of these
may be false positives. In a large organization, large
numbers of alerts generated for each and every user may
be costly to investigate.
To reduce the number of alerts generated we have
created abstractions based on the applications used. The
abstractions group similar applications together, rather
than using the full and raw process path and name that is
recorded in the security audit log.
The first abstraction, which we name process families,
is created by manually assigning applications with a
similar purpose to a family of applications. The second
abstraction, process groups, uses a clustering technique to
create groups of applications based on the name of the
process’ executable file and path. Further detail on the
design of these abstractions is discussed in Section 2.3.
We show that when these abstractions are used as the
basic unit for the user profile rather than the individual
processes, the number of alerts generated is reduced.
Section 2.3 discusses the development of the abstractions.
Details of our implementation and experimental
methodology are given in Section 3. Results for the
number of alerts generated from user data have been
generated for several profile creation schemes, training
periods and levels of event abstraction and are displayed
and discussed in Section 4. Section 5 discusses other
related work in the field of detection of insider misuse.
We draw our conclusions in Section 6 and discuss how
this current research may be extended in Section 7.
2 System Design – User Profiling and Event
Abstraction
Our aim has been to develop prototype software that
implements a capability to identify events that are
anomalous and may be indicative of computer misuse
within an organization. We have in addition collected
data for evaluating the effectiveness and performance of
the software and have used it to do so. We worked with
data from the Windows security audit log from computers
running the Windows XP operating system. When
various audit controls are enabled, these logs record
information about user log on sessions and the
applications or processes invoked by the users of the
computers and by the computer system itself.
2.1 Summary of the Design
Our approach consists of six main stages which are
summarized below. Further detail of these steps is
provided in Section 3 of this paper.
Data Collection and Preparation – Windows
Security log data is collected using a VB script run daily
to collect, compress and clear the log file. Further
conversion steps are applied to the logs before any data
reduction steps are undertaken as the Windows Security
log is stored in a proprietary binary format.
Data Reduction and Correlation – As the amount of
data collected from the log sources is voluminous, only
events which are recorded as a direct result of user action,
such as logging in, logging out and starting and stopping
applications, are used for further investigations. The
approach taken for correlation is similar to that used by
Abbott, Bell et al (2006) where event abstraction is used
to recognise logical events from the raw events recorded
in the logs.
Data Storage – For further processing, including
preparation of user profiles and alert generation, the data
is persistently stored in a relational database.
Profiling – User profiles are generated so that users’
normal or habitual use of applications can be determined.
Alert generation – Simple alert types are defined
based on the data recorded in the user profiles, and usage
data for users from ensuing time periods are used for
comparison. When abnormal events are detected, alerts
are generated.
Alert checking – When alerts are generated it is
necessary for them to be checked to determine if they are
benign or if there is some real threat behind the cause of
the event.
2.2 Profile Generation and Training
Before a profile can be generated for a particular user we
must have that person’s usage data for a specific
continuous period of time. The training period should be
selected so that most of the routine activities a user
CRPIT Volume 116 - Information Security 2011
24

performs are included. This will likely be different for
different users. For this paper we determine this time
period empirically.
We suggest three possible approaches for generating
the user profile. The first approach is to use a static or
constant window user profile. With this approach
detection of alerts is carried out on a weekly basis after
the training period and the user profile remains the same
for each week of testing. Alerts are always generated
based on that initial user profile. This approach is likely
to generate many alerts as the person’s usage changes due
to their role changing within their organization or when
software updates are applied. We concede that this is
unlikely to be a successful approach but it provides a
baseline for comparison with other approaches.
A second approach is to use a growing window,
where the profile training time period is continually
extended by adding events to the user profile from the
testing period after alerts have been generated for the
week under test. It is necessary for feedback to be given
about whether or not the event causing an alert is benign
before it can be added to the training data. With this
approach, the user profile becomes dynamic and captures
changes in a user’s behaviour or in the user’s
environment due to software updates. A possible
problem with this approach is that the user profile may
retain too much stale history especially if a user’s role
changes over time.
A third approach is to use a sliding time window for
the user profile where the width of the time window
remains constant. After training the user profile and
generating alerts based on the data from the testing week,
the user profile is recalculated by removing the oldest
week of profile data and adding the new week of data that
has had any events causing false alerts. This approach is
dynamic in nature and does not allow the user profile to
become cluttered with too much historical data.
2.3 Event Abstraction
The previous section discussed how we created user
profiles. The creation of the profiles is based on the
usage of specific processes, that is, specific versions of
applications, each of which has its own path and
executable name. A limitation with this approach is the
high number of alerts that may be generated for a user. A
user’s activities are likely to change over time as that
person’s duties or roles change within their organization
and the software tools and applications which a person
uses is not a stable set. In addition, applications in a
user’s profile will change as the applications in use are
upgraded or changed by the organization.
Some questions which need to be considered then
include:
1) Are executables and applications in an
organization’s SOE similar enough in nature to be
grouped together in some way?
2) Should different versions of the same application
be grouped together in a user’s profile?
For example, a person in a clerical role in an
organization would be likely to use tools from an office
suite like Microsoft Office, including Word, Excel,
PowerPoint and Outlook, and a software developer might
use an Integrated Development Environment like Eclipse,
and may require the Java Standard Development Kit, an
SQL Database server, and a repository tool like
Subversion. Each of these applications is likely to be
upgraded to the latest versions by the organization as they
become available. Alternatively, the organization may
change its software procurement policies, meaning that
completely different suites of applications may be used.
We propose two types of groupings or abstractions for
applications, which we have termed process families and
process groups. We compare the use of process families
and process groups with individual processes for profile
and alert generation.
The first grouping type, process families, is based on
families of applications or processes that are used for
similar purposes, as discussed above, e.g. software
development or office administration. All applications
and by extension, the process names and their paths that
are recorded in the security audit logs, can be assigned to
a process family. Further details on how this was
implemented are given in Section 4.
The second type of grouping, we have named process
groups. Process groups are constructed from clusters of
applications or processes which are grouped on their path
and their executable name. Using this approach
processes with the same value for their path or processes
with the same value for their executable name will be
grouped together. This allows all applications that are
run from the same directory along with all version
updates to belong to the same process group.
2.4 Alert Checking
Alerts that are generated in a user profiling system
would most likely require human processing, although if
an organization’s security policy specified a Standard
Operating Environment, alerts could first be
automatically checked against that.
It is desirable in any system that is checking
employee’s activities that there be as few false alerts as
possible, so that system administrators are not wasting
time or becoming complacent because they are checking
numerous alerts.
In organizations which have a SOE there will be some
users who are granted higher level privileges, including
the right to install software which is not included in that
SOE. In these situations, the user profile is important for
reducing the number of alerts that may be generated. If a
user profile is recorded for a person, software which is
not part of the SOE would only have to be checked the
first time an alert is generated. It could be marked as
normal or acceptable use and become part of that
person’s user profile. Once it is part of the user profile,
further usage of that software would not cause any alerts
to be generated. If the organization did not perform user
profiling, and relied on checking all application usage
against the SOE, every usage of software not in the SOE
would cause an alert to be generated.
3 Implementation and Experimental Methodology
The following sections describe how we implemented the
system and the experiments we undertook to find the best
set of parameters.
Proceedings of the Ninth Australasian Information Security Conference (AISC 2011), Perth, Australia
25

3.1 Data Collection and Preparation
The Windows Security logs collected and examined
during the course of the project were from desktop
computers running Windows XP Professional Edition
with Service Pack 3 installed. Local event logging was
enabled and all available auditing options were set.
Further to this, auditing of file accesses was enabled
where possible at the root level of the logical disks on the
computers being logged.
Under normal usage during office hours, with all
auditing options enabled, over 1 million events were
generated daily. Even though the Security log is meant to
be able to be configured to grow in size to 4.5 GB, the
maximum log size achieved on the systems under study
was approximately 10% of this at 450 MB. The auditing
of Object Access with all accesses to all files on the
workstation being audited lead to the rapid growth of log
files and was turned off after one month of data collection
to conserve processing time and storage space.
A VB script was prepared which saved and emptied
the log and compressed it to preserve local disk storage.
ELDump (Lauritsen 1998) was used to convert the binary
event file to a text version for further processing and
analysis. Data was collected for a period of nine
consecutive months on one of the Windows computers
and eighteen months on the other. Table 1 displays the
number of login sessions and the number of applications
started for each user on the computer systems being
surveyed.
Computer Name
Days of Data
Collection
Number of Login
Sessions
Number of Processes
Started
GANDALF 297 348 27,821
ARAGORN 531 124 953,429
Table 1: Information about logged data for the
computers studied
3.2 Data Reduction and Correlation
A great deal of information useful for extraction of a
user’s activities is recorded in the Windows Security log.
All events in the Windows Security log contain some
common data, such as the date and time stamp, computer
name, domain name, user name, event type and identifier
numbers, and further information specific to each type of
event.
For user profiling, the most useful event types include
log on, log off, process start and process exited events.
These provide details of a user’s log-in sessions and
interactions with the applications and services installed
on the computer.
It is necessary to correlate log on and log off events to
determine the duration of a user’s log in session. This is
possible in the Windows Security log by matching the
value in the Session Identifier field of the event.
Similarly, the process start and process exited events
from a specific user and log in session can be matched to
determine the duration of a user’s application usage. This
can be done by matching the Session Identifier, Process
Identifier and Process Name for the relevant events.
When the matching process exited event occurs, the
duration for which the process ran can be recorded.
When full auditing is enabled in the Windows
Security log, Object (file handles, network resources etc.)
accesses are recorded in the log and these are recorded
with the specific process name and process identifier
which accessed the object. Many hundreds of object
access events are recorded while an application is being
used. For this work, the object access events were
neglected due to the complexity of data recorded in them.
3.3 Data Storage
Relational database tables were used to store information
relating to users and their activities on the computers
studied. Information from the Windows Security logs
was stored for each user of each computer. This entailed
an entry for each log-in session including the start and
end times of the session and the total number of
applications invoked by the user during that session.
Entries were also stored for each application including the
name and full path of the application, start and end times
of the application, and details of the parent process
responsible for invoking the application. In many cases,
the parent process is Windows\explorer.exe as this is
the desktop application that the user interacts with when
using the Windows XP operating system. For example,
when the Eclipse IDE application is started from the
desktop, Windows\explorer.exe is recorded as the
parent process of the Eclipse\eclipse.exe process.
Many processes, however, are spawned by an application
a user may have started. For example, when a user starts
a Java application from within the Eclipse IDE, the
Java\bin\javaw.exe process is invoked to run the
Java application but it is invoked by the
Eclipse\eclipse.exe process. This information
could allow complex hierarchies of process usage to be
determined. The hierarchical nature of the processes was
not analysed for inclusion in this paper.
3.4 User Profiles
To generate user profiles we collected data on the usage
of which applications a person started. In particular, we
chose to record the following attributes which were used
for the generation of alerts:
1. The hour of the day an application was started;
2. The day of the week an application was started;
and
3. Whether or not the application had been run by
the user previously
A time period for user profile construction also had to be
considered. Figure 1 shows the cumulative number of
new processes used by different users for the data we
collected. There are a large number of processes
recorded for the first time, for a user in the first eight
weeks or so of the logs and then the rate of new processes
recorded tapers off slightly.
We tested each of the user profile types introduced in
Section 2.2, namely constant time window, growing time
window and sliding time window. For these experiments,
we tested each combination of profile type and process
CRPIT Volume 116 - Information Security 2011
26

abstraction type with 14, 28 and 56 day initial time
periods for the user profile.
To ensure that all experiments could be compared with
each other, the end date for the training period of the
initial time window was set as a constant. All alerts
generated in successive weeks were based on the same set
of usage data. This means that the starting date of the
initial time window for the 56 day training period
precedes the starting date of the 14 day training period by
42 days.
Figure 1: Cumulative Count of New Processes Used
by a User
3.5 Alert Generation
Once the different profiles were created, alerts were
calculated for a seven day testing period directly
following the profile training period. The total number of
alerts for the week for each of the attributes measured, i.e.
hour of day that a process was started, day of week that a
process was started, and if a process was started for the
first time, were recorded.
For the purposes of comparison of different
approaches in our system, all events causing alerts have
been considered to be benign or in other words, false
positives. After the testing was carried out on each
week’s data, the dynamic user profile types were
regenerated to include all events from the week’s data
that was just tested. The results reported in Section 4 for
each experiment are the cumulative number of alerts for a
period of thirty weeks of alerting for each of the two
users for which we had data.
3.6 Abstraction
As discussed in Section 2.3, we have proposed two
abstractions for collections of processes for reduction of
the number of alerts generated by our system. Our
experiments have also recorded the results when the
abstractions were not used.
The first of the abstractions we proposed was process
families. For the security audit logs collected from the
computers under study, nine process families were
created from 2,204 differently named processes. The
nine process families were: operating system tools, office
applications, games, security tools, browsers,
development tools, servers, utility applications and
installers. This was a laborious and manual task, although
some of the processing could have been automated, e.g.
all applications in a particular directory hive could have
been labelled as part of the same family. In a large
organization, such an approach without automation would
be prohibitively expensive to deploy.
The second abstraction proposed was process groups.
These groups were generated programmatically using a
clustering approach. For each distinct process name
recorded in the security audit logs, the full process path
was extracted and split into a path name and a process
name. For example, the process C:\Program
Files\Java\jdk1.6.0_17\ bin\java.exe has a
path value of C:\Program
Files\Java\jdk1.6.0_17\bin and a process name
value of java.exe. All applications with the same path
as the java.exe executable are considered part of the
process group, e.g. javaw.exe and javac.exe.
Continuing with the construction of this process group,
applications from different versions of the Java SDK bin
directory are grouped together:
C:\Program
Files\Java\jdk1.6.0_17\bin\java.exe
C:\Program
Files\Java\jdk1.6.0_17\bin\javaw.exe
C:\Program
Files\Java\jdk1.6.0_16\bin\java.exe
C:\Program
Files\Java\jdk1.6.0_16\bin\javaw.exe
C:\devel\jdk1.6.0_10\bin\java.exe
C:\devel\jdk1.6.0_10\bin\javaw.exe
...
The process groupings were constructed for the data
sets collected from each computer. The number of
process groups formed and the original number of distinct
processes are recorded in Table 2. The distinct process
names are based on the full path and executable name as
recorded in the computer logs. This table also records the
number of distinct executable names and the number of
distinct directories in which those executables were
located.
Computer GANDALF ARAGORN
Distinct Processes 561 1099
Distinct Executables 424 747
Distinct Directories 255 576
Process Groups 153 271
Table 2: Number of Process Groups Formed
For both process families and process groups, the
alerting process using the three different profile types for
user profile generation were tested and compared with the
results where no abstraction of processes was attempted
for each of the three initial time window period.
4 Experimental Results
The number of alerts for the three alert types (new
process, new hour for process and new day for process)
were collected for each of the three profile type training
schemes (constant window, moving window and growing
window) for initial training periods of 14, 28 and 56 days.
The alerts were generated for the data sets collected from
both computers under study for a period of 30 weeks with
regeneration of the dynamic profile types after each week
of testing.
05
00
10
00
15
00
0 100 200 300 400 500 600
Days Usage
A…
G…
Proceedings of the Ninth Australasian Information Security Conference (AISC 2011), Perth, Australia
27

These results were collected for processes as the
baseline case, and for process families and process groups
to determine the effect of the different abstraction
mechanisms.
In all tests, the starting date for alert generation for a
particular computer began on the same date, so that the
effect of training period could be compared. This means
that the training periods extended back to different
starting dates for the different training periods. The total
number of alerts for the thirty week period for each of the
tests conducted is displayed in Tables 3, 4 and 5. The
results are discussed in further detail in the following
paragraphs.
4.1 Baseline Case – All Processes
Table 3 displays the number of alerts generated for the
different training approaches for user profile generation
for both computers, using three different initial training
time windows.
It can be seen for the three different training
approaches when longer initial training periods were
used, fewer alerts were generated. This is an expected
result as the trained profile contains more information
when a longer training period is used.
The results indicate that the training approach which
generates the fewest alerts is the Growing Window
approach. This approach is dynamic in nature and retains
all past history for a user. While the Moving Window
approach is also dynamic, it would appear from the
results that when past history is removed from the user
profile, higher numbers of alerts are generated. The
Moving Window approach generated fewer alerts than
the Constant Window approach for one computer but the
results were reversed for the other.
Training Period
(days)
GANDALF ARAGORN
New Day Hour New Day Hour
14 Constant Window
425 484 466 514 581 581
28 412 477 465 495 567 565
56 301 378 390 454 543 549
14 Moving Window
380 428 424 585 600 601
28 362 417 411 549 582 586
56 346 398 405 525 568 574
14 Growing Window
191 295 284 450 534 536
28 180 283 278 495 564 563
56 165 248 267 454 541 547
Table 3: Number of Alerts Generated over 30 Weeks
for Processes
4.2 Process Families
Table 4 shows the results of alert generation when
processes were grouped together into process families as
outlined in Section 2.3.
It can be seen that the frequency of alerts dropped
significantly when processes were aggregated into
process families. This level of aggregation is clearly too
coarse to be useful. As soon as one process belonging to
a process family is used, no other processes from that
family will generate an alert.
Training Period
(days)
GANDALF ARAGORN
New Day Hour New Day Hour
14 Constant Window
2 6 3 2 3 4
28 1 3 2 0 2 3
56 1 2 2 0 1 3
14 Moving Window
3 9 9 3 7 6
28 2 8 4 0 3 3
56 2 4 3 0 1 3
14 Growing Window
2 3 3 2 3 4
28 1 2 2 0 2 3
56 1 2 2 0 0 3
Table 4: Number of Alerts Generated over 30 Weeks
for Process Families
4.3 Process Groups
Table 5 displays the results of the number of alerts
generated when processes were clustered together into
process groups using the approach outlined in Section
2.3. It can be seen from the results that the number of
alerts from the 30 week testing period is significantly
lower than when individual processes were tested. The
number of alerts generated for the growing window
profiles with eight weeks of training data produce on
average three or four alerts per user per week. For a large
organization this could still be a significantly high
number of alerts in total but it is a significant
improvement on the average of five to twenty alerts per
user per week when no aggregation is used.
Training Period
(days)
GANDALF ARAGORN
New Day Hour New Day Hour
14 Constant Window
96 129 120 126 159 154
28 88 123 118 115 143 139
56 85 112 112 98 134 130
14 Moving Window
122 142 141 155 164 165
28 117 141 133 133 149 153
56 97 120 118 126 145 148
14 Growing Window
112 141 131 98 131 129
28 105 134 123 98 128 127
56 85 109 112 89 119 115
Table 5: Number of Alerts Generated over 30 Weeks
for Process Groups
The results for process groups also indicate that the
best technique for user profile generation as measured by
reducing the number of alerts is the Growing Window.
This is discussed further in Section 6.
5 Related Work
There are quite comprehensive event monitoring and
event correlation products on the market. However they
are typically platform specific and focus generally on
network event correlation and/or centralized event
monitoring and log management rather than post hoc
correlation of events for forensic purposes.
We note also a considerable body of research in the
area of security event correlation, ranging from alert
correlation in intrusion detection systems (Ning, Cui et al.
2004; Morin, Mé et al. 2009) through to the
standardization and formatting of audit or log records
(Bishop 1995; Kent and Souppaya 2006) and audit
reduction (Pfleeger and Pfleeger 2003).
CRPIT Volume 116 - Information Security 2011
28

Specific related work in insider misuse detection quite
commonly has implemented systems aimed at specific
operating systems without mention of the system’s
applicability for other operating systems (Christoph,
Jackson et al. 1995), or have developed approaches not
aimed at operating systems at all, e.g. for database
systems (Chung, Gertz et al. 1999). It is also quite
common for researchers to use simulated data (Maybury
2006; Anderson, Selby et al. 2007).
Security personnel at the Los Alamos National
Laboratory (Christoph, Jackson et al. 1995) implemented
an approach to detect security policy violations on
computer systems. This was capable of detecting
activities by insiders abusing operating system privileges
and outsiders attempting to gain clandestine access. They
produced Network Anomaly Detection and Intrusion
Reporter (NADIR) and UNICOS Real-time NADIR
(UNICOS) to summarize user and system activity
profiles. This system was aimed specifically at the
UNICOS operating system and no extensibility was
considered.
Chung, Gertz et al (1999) created a misuse detection
system for relational databases. They computed user
profiles from audit log data in an attempt to detect insider
misuse of a financial database system in use in a bank.
They present scenarios based on a bank teller misusing
their privileges to gain customer credit card information
or to transfer customer funds to their own account.
Another work by Shavlik, Shavlik et al. (2001)
focused on profiling and identifying Windows 2000 users
via keystroke dynamics. This work was intended to
complement insider misuse detection rather than to detect
insider misuse.
Maybury (2006) reported on a collaborative, six
month workshop to characterize and create analysis
methods to counter sophisticated malicious insiders in the
United States Intelligence Community. His paper
discusses a generic model of malicious insider
behaviours, distinguishing motives, (cyber and physical)
actions, and associated observables. The paper outlines
several prototype techniques developed to provide early
warning of insider activity, including novel algorithms for
structured analysis and data fusion and reports
performance assessment in an operational network
against simulated insiders (an analyst, application
administrator, and system administrator).
Anderson, Selby et al (2007) report on their behaviour
profiling and misuse detection system, IRIS, which
involves an intricate architecture of components to
achieve real-time anomaly detection based upon a variety
of inputs including operating system logs. IRIS employs
the proprietary MQ Telemetry Transport protocol
(MQTT) implemented by the IBM MQ MicroBroker.
The system has been deployed to date only with
simulated data and the authors note that their system
requires a comprehensive set of user data, suggesting
periods of time of the order of years.
Cathey, Ma et al (2003) concentrate on the detection
of insider misuse in information retrieval systems. Their
rules based approach is based on the creation of user
profiles and relies on each user’s profile recording the
types of documents that the user is allowed to retrieve
from the information retrieval system. Again, this work
is quite different to the research we have undertaken.
Ma and Goharian (2004) built user profiles to detect
misuse in search systems based on activities learnt
through clustering and relevance feedback. Goharian and
Ma (2005) showed that they could achieve equivalent
results to Cathey, Ma et al (2003) in detecting off-topic
accesses to files in an information retrieval system by
using a subset of the features that were originally
proposed. The research presented in these approaches
has focused on the detection of insider abuse of privileges
by detecting anomalous behaviour from access control
lists either prescribed by system administrators or from
definitions generated from “learnt normal” behaviour. We
note that these approaches have not targeted an operating
system’s Security Audit event logs and the applications
used for generation of user profiles but have concentrated
on file and document accesses.
Magklaras and Furnell (2006) have produced a threat
prediction specification language for modelling insider
threat and intrusion incidents. This approach is quite
different to the anomaly detection approach which we
have presented in this paper.
Other researchers in the field of insider misuse
detection have defined the threat of insider misuse
(Bishop and Gates 2008; Pfleeger and Stolfo 2009) but
have not moved to implementation. There have also been
some frameworks for insider misuse proposed (Baek,
Kim et al. 2008; Zhang, Ma et al. 2009) but again, these
have not been fully implemented.
None of these papers have discussed the likelihood of
high levels of false positives or ways to address this
problem. There has been no mention in any of these
papers of the different approaches we have presented for
training user profiles and there has been no discussion of
abstractions for collections of user applications.
6 Conclusions
We have shown that it is possible to build user profiles
from data recorded in the Security Audit logs of
computers running the Windows XP Operating System.
The main information used from the events logged has
been the names of the applications invoked by the users
of the computers. It should be possible to use the same
approach for any computers whose operating system
records similar data.
We outlined three different approaches to generating
user profiles, where a constant window or a growing
window or a moving window can be used to specify the
training time period used in the user profile. A user’s
profile may change due to a change in their role or may
be due to software upgrades or changes imposed by the
user’s organization. Ideally such changes should not
cause a major increase in the number of alerts generated
by the system.
Our experimental results indicate that the growing
window approach generates fewer alerts than the moving
window approach and its dynamic nature captures
changes in usage of applications without generating an
excess number of alerts. This is thought to be due to the
growing window approach not losing any past history
from the user profile.
Proceedings of the Ninth Australasian Information Security Conference (AISC 2011), Perth, Australia
29

Our results also indicate that a longer training period
will result in a richer user profile which has the effect of
generating fewer alerts.
We also proposed and implemented two groupings of
processes in an effort to reduce the number of alerts
generated by the system. One of these, Process Families
where all applications used on the computers were placed
in a small number of groups, was too coarse in its
groupings to be useful.
The second approach we named Process Groups and
created by clustering together applications with the same
path and/or the same executable name. This approach
resulted in a significant reduction in the number of alerts
when compared to individual process names, three to four
alerts per user per week. We conclude that the use of this
abstraction provides a positive benefit to the overall
system
It is of course necessary to investigate any alerts that
are generated by a system such as the one described in
this paper. If an organization employs a Standard
Operating Environment, alerts generated from the first
invocation of a process or process group could be
automatically checked against the list of software in the
SOE. Such a check should result in a further reduction in
the number of alerts that need to be manually checked.
All user profiles have been generated for individual
users. Using the abstraction approach it should be
possible to make comparisons between users based on the
collection of processes in their profile or alternatively to
create profiles for an organization. Based on the role of
similar people in the organization, a profile could be
assigned based on the expected usage of applications.
The profile could then be dynamically updated as the user
settles in to their work routine. If this were done, there
would be no need to wait for a training period for a new
employee in an organization before their usage is
routinely monitored. Care would have to be taken with
such an approach that the user profile is properly
regenerated once the employee has been working for the
training window time period.
We believe that the approach outlined here for users
of PCs could also be applied to other sources of data.
Any source of data where user’s actions are recorded
could be used, e.g. web proxy logs where people’s web
browsing habits are recorded or ERP systems where user
transactions are recorded. A possible application for this
approach with ERP systems is the detection of financial
fraud.
7 Future Work
In future work we intend to improve the system by
changing and improving the way process groups are
formed. When the process group clusters were formed, it
was noticed that some of the clusters contained a single
process name. A further reduction in alerts may be
achieved by aggregating single processes by using their
process family rather than their process group, i.e. by
using a mixed model of aggregation.
Alternatively we could use some other means to
determine if sufficient parts of a process’ path are the
same for the process to belong to an existing process
group. This could be implemented as a set proportion of
the path or it could use an edit distance measure with a set
threshold determining whether two processes belong in
the same process group.
It should be noted that the work carried out to date is
based on the presence or absence of a particular
application in a user’s profile. In future work we will
utilise the frequency of usage of applications, allowing us
to build probabilistic models of usage for each person.
In our current work we have recorded but not made
use of the amount of time that a user uses particular
applications or groups of applications in their routine
work. This is calculated from the start and stop times
recorded for each process in the Security Audit log. By
measuring the amount of time an application is used,
better models of typical usage for a user can be built and
this will be incorporated in our future work.
We intend to investigate the proportion of time a
process is actively used while it is open by making use of
a library which allows the amount of CPU time an
application uses to be monitored to provide a more
suitable measure of application usage. Keystroke logging
tools may also provide a solution here as they can record
which application is receiving key strokes and mouse
clicks. Further investigation into monitoring application
usage is therefore warranted.
References
Abbott, J., Bell, J., Clark, A., de Vel, O. and Mohay, G.
(2006). Automated recognition of event
scenarios for digital forensics. 2006 ACM
Symposium on Applied Computing, Dijon,
France.
Anderson, G. F., Selby, D. A. and Ramsey, M. (2007).
Insider attack and real-time data mining of user
behavior. IBM Journal of Research and
Development 51(3/4):465-475.
AusCERT. 2006 Australian computer crime and security
survey:
http://www.auscert.org.au/images/ACCSS2006.
pdf. Accessed 12 Oct 2007.
Baek, E., Kim, Y., Sung, J. and Lee, S. (2008). The
design of framework for detecting an insider's
leak of confidential information. e-Forensics,
Adelaide, Australia.
Bishop, M. (1995). A standard audit trail format. National
Information Systems Security Conference,
Baltimore, USA.
Bishop, M. and Gates, C. (2008). Defining the insider
threat. Fourth Annual Cyber Security and
Information Intelligence Research Workshop
Oak Ridge, USA.
Cathey, R., Ma, L., Goharian, N. and Grossman, D.
(2003). Misuse detection for information
retrieval systems. 2003 ACM CIKM
International Conference on Information and
Knowledge Management, New Orleans, USA.
Christoph, G. G., Jackson, K. A., Neuman, M. C.,
Siciliano, C. L. B., Simmonds, D. D., Stallings,
C. A. and Thompson, J. L. (1995). UNICORN:
Misuse detection for UNICOS. 1995 ACM/IEEE
Conference on Supercomputing, San Diego,
USA.
CRPIT Volume 116 - Information Security 2011
30

Chung, C. Y., Gertz, M. and Levitt, K. (1999). DEMIDS:
A misuse detection system for database systems.
Third Working Conference on Integrity and
Internal Control in Information Systems:
Strategic Views on the Need for Control,
Amsterdam, The Netherlands.
Goharian, N. and Ma, L. (2005). On off-topic access
detection in information systems. 14th ACM
International Conference on Information and
Knowledge Management, Bremen, Germany.
Gordon, L. A., Loeb, M. P., Lucyshyn, W. and
Richardson, R. 2006 CSI/FBI computer crime
and security survey:
http://i.cmpnet.com/gocsi/db_area/pdfs/fbi/FBI2
006.pdf. Accessed 12 Oct 2007.
Kent, K. and Souppaya, M. Guide to computer security
log management:
http://csrc.nist.gov/publications/nistpubs/800-
92/SP800-92.pdf. Accessed 6 Jun 2007.
Lauritsen, J. ELDump:
http://www.ibt.ku.dk/jesper/ELDump/default.ht
m. Accessed 1 Apr 2005.
Ma, L. and Goharian, N. (2004). Using relevance
feedback to detect misuse for information
retrieval systems. Thirteenth ACM International
Conference on Information and Knowledge
Management, Washington, USA.
Magklaras, G. B. and Furnell, S. M. (2006). Towards an
insider threat prediction specification language.
Information Management & Computer Security
14(4):361-381.
Maybury, M. (2006). Detecting malicious insiders in
military networks. MILCOM-06, Washington,
USA.
Morin, B., Mé, L., Debar, H. and Ducassé, M. (2009). A
logic-based model to support alert correlation in
intrusion detection. Information Fusion
10(4):285-299.
Ning, P., Cui, Y., Reeves, D. S. and Xu, D. (2004).
Techniques and tools for analyzing intrusion
alerts. ACM Transactions on Information and
System Security 7(2):273-318.
Pfleeger, C. P. and Pfleeger, S. L. (2003): Security in
computing. Upper Saddle River, Pearson
Education, Inc.
Pfleeger, S. L. and Stolfo, S. J. (2009). Addressing the
insider threat. IEEE Security and Privacy
7(6):10-13.
Shavlik, J., Shavlik, M. and Fahland, M. (2001).
Evaluating software sensors for actively
profiling Windows 2000 computer users. 4th
International Symposium on Recent Advances in
Intrusion Detection, Davis, USA.
Zhang, H., Ma, J., Wang, Y. and Pei, Q. (2009). An
active defense model and framework of insider
threats detection and sense. Fifth International
Conference on Information Assurance and
Security, Xi'an, China.
Proceedings of the Ninth Australasian Information Security Conference (AISC 2011), Perth, Australia
31

CRPIT Volume 116 - Information Security 2011
32

Identification of Potential Malicious Web Pages
Van Lam Le, Ian Welch, Xiaoying Gao, Peter Komisarczuk School of Engineering and Computer Science, Victoria University of Wellington
P.O. Box 600, Wellington 6140, New Zealand
{van.lam.le, ian.welch, peter.komisarczuk, xiaoying.gao}@ecs.vuw.ac.nz
Abstract Malicious web pages are an emerging security concern on the Internet due to their popularity and their potential serious impact. Detecting and analysing them are very costly because of their qualities and complexities. In this paper, we present a lightweight scoring mechanism that uses static features to identify potential malicious pages. This mechanism is intended as a filter that allows us to reduce the number suspicious web pages requiring more expensive analysis by other mechanisms that require loading and interpretation of the web pages to determine whether they are malicious or benign. Given its role as a filter, our main aim is to reduce false positives while minimising false negatives. The scoring mechanism has been developed by identifying candidate static features of malicious web pages that are evaluate using a feature selection algorithm. This identifies the most appropriate set of features that can be used to efficiently distinguish between benign and malicious web pages. These features are used to construct a scoring algorithm that allows us to calculate a score for a web page’s potential maliciousness. The main advantage of this scoring mechanism compared to a binary classifier is the ability to make a trade-off between accuracy and performance. This allows us to adjust the number of web pages passed to the more expensive analysis mechanism in order to tune overall performance . .
Keywords: Internet Security, Drive-by-download, malicious web page.
1 Introduction A “malicious web page” refers to a web page that
contains malicious content that can exploit a client-side computer system. This attack is delivered to client’s web browser when a malicious web page is requested. This type of attack is termed web-based client-side attack. The attack is delivered as part of the web page itself and is designed to exploit client-side vulnerabilities such as flaws in the implementation of browser functionality, interpreters of active content within webpages or scriptable client-side components such as ActiveX components. The result of an attack is often the installation of malware in the client system without the user’s consent and disclosure of user’s information. The user’s computer is often “owned” by attacker and can
Copyright © 2011, Australian Computer Society, Inc. This paper appeared at the 9th Australasian Information Security Conference (AISC 2011), Perth, Australia. Conferences in Research and Practice in Information Technology (CRPIT), Vol. 116. C. Boyd and J. Pieprzyk, Eds. Reproduction for academic, not-for profit purposes permitted provided this text is included.
take part in generating SPAM and Distributed Denial of Service (DDOS) attacks.
Detection and blacklisting of malicious web pages has been the subject of several research projects. One effective approach is to build virtualised environments like high interaction client honeypots (Seifert 2007a) where suspicious web pages are loaded, executed and monitored to track potential malicious activities or behaviour. The virtualised environment allows this to be done without allowing any malware to be propagated to production systems. While this method shows very efficient results in term of detecting unknown attacks, it is expensive in terms of the resources required to provide a virtualised environment containing a complete operating system and is relatively slow with each visit taking up to 10 seconds. To attempt to reduce the required resources and increase the speed of the detection method, previous work (Seifert 2007a) has proposed using a hybrid approach where web pages are first filtered using a lightweight mechanism before being passed to the more expensive high-interaction mechanism. Our work focuses on improving the efficiency and effectiveness of that lightweight mechanism.
There are three main issues that we have explored in the design of our lightweight mechanism. Firstly, we want our mechanism to be lightweight in terms of its resource requirements. Therefore our mechanism is a data-mining algorithm that uses features derived from the static web page rather than runtime features gathered through the expensive process of loading the web page into a web browser within a virtual environment. This paper proposes a set of features that have been arrived at through analysis of known malicious web pages. These features are then evaluated by feature selection methods in order to find out the most suitable feature set to identify potential malicious web pages. Secondly, we want our lightweight mechanism to be tuneable to allow us to control the number of pages passed through to the more expensive mechanisms such as high interaction honeypots. This allows us to manage overall system performance. This has led us to develop a lightweight mechanism that computes a score rather than a simple binary malicious/benign classifier (Seifert, Welch and Komisarczuk 2008). By choosing the threshold that must be reached before passing on the web page, the overall performance can be tuned to reflect overall performance constraints. Thirdly, we believe that it is worse to miss a potential malicious web page (a false negative) than incorrectly class a web page as malicious (a false positive) and pass it onto the second stage for further analysis. Therefore, our aim has been to design a mechanism that minimises the number of false negatives whilst keeping the false positives at an acceptable level. Note that when taking resource usage into account that
Proceedings of the Ninth Australasian Information Security Conference (AISC 2011), Perth, Australia
33

there will most likely be a relationship between our choice of threshold value and the false negative rate and part of our interest is in understanding this relationship.
2 Background and Related Work
2.1 Web-based Client-side Attacks As the number of Internet users has increased
significantly, web-based attacks that use malicious web pages to exploit users’ system have become a primary concern in the Internet security. A web-based client-side attack happens when an Internet user visits malicious web pages which attempt to exploit the user’s browser vulnerabilities, plug-in application vulnerabilities or user’s operating system vulnerabilities in order to compromise the user’s system.
A web application is defined as an network application which is typically interacting with the web browser over the Internet (Mehdi 2007). Information service providers use web applications to deliver their services to users. To do that, they implement their business logic through web applications at a web server with an advertised URL (Gollmann 2008). To enrich their services, the providers can use more than one web server and backend servers and applications which work in cooperation in order to deliver services to the customers. In the client-side, there is the main application – web browser which users use to access information services from the providers. In order to expand their functionalities, almost all web browsers support adding third-party plug-in components such as Adobe Acrobat, Adobe Flash, Apple QuickTime, and Microsoft ActiveX.
To deliver malicious content to the client-side, an adversary first needs to publish malicious contents on the Internet. Compromising a web server is one of the common ways to deliver malicious contents. Various methods are reported to be used to increase attack effectiveness (Websense 2008, Sophos 2009, ScanSafe 2009, Symantic April 2009, ScienceDirect 2008, Websense 2009). Intruders can compromise a website by exploiting some vulnerabilities in the web server, exploiting a vulnerable web application (Symantic April 2009), vulnerable database applications such as SQL injection (Niels, Moheeb Abu and Panayiotis 2009, ScanSafe 2009, Microsoft 2009). The results from this compromising are inserting malicious contents which can be delivered to the client-side system (Niels, Moheeb Abu and Panayiotis 2009, Microsoft 2009). Some vulnerabilities in web server and web applications are reported as a very common issue(Provos, Mavrommatis, Abu and Monrose , Symantic April 2009). Web 2.0 technology, in addition, has become a common environment for attackers to spread their malicious contents (Websense 2008, Adam and Meledath 2008). Visitors are allowed to put arbitrary HTML and they can insert malicious codes into websites, insert links to malicious sites or even upload malicious files (Provos, McNamee, Mavrommatis, Wang and Modadugu 2007, Adam and Meledath 2008, Patsakis, Asthenidis and Chatzidimitriou 2009, Lawton 2007).
After publishing their malicious contents on the Web, attackers must get users to visit the malicious web pages in order to make exploitation (Niels, Moheeb Abu and
Panayiotis 2009). Spam is a common technique which intruders use to lure user to their malicious web pages. For instance, spam emails can contain a links to a malicious web page. Web blogs and social networking sites are also abused to get users to visit malicious sites (Garrett, Travis, Micheal, Atul and Kevin 2008). In addition, some legitimate sites have third-party contents like access counters, advertisements which refer to malicious sites (Alme 2008, Provos, McNamee, Mavrommatis, Wang and Modadugu 2007, Websense 2008, Barth, Jackson and Mitchell 2009). Moreover, search engine are also abused by attackers in order to get users to visit their malicious sites. Popular search terms are used to make malicious web pages be displayed in the search results (Keats and Koshy 2009, Alme 2008, Barth, Jackson and Mitchell 2009, Gyongyi and Garcia-Molina 2004, Websense 2009) so there is a very high chance for their malicious sites to be visited.
When a user visits a malicious site, malicious contents are delivered to exploit the user’s system. Malicious code is usually used to target a specific vulnerability of the web browser itself or plug-in applications (Jose, Ralf, Helen and Yi-Min 2007, Charles, John, Helen, Opher and Saher 2007). To discover available vulnerabilities in the user’s system, adversaries abuse scripting support via JavaScript, Visual Basic or Flash to collect information about the user’s computing environment (Provos, McNamee, Mavrommatis, Wang and Modadugu 2007). Moreover, obfuscation is used to hide exploit code in order to make malicious pages hard to be detected (Seifert, Welch and Komisarczuk 2008, Seifert 2007b, Seifert, Steenson, Holz, Yuan and Davis 2007).
In addition, Seifert’s study about malicious web servers shows that there are some available web exploitation kits (Seifert 2007b). These web exploitation kits are very powerful in term of compromising web servers and delivering malicious contents. The result from this kind of attacks is usually to redirect users’ requests to malware distribution networks. In addition, other related researches also show that malicious web pages are delivered by malware distribution networks (Provos, Mavrommatis, Abu and Monrose , Wang, Beck, Jiang and Roussev 2006, Jianwei, Yonglin, Jinpeng, Minghua, Xulu, Weimin and Yuejin 2007).
2.2 Related Work In this section, we preview some current analysis
methods which are used to detect malicious web pages. They are classified into three main approaches: Signature approach, state-change approach and machine learning approach.
2.2.1 Signature technique In the signature approach, detection systems use
known signature to detect malicious web pages. Signatures can be from some well-known Intrusion Detection Systems (IDS) or anti-virus applications. This approach is commonly used in the detecting system using low interaction client honeypot. Snort signature is used to detect malicious web pages in their HoneyC system (Seifert, Welch and Komisarczuk 2007). The HTTP responses from web servers are constructed under XML format, and then analysed against Sport signatures. In
CRPIT Volume 116 - Information Security 2011
34

Monkey-Spider system, Ikinci, Holz and Freiling also used signature approach to detect malicious websites. The contents of websites are crawled and stored in files. The crawled contents are then scanned by ClamAV – an anti-virus application (Ikinci, Holz and Freiling 2008).
2.2.2 State-change technique (rule-based technique)
In addition, state-change approach is commonly used in the detecting systems using high interaction client honeypot – one of the efficient instruments to detect malicious web pages. The main idea of this approach is monitoring the state change in the client system during visiting an URL time. If there is any unauthorized state change during visitation, the visit URL is classified as malicious. In the Strider HoneyMonkeys system, a monkey program loads a browser, instruct it to visit each URL and wait for a few minutes for downloading process. The state changes in the system is then detected against unauthorized creating executable files or registry entries in the system (Wang, Beck, Jiang and Roussev 2006). Moreover, to detect drive-by-download attack, Moshchuk, Bragin, Gribble and Levy use event triggers. They create some trigger conditions to track unauthorized activities in process creation, file system and registry system. The trigger conditions also include any event that makes browser or the system crash. During visitation, if an URL make a trigger fire, it is classified as unsafe (Moshchuk, Bragin, Gribble and Levy 2006). The state change approach is also used by Xiaoyan, Yang, Jie, Yuefei and Shengli in their client honeypot system to collect Internet-based malware. A behaviour monitoring module is conducted to track malicious behaviour. It hooks native API, DLL functions and TDI in order to monitor all activities causing buffer overflow, accessing system resources such as process, network, file, and registry (Xiaoyan, Yang, Jie, Yuefei and Shengli 2008).
2.2.3 Machine Learning Approaches Seifert et al. (Seifert, Welch and Komisarczuk 2008)
proposed a novel classification mechanism to detect malicious web pages. This method is based on HTTP responses from potential malicious web servers which are then analysed to extract potential malicious characteristics. The method was used in a hybrid system in which all URLs are classified by static heuristic method and sent to high interaction client honeypot for verification. To classifying URLs by static heuristics method, some common attributes are chosen based on three proposed main elements in malicious web pages: exploit, exploit delivery mechanism and obfuscation. The first step in this method is collecting malicious and benign web pages and then extracting potential attributes from these web pages. In learning step, all attributes extracted from 5,678 instances of malicious and 16,006 instances of benign web pages were fed into Weka with J4.8 decision tree learning algorithm implementation. The outcome classifier from learning step was used to classify 61,000 URLs. This classifier had very good false positive rate (5.88%) but very high false negative rate (46.15%).
Hou et al proposed a machine learning approach to detect malicious web content (Hou, Chang, Chen, Laih and Chen 2009). The key point in this research is the
method used to choose features according to the usages of DHML knowledge. The chosen features have to meet the requirement for abilities against obfuscation vs. accuracy. Three groups with 171 features were chosen. There are 154 features used to count the use of native Java functions. Nine features are also used to measure some elements inside a HTML documents. There is 8 advanced features are used to count the use of ActiveX object. In the first step, 965 benign and 176 malicious web pages were collected, analysed and labelled manually. The malicious web pages were then categorized into nine pre-defined types based on the skill used by attackers. In order to study about choosing type of features, the authors took some experiments with different chosen features. Decision tree algorithm is used in these experiments. While using all features cannot get high true positive and low false positive result, the combination of three features can get very good result. The authors also compared the results of different classification algorithms with the use of all the features. Four classification algorithms used in this comparison are decision tree, Naïve Bayes, SVM and boosted decision tree. The result showed that the boosted decision tree got the best performance with high true positive rate and low false positive rate.
To detect malicious web pages, Liang (Bin, Jianjun, Fang, Dawei, Daxiang and Zhaohui 2009) proposed the concept of abnormal visibilities. According to their studies, malicious web pages are usually changed in their display modes in order to be invisible or almost invisible. The authors showed three main forms of abnormal visibility. The first one is changing the width and height attributes of iframe in order to make embedded malicious codes invisible or almost invisible. Setting the display style of iframe ‘display: none’ is the second form of abnormal visibility. The last form is generating iframe tag dynamically in order to make obfuscation. Abnormal visibility fingerprints are created and used to detect malicious web pages. Each web page is scanned to detect any form of abnormal visibility. The detected value in any kind of abnormal visibility is compared with a threshold value. If the detected value is less than the threshold value, the web page has an abnormal visibility and is considered as a possible malicious page. To carry out the experiment, the authors detect 60 websites reported malicious by StopBadWare.org. They scanned 66882 pages from these websites and found 30561 malicious one. They also figured out that their system has low false positive (1.99%) and false negative rates (2.63%).
Ma et al. (Ma, Saul, Savage and Voelker 2009a) pinpointed a new approach to detect malicious web pages named lightweight URL classification. In this approach, they classify web pages based on relationship between URLs, their lexical and host-based features. It does not use contents of web pages in detection. Lexical features include any features which make the page ‘look different’. They can be the length of the host-name, length of the entire URL, number of dot in URL and so on. Hosted-base feature include IP address properties, WHOIS properties, Domain name properties and geographic properties. Naive Bayes, SVM and Logistic Regression are used for classification. The authors used two experiments in their study. The first experiment is for
Proceedings of the Ninth Australasian Information Security Conference (AISC 2011), Perth, Australia
35

comparing between feature sets. The features were divided into nine feature sets and these sets were fed into the ℓ1-regularized logistic regression (LR) classifiers. The results showed that using more features got better classification accuracy. In addition, their another experiment (Ma, Saul, Savage and Voelker 2009b) was conducted to build online learning algorithm to detect malicious web pages. They used the same feature as the experiment (Ma, Saul, Savage and Voelker 2009a). There were three online algorithms implemented: Perception, Logistic Regression with Stochastic Gradient Descent and Confidence-Weight. They compared their online learning algorithm with Support Vector Machine (SVM). The results showed that SVM needed more training data set in order to get better accuracy but their algorithms did not.
To build an inductive learning model to detect malicious web pages, Liu et al. (Liu and Wang 2009) extracted features from HTTP responses such as iframe, javascript, body redirect, css redirect etc. The inductive learning model consisted of behaviour signatures based on extracted features and the relationship of features. The results from their experiment showed that the inductive learning model missed many malicious web pages (46.15%).
Chia-Mei et al (Chia-Mei, Wan-Yi and Hsiao-Chung 2009) proposed a model to detect malicious web pages based on unusual behaviour features such as encoding, sensitive key word splitting and encoding and some dangerous JavaScript functions. To classify web pages, they created a scoring mechanism which cored based on 9 predictor variable. Moreover, weights for each predictor variable were decided by training phrase. The results from their experiment showed that their model worked very well. However, their dataset was very small with 460 benign and 513 malicious web pages.
Shih-Fen et al. (Shih-Fen, Yung-Tsung, Chia-Mei, Bingchiang and Chi-Sung 2008) proposed a novel semantics-aware reasoning detection algorithm to detect malicious web pages (SeAR) which was based on structures of HTML codes. Firstly, they defined templates for HTML codes. For each tested HTML code, the distance between the tested HTML code and templates were calculated. Secondly, the best match was chosen based on the distance and weight of the template. Finally, threshold was used to make decision whether web pages were classified as malicious or benign. The outcome from this research is very good but their dataset had only 147 malicious instances (no benign one).
Cova et al. (Cova, Kruegel and Vigna 2010) presented a novel approach which used anomaly detection and emulation to identify malicious JavaScript Code. The features were chosen based on sequence of carrying out an attack: redirection and cloaking, de-obfuscation, environment preparation, and exploitation. They argued that not all of the features were necessary for an attack happening and classified the features into two groups: useful features and necessary features. To extract features, they used emulated HTML browser HtmlUnit (Gargoyle). They carried experiments on over 115K web pages and their approach achieves very good outcome in comparison to other approaches such as ClamAV, PhoneyC and Capture-HPC.
While there is a few of works focusing on identifying malicious web pages, this paper presents a mechanism to detect potential malicious one in order to reduce number of suspicious web pages which need to be investigated further by detection instruments or experts.
3 Scoring Mechanism This work focuses on how to reduce number of
suspicious web pages but minimize missing attacks. A scoring mechanism is proposed to work as a filter which classifies suspicious web pages into classes: benign web pages and potential malicious web pages. Only potential malicious web pages are forwarded to detection devices or experts for further investigations (Fig. 1).
Figure 1: Scoring Mechanism We propose scoring mechanism because of three
reasons. Firstly, it works as a filter, not a final classifier so it just makes an estimate by scoring maliciousness of web pages. Secondly, it uses static features which can be obtained without rendering fully or executing web pages. However, they are less valuable than run-time features which are extracted by rending fully and executing web pages. Therefore, static features are likely good for detecting potential malicious web pages. Finally, scoring algorithm can make a trade-off between number of detected potential malicious web pages and false negative rate (missing attack). The key idea to propose scoring mechanism is to reduce number of suspicious web pages which need to be inspected by detection devices or experts, but not missing any attack.
3.1 Feature Selection The first step on feature selection is to identify
potential malicious features which can distinguish between benign web pages and malicious one. By analysing the selected common malicious web pages, we find that there are three main groups of malicious contents of web pages as follows:
- Foreign contents are malicious contents which are loaded from outside along with suspicious web pages. These contents can be loaded with suspicious web pages by some of malicious HTML tags such as frame, iframe, image source… Iframe is especially known as very common method to load outside malicious web pages along with suspicious one (Provos, Mavrommatis, Abu and Monrose). In almost all of cases, foreign malicious contents are resulted from compromises or uncontrolled third-party contents such as advertising and site hit counters.
- Script contents are known as the most common malicious contents of malicious web pages. In almost all of cases, script codes are used for two main purposes: delivering and hiding malicious codes by obfuscations. We identify some of potential malicious features from scripts which could distinguish between benign web pages and malicious web pages, such as script size, string
CRPIT Volume 116 - Information Security 2011
36

size, word size, argument size, character distribution…
- Exploit code contents are the core contents of malicious web pages. They are target specific vulnerabilities in web browsers, plug-ins or operating systems. Some of HTML tags known as delivery of potential malicious codes are applet, object, embed… However, there are rarely malicious codes found in this direct form. In almost cases, exploit codes are encoded in scripts with obfuscations to hide from detection devices.
Feature Group 1: Foreign Contents
1 Number of redirection
2 Number of iframe and frame tag
3 Number of external link in iframe and frame tag
4 Iframe and frame link length: Median
5 Ratio of vowel character in iframe and frame link: Minimum
6 Ratio of special character in iframe and frame link: Minimum
7 Number of external links (except iframe and frame)
8 Other link length: Minimum
Group 2: Script Contents 9 Number of scripts
10 Number of script lines
11 Number of script word
12 Ratio of special character in scripts
13 Script length: Minimum
14 Script line length: Minimum
15 Script string length: Maximum
16 Script word length: Minimum
17 Script function argument length: Minimum
Group 3: Exploit Contents 18 Number of objects
19 Number of applets
20 Object link length: Maximum
21 Ratio of special character in object links
22 Ratio of vowel character in object links
23 Number of object attributes: Median
24 Applet link length: Minimum
25 Ratio of special character in applet link
26 Ratio of vowel character in applet link
Table 1: Appropriate Features for Identifying Potential Malicious Web Pages
According to our analysis, we select 52 potential features from these main malicious contents. If a feature appears more than once, we use four values to measure it at the first sight: minimum, maximum, mean and median. However, only one measured value for each feature is chosen for scoring algorithm.
Secondly, we use information gain as a measurement method to choose high valuable features only. Information gain for an attribute a is defined as follows:
IG�S, a� � Entropy�S� � ∑ |��||�| � Entropy�S�����
Where S is collection of instances, S� is a subset of S with relevant value v of attribute a. The greater information gain an observed attribute obtains, the higher value it contributes to the process to identify malicious web pages. The training dataset which is used to calculate
information gain must have both malicious and benign instances. There are 26 potential features selected based on information gain (Table 1).
3.2 Scoring Mechanism Our scoring algorithm works based on the concept of
standard score which measure how many standard deviations a value of observed attribute is far from the mean (Carroll and Carroll 2002). Each instance has three types of scores based on three groups of contents of web pages: Foreign content score, script content score and exploit content score.
A group score of instance x is calculated as follows:
�������� � � |� � ! |" ��
Where g is an attribute group which can be foreign content group, script content group or exploit content group; a is an attribute of g; x� is value of attribute a of instance x; δ�is a standard deviation of attribute a which is estimated during training a set of benign instances; µ� is mean of attribute a which is estimated during training a set of benign instances.
The greater score an instance x has in each group, the more likely it is classified as potential malicious class. If T(is chosen as a threshold for content group g in order to identify potential malicious instances, the rule of classification is as follows:
x � ) potentialy malicious if 2g � G: GS(�x� 4 T( otherwise, x is benign 8
Any page will be classified as potential malicious that has a group score greater than the threshold value for that group.
4 Data Collection To get dataset for our experiments, we firstly collect
candidate web pages which include both malicious and benign one. To collect benign web pages, we collect hot search terms from Google Search Engine (Google 2010) and then feed these search terms to Yahoo API websearch (Yahoo 2010) to get top 10 URLs from the search results. In addition, we collect malicious web pages from some of common public announced malware and exploit websites like Blade-defender.org, Clean-mx.de, Paretologic.com, Malwaredomainlist.com. These selected web pages are verified by our Capture-HPC, a high interaction client honeypot (Seifert and Steenson 2009).
Secondly, we create a low interaction client honeypot which interacts with web servers to request for the selected web pages. The HTTP responses from web servers are extracted based on the attributes and their potential values described on Table 1. We totally collect 33646 instances of web pages, including 33422 instances of benign web pages and 224 instances of malicious one.
5 Experiments To evaluate our scoring mechanism, we divide dataset
into two subsets as follows: - Training dataset consists of 20,000 benign
instances and it is used for training scoring algorithm to calculate mean and standard deviation for each attribute.
Proceedings of the Ninth Australasian Information Security Conference (AISC 2011), Perth, Australia
37

- Testing dataset contains 13,646 instances with 13,422 benign instances and 224 malicious one. This dataset is used to test the scoring mechanism.
The experiment is carried in three steps. Firstly, training dataset is fed into our scoring mechanism in order to calculate some statistic values such as mean, standard deviation. Secondly, we calculate group scores for each instance in the testing dataset. Each instance has three types of scores: foreign content score, script content score and exploit content score. Finally, we adjust threshold score values in each group in order to find the relationship between false negative rate and the number of identified potential web pages.
6 Results
Figure 2: The relationship between false negative rate and number of potential malicious web pages.
We use 20,000 instances of benign web pages to train our scoring algorithm and 13646 instances of malicious and benign web pages for testing. To find out the relationship between false negative rate and the number of identified potential malicious web pages, we adjust the value of score threshold in each group and calculate number of negative. The threshold start from the maximum value of each group score, and then reduce to the value corresponded to the percentage of potential malicious web pages. Figure 1 shows the relationship between the number of identified potential malicious web pages and false negative rate. When number of potential malicious increases, false negative rate decreases. Our aim is to minimize the false negative rate, in Figure 1 this is achieved when number of potential malicious web pages reaches 14% of the total number of instances in the testing dataset. In the other word, we can reduce 86% number of suspicious web pages without missing attacks.
7 Conclusion This paper presents a scoring mechanism to estimate
maliciousness of web pages in order to reduce the number of suspicious web pages which need to be analysed by a secondary mechanism such as high-interaction honeypot. The advantages of this scoring mechanism are discussed
as using lightweight static features, capability to make trade-off between number of potential malicious web pages and false negative rate (that is, missing an attack).
Three main groups of malicious contents are identified in this paper. Based on these contents groups, we extracted 52 potential features from both malicious and benign web pages. Information gain is used in order to identify 26 potential features. Each web page has three scores corresponded to three contents groups. Thresholds are chosen for each content group. A web page is classified as potential malicious web pages if it has at least one group score higher than threshold.
The proposed scoring mechanism is initially tested on 13,646 instances with 224 malicious web pages. The result shows that there is capability to make trade-off between number of potential malicious web pages and missing attacks.
This work however has some limitations, which are identified and required for future works. Firstly, a limited number of malicious samples (224 instances) may not present all statistical characteristics of malicious web pages. Secondly, only information gain feature selection method is used in the feature selection process. Other feature selection methods could be investigated in order to have a good comparison. Thirdly, there are three contents groups with three thresholds but the relationship between them in order to form the overall score with only one overall threshold has not identified yet.
References Adam, A. N. & Meledath, D. (2008): Security in web 2.0
application development. Proceedings of the 10th International Conference on Information Integration and Web-based Applications \& Services, Linz, Austria,ACM.
Alme, C. (2008) Web Browsers: An Emerging Platform Under Attack. MCAfee.
Barth, A., Jackson, C. & Mitchell, J. (2009): Securing frame communication in browsers. Commun. ACM, 52: 83-91.
Bin, L., Jianjun, H., Fang, L., Dawei, W., Daxiang, D. & Zhaohui, L. (2009): Malicious Web Pages Detection Based on Abnormal Visibility Recognition. Proc. E-Business and Information System Security, 2009. EBISS '09. International Conference on: 1-5.
Carroll, S. R. & Carroll, D. J. (2002): Statistics made simple for school leaders: data-driven decision making, Scarecrow Press.
Charles, R., John, D., Helen, J. W., Opher, D. & Saher, E. (2007): BrowserShield: Vulnerability-driven filtering of dynamic HTML. ACM Trans. Web, 1: 11.
Chia-Mei, C., Wan-Yi, T. & Hsiao-Chung, L. (2009): Anomaly Behavior Analysis for Web Page Inspection. Proc. Networks and Communications, 2009. NETCOM '09. First International Conference on: 358-363.
Cova, M., Kruegel, C. & Vigna, G. (2010): Detection and Analysis of Drive-by-Download Attacks and Malicious JavaScript Code. Proc. WWW2010, Raleigh NC, USA.
Gargoyle Html Unit, http://htmlunit.sourceforge.net/, Accessed 02/05/2010.
0
0.1
0.2
0.3
0.4
0.5
0.6
0.7
0.8
0.9
1
0% 5% 10% 15% 20%
FNR
CRPIT Volume 116 - Information Security 2011
38

Garrett, B., Travis, H., Micheal, I., Atul, P. & Kevin, B. (2008): Social networks and context-aware spam. Proceedings of the ACM 2008 conference on Computer supported cooperative work, San Diego, CA, USA,ACM.
Gollmann, D. (2008): Securing Web applications. Information Security Technical Report, 13: 1-9.
Google (2010): Google Trends, http://www.google.com/trends/hottrends, Accessed 08/03/2010.
Gyongyi, Z. & Garcia-Molina, H. (2004) Web spam taxonomy. California, Stanford University.
Hou, Y.-T., Chang, Y., Chen, T., Laih, C.-S. & Chen, C.-M. (2009): Malicious web content detection by machine learning. Expert Systems with Applications, In Press, Corrected Proof.
Ikinci, A., Holz, T. & Freiling, F. (2008): Monkey-Spider: Detecting Malicious Websites with Low-Interaction Honeyclients. Proc. Sicherheit, Saarbruecken.
Jianwei, Z., Yonglin, Z., Jinpeng, G., Minghua, W., Xulu, J., Weimin, S. & Yuejin, D. (2007) Malicious websites on the Chinese web: overview and case study. Beijing, Peking University.
Jose, M., Ralf, S., Helen, J. W. & Yi-Min, W. (2007): A Systematic Approach to Uncover Security Flaws in GUI Logic. Proceedings of the 2007 IEEE Symposium on Security and Privacy,IEEE Computer Society.
Keats, S. & Koshy, E. (2009) The Web's Most Dangerous Search Term. McAfee.
Lawton, G. (2007): Web 2.0 Creates Security Challenges. Computer, 40: 13-16.
Liu, P. & Wang, X. (2009): Identification of Malicious Web Pages by Inductive Learning. Proceedings of the International Conference on Web Information Systems and Mining, Shanghai, China,Springer-Verlag.
Ma, J., Saul, L. K., Savage, S. & Voelker, G. M. (2009a): Beyond blacklists: learning to detect malicious web sites from suspicious URLs. Proceedings of the 15th ACM SIGKDD international conference on Knowledge discovery and data mining, Paris, France,ACM.
Ma, J., Saul, L. K., Savage, S. & Voelker, G. M. (2009b): Identifying suspicious URLs: an application of large-scale online learning. Proceedings of the 26th Annual International Conference on Machine Learning, Montreal, Quebec, Canada,ACM.
Mehdi, J. (2007): Some Trends in Web Application Development. 2007 Future of Software Engineering,IEEE Computer Society.
Microsoft (2009) Microsoft Security Intelligence Report. January through June 2009.
Moshchuk, E., Bragin, T., Gribble, S. D. & Levy, H. M. (2006): A crawler-based study of spyware on the Web.
Niels, P., Moheeb Abu, R. & Panayiotis, M. (2009): Cybercrime 2.0: When the Cloud Turns Dark. Queue, 7: 46-47.
Patsakis, C., Asthenidis, A. & Chatzidimitriou, A. (2009): Social Networks as an Attack Platform: Facebook Case
Study. Proc. Networks, 2009. ICN '09. Eighth International Conference on: 245-247.
Provos, N., Mavrommatis, P., Abu, M. & Monrose, R. F. All your iframes point to us. Google Inc, 2008.
Provos, N., McNamee, D., Mavrommatis, P., Wang, K. & Modadugu, A. (2007): The Ghost In The Browser: Analysis of Web-based Malware. Proc. Proceedings of the first USENIX workshop on hot topics in Botnets.
ScanSafe (2009) Annual Global Threat Report. Trends for January 2008 - December 2008.
ScienceDirect (2008): Most malicious web sites are hacked. Network Security, 2008: 1-2.
Seifert, C. (2007a) Improving Detection Accuracy and Speed with Hybrid Client Honeypots,. Wellington, Victoria University of Wellington.
Seifert, C. (2007b): Know Your Enemy: Behind the Scenes of Malicious Web Servers. The Honeynet Project.
Seifert, C. & Steenson, R. (2009): Capture-HPC, https://projects.honeynet.org/capture-hpc/, Accessed 22/02/2010.
Seifert, C., Steenson, R., Holz, T., Yuan, B. & Davis, M. A. (2007): Know Your Enemy: Malicious Web Servers. The Honeynet Project.
Seifert, C., Welch, I. & Komisarczuk, P. (2007): HoneyC - The Low-Interaction Client Honeypot. Proc. NZCSRSC, Hamilton.
Seifert, C., Welch, I. & Komisarczuk, P. (2008): Identification of Malicious Web Pages with Static Heuristics. Proc. Telecommunication Networks and Applications Conference, 2008. ATNAC 2008. Australasian: 91-96.
Shih-Fen, L., Yung-Tsung, H., Chia-Mei, C., Bingchiang, J. & Chi-Sung, L. (2008): Malicious Webpage Detection by Semantics-Aware Reasoning. Proc. Intelligent Systems Design and Applications, 2008. ISDA '08. Eighth International Conference on, 1: 115-120.
Sophos (2009) Security threat report: 2009. Sophos.
Symantic (April 2009) Security Threat Report - Trend for 2008. Volume XIV.
Wang, Y.-M., Beck, D., Jiang, X. & Roussev, R. (2006): Automated Web Patrol with Strider HoneyMonkeys: Finding Web Sites that Exploit Browser Vulnerabilities. IN NDSS.
Websense (2008) State of Internet Security. Q1-Q2. Websense Security Labs.
Websense (2009) State of Internet Security. Q3-Q4. Websense Security Labs.
Xiaoyan, S., Yang, W., Jie, R., Yuefei, Z. & Shengli, L. (2008): Collecting Internet Malware Based on Client-side Honeypot. Proc. Young Computer Scientists, 2008. ICYCS 2008. The 9th International Conference for: 1493-1498.
Yahoo (2010): Web search document for Yahoo!, http://developer.yahoo.com/search/web/V1/webSearch.html, Accessed 08/03/2010.
Proceedings of the Ninth Australasian Information Security Conference (AISC 2011), Perth, Australia
39

CRPIT Volume 116 - Information Security 2011
40

IEEE 802.11 Chipset Fingerprinting by the Measurement of TimingCharacteristics
Guenther Lackner1 Peter Teufl1
1 Institute of Applied Information Processing and Communications (IAIK)University of Technology Graz
Inffeldgasse 16a, 8010 Graz, AUSTRIAEmail: [email protected], [email protected]
Abstract
In this paper we present a technique to create WLANdevice fingerprints by measuring timing propertieswithout the use of special-purpose hardware. Ourproposed process is absolutely passive and cannot bedetected by the targeted device. The timing mea-surement is based on a delay caused by the hardwareimplementation of the CRC checksum algorithm atthe network interface card (NIC) of the client. Thisdelay turned out to be significant for a large numberof different chipset implementations. The ability ofidentifying connected devices could improve the secu-rity of a wireless network significantly. It could helpto enhance access control mechanisms and would de-liver valuable real time information about the con-nected clients. As a proof of our concept we presenta prototype implementation called WiFinger to eval-uate our approach.
Keywords: IEEE 802.11, MAC Address Spoof-ing, passive Chip-set Fingerprinting, Significant His-tograms
1 Introduction
During the last years wireless networking spread intocountless fields of application like mobile telephony,wireless computer networks, mobile sensor networks,and many more. This wireless revolution daily per-vades new areas of our lives providing an increasein the grade of mobility, usability and comfort. Butthere seems to be a price to pay. Due to their open-air propagation nature, wireless networks raise a newvariety of potential security and privacy risks for at-tackers. During the development and definition ofrelated industrial standards there was obviously notenough focus on security issues. Some of the mostpopular and widest spread standards in wireless com-puter communications like WEP (Wireless EquivalentPrivacy) are full of security breaches which open upall gates to attackers (Fluhrer et al. 2001). Furtheron, even state-of-the art standards like WPA2 (Wire-less Protected Access based on AES) begin to crumble(Airtight-Networks 2010).
The aim of our work is to bring more safety intothe wireless world by identifying network participantsvia timing measurements. Our approach focuses onthe widely spread standards of the IEEE 802.11 fam-ily. We do not intend to improve or alter encryp-tion mechanisms. With our tool called WiFinger, one
Copyright c©2011, We want to thank the Austrian ScienceFund(FWF), who supported this work as part of the projectP21936. This paper appeared at the 9th Australasian Infor-mation Security Conference (AISC 2011), Perth, Australia,January 2011. Conferences in Research and Practice in Infor-mation Technology (CRPIT), Vol. 116, Colin Boyd and JosefPieprzyk, Ed. Reproduction for academic, not-for profit pur-poses permitted provided this text is included.
could be able to detect, and in succession preventlayer 2 MAC address spoofing attacks. If unautho-rized participation of attackers in a wireless networkcan be detected many possible attacks could be pre-vented. Our work is based on a technique of passivefingerprint creation by observing the timing behaviorof IEEE 802.11 compliant devices without the neces-sity of special purpose hardware like frequency spec-trum analyzers.This paper is organized as follows. Section 2 intro-duces related work. Section 3 describes our method ofcreating fingerprints of IEEE 802.11 device chipsets.Section 4 introduces the fundamentals of the classifi-cation method developed us, based on Self OrganizingMaps. Section 5 illustrates the design and implemen-tation details of the WiFinger software. The real-world applicability and performance analysis is placedin section 6. Section 7 provides a short outlook on fu-ture extensions and improvements and concludes thearticle.
2 Related Work
A straightforward approach for device identificationis to utilize the device addresses such as the MAC(Media Access Control) address (layer 2) or theassigned IP address (layer 3). This can easilybe achieved by analyzing relevant ARP (AddressResolution Protocol) traffic (Plummer 1982). Unfor-tunately, this approach has a major drawback. Mostdevices allow to modify their assigned MAC addresswith easy to use, free software tools. This problemmight be tackled by creating fingerprints of net-work hardware. This would allow the identificationof any device by observing its external characteristics.
Remote Physical Device Fingerprinting:One of the most significant papers in the field of de-vice fingerprinting has been published by TadayoshiKohno and his team at UC San Diego (Kohno et al.2005). Kohno developed a method to identify remotedevices by exploiting small, microscopic deviationsin the hardware: clock skews. By analyzing thedeviation of TCP or ICMP timestamps over a certainperiod of time it is feasible to distinct differenthardware clocks and thus different devices. The maindifference to our approach is, that Kohno et al. is notapplicable in an encrypted wireless environment as itneeds plaintext TCP or ICMP payloads for analysis.
Radio Frequency Fingerprinting: Thisfingerprinting technique is based on the signalcharacteristics of turn-on transients of wirelesstransceivers. These transients are specific to eachdifferent transceiver and thus are perfectly suitedas data source for fingerprint generation. Transientcapturing and analysis requires a special infrastruc-ture for signal capturing which is expensive and has
Proceedings of the Ninth Australasian Information Security Conference (AISC 2011), Perth, Australia
41

to be operated by experts. Hall et al. evaluated theperformance of the fingerprinting method with 30transceivers. For each transceiver 120 signals werecaptured and used for the performance evaluation.The results indicate that the method is capable ofachieving a very low false positive rate (0% duringthe evaluation) and a high detection accuracy (95%during the evaluation). The biggest disadvantage ofthis method is the special hardware needed for signalcapturing which limits the broad deployment. (Hallet al. 2006)
Passive Data Link Layer Fingerprinting:Franklin et al. (McCoy et al. 2006) identifiedan imprecision in the IEEE 802.11 Media AccessControl specifications that has been interpreteddifferently by wireless NIC firmware developers. Thetime between sending two so called beacon framesused for network detection is not strictly defined.This method is able to classify different firmwareversions instead of the underlying hardware. Forcreating a meaningful fingerprint a large number ofprobe-requests need to be captured. Due to the factthat a NIC willing to join a network, usually justneeds a hand-full of these requests it could take arather long time to obtain a suitable amount of data.Another significant drawback is that fingerprintingmay easily be avoided by using passive-scanning oraltering the device firmware. (McCoy et al. 2006)Some improvements to this approach have beendeveloped by Loh et al. (Desmond et al. 2008).
Active Fingerprinting by Timing Analy-sis: Bartolomiej Siekas work on device fingerprint-ing (Sieka 2006) is probably the one closest related toour approach. It uses the time that elapses betweenthe first acknowledgement is sent and the momentthe authentication response is sent. For classifica-tion purpose, support vector machines are used. Thedrawback of this approach is its limitation to the au-thentication phase for measurements. As this phaseonly occurs during the initialization of the connection,Sieka actively needs to provoke the repetition of it bysending specifically crafted 802.11 frames. This couldbe detected by an intrusion detection system or thedevice to fingerprint, allowing it to counteract. Asthe next section describes, our approach is immuneagainst such countermeasures as it is absolutely pas-sive.
3 Fingerprinting on Layer 2
Creating a fingerprint of a device is the process ofidentifying it by the observation of its external char-acteristics. We developed one possibility of creatingfingerprints of IEEE 802.11 devices by observing theirtiming behavior. This section provides a compactoverview of the basic principles.Our approach examines the timing behavior of IEEE802.11 devices generating so called acknowledge pack-ets (ACK). Due to the fact that IEEE 802.11 stan-dards follow the principle of half-duplex communi-cation, a collision avoidance technique is generallyneeded to be deployed. If a participant A (client) hassent a data frame to participant B (access point), A isnot able to observe if its message was transmitted cor-rectly or collided with a data frame sent from anotherparticipant at the same time. IEEE 802.11 standardsare based on the so called Carrier Sense Multiple Ac-cess with Collision Avoidance (CSMA/CA) mecha-nism (Brenner 1997). In this paper we just shortlydescribe the IEEE 802.11 media access system. Forfurther details consult (IEE 1999) and (Kerry 2007).
To inform A that its data frame was transmitted
Client Access PointFrame 1 Data request
Frame 2 ACK
Frame 3 Data response
ACK
Dela
y
Dela
y
Frame 4 ACK
ACK
Dela
y
Figure 1: ACK delay
correctly, B generates and transmits an ACK packetafter having correctly evaluated the CRC checksumof A’s data frame. If the CRC check fails, no ACKwill be sent and A retransmits the data frame after acertain time (IEE 1999).
FC
Duration
ReceiverAddress CR
C
2 2 6 4
Figure 2: ACK packet
The computing and evaluation of the CRC check-sum plus the generation of the ACK packet takes acertain amount of time. This amount depends onthe hardware implementation of the CRC algorithm,the firmware and some other components of the usedwireless network device. We call this delay The Ac-knowledge Delay. If one regards the distribution ofa certain number of ACK delay values the outcomerepresents a significant property of the used wirelessdevice. This outcome is called Significant Histogram.
Figure 3: Significant Histograms of 400 ACK delayseach, over several time periods t
Based on these Significant Histograms it is possi-
CRPIT Volume 116 - Information Security 2011
42

ble to distinct between different IEEE 802.11 devicechipsets.The classification results in lab environment were verypromising.
4 Classification
This section describes the classification algorithmbased on multiple Self Organizing Maps (SOM) ar-ranged in a tree and implements an extension whichimproves the quality of SOMs when used for super-vised learning.
4.1 SOM based algorithm
Self Organizing Maps (SOM) belong to the broadercategory of neural networks (Kohonen 2001). Theyare mainly used for unsupervised learning and the vi-sualization of high-dimensional data. In this paper weemploy SOMs for a supervised classifier. Although,other supervised algorithms like neural networks orsupport vector machines are better suited for classi-fication tasks, we still focus on the SOM due to onemain reason: The visual representation of the datain a 2D map allows us to quickly gain insight on theanalyzed data (an example is given in Figure 5).
By labeling the SOM units during the training pro-cess according to the class labels of the data they rep-resent, the SOM can also be employed for supervisedlearning. However, due to the unsupervised natureof the SOM, the class information is not taken intoaccount during the training process. Therefore, theaccuracy of the trained model might be inadequate forthe separation of data belonging to different classes.This data is mapped by the same units and leads toclassification errors that decrease the accuracy of theSOM. In order to cope with this issue, our classifierutilizes multiple SOMs arranged in a tree.
Whenever the model of a trained SOM is not pre-cise enough to separate data of different classes ac-curately, we extract this data, train a new SOM onthis data and link the units of the old SOM cov-ering this data to the new SOM. Therefore, we donot need to deal with SOM model complexity manu-ally. If the model of a trained SOM is not accurateenough, the algorithm simply trains a new SOM thatis only trained on the data which requires more com-plex modeling (indicated by a higher misclassificationrate).
The multiple SOMs are trained and arranged in atree according to this algorithm:
1. Train a SOM on the input data
2. Label the units according to the classes they rep-resent
3. Calculate misclassification rates for all classes
4. Extract the data of classes that cannot be sep-arated with an error rate lower than a giventhreshold
5. Mark the units that cover the extracted datato indicate that the actual classification will bemade in the next SOM.
6. Go to step one and train a SOM for new ex-tracted data. Repeat these steps until the errorconditions are met or only two classes remain inone SOM.
A simple example with five classes is shown in Figure4. The first SOM is trained on the complete data setand the misclassification rates are determined. Theexample shows that classes A/B/C and D/E cannot
be separated accurately by the first SOM. Therefore,two data sets for A/B/C and D/E are extracted. Forboth data sets, new SOMs are trained and the unitscorresponding to these classes in the first SOM arelinked to the newly trained SOMs. In case of A/B/C,the second SOM is able to separate the class C fromA/B but the misclassifications rates for A/B are stilltoo high. Therefore, another SOM is trained that in-creases the classification performance. The pictureindicates that the SOM for A/B still has some mis-classification errors, which cannot be removed with-out losing generalization (and thereby overfitting thedata).
The trained SOM hierarchy of SOM tree is usedfor the classification of unknown data in this way:
• Present the data to the root SOM of the tree anddetermine the best matching unit (BMU)
• If the unit is linked to another SOM further downin the hierarchy, load this SOM and go to theprevious step. If the unit is not linked to anotherSOM, return the class label of the unit.
This procedure is indicated in the example by thetwo classification paths for data vectors from class Bend E.
The described strategy is employed for the classi-fication of the WLAN chipsets. The same techniquewas already successfully applied to other classificationproblems, especially for network traffic classification(Payer et al. 2005).For SOM training, the SOM toolbox (Vesanto et al.n.d.) which is available for Matlab R©(MATLAB -The Language of Technical Computing: Mathworks,http://www.mathworks.com n.d.) was used. The clas-sification algorithm was also implemented in the toolWiFinger.
Figure 5: SOM trained with data from three WLANchipsets. The map helps us to gain a quick insighton the analyzed high dimensional data. In this casewe can see at a glance that the ”red” chipset can beclearly separated from the other ones.
Proceedings of the Ninth Australasian Information Security Conference (AISC 2011), Perth, Australia
43

AB
D E
A
B
E
D
C
C
A
B
Classification of data belonging to
class B
Classification of data belonging to
class E
Figure 4: SOM Tree example: The classes A/B/C and D/E cannot be separated within the accepted errorthreshold, therefore two new SOMs are trained for A/B/C data and D/E data. Another SOM is attacheddue to a high number of misclassifications for A/B. The two arrows indicate the paths that are used for theclassification of unknown data.
CRPIT Volume 116 - Information Security 2011
44

4.2 Features
An initial evaluation of WLAN traffic showed us, thatthe ACK delays of different packets vary from WLANchipset to chipset and therefore could be used to iden-tify such chipsets. By analyzing the spectrum of theACK delays of the same chipset we can derive a his-togram that represents the number of packets over thevarious observed delay times. In addition we capturethe packet size in order to find out whether the ACKdelay also depends on the packet size. The packets ofa session – the time frame, where packets of a givenchipset are captured – are arranged in the histogramsin the following way:
1. Collect the ACK delays for each session of trafficgenerated by different WLAN chipsets.
2. For each 50 packets, create a 3D histogram whichstores the frequency of the packets with a spe-cific ACK delay and packet size. Each histogramis converted into a feature vector used for SOMtraining and classification.
3. Train a SOM tree with the histograms of the dif-ferent WLAN chipsets.
4. The trained SOM tree is used for the classifica-tion of new traffic.
The length of the feature vectors depend on thenumber of analyzed ACK delay values (indicated asn) and packet size values (indicated as m). By stor-ing the number of packets for given delay values andpacket sizes we gain a 3D histogram that can be con-verted into a feature vector with f = n×m entries. Inorder to keep the feature vectors at a feasible length,we need to map delay and packet size ranges into sin-gle values. E.g. by considering ACK delay valuesfrom 1 ms to 300 ms (n = 300) and packet size valuesfrom 1 byte to 1600 bytes (m = 1600) we would getfeature vectors with f = 300 × 1600 = 480000 en-tries, which is not feasible. However, this resolutionis not needed and on the contrary would decrease theaccuracy of the classifier. Therefore, we reduce thenumber of features by mapping several ACK delayvalues and packet size values into bins representingvalue ranges. E.g. if we use a bin size of 10 ms forthe ACK delay (then n = 30) and a bin size of 40bytes for the packet size (then m = 40) the featurevector length is reduced to f = 30 × 40 = 1200.
In Figures 6 and 7 two histograms based on delayinformation only (packet size is ignored) are shown.We observe that there is a significant difference be-tween the analyzed chipsets. The role of the packetsize combined with the delay values is visualized inFigures 8 and 9. Here we observer that the ACK de-lay values also depend on the packet size – at leastfor certain chipsets. In Figure 8 the captured data ofthe Agere chipset clearly shows that there is such adependence. In contrast this dependence cannot beobserved when analyzing the Edimax chipset (Figure9).
By integrating both features into the classificationprocess we are able to increase the accuracy comparedto classifiers based on the delay information only. Forfurther details and evaluation results we refer to theresults section.
5 WiFinger
As proof of concept of our approach, a small linuxcommand line utility called WiFinger was developedand implemented in C/C++. The implementationwas kept small in anticipation of possible use on hand-held PCs as passive scanning devices. Additionally to
0 50 100 150 200 250 3000
0.01
0.02
0.03
0.04
0.05
0.06
0.07
0.08
0.09
0.1
time [ms]
rela
tive
occu
renc
e
Figure 6: Delay histogram without packet size for anOrinoco chipset
0 50 100 150 200 250 3000
0.02
0.04
0.06
0.08
0.1
0.12
time [ms]
rela
tive
occu
renc
e
Figure 7: Delay histogram without packet size for aBroadcom chipset
0 5 10 15 20 25 30 35 40 45 500
50
100
150
200
250
300mean value and standard deviation of ACK delay over packet size
packet size (partitions)
ACK
dela
y (m
s)
mean valuestandard deviation
Figure 8: Agere (Chipset 2): Dependency betweenpacket size and ACK delay values
Proceedings of the Ninth Australasian Information Security Conference (AISC 2011), Perth, Australia
45

0 5 10 15 20 25 30 35 40 45 500
50
100
150
200
250
300mean value and standard deviation of ACK delay over packet size
packet size (partitions)
ACK
dela
y (m
s)
mean valuestandard deviation
Figure 9: EdimaxTech (Chipset 6): Here, we cannotobserver a dependency between the packet size andthe ACK delay values
IDLE
CAPTURED DATA FRAME●time:=current time
●mac:=this frame's MAC●payload_size:=this frame's size
CAPTURED ACK OF DATA●save current_time-time
●save mac●save payload_size
else
contains DATA
contains ACK
contains DATA only
else
Capture Frame
Decision
Immediate
Figure 11: WiFinger Feature Measurement FSM
our code just a small number of libraries was used(libpcap1, libSom(Payer et al. 2005) and ncurses).
Two possible modes are provided by the appli-cation. Frames may either be captured live fromthe wireless network or be loaded from a previouscapture-session file in libpcap format. Only the first24 bytes of each IEEE 802.11 frame i.e. only the frameheader bytes are examined. The payload itself playsno role in the classification task but the overall packetsize does because of its influence to the CRC process-ing time. The architecture allows the collection andanalysis of data on distributed devices.
5.1 Data Processing
Figure 10 shows how data is processed by WiFinger.After capturing and feature measurement the mea-sured delay and associated host information is han-dled in two steps. First, the collected data is savedunfiltered onto the hard-disk and converted in a for-mat that could be imported by Matlab R©. Second,the data is filtered and added to the Significant His-togram. Hosts are distinguished by their MAC ad-dress. The accuracy of the Significant Histogram in-creases with time. Per default, classification is runevery 1000 measurements.
5.2 Feature Measurement
Figure 11 illustrates the process of feature measure-ment. Depending on the type of the captured frame,one of three states is entered: IDLE, CAPTUREDDATA FRAME and CAPTURED ACK OF DATA.Recognized types are data frames and frames contain-ing an ACK. During contention free periods, DATAframes can contain contention free acknowledgments,hence referred to as CF-Ack. During these periodsDATA frames with embedded CF-Acks may appearin direct succession of each other. Thus as a spe-cial case, the states LAST FRAME WAS DATA andDATA/ACK PAIR CAPTURED can be entered dur-ing the same pass. MAC addresses are read fromthe frame header’s address 1 field which always con-tains the wireless destination station and the address2 field which always contains the sending wireless sta-tion (IEE 1999). Both fields are 6 bytes long and startat byte 4 and 10 respectively.
The destination station’s MAC address, payloadsize and the time of reception of the latest dataframe are saved in temporary variables. If the frameacknowledges the immediately previously sent datapacket, the acknowledge delay is measured as timebetween the reception of the last data frame and thereception of the acknowledging frame (see Figure 1).Note that interval is longer than the Shortest Inter-Frame Space, since the delay of receiving the dataframe is added.
Measurements on broadcast addresses are dis-carded. Since an ACK frame carries only a desti-nation address (see figure 2), it is possible that on-airdata is missed and a later ACK frame is mistakenfor an expected acknowledgment. To minimize suchmistakes, the sending stations address of the previousdata frame is checked against the destination addressof the following ACK frame. This only works outsideof contention free periods since the destination ad-dress of frames containing CF-Ack does not need tomatch the address of the previously transmitting sta-tion. The following frame types are relevant duringcontention free periods (IEE 1999):
• CF-End + CF-Ack
• Data + CF-Ack
• Data + CF-Ack + CF-Poll
• NoData + CF-Ack
• NoData + CF-Ack + CF-Poll
5.3 Usage of Matlab R©for SOM training
Figure 10 depicts the interaction between WiFingerand Matlab R©. For each host WiFinger writes a sim-ple tab and newline delimited text file. Measurementsexported for use in MatLab R©are not preprocessed byWiFinger. During the experimentation process thisprovided more flexibility in finding the best parame-ters for classification. Like in (Payer et al. 2005) theused scripts produce a SOM-tree which is then auto-matically loaded by WiFinger.
5.4 Usage of libSom for SOM classification
libSom (Payer et al. 2005) provides loading of SOM-trees, datatypes for SOMs and vectors as well as clas-sification functionality. Classification works as de-scribed above in section 4. For each host a SOM-Vector is used to save a histogram of ACK delays.The file somconfig generated by the scripts was ex-tended to save the parameters used in the training ofthe SOM-tree. These are:
1http://www.tcpdump.org/
CRPIT Volume 116 - Information Security 2011
46

IEEE802.11Packet Capturing Feature Measurement MatLab formated Data
Classification
MatLab
MatLabResult
pre-generatedSOM-Tree
Figure 10: WiFinger Dataflow
• minimum
• maximum
• number of subdivisions
for each of the two features, acknowledge delay anddata frame size.
Captured values above the given limits (500ms)are discarded. If the number of values between mini-mum and maximum differ from the number of subdi-vision, values are scaled to fit the chosen resolution.After a variable number of measured ACK delays, acopy of the SOM-Vector is normalized and the result-ing Significant Histogram is classified. Optionally, anumber of measurements can be defined after whichthe histogram is reset.
6 Results
For performance evaluation, the packet size and ACKdelay time was taken from real traffic data withWiFinger. To facilitate this, an Aironet 350 accesspoint was set up with Internet access. Traffic wasmeasured using a 802.11b wireless NIC with Orinocochipset, capable of capturing all layer 2 data in rfmonmode. In turn, six different wireless NICs with knownchipsets were used to generate the traffic. The accesspoint shows up in the classification results as chipset3.
60% of this data was used for the SOM trainingprocess. The remaining test data was used to createsimulated sessions with 500 respectively 1000 packets.This session based classification should give a hint onhow much data from a chipset is needed to get anaccurate classification result. Table 1 gives details onthe evaluated chipsets and the training respectivelytest sets.
training/test data test dataChipset in packets sessions
500/1000 pkts1: Atheros 35105/23404 47/242: Agere 53006/35337 71/363: Aironet 292858/195239 391/1966: RaLink 19265/12843 26/137: BCM4306 149864/99910 200/1008: Intel2100 41390/27594 56/289: PRISM 16076/10714 22/11
Table 1: training/test data sets
For performance evaluation several parameterswere evaluated:
• Number of used features: By using thepacket size information in addition to the ACKdelay time information, the feature space caneasily exceed reasonable boundaries. Thus, theACK delay and packet size information needs tobe grouped. This is done by specifying the num-ber of delay partitions and the number of sizepartitions. A short example explains this group-ing: If the packet size from 1 byte to 1600 bytesand the delay time from 70 ms to 500 ms aretaken into consideration, the size of the featurespace would be 1600 × 430 = 688000. By using40 partitions for the delay time and 40 partitionsfor the packet size, this size can be lowered to40 × 40 = 1600 features. The grouping is doneby mapping 1 byte to 40 bytes to the first fea-ture, 41 bytes to 80 bytes to the second featureand so on. The same procedure is applied to theACK delay information.
• Time/packet size range: These parametersset the range of ACK time delay and packet sizewhich is used for feature generation. For the eval-uation of WiFinger we used a range of 70 ms to500 ms for the delay information and 1 byte to1600 bytes for the size information.
• Histogram size: This parameter is used to setthe number of packets which are used to create ahistogram. For our tests we evaluated a settingof 50 packets per histogram.
• Session size: This parameter is used to createsessions from the test data sets. The evaluationof different sessions sizes gives information abouthow many packets need to be analyzed before anaccurate classification can be made.
• Training factor: This factor is used to separatethe whole data set into training and test data.We used a setting of 0.6 for all tests.
The classification results were obtained in thisway:
• Data was collected with WiFinger for seven dif-ferent chipsets.
• The parameters described above were tuned toevaluate the impact of delay and packet size fea-tures.
• The overall classification results were obtainedby getting the number of correctly classifiedtime/size histograms for the whole test dataset.
Proceedings of the Ninth Australasian Information Security Conference (AISC 2011), Perth, Australia
47

• The dataset was split into sessions with 500 and1000 packets. This should give an indication onhow many packets are needed in order to get anaccurate classification result.
• The combination of delay and packet size fea-tures which gave the best overall results was eval-uated with sessions 500 and 1000 packets.
The first row of Table 2 shows the results whenusing delay information only. Tests from row 2 - 5evaluate the performance of different feature sets andindicate that adding packet size information can sig-nificantly increase the classification performance. Incase of 40 time slots and 40 packet size slots 80% ofall histograms were classified correctly, which is an in-crease in classification accuracy of 64% over the firstversion, which only classifies 51,4% of all histogramscorrectly. These parameters result in a feature vec-tor with 1600 entries, which is quite large. However,row 2 shows, that the classification performance onlydrops slightly when using just 10 features for packetsize. The feature vector size is also reduced to 25%(400 instead of 1600), which is even lower than thefeature vector size used in row 1, where only delayinformation is taken into consideration.
It is necessary to be careful with the number offeatures used for the packet size. As real data isused for SOM training, it is not guaranteed that thisdata has an equal distribution of packet sizes overall chipsets. Thus, by using a too fine resolution forthe packet size (meaning a large feature space), thealgorithm learns to classify the chipsets according tothe packet size.The parameters which gave the best classificationaccuracy (row 5) were used to rerun the experimentwith 500/1000 packets per session. These sessionswere created by using data from the test sets. Theresults of this evaluation can be seen in Table 3 and4.The following conclusions can be drawn from theresults:
• There is only a very small performance increaseif 1000 packets instead of 500 are used per ses-sion. The session size needed for an accurateclassification result depends on the type of an-alyzed data. Generally, increasing the sessionsize increases classification accuracy as noise isreduced.
• Most of the classification errors are made, whenchipsets are classified as chipset 7 (PRISM 3).It seems that this chipset is quite similar to theother ones tested. Furthermore, the training setfor chipset 7 was rather small. As the classifica-tion is based on the hits on the SOM, noise playsa larger role when smaller training sets are used.
1 2 3 4 5 6 71 89,4 0 2,1 8,5 0,0 0,0 0,02 9,9 16,9 0,0 1,4 5,6 28,2 38,03 0,0 0,0 93.6 0,0 6,4 0,0 0,04 0,0 0,0 0,0 34,6 0,0 0,0 65,45 0,0 0,0 0,0 0,0 100,0 0,0 0,06 0,0 3,6 0,0 0,0 0,0 82,1 14,37 0,0 0,0 0,0 0,0 0,0 0 100,0
Table 3: Confusion matrix for 500 packet sessions.E.g. 89,4 % of chipset 1 (in row 1) sessions are clas-sified correctly as chipset 1, 0 % as chipset 2, 2.1 %as chipset 3, etc.
1 2 3 4 5 6 71 95,8 0 4,1 0,0 0,0 0,0 0,02 11,1 13,9 0,0 0,0 5,6 22,2 47,23 0,0 0,0 93.4 0,0 6,6 0,0 0,04 0,0 0,0 0,0 30,8 0,0 0,0 69,25 0,0 0,0 0,0 0,0 100,0 0,0 0,06 0,0 0,0 0,0 0,0 0,0 85,7 14,37 0,0 0,0 0,0 0,0 0,0 0 100,0
Table 4: Confusion matrix for 1000 packet sessions.E.g. 95.8 % of chipset 1 (in row 1) sessions are clas-sified correctly as chipset 1, 0 % as chipset 2, 4.1 %as chipset 3, etc.
7 Conclusion and Future Work
This article describes the possibility of chipset finger-printing based on timing characteristics in wirelessnetworks in IEEE 802.11 standards compliance. Thepresented approach is absolutely passive and thus notdetectable by the fingerprintee or any other party. Allmeasurements are carried out by off-the-shelve low-cost hardware. The approach is resistant against anykind of standardized cryptographic routines like WEPand WPA due to the fact that management framesare not encrypted by these standards. As a proofof concept we implemented a tool called WiFingerto validate our approach in real world scenarios andobtained promising results in identifying single de-vices and chipsets. This paper further on describesthe basics and application of the applied classifica-tion method based on Self Organizing Maps (SOM).
Some improvements are still possible. Beside theoptimization of the feature selection for the ACK de-lay classification, we intend to add an implementa-tion of the fingerprinting approach proposed by JasonFranklin et al. (McCoy et al. 2006) (see section 2 forfurther details) to our software. We plan to integratethe SOM training algorithm into the WiFinger toolwhich would eliminate the time consuming processof exporting/importing the data from/into Matlab R©.This integration allows for a better evaluation by us-ing larger training/test sets with a larger number ofdifferent chipsets and will help to explain why severalof the chipsets cannot be classified with high accu-racy. The next step will then be to use openWRTbased IEEE 802.11 compatible access points for datacollection and a centralized analysis and classificationserver for network wide WLAN MAC spoofing detec-tion. This approach would allow the usage of existingWLAN infrastructure to apply our method.
We further on need to validate if it is possible toclassify different devices with the same chipset. Hard-ware properties like clock skews could render a timingoffset that affects the Significant Histograms and al-
CRPIT Volume 116 - Information Security 2011
48

feature range time size vector resultsslots slots size
70-500 ms (time only) 430 1 430 51,4%70-500 ms, 1-1600 bytes 40 10 400 74,4%
70-500 ms, 1-1600 bytes 10 40 400 69,8%70-500 ms, 1-1600 bytes 20 20 400 68,7%
70-500 ms, 1-1600 bytes 40 40 1600 80,0%
Table 2: Comparing the impact of different features. The results show that the delay information is moreimportant than the packet size. However, adding packet size information increases the classification accuracy.
low their classification.
References
Airtight-Networks (2010), ‘Wpa2 hole196 vulnerabil-ity’, Blackhat DEFCON 18 .URL: http://www.airtightnetworks.com/WPA2-Hole196
Brenner, P. (1997), A technical tutorial on theieee 802.11 protocol, Technical report, BreezeCOMWireless Communications.
Desmond, L. C. C., Yuan, C. C., Pheng, T. C. & Lee,R. S. (2008), Identifying unique devices throughwireless fingerprinting, in ‘WiSec ’08: Proceedingsof the first ACM conference on Wireless networksecurity’, ACM, New York, NY, USA, pp. 46–55.
Fluhrer, S., Mantin, I. & Shamir, A. (2001), Weak-nesses in the key scheduling algorithm of rc4, in‘RC4, Proceedings of the 4th Annual Workshop onSelected Areas of Cryptography’, pp. 1–24.
Hall, J., Barbeau, M. & Kranakis, E. (2006), Radiofrequency fingerprinting for intrusion detection inwireless networks, in ‘IEEE TRANSACTIONS ONDEPENDABLE AND SECURE COMPUTING’.
IEE (1999), IEEE 802.11, 1999 Edition (ISO/IEC8802-11: 1999) IEEE Standards for InformationTechnology Telecommunications and InformationExchange between Systems Local and Metropoli-tan Area Network Specific Requirements Part 11:Wireless LAN Medium Access Control (MAC) andPhysical Layer (PHY) Specifications.
Kerry, S. J. (2007), IEEE Std 802.11-2007 Edition,Part 11: Wireless LAN Medium Access Control(MAC) and Physical Layer (PHY) Specifications,IEEE 802.11 Working Group, Secretary, IEEE-SAStandards Board 445 Hoes Lane Piscataway, NJ08854 USA.
Kohno, T., Broido, A. & Claffy, K. C. (2005), ‘Re-mote physical device fingerprinting’, pp. 211–225.
Kohonen, T. (2001), Self-organizing maps, in ‘vol-ume 30 of Springer Series in Information Sciences’,Springer-Verlag, Berlin.
MATLAB - The Language of Technical Computing:Mathworks, http://www.mathworks.com (n.d.).
McCoy, D., Randwyk, J. V., Tabriz, P., Sicker, D.,Neagoe, V. & Franklin, J. (2006), Passive data linklayer 802.11 wireless device driver fingerprinting,in ‘Proceedings of the 15th conference on USENIXSecurity Symposium - Volume 15’.
Payer, U., Lamberger, M. & Teufl, P. (2005), Trafficclassification using self-organizing maps,, in ‘INC2005 5. International Networking Conference Work-shops, Samos Island, Greece’.
Plummer, D. C. (1982), ‘Rfc 862 - an ethernet addressresolution protocol or converting network protocoladdresses to 48.bit ethernet address for transmis-sion on ethernet hardware’.URL: http://tools.ietf.org/html/rfc826
Sieka, B. (2006), Active fingerprinting of 802.11 de-vices by timing analysis, in ‘Consumer Communi-cations and Networking Conference, 2006. CCNC2006. 3rd IEEE’, Vol. 1, pp. 15 – 19.
Vesanto, Himberg, Alhoniemi & Parhankangas (n.d.),Som toolbox for matlab, technical report a57, Tech-nical report, Helsinki University of Technology.
Proceedings of the Ninth Australasian Information Security Conference (AISC 2011), Perth, Australia
49

CRPIT Volume 116 - Information Security 2011
50

A Modal Logic For Information System Security
Yun Bai1 Khaled M. Khan2
1 School of Computing and MathematicsUniversity of Western Sydney
Locked Bag 1797, Penrith South DCNSW 1797, Australia
Email: [email protected]
2 Department of Computer Science and EngineeringQatar University
QatarEmail: [email protected]
Abstract
As a security mechanism, authorization or access con-trol ensures that all accesses to the system resourcesoccur exclusively according to the access polices andrules specified by the system security agent. Autho-rization specification has been extensively studied anda variety of approaches have been investigated. Inthis paper, we propose a knowledge oriented formallanguage to specify the system security policies andtheir reasoning in response to system resource accessrequest. The semantics of our language is providedby translating our language into epistemic logic pro-gram in which knowledge related modal operators areemployed to represent agents’ knowledge in reasoning.We demonstrate how our authorization language han-dles the situation where the security agent’s knowl-edge on access decision is incomplete.
Keywords: Access Control, Intelligent Systems, For-mal Language, Authorization
1 Introduction
One important mechanism to protect information sys-tem is to control the access to the system resources.Authorization or access control is such a mechanism.It is to ensure that all accesses to the system resourcesoccur exclusively according to the access polices andrules specified by the security agent of the informationsystem. Authorizations or access control has been ex-tensively studied in (Atluri et al. 2002), (Chomickiet al. 2000), (Fernandez et al. 1995), (Zhou et al.2008) etc. and a variety of authorization specificationapproaches such as access matrix (Dacier et al. 1994),(Denning 1976), role-based access control (Cramp-ton et al. 2008), access control in database systems(Bertino et al. 1996), authorization delegation (Mur-ray et al. 2008), procedural and logical specifications(Bai et al. 2003), (Bertino et al. 2003) have been in-
This publication was made possible by a grant from the QatarNational Research Fund under its NPRP Grant No. 09-079-1-013. Its contents are solely the responsibility of the authorsand do not necessarily represent the official views of the QatarNational Research Fund.
Copyright c©2011, Australian Computer Society, Inc. Thispaper appeared at the 9th Australasian Information SecurityConference (AISC 2011), Perth, Australia, January 2011. Con-ferences in Research and Practice in Information Technology(CRPIT), Vol. 116, Colin Boyd and Josef Pieprzyk, Ed. Re-production for academic, not-for-profit purposes permitted pro-vided this text is included.
vestigated. Since logic based approaches provide apowerful expressiveness (Fagin et al. 1995) as well asflexibility for capturing a variety of system securityrequirements, increasing work has been focusing onthis aspect. Jajodia et al (Jajodia et al. 2001) pro-posed a logic language for expressing authorizations.They used predicates and rules to specify the autho-rizations; their work mainly emphasizes the represen-tation and evaluation of authorizations. The work ofBertino et al (Bertino et al. 2000) describes an au-thorization mechanism based on a logic formalism. Itmainly investigates the access control rules and theirderivations. In their recent work (Bertino et al. 2003),a formal approach based on C-Datalog language ispresented for reasoning about access control models.
Nevertheless, there were some limitations so farin these approaches. For instance, when the securityagent does not have complete, specific informationabout the security domain, how to reason and answeraccess queries under such a scenario? For example,the agent currently does not know clearly who canaccess the classified file between Alice and Bob, butknows only one of them can. This can be specifiedby a disjunctive logic program (Baral 2003) as follows:
AliceCanAccessF ile ∨BobCanAccessF ile←,AliceCanAccessF ile← not BobCanAccessF ile,BobCanAccessF ile← not AliceCanAccessF ile.
If a query asks if Alice can read the classifiedfile, the agent will not be able to make the decision,because this program has two different answer sets:{AliceCanAccessF ile} and {BobCanAccessF ile}.In fact, under many circumstances, using disjunctivelogic programming to specify security policies is notsufficient to precisely handle incomplete information.
In this paper, we propose a knowledge based for-mal languages Lk to specify authorization domainwith incomplete information in secure computer sys-tems. We introduce modal logic to specify and reasonabout a security domain then translate the domaininto an epistemic logic program. We show that ourapproach has an expressive power to describe a vari-ety of complex security scenarios.
In our presentation, we assume the existence of asingle, local system security officer or security agentadministering the authorizations. This assumptionenables us to concentrate on a single administeringagent system and hence avoids the problem of co-ordination among multi agents. Access control ina multi-security system or administered by multi-security agents is out of the scope of this paper.
The rest of the paper is organized as follows. Sec-
Proceedings of the Ninth Australasian Information Security Conference (AISC 2011), Perth, Australia
51

tion 2 describes language Lk by outlining its syntaxand gives some authorization policy examples speci-fied by the language. Section 3 explains the seman-tics of language Lk. We start by introducing a gen-eral overview of epistemic logic program, then mapthe domain description specified by Lk into the logicprogram, and we give some examples to show the pro-cess and the domain description and its correspondinglogic program. In section 4, we present a case studyto demonstrate the reasoning of our system. Section5 outlines the implementation issue. Section 6 con-cludes the paper with some remarks.
2 The syntax of a high level language Lk
In this section we define the basic syntax of a highlevel language Lk which embeds a modal operator Kto represent an agent’s knowledge about access con-trol policies.
Language Lk includes the following disjointsorts for subject (S, S1, S2, · · · for the constantsand s, s1, s2, · · · for the variables), group-subject(G,G1, G2, · · · for the constants and g, g1, g2, · · ·for the variables), access-right (A,A1, A2, · · · forthe constants and a, a1, a2, · · · for the variables),group-access-right (GA,GA1, GA2, · · · for the con-stants and ga, ga1, ga2, · · · for the variables), object(O,O1, O2, · · · for the constants and o, o1, o2, · · · forthe variables), group-object (GO,GO1, GO2, · · · forthe constants and go, go1, go2, · · · for the variables)together with predicate symbols holds which takesarguments as subject or group-subject, access-rightor group-access-right and object or group-object re-spectively; ∈ which takes arguments as subject andgroup-subject or access-right and group-access-rightor object and group-object respectively; ⊆ whoseboth arguments are group-subjects, group-access-rights or group-objects and logic connectives ∧ and¬. We also introduce a modal operator K to rep-resent what an agent knows to be true. We useKhold(Sue,Read, F ile) to represent that “it’s be-lieved that Sue can read File”.
In Lk, a subject S has read right to an objectFILE is represented as holds(S, read, FILE). It de-fines an atomic formula of the language. we definea fact f to be an atomic formula or its negation. Aground fact is a fact without variable occurrence. Weview ¬¬f as f . A fact expression φ of Lk is definedas follows: (i) each fact φ is a fact expression; (ii) ifφ and ψ are fact expressions, then φ ∧ ψ and φ ∨ ψare also fact expressions. A ground fact expressionis a fact expression without variable occurrence. Aground fact expression is called a ground instance ofa fact expression if this ground fact expression is ob-tained from the fact expression by replacing each ofits variable occurrence with the same sort constant.A fact expression φ is called conjunctive (or disjunc-tive) if it is of the form φ1 ∧ · · · ∧ φn (or φ1 ∨ · · · ∨ φn
respectively), where each ϕi is a fact.Now we are ready to formally define the proposi-
tions in Lk. An initial proposition in Lk is definedas
initially φ (1)
where φ is either a conjunctive or disjunctive fact ex-pression. That is, φ is of the form φ1 ∧ · · · ∧ φn orφ1 ∨ · · · ∨ φn, where each φi is a fact.
An objective proposition is an expression of theform
φ if ψ with absence γ (2)
where φ is either a conjunctive or disjunctive fact ex-pression, ψ and γ are two conjunctive fact expres-sions.
A subjective proposition is an expression of theform
φ if ψ with absence γ knowing β, (3)
or
φ if ψ with absence γ not knowing β, (4)
where φ is a conjunctive or disjunctive fact expression,and ψ, γ and β are conjunctive fact expressions.
A proposition is called a ground proposition if itdoes not contain variables. A policy domain descrip-tion D in Lk is a finite set of initial propositions,objective propositions and subjective propositions.
In the following, we describe a few complexsecurity scenarios using language Lk, and demon-strate that Lk is an expressive language to representincomplete information, default information, andagents’ knowledge in relation to various accesscontrol situations.
Example 1 The example mentioned in the introduc-tion can be represented by a domain description:
initially holds(Alice,Access, F ile) ∨holds(Bob,Access, F ile),
holds(Alice,Access, F ile) if¬holds(Bob,Access, F ile),
holds(Bob,Access, F ile) if¬holds(Alice,Access, F ile)
Here the initial fact holds(Alice,Access, F ile)∨holds(Bob,Access, F ile) represents an incompleteinformation about Alice and Bob’s access right to thefile.
Example 2 Consider a domain description D con-sists of the following propositions:
initially holds(S,Own,O),holds(S,Write,O) if holds(S,Own,O)
with absence ¬holds(S,Write,O),¬holds(S,Own,O)) if ¬holds(S,Read,O).
This domain description expresses the following poli-cies: initially subject S owns object O. If there is noevidence that S cannot write on O is absent from thedomain, then S has write right on O, and S will nolonger owns O if somehow S cannot read O anymore.Here with absence ¬holds(S,Write,O) representsa default information. As long as there is no clearinformation indicating ¬holds(S,Write,O), it wouldbe assumed that S can write O.
Example 3 Let us look at another example. A policysays that if a subject group G can read file F , then amember S1 of G will be assumed to be able to read Fas well if we don’t know that S1 cannot read F . Thiscan be specified by the following propositions:
initially holds(G,Read, F ),initially S1 ∈ G,holds(S1, Read, F ) if
holds(G,Read, F ), S1 ∈ G,not knowing ¬holds(S1, Read, F )
This example represents a policy involving agent (sub-ject)’s knowledge for making decision. As we willshow next, the semantics of knowledge in Lk will bedefined based on epistemic logic programming.
CRPIT Volume 116 - Information Security 2011
52
3 Semantics of Lk
Given a domain description D, we will translate itinto an epistemic logic program Π(D), then the se-mantics of D will be defined based on the world viewsemantics of program Π(D).
In the following, we first introduce epistemic logicprograms, and then define the semantics of Lk.
3.1 Epistemic logic programs
In this section, we present a general overview on epis-temic logic programs. Gelfond extended the syntaxand semantics of disjunctive logic programs to allowthe correct representation of incomplete informationin the presence of multiple extensions (Gelfond 1994).In epistemic logic programs, the language of (disjunc-tive) extended logic programs is expanded with twomodal operators K and M . KF is read as “F isknown to be true” and MF is read as “F may be be-lieved to be true”. In this paper we will considerpropositional epistemic logic programs where rulescontaining variables are viewed as the set of all groundrules by replacing these variables with all constantsoccurring in the language. The semantics for epis-temic logic programs is defined by the pair (A,W ),where A is a collection of sets of ground literals whichis also simply called is a collection of belief sets, andW is a set in A called the agent’s working set ofbeliefs. The truth of a formula F in (A,W ) is de-noted by (A,W ) |= F and the falsity is denoted by(A,W ) =|F . They are defined as follows.
(A,W ) |= p iff p ∈ W where p is a proposi-tional atom.(A,W ) |= KF iff (A,Wi) |= F for allWi ∈ A.(A,W ) |= MF iff (A,Wi) |= F for someWi ∈ A.(A,W ) |= F ∧ G iff (A,W ) |= F and(A,W ) |= G.(A,W ) |= F or G iff (A,W ) |= ¬(¬F ∧¬G).(A,W ) |= ¬F iff (A,W ) =|F .(A,W ) =|F iff ¬F ∈W where F is a groundatom.(A,W ) =|KF iff (A,W ) 6|= KF 1.(A,W ) =|MF iff (A,W ) 6|= MF .(A,W ) =|F ∧G iff (A,W ) =|F or (A,W ) =|G.(A,W ) =|F or G iff (A,W ) =|F and(A,W ) =|G.
It is worth mentioning that since belief set W al-lows both positive and negative propositional atoms,in Gelfond’s semantics, (A,W ) = | ϕ is notequivalent to (A,W ) 6|= ϕ in general. For in-stance, ({{a, b}}, {a, b}) 6|= c, but we do not have({{a, b}}, {a, b}) = | c (i.e. ({{a, b}}, {a, b}) |= ¬c).Consequently, here K and M are not dual modaloperators here2. Consider A = {{a, b}, {a, b,¬c}}.Clearly we have A |= ¬K¬c. But having A |= Mcseems to be wrong.
If a formula G is of the form KF , ¬KF , MFor ¬MF (where F is a propositional formula), thenits truth value in (A,W ) will not depend on W . Inthis case we call G a subjective formula. If F is apropositional literal, then we call KF , ¬KF , MF ,and ¬MF subjective literals. On the other hand, ifG does not contain K or M , then its truth value in
1We denote (A, W ) 6|= ϕ iff (A, W ) |= ϕ does not hold.2K and M are called dual if ¬K¬ϕ is logically equivalent to
Mϕ.
(A,W ) will only depend onW and we call G an objec-tive formula or objective literal if G is a propositionalliteral. In the case that G is subjective, we simplywrite A |= G instead of (A,W ) |= G, and W |= G in-stead of (A,W ) |= G in the case that G is objective.In general, we simply write A |= G if for each W ∈ A,we have (A,W ) |= G. each A
An epistemic logic program Π is a finite set of rulesof the form:
F ← G1, · · · , Gm, not Gm+1, · · · , not Gn. (5)
In (5), m,n ≥ 0, F is of the form F1 or · · · or Fk
(k ≥ 1) and F1, · · · , Fk are objective literals,G1, · · · , Gm are objective or subjective literals, andGm+1, · · · , Gn are objective literals. For an epistemiclogic program P, its semantics is given by its worldview which is defined in the following steps:
Step 1. Let Π be an epistemic logic program not con-taining modal operators K and M and negation asfailure not. A set W of ground literals is called abelief set of Π iff W is a minimal set of satisfyingconditions: (i) for each rule F ← G1, · · · , Gm fromΠ such that W |= G1 ∧ · · · ∧ Gm we have W |= F ;and (ii) ifW contains a pair of complementary literalsthen W = Lit, i.e. W is an inconsistent belief set3.
Step 2. Let Π be an epistemic logic program notcontaining modal operators K and M and W be aset of ground literals in the language of Π. By ΠW
we denote the result of (i) removing from Π all therules containing formulas of the form not G such thatW |= G and (ii) removing from the rules in Π all otheroccurrences of formulas of the form notG.
Step 3. Finally, let Π be an arbitrary epistemic logicprogram and A a collection of sets of ground literalsin its language. By ΠA we denote the epistemiclogic program obtained from Π by (i) removing fromΠ all rules containing formulas of the form G suchthat G is subjective and A 6|= G, and (ii) removingfrom rules in Π all other occurrences of subjectiveformulas. Now we define that a collection A of setsof ground literals is a world view of Π if A is thecollection of all belief sets of ΠA.
Example 4 Consider a simple epistemic logic pro-gram Π consisting of the following rules:
a ∨ b← ¬Mc,d← Ka,e← b, not e.
Let A = {{a, d}}, then from the above definition, wehave its belief sets ΠA:
a ∨ b←,d←,e← b, not ¬e.
Then it is easy to see that {a, d} is the only answerset of ΠA. So A is a world view of Π. It can be alsoverify that A is the unique world view of Π.
3.2 Translating a domain description into anepistemic logic program
Now we define the semantics of Lk based on the worldview semantics of epistemic logic programs. Let D be
3Note that in our context, a belief set is simply a set of groundliterals. Here a belief set of a program is a belief set that satisfiesthe conditions (i) and (ii).
Proceedings of the Ninth Australasian Information Security Conference (AISC 2011), Perth, Australia
53

a given domain description of Lk, i.e. D is a finiteset of propositions as illustrated in section 2.1. Wespecify an epistemic logic program Π(D) translatedfrom D as follows:
1. For an initial policy proposition (1): initially φ,if φ is a conjunctive fact expression φ1 ∧ · · · ∧φn,then it is translated to a set of rules4:
φ1 ←,· · ·,φn ←,
if φ is a disjunctive fact expression φ1 ∨ · · · ∨ φn,then it is translated to one rule:
φ1 ∨ · · · ∨ φn ←,
2. For each objective access proposition (2): φ if ψwith absence γ, here ψ = ψ1∧· · ·∧ψk and γ =γ1 ∧ · · · ∧ γl, if φ is a conjunctive fact expressionφ1∧· · ·∧φn, then it is translated to a set of rules:
φ1 ← ψ1, · · · , ψk, not γ1, · · · , not γl,· · ·,φn ← ψ1, · · · , ψk, not γ1, · · · , not γl,
if φ is a conjunctive fact expression φ1 ∨ · · · ∨φn,then it is translated to one rule:
φ1 ∨ · · · ∨ φn ← ψ1, · · · , ψk,not γ1, · · · , not γl,
3. For each subjective access proposition (3): φ ifψ with absence γ knowing β, where ψ = ψ1 ∧· · · ∧ ψk, γ = γ1 ∧ · · · ∧ γl, and β = β1 ∧ · · · ∧ βr,if φ is a conjunctive fact expression φ1 ∧ · · · ∧φn,then translate it to a set of rules:
φ1 ← ψ1, · · · , ψk,Kβ1, · · · ,Kβr, not γ1, · · · , not βr,
· · ·,φn ← ψ1, · · · , ψk,
Kβ1, · · · ,Kβr, not γ1, · · · , not βr,
if φ is a disjunctive fact expression φ1 ∨ · · · ∨ φn,then translate it to one rule:
φ1 ∨ · · · ∨ φn ← ψ1, · · · , ψk,Kβ1, · · · ,Kβr, not γ1, · · · , not βr,
4. For each subjective access proposition (4): φ ifψ with absence γ not knowing β, where ψ =ψ1∧· · ·∧ψk, γ = γ1∧· · ·∧γl, and β = β1∧· · ·∧βr,if φ is a conjunctive fact expression φ1 ∧ · · · ∧φn,then translate it to a set of rules:
φ1 ← ψ1, · · · , ψk,¬Kβ1, · · · ,¬Kβr, not γ1, · · · ,
not βr,· · ·,φn ← ψ1, · · · , ψk,¬Kβ1, · · · ,¬Kβr, not γ1, · · · ,
not βr,
if φ is a disjunctive fact expression φ1 ∨ · · · ∨ φn,then translate it to one rule:
φ1 ∨ · · · ∨ φn ← ψ1, · · · , ψk,¬Kβ1, · · · ,¬Kβr, not γ1, · · · , not βr,
4Note that each ϕi is an atom or a negation of an atom.
Now we specify Π(D) to be the collection of all rulestranslated from D by the above procedure. It isnoted that Π(D) is an epistemic logic program with-out modal operator M .
Since positions in D may contain variables, pro-gram Π(D) may also contain variables. In this case, aground epistemic logic program generated from Π(D)by replacing each variable with all possible corre-sponding sort constants occurring in Π(D). With-out much confusion, we may still use notion D(Π) todenote this corresponding ground program.
Definition 1 Let D be a domain description of Lk,Π(D) the epistemic logic program translated from Das described above, and f a ground fact. We say thatD entails f , denoted as D |= f , if Π(D) has a worldview, and for each world view A of Π(D), A |= f .
Example 5 Consider Example 3 presented in section2. According to the above procedure, we can translatethe domain description D as the following programΠ(D):
holds(G,Read, F )←,S1 ∈ G←,holds(S1, Read, F )← holds(G,Read, F ),S1 ∈ G,¬K¬holds(S1, Read, F ).
Now suppose we need to answer a query whetherS1 can read file F , i.e. whether D |=holds(S1, Read, F ). It is not difficult to see thatprogram Π(D) has a unique world view A ={{holds(G,Read, F ), S1 ∈ G,holds(S1, Read, F )}},and A |= holds(S1, Read, F ). So we conclude thatD |= holds(S1, Read, F ).
4 A case study: Reasoning about knowledgein access control
In this section, we demonstrate a case study fromwhich we show that our approach can overcome somedifficulties in the reasoning about access control whenincomplete information is involved.
We consider a typical hospital scenario that doc-tor assistants take responsibility to manage patientsfiles and access relevant files and data from other de-partment. In order to ensure the confidentiality of allpatients’ medical records, a number of authorizationpolicies must be implemented in all departments in ahospital.
Suppose that Hobson is a heart specialist in a hos-pital. He is planning a by-pass surgery for his patientJohn, for that purpose, he needs to review John’s allother recent medical records before the surgery. Al-ice and Sue are the personal assistants of Hobson.Each of them can access doctor Hobson’s all patients’records, while Sue also takes responsibility to requestpatients’ medical records from other departments inthe hospital.
By using our language Lk, we first formalize thegeneral authorization policies across the hospital asfollows:
holds(x,Read,All heart records) if knowing
assistant(x,Hobson), (6)
holds(x,Read, y heart record) if
holds(x,Read,All heart records)
∧patient(y,Hobson), (7)
holds(Hobson,Read, y) if holds(x,Read, y) ∧
assistant(x,Hobson), (8)
CRPIT Volume 116 - Information Security 2011
54

sendRequest(Sue,Read, y) if
request(Hobson, y) with absence
¬sendRequest(Sue,Read, y), (9)
sendRequest(Alice,Read, y) if request(Hobson, y)
with absence sendRequest(Sue,Read, y).(10)
waitingApproval(x,Read, y) if
sendRequest(x,Read, y) ∧
not knowing approved(x,Read, y), (11)
approved(x,Read, y) if
sendRequest(x,Read, y) ∧
assistant(x, d) ∧ specialist(d), (12)
holds(x,Read, y) if approved(x,Read, y). (13)
Let us take a closer look at these rules. Basically, rules(6) and (7) say that if it is known that x is a personalassistant of Doctor Hobson, then x can access (read)Doctor’s all patients’ heart records, and if someone isalready permitted to read all patients’ heart records,and y is a patient of Doctor, then this person canalso read y’s heart record. Note that rule (7) plays arole of inheritance for access control. Also, rule (8)implies the fact that once Doctor Hobson’s assistantx obtains the access read for some patient record fromother department, then Doctor Hobson should havethe access right on this record obviously.
Rule (9) indicates that if Doctor Hobson has arequest of accessing patient y’s record from other de-partments, then usually Sue should send this requestfor approval. Note that this rule is defeasible dueto with absence. For instance, if Sue is on leave,then ¬sendRequest(Sue,Read, y) will be presentedand hence this rule will not be initiated any more.Rule (10) describes the case that Alice will do Sue’sduty when she is not available. On the other hand,rule (11) means that once a request is sent out, it ison the waiting status if no approval from that depart-ment is explicitly informed. Rule (12) states that thecorresponding department will approve the requestsent by x about y’s record if x is a personal assistantof some doctor d who is a registered specialist of thehospital. Finally, rule (13) is quite straightforwardthat if x receives the approval of the department thatholds patient record, x can then access y’s record inthat department.
Now suppose we have the following facts:
initially assistant(Alice,Hobson), (14)
initially assistant(Sue,Hobson), (15)
initially patient(John,Hobson), (16)
initially specialist(Hobson), (17)
initially request(Hobson,
John generalHealth record), (18)
initially ¬sendRequest(Sue,Read,
John generalHealth record), (19)
we would like to know how the access right “Read”for patient John’s general health record can be ob-tained by Doctor Hobson. Let D be the domain de-scription consisting of propositions (6) - (19). Thenapplying our translation procedure described in sec-tion 3.2, we can obtain the following epistemic logicprogram Π(D):
holds(x,Read,All heart records)←Kassistant(x,Hobson),
holds(x,Read, y heart record)←holds(x,Read,All heart records),patient(y,Hobson),
holds(Hobson,Read, y)←holds(x,Read, y), assistant(x,Hobson),
sendRequest(Sue,Read, y)←request(Hobson, y),not ¬sendRequest(Sue,Read, y),
sendRequest(Alice,Read, y)←request(Hobson, y),not sendRequest(Sue,Read, y),
waitingApproval(x,Read, y)←sendRequest(x,Read, y),¬Kapproved(x,Read, y),
approved(x,Read, y)←sendRequest(x,Read, y), assistant(x, d),specialist(d),
holds(x,Read, y)← approved(x,Read, y),assistant(Alice,Hobson)←,assistant(Sue,Hobson)←,patient(John,Hobson)←,specialist(Hobson,H)←,request(Hobson, John generalHealth record)←,¬sendRequest(Sue,Read,
John generalHealth record)←.
It is easy to see that Π(D) has a unique worldview A:{{assistant(Alice,Hobson), assistant(Sue,Hobson),patient(John,Hobson), specialist(Hobson),request(Hobson, John generalHealth record),¬sendRequest(Sue,Read, John generalHealth record)sendRequest(Alice,Read, John generalHealth record),holds(Alice,Read,All heart records)holds(Sue,Read,All heart records),holds(Alice,Read, John heart records)holds(Sue,Read, John heart records),approved(Alice,Read, John generalHealth record)holds(Alice,Read, John generalHealth records)}},
From A we can finally derive that the followingresults:
D |= sendRequest(Alice,Read,John generalHealth record),
D |= approved(Alice,Read,John generalHealth record),
D |= holds(Alice,Read,John generalHealth record),
D |= holds(Hobson,Read,John generalHealth record).
5 The implementation issues
A system for epistemic logic programming has beenimplemented. In this section we briefly outlined ourimplementation of our epistemic logic programmingsystem and explain how our formal language Lk de-veloped in this paper is fulfilled by the system.
The system we implemented is called World ViewsSolver, simply denoted as Wviews. The essential func-tion of Wviews is to compute one or all world views(models) of an input epistemic logic program. To
Proceedings of the Ninth Australasian Information Security Conference (AISC 2011), Perth, Australia
55

compute the world views of an epistemic logic pro-gram Π, Wviews first performs a reduction to trans-form Π into a traditional disjunctive logic program(DLP), then call dlv to compute the answer sets ofΠA. The system structure is outlined as follows5.
Consistency Check
Yes
World View
DLV
DLP ReductionELP
ELP Parser
No
ELP
Figure 1: Wviews system structure.
As we mentioned in section 3, the semantics ofLk is defined in terms of the world view semanticsof epsitemic logic programs. Having system Wviews,we can easily implement our policy language Lk inthe following way: taking the domain description Das the input, which is a finite set of Lk propositions(see section 2), we implement a transformation proce-dure as illustrated in section 3, to translate D into anepistemic logic program Π(D), then by calling systemWviews, we will be able to compute one or all worldviews (models) of Π(D).
6 Conclusion
In this paper, we proposed a formal language Lk tospecify security polices by an authorization domainwith incomplete information. Different from previ-ous policy specification languages, our formal lan-guage Lk has knowledge as its key feature to dealwith incomplete domains. We specified the seman-tics of such knowledge oriented authorization speci-fication language based on the well known the worldview semantics of epistemic logic programs. The ex-amples showed demonstrated that our approach has arich expressive power to describe a variety of complexsecurity requirements. Related semantic and compu-tational properties of epistemic logic programs havebeen studied in (Zhang 2007), which will be help usto fully using the expressive power of epistemic logicprogramming to represent and reason about knowl-edge based authorization policies. This is our currentresearch focus.
References
Atluri, V. & Gal, A. (2002), An authorization modelfor temporal and derived data: securing informa-tion protals, ACM Transactions on Informationand System Security, Vol.5, No.1, pp. 62–94.
Bai, Y. & Varadharajan, V. (2003), On transforma-tion of authorization policies, Data and KnowledgeEngineering, Vol.45, No.3, pp. 333–357.
Baral, C. (2003), Knowledge Representation, Reason-ing, and Declarative Problem Solving, MIT Press.5The system details can be accessed from
http://www.scm.uws.edu.au/ yan/Wviews.html.
Bertino, E., Buccafurri, F., Ferrari, E. & Rullo, P.(2000), A Logic-based Approach for Enforcing Ac-cess Control. Computer Security, Vol.8, No.2-2,pp. 109–140.
Bertino, E., Catania, B., Ferrari, E. & Perlasca, P.(2003), A logical framework for reasoning about ac-cess control models, ACM Transactions on Infor-mation and System Security, Vol.6, No.1, pp. 71–127.
Bertino, E., Jajodia, S & Samarati, P (1996), Sup-porting multiple access control policies in databasesystems, Proceedings of IEEE Symposium on Re-search in Security and Privacy, pp. 94–107.
Chomicki, J., Lobo, J. & Naqvi, S. (2000), A logicalprogramming approach to conflict resolution in pol-icy management, Proceedings of International Con-ference on Principles of Knowledge Representationand Reasoning, pp. 121–132.
Crampton, J. & Khambhammettu, H. (2008), Del-egation in role-based access control. InternationalJournal of Information Security, Vol.7, pp. 123–136.
Dacier, M & Deswarte, Y. (1994), Privilege graph: anextension to the typed access matrix model, Pro-ceedings of European Symposium on Research inComputer Security, pp. 319–334.
Denning, D.E. (1976), A lattice model of secure in-formation flow, Communication of ACM, Vol.19,pp. 236–243.
Fagin, R., Halpern, J.Y., Moses, Y & Vardi, M.Y.(1995), Reasoning about knowledge. MIT Press.
Fernandez, E.B., France, R.B. & Wei, D (1995), Aformal specification of an authorization model forobject-oriented databases, Database Security, IX:Status and Prospects, pp. 95–109.
Gelfond, M., Logic programming and reasoning withincomplete information. Annals of Mathematicsand Artificial Intelligence, Vol.12, pp. 98–116.
Jajodia, S., Samarati, P., Sapino, M.L. & Subrah-manian, V.S. (2001), Flexible support for multi-ple access control policies. ACM Transactions onDatabase Systems, Vol.29, No.2, pp. 214–260, 2001.
Murray, T. & Grove, D. (2008), Non-delegatable au-thorities in capability systems. Journal of Com-puter Security Vol.16, pp. 743–759.
Zhang, Y. (2007), Epistemic reasoning in logic pro-grams. In in ‘Proceedings of the 20th InternationalJoint Conference on Artificial Intelligence (IJCAI-2007)’, pp. 647–652.
Zhou, J. & Alves-Foss, J. (2008), ‘Security policy re-finement and enforcement for the design of multi-level secure systems’, Journal of Computer Secu-rity, Vol.16, pp. 107–131.
CRPIT Volume 116 - Information Security 2011
56

Detection of Fast Flux Service Networks
Scott Campbell Stephen Chan Jason R.Lee
Lawrence Berkeley National LaboratoryNational Energy Research Scientific Computing Center
One Cyclotron RdBerkeley, CA 94720
Email: {scampbell, sychan, jrlee}@lbl.gov
Abstract
Fast Flux Service Networks (FFSN) apply high avail-ability server techniques to the business of malwaredistribution. FFSNs are similar to commercial con-tent distribution networks (CDN), such as Akamai, interms of size, scope, and business model, serving asan outsourced content delivery service for clients. Us-ing an analysis of DNS traffic, we derive a sequentialhypothesis-testing algorithm based entirely on traf-fic characteristics and dynamic white listing to pro-vide real time detection of FFSNs in live traffic. Weimprove on existing work, providing faster and moreaccurate detection of FFSNs. We also investigate acategory of hosts not fully explored in previous detec-tors - Open Content Distribution Networks (OCDN)that share many of the characteristics of FFSNs.
Keywords: Fast Flux, DNS, CDN
1 Introduction
Maintaining high availability and security is a prob-lem faced by all web professionals. For web crimi-nals, this problem is compounded by constant anddetermined adversarial pressure by law enforcement.While sites containing legitimate content can rely onwell-known techniques such as Round Robin DNSor outsourcing their content to Content DistributionNetworks (CDNs), for criminal purposes, these tech-niques are too easy to trace and remove. However,Internet criminals have an advantage that legitimateweb sites do not, a constantly replenished supply ofcompromised hosts
Fast Flux Service Networks (FFSN) take advan-tage of these hosts and the nature of DNS resolutionto rotate domain name resolution across a large poolof compromised hosts. Honeypot (2007) has shownthat the time to live on resource records tends to beshort; often as short as 3 minutes, making it possi-ble for the same client to visit multiple FFSN hostsduring a single session. Since the hosts in a FFSNare targets of security countermeasures, availabilityis maintained by frequently rotating in fresh compro-mised hosts. The simplest type of Fast Flux involvesrotating DNS A records across a pool of addresses,and is known as a Single Flux. A more complex ver-sion, called the Double Flux by Honeypot (2007), ro-tates both NS and A records.
Copyright c©2011, Australian Computer Society, Inc. Thispaper appeared at the 9th Australasian Information SecurityConference (AISC 2011), Perth, Australia, January 2011. Con-ferences in Research and Practice in Information Technology(CRPIT), Vol. 116, Colin Boyd and Josef Pieprzyk, Ed. Re-production for academic, not-for-profit purposes permitted pro-vided this text is included.
There is tremendous utility in near real time iden-tification of FFSN membership. Since content hostedby these networks tends toward illegal scams and mal-ware, any local connections to such networks is wor-thy of note. Knowledge of sites that are involved inFFSN membership may be used to identify compro-mised systems.
Our approach to this problem uses data gatheredfrom our border to drive the selection of an algo-rithm that differentiates between CDN type trafficand FFSN. In Section 3 we observe differences be-tween normal DNS, CDN and FFSN traffic, as wellas CDN and FFSN dynamic behavior in order to char-acterize what we expect a solution should look like.In Section 4 we apply hypothesis testing in the formof TRW for new subnet prefixes for a detection al-gorithm. We find that TRW alone is insufficient tocleanly differentiate CDN and FFSN (as explained inSection 3) but show that dynamic whitelisting shouldaddress this problem. In Section 5 a series of im-plementations are run in parallel to identify the bestgranularity for determining network locality amongIP addresses and to test the results against real traf-fic. The final result is a real time FFSN detector using/12 subnets as discrete units with a low false positiverate can operate on a significant volume of traffic inreal-time.
2 Related Work
In researching Fast Flux networks, we found a num-ber of related works identifying Fast Flux activityfor specific types of content, but none based on sys-tematically analyzing the characteristics of live DNStraffic without relying on outside information sourcessuch as domain registration authorities, except forCaglayan (2009) whom is taking the same approachbut a different detection algorithm. This is the mostsignificant differentiator between our work and othersalong with the actual detection algorithm being de-signed for use on live traffic. The use of the Top 500web site list significantly reduces the variation fromCDN traffic since only the main site name is beinglooked up and not the actual page content.
One of the closest matches to our work on FFSNhost identification was by Holz, et al. (2008). In thispaper a first order approximation is presented to iden-tify Fast Flux networks as well as the notion of fluxi-ness used to differentiate CDNs and FFSNs. Directlyquerying name servers extracted a large volume ofhigh value data for known FFSN hosts, and compar-ing results for web traffic from those servers. Thispaper provided a great deal of theory and methodin particular the use of ASN records for measurementpurposes. The most significant difference between ourwork and Holz et al is our method of characterizing
Proceedings of the Ninth Australasian Information Security Conference (AISC 2011), Perth, Australia
57

flux and the use of lists of known good and bad staticweb pages to generate behavioral traffic.
The work presented in J. Nazario, T. Holz (2008)is strongly derived from Holz, et al. (2008), sharing anumber of tests and fundamental assumptions such asshort TTL, ASN spread and large IP return volume.They look at uncategorized hosts, so it becomes nec-essary to introduce a heuristic to distinguish betweenlegitimate hosts and FFSNs. An interesting additionto this detection heuristic is the use of IP geometry(large distances between returned values) as an in-dicator of possible fluxiness. Significant differencesinclude the use of domain names as atomic units, us-ing spam trap messages as a significant data sourceand having an ad-hoc detection heuristic.
In the work done by Emanuele et. al (2008)for theFluXOR paper a similar mechanism to Holz, et al.(2008) is implemented with the addition of DomainRegistrar information. Many of the same geometrictests are done on individual hostnames (vs. domainsin Holz, et al. (2008)). Data for suspect hosts is pro-vided by the analysis of hostile email content, severelylimiting the exposure of CDN traffic. It is worth not-ing that the distinct class of OCDN networks is iden-tified as an interesting source of false positives. Themost significant difference between this work and oursis that our system uses raw network traffic as a datasource, is designed to have a much shorter detectionwindow, and we do not rely on Domain Registrar sup-plied information.
The final analytical flux analysis looked at is byKonte et al. (2000), and uses email spam as the sourceof potential flux domains. Other similarities with pre-vious works include the use of an aggressive active re-solver and the use of the Alexa Top 500 web site listfor defining non-hostile sites. There seemed to be agreater use of rate of change versus a static geomet-ric interpretation and the implementation of sharinginfrastructure. Many of the differences found in previ-ous papers are also here using suspicious sources likespam for flux candidates, then using active scanningto determine their fluxing characteristics.
The description of Fast Flux networking as de-scribed by the Honeypot (2007)is probably the singlemost cited technical description of Fast Flux tech-niques. While the descriptive nature of the work isstill outstanding, it is mostly qualitative rather thanquantitative. This is by no mean a criticism, but is adifferentiation between it and our work.
In SSAC (2008) a nice overview of Fast Flux tech-nique is provided along with descriptions of miscreantmotivation and the relation of Fast Flux to Phishingand ’Domain Tasting’ (domains that are registered,but are canceled during the Add Grace Period). Thepaper concludes that there is no connection. A sig-nificant part of the paper looks at possible mitigationtechniques as well as how domain name registrationmechanics might be used against Fast Flux networkoperators.
There is a plethora of ongoing work in this field byCaglayan (2009), Kevin (2009), Caglayan (2010) andPawan (2010) that is incorporating many of the ideaspresented in this paper in other hybrid ways. We arenot saying that the work presented here is the finalauthority, but just our perspective on the status ofthis area of work at the time we started our research.
3 Data Analysis
Our initial motivation for working on this problemwas to identify the existence and membership of FF-SNs, and to be able to identify communication with
any member host. To do this we started with a largecorpus of raw DNS traffic and attempted to observeand characterize the behavior of both hostile and non-hostile transactions. Measurements of aggregate ad-dress and A-records characteristics in terms of do-mains, subnets and ASNs lead to a solution, whichseems to maximize detection while minimizing the ef-fects of false positives.
For raw data we examine traffic at a large Nationallaboratory over a period of 48 hours and categorizeit into three major groupings: normal lookups, CDNlookups and FFSN lookups. CDN traffic was identi-fied using publicly available domain lists, FFSN do-mains were manually extracted and confirmed basedon the total number of IP addresses returned overtime and normal traffic was everything else.
3.1 Aggregate Characteristics of A-recordTypes
The first measurement used is the total number of IPaddresses returned over the measurement period fora given A-record. The first time an A-record requestis responded to, a record is made of the IP addressesin the response. This record the entire set of IPaddresses seen is called the base set. Additional re-sponses to other requests for the same A-record arecompared to this set and if any new addresses exist,the new IP event counter is incremented by one forthat A-record entry. In addition, all new IP addressesin the response are added to the A-records base set.For example, if a single DNS request results in 1 newIP address or if it results in 5 new IP addresses, theA-records new IP event counter is only incrementedby one. This process is repeated for the duration ofthe analysis and is similar to what is done in Caglayan(2009).
Table 1: Frequency distribution of new IP addressevents in A record responses over 48 hours
Normal Net CDN Net FFDN NetNew IP # % # % # %
0 262130 99.598 1698 73.9 0 01 881 0.335 316 13.8 5 4.22 124 0.047 96 4.2 7 5.93 19 0.007 63 2.7 3 2.54 8 0.003 81 3.5 7 5.9
5-9 22 0.008 81 3.5 7 5.9≥ 10 5 0.002 3 0.1 94 78.9Total 263189 2297 119
Once a new hostname is seen, we begin activelookups, periodically the sensor polls the hostnameand the results rolled into the observations for thathost. This is not a necessary part of the experiment,but does increase the likelihood of CDN and FFSNdetection particularly with slower traffic flows andnetworks which only return a single IP address foreach query. Active lookup is described in some detailin Section 3.5.
Table 1 shows the frequency distribution for newIP event counts. We loosely group this data by thetype of network, the number of new address events,and the distribution of counts for new IP events.
From Table 1 we see that the vast majority of traf-fic does not exhibit any increment of new IP eventand can effectively be ignored from a detection stand-point. Conversely, the CDN and FFDN types repre-sent a tremendous degree of IP diversity. This is the
CRPIT Volume 116 - Information Security 2011
58

0 50000 100000 150000
050
100
150
200
New /12 Subnet Count vs. Time (sec) for Aggrigate Data
Time (s)
New
Subn
et Co
unt
CDN FFDN
Figure 1: Subnet count versus time, aggregate by type
initial indication that the key to a working algorithmwill be identifying FFDNs and creating a fast andaccurate method for distinguishing them from CDNs.
For the next step we began decreasing the granu-larity of the measurements to see if it is possible totake advantage of organizational structures like ASNnumbers or subnet masks to increase differences be-tween FFDN and CDN sources. We use the termlocality to embody the granularity of these bunchedtogether IP addresses two IP addresses from two dif-ferent organizations is quite different than two ad-dresses from the same ISP. For results in this sectionthere was little change in quantitative results for dif-ferent locality values. Because of this, we chose touse the graphs tied to the /12 subnet prefix since itseemed to provide optimal results in flux detection.
Figure 1 shows the same data set used for Ta-ble 1 and measures the total count of unique sub-nets for CDN and FFDN traffic. Both CDN andFFDN graphs grow rapidly over a short (<20,000sec) time interval, then exhibit different asymptoticbehaviors. The difference in the curves is especiallystriking given that there is an order of magnitudemore CDN than FFDN A-records. We interpret thisas indicating that the pool of subnets representingCDNs has been significantly explored, while subnetsfrom the FFDN pool remains incompletely explored,because it is much larger, or because new hosts arebeing added constantly.
Two approaches immediately come to mind for thealgorithm. The direct approach would be to countthe number of new subnets and identify as FFDNwhen the count passes a reasonable threshold - this isanalogous to the method described in the Holz paper.Another method would be to treat the arrival of eachsubnet as a decision point in a random walk. For thetwo sets, you are more likely to see that a returnedsubnet value is new for a FFDN than a CDN makingfor a natural pair of hypothesis to test. To see whichwill provide better results, we need to look at detailedbehavior for specific A-records.
3.2 Behavior of Individual A-Records
Since the aggregate behavior in Figure 1 obscuresthe variation in individual records, we selected rep-resentative FFDN and CDNs sample records to get aclearer idea about their dynamics. The FFDNs werechosen as representatives of the different types of sub-net distribution counts that we have seen. The CDNswere chosen because they have large subnet rangesand most closely mimic FFDNs (but are quite com-monly seen in day to day live traffic).
The grouping seen in the sets of FFDN records
0 50000 100000 150000
010
2030
4050
60
New /12 Subnet Count vs. Time (sec) for Individual Host Records
Time (s)
New
Subn
et Co
unt
CDN1 CDN2 FFDN1 FFDN2 FFDN3 FFDN4
Figure 2: Subnet counts vs. time for individual host-names
is typical and has been observed by Holz, et al.(2008),Emanuele et. al (2008) and (Konte et al.2000). The most interesting thing from an algorithmdesign perspective is that there are cases where theFFDN are less aggressive at receiving new subnetsin their A-record responses then the CDNs. HereFFDN1 is almost indistinguishable from CDN1, andhas a smaller subnet count than any of the other iden-tified FFDN members. CDN2 and CDN3 have largersubnet counts than FFDN1 the key thing here is thatany subnet counting algorithm that properly matchesFFDN1, will misclassify CDN2 and CDN3 as fast flux.FFDN1 was manually confirmed as a Fast Flux do-main selling performance enhancing pharmaceuticals.FFDN1 is not an edge case, since from Table 1, weknow that 25 other FFDN operate within a range of10 or fewer IP addresses, which is over 20% of thetotal FFDNs examined.
For our mental model of CDN behavior we havea provider with a fairly static set of systems spreadacross multiple locations. These locations are spreadout in terms of geography as well as network topol-ogy, to reduce network latency to the customer and tominimize the problems associated with a network ordata center outage. However, because the servers aremanaged systems with costs associated with operat-ing them, there will only be a fixed number of them,and we would expect some clustering of IPs aroundthe networks at datacenters. If the provider selectsfrom all possible servers to avoid network congestionand increase fault tolerance, the responses to DNS re-quests should be well balanced across this static poolof possibilities. We would expect an initial rapid in-crease in the number of subnets, and then the rate ofnew subnets would decrease once most of the subnetshave been encountered
Our model of FFDN behavior is quite different.The set of compromised systems from which a botnetis created is huge, distributed, and constantly gain-ing and losing members through infection and attri-tion. The network expands via infection, and mayspread into residential broadband networks, businessnetworks or onto vulnerable hosted servers. The bot-net operator has little control over when (and which)systems are added and removed from membership.At any given time only a small number of membersare exposed to a users query. This window of ex-posed systems changes rapidly over time as part ofbehavior to avoid sending requests to systems at riskof being ”cleaned up” or blocked by various securitycountermeasures as noted by Honeypot (2007). Fromthis model, we would expect a similar graph to whatwe see here large swaths of near linear activity fol-
Proceedings of the Ninth Australasian Information Security Conference (AISC 2011), Perth, Australia
59

lowed by a steady reduction in slope. When the setof systems assigned to this activity within the botnetchanges, there will be a new spike in new subnets.
From the data set, it is clear that any algorithmbased on counting distinct prefixes from A-recordlookups will have a tradeoff between a low thresholdvalue ensuring faster detection of FFDNs which willresult in a high false positives for popular CDNs anda high threshold value providing for lower false posi-tives but resulting in high false negatives and longerwait, perhaps on the order of tens of thousands ofseconds, for the algorithm to converge on an answer.Because of this we will be focusing on the randomwalk option instead.
3.3 Overlap within and between CDN andFFDN address pools
Observing subnet overlap within and between theCDN and FFDN subnets provides another way to dis-tinguish between CDN and FFDN A-records. We ex-pect to see some overlap within each of the data sets.For the CDN traffic dataset we would expect localinfrastructure to share some common subnets, whilegrouping of individual A-records in FFDN analysishas been a common indication of shared infrastruc-ture for some time.
From the dataset described in Table 1, therewere 109 discrete subnet prefixes for CDNs, 233 forFFDNs, and 9 shared between them. Bearing in mindthere were 2297 CDN and 119 FFDN hostnames, thisindicates a tremendous amount of overlap of subnetsamong the CDN hosts. Graphing the distribution ofsubnet prefix overlap we see the following:
C
C
C
CC
C
CC
CC
CC
CCC
CCCC CCC
CCC C CCC CC CCC CC C C
0 1 2 3 4 5 6 7
010
2030
4050
60
/12 Prefix Overlap Within FFDN and CDN Data Sets
log(Number of Subnets Sharing a Given Prefix)
Coun
t
F
F
F
F
F
F
F
F
F
F
FF
F
FFF
F
F
FF
F
F
FFF
CDN FFDN
Figure 3: Subnet counts versus time for individualhostnames
The horizontal axis here represents the overlap dis-tribution - for example, the first entry for CDNs indi-cates that for prefixes that were only seen in a singlehostname (unique prefix not shared with any otherhostnames) there were about 32 entries. At the sametime, the long tail on the CDN indicates that there aresubnets shared by hundreds, up to just over a thou-sand A-records. Conversely, a significant proportionof FFDN subnets are unique, with a far smaller tailof shared infrastructure.
The observed distribution hints that using someform of whitelisting for CDN and blacklisting forFFDN address prefixes might be practical. Sincewe have to assume that both types of distributionnetworks have host churn i.e. that systems get re-allocated according to operational needs implement-ing these lists in a static way would not be practical.
3.4 Dynamic Black and White Lists
To take advantage of what appears to be architec-tural differences between subnet overlap in CDN andFFDN networks, we propose using dynamic versionsof white and black listing. The behavior of each ofthese will be quite different and is based on behaviorobserved in Figure 3.
1. Whitelist: When an A-record is tagged as non-fluxing, all of the subnets associated with it areplaced in the whitelist. Any new prefix memberassociated with it after identification are addedto the whitelist as well. Once a prefix is placedon the whitelist, it cant be used as a new prefix influx calculations, which has shown a significanteffect on the TRW calculation. If the prefix is onthe blacklist, it is removed.
2. Blacklist: When an A-record is identified as flux-ing, all of the subnets associated with it areplaced on the blacklist. Any new prefix mem-ber associated with it is added to the black listas well. The effect of being on the blacklist isthat your contribution to the probability ratiocalculation is 25% greater than if not.
For both black and white list members, the ef-fect on the lambda (probability ratio) calculation onlyhappens once per A-record per list member.
For the whitelist we exploit two factors. First asmall number of prefixes seem to be present in a sig-nificant percent of CDN domains. If one of these pre-fixes gets placed on the whitelist (which will happengiven the behavior of the majority of CDN members),it will poison the ability for other CDN related A-records to see enough new prefixes to be marked asfluxing. The second factor is the limitation providedby the shrinking number of new prefixes over time asshown in Figure 1. As the number of new prefixesdecreases over time, it will be increasingly difficult toobserve new prefixes. If a FFDN member gets placedon the whitelist the effect is not pathological sinceit will just be ignored. Further new subnets shoulddrive the calculation of lambda toward the fluxingthreshold.
Being on the black list marks a prefix as beingmore likely to be participating in a fluxing A-record.Since the random walk test is driven off the iden-tification of new subnets for each A-record lookup,this will influence the individual lambda calculationfarther toward fluxing in a shorter time. Our ratio-nalization for this is due principally to shared botnetinfrastructure and common domain members. On theother hand having a CDN member accidentally iden-tified on the black list need not be pathological inthat it will only nudge the hypothesis test for a singleround of calculation.
Note that it is quite difficult for a FFDN holderto play the system such that they can operate in aprotected mode. It is the same predictable behaviorthat creates whitelist membership, which is antithet-ical to how FFDN operate. Also if a FFDN opera-tor gets one or more prefix members in the whitelist,standard flux behavior will still come into play andthe A-record will be tagged as fluxing. Gaming ourimplementation of the algorithm will be covered insignificant detail in Section 4.4 .
3.5 Traffic Multiplier
As described in Emanuele et. al (2008)] one of thesignificant issues detecting FFDN in live traffic is the
CRPIT Volume 116 - Information Security 2011
60

presence of enough hostile traffic for a fluxing host-name to stand out against all the other traffic beingobserved. The small number of lookups that a net-work might see over a small time window exacerbatesthis. In order to address this issue, we created a mech-anism which re-issues A-record queries observed overthe monitored link. The purpose of this is to amplifythe effects of fluxing, which might otherwise fall underthe radar. It is important to stress that this is not amandatory part of the implementation or algorithm.
To address the natural concern of an unintentionaldenial of service attack either on internal or externalsystems, two features are built in. First, during thelifetime of the multiplier lookup session, the initia-tor will ignore any additional A-records of the samename. Second, multiple lookups are done over a setof four increasing time windows. These windows areconfigurable with values of 5, 10, 15, 30 and 60 min-utes being typical.
IP addresses observed by the monitor are recordedin a log file. New addresses incidentally observed butnot associated with a multiplier lookup (i.e. they arepassively observed) are also recorded. As expected,new addresses for a lookup are recorded as well.
4 Algorithm
The heuristic described up till now indicated thatsome sort of Random Walk test might provide betterdetection capability than a simple counting mecha-nism. In this section we put that heuristic into thelanguage of hypothesis testing. The most fundamen-tal notion here is that for two unrelated sets of inde-pendent and identically distributed random variablesA and B with |A|<|B|, the likelihood that you selecta previously unseen set member will be higher for setB than set A.
In Figure 2 we see that the total measured sub-net pool for FFDN networks is larger than for CDNnetworks. Since for random selections the observedrate of new network prefixes depends on the totalsize of each set, we can use the rate of new prefixobservation for testing hypotheses about the type ofnetwork being seen. Sequential hypothesis testing ap-proaches have been used successfully in real time de-tectors Jung et al. (2004), so we apply these sametechnique to observations of new subnet prefixes inDNS responses. We make a simplifying assumptionthat the sequence of random variables representingwhether a subnet prefix has been seen before are in-dependent and identically distributed (iid). The ideathat all the indicator variables are iid may not be aperfect match for the data, but serves as a useful ap-proximation. Even without issues of identical treat-ment introduced by dynamic whitelisting, we believethat there are problems with the idea of independencefor CDN addresses because the addresses returnedare influenced by the DNS load-balancing algorithmused. We will discuss non-independent data elementsin conditional probability ratio tests in the FutureWork section.
4.1 Sequential Hypothesis Testing
From observations outlined in section three, we sug-gest that it is possible to differentiate between FFDNand CDN traffic by observing the occurrence of newsubnets in returned from A-record queries. Here wehave random variables are determined by the presenceor absence of that subnet in the records history. Thistechnique was originally developed by Wald (1947),and further implemented in scan and worm detection
in Jung et al. (2004) and Stuart et al. (2004) whosework we draw heavily on to develop this argument.
When a local host requests resolution of an A-record, one or more IP addresses are returned. Theseaddresses are converted into subnet prefixes which arethen tested to see if they have been previously asso-ciated with this A-record. As in scan detection, weuse a random indicator variable Yi to represent theoutcome of the ith subnet test:
Yi =
{0 if n is even1 if n is odd (1)
For testing we assume two hypotheses. H1 is the hy-pothesis that the A-record under examination is notfluxing, and H0 is the null hypothesis that it is. Asdiscussed above, it is assumed that conditional on hy-pothesis Hj , the random variables Yi|Hi, i = 1,2,3(and hence the returned IP addresses) are indepen-dent and identically distributed. The distribution ofthe random variable Yi can be described as:
Pr[Yi = 0|H0] = θ0, P r[Yi = 1|H0] = 1− θ0
Pr[Yi = 0|H1] = θ1, P r[Yi = 1|H1] = 1− θ1 (2)
Since the likelihood of a new subnet is greater for afluxing host than not, we see θ0 > θ1 . To chosebetween two competing hypotheses, we calculate thelikelihood that the model would generate the observedsequence of events Yn= (Y1, . . . , Yn) under each hy-pothesis. This may be accomplished by maintainingthe ratio Λ(Yn), which is defined by:
Λ(Yn) =Pr[Yn|H1]
Pr[Yn|H0](3)
From the i.i.d. assumptions we can express the ra-tio in terms of the likelihoods of individual events,simplifying the calculation tremendously.
Λ(Yn) ≡n∏i=j
Pr[Yn|H1]
Pr[Yn|H0](4)
The change to Λ(Yn) as a result of the ith observationcan be written as θ(Yi):
φ(Yi) ≡Pr[Yn|H1]
Pr[Yn|H0]=
{θ1θ0
if Yi = 0 (not new)1−θ11−θ0 if Yi = 1 (new)
(5)
The change to Λ(Yn) as a result of the ith observationcan be written as φ(Yi):
Λ(Yn) =n∏i=1
φ(Yi) = Λ(Yn−1)φ(Yn) (6)
starting with Λ(Yn) = 1 . During this iterative series,the value of Λ(Yn) is compared to an upper thresh-old η1 above which the H1 hypothesis is accepted. Ifthe value falls below a second value η0 the H0 hy-pothesis is accepted. For values between thee twothresholds, the results are indeterminate. Our imple-mentation provides the ability to transition betweenthe hypotheses by watching Λ(Yn) after a decision ismade to see if it can be re-assessed, it is possible toaddress the problem of (some) false positives. Upperand lower bounds α and β are defined via PD andPF as α ≥ PF and β ≤ PD. PD is the probability ofcorrect identification and PF being the probability of
Proceedings of the Ninth Australasian Information Security Conference (AISC 2011), Perth, Australia
61

false positive. Typical values for these constants areβ = 0.99 and α = 0.01 . As shown by Wald (1947)the thresholds used to define success for the differenthypothesis tests can be bound in terms of PF and PD.
η1 ≤PDPF
and1− PD1− PF
≤ η0 (7)
By setting the thresholds equal to the bounds inEquation 7, it is possible to express the thresholdsexclusively in terms of the user defined parameters αand β:
η1 ←β
αand η0 ←
1− β1− α
(8)
Since the bounds η0 and η1 work for arbitrary valuesof the thresholds, they will also work for this choice:
β
α≤ PDPF
1− PD1− PF
≤ 1− β1− α
(9)
Taking the reciprocal of the first inequality in Equa-tion 9 and noting that PD must be between 0 and 1,PF <
PF
PD, providing the more convenient expression:
PF <α
β≡ 1
η1(10)
For the second inequality in Equation 9 the result is:
1− PD <1− β1− α
≡ η0 (11)
It is worth noting that η1 may result in a false pos-itive rate above the desired bound by a factor of 1
β .
Similarly the false negative rate may be affected byas much as 1
1−α . This may or may not be significantbased on the user selected values of α and β
4.2 Implementation of Algorithm
For the algorithm implementation we used the Brointrusion detection system, by Paxson et al. (1998),since it provides both high performance and rapidprototyping. We created a series of implementationsdiffering mostly in how address space is partitionedto measure network locality. For subnet prefix basedpartitioning we were able to use native bro function-ality. For the ASN based partitioning we created anew function call based on the publicly available APIlibGeoIP developled by Maxmind (2000).
In order to track single and double flux interac-tions, all A-record and NS-record requests and re-sponses are processed from the network traffic stream.For A-record responses, the record name is associ-ated with the set of addresses in the reply. For re-sponses providing NS record information, the set of A-records within the reply identifying the name serversare recorded as well. The idea here is that by identi-fying fluxing activity in the field of active A-records,then small fast tables can be used to track NS recordchanges that can be used to identify Double Flux.
As an example, once an NS record is identifiedas fluxing for a given domain, all other domains alsousing that same host will be identified as well. Resultsfrom the analyzer look like:
FastFluxDomain ns2.kqimitate.com FastFluxAidentified with following domains:azwhen.cn barelieve.cn bbcarx.cnnybetter.cn nzthan.cn
For the test programs to be able to scale to usefulnumbers (both in terms of time and traffic volume),it is necessary to do reasonably aggressive state main-tenance. By noticing that > 99% of all normal traf-fic did not exhibit fluxing characteristics at all, wedecided that reaping a table entry could take placeafter a time period equal to the TTL value of theA-record or a minimum value. There will be someissues with churn using this method, but it has notproven to be a problem at this time. We realize thatstatic whitelists might be useful in a production envi-ronment, so the functionality is implemented but notused in this version.
4.3 Addressing Algorithmic Vulnerabilitiesin TRW
In Kang et al. (2007) a general attack on the generalclass of positive reward based methods was proposed.A specific example of this attack named z-scan wasdemonstrated for TRW scan detection algorithm. Forz-Scan the attacker can successfully scan an addressspace protected by TRW detection with a number ofhosts proportional to the log of the address space.This represents a huge improvement over a nave at-tacker. A natural question then arises - can this styleof attack be used against our detection algorithm?
By sharing information between the various sys-tems being used to scanning, an attacker can (1) avoidneedless duplication of scanning destination spaceand (2) to share information about good services.This forces an oscillation in the likelihood state ratherthan convergence to a decision of scanner identifica-tion.
While the collusion problem does not pose a signif-icant issue with flux detection, it should be possibleto generate a set of addresses returned from the nameserver in such a way as to always return pairs of iden-tical addresses. For example, rather than returningthe set A1, A2, A3 for an A-record query, you mightreturn A1, A1, A2, A2, A3, A3. This would providethe same effect of eliminating the hypothesis resolu-tion.
By setting a maximum threshold for new prefixesor watching the total count of hypothesis questionsbefore resolution, detecting this attack should be sim-ple enough. Oscillatory behavior is unusual enoughthat alarming on it should be effective.
4.4 Original Holz Implementation and Fur-ther Efficiencies
The original algorithm proposed by Holz, et al. (2008)provided a simple linear expression for determiningthe fluxing behavior of an A-record:
fluxA(nA, nASN ) = 1.32 · nA + 18.54 · nASN (12)
Here the constants are derived via a 10-fold cross val-idation on their corpus of test data, which is usedin defining a hyper-plane between a set of addressesdefined as fast flux and a set of addresses defined asknown good based on the Alexa Top 500 list providedby Alexa (2009) and from the Open Directory Projectby Netscape (2009). Variables nA and nASN repre-sent the number of associated unique A-records andASN numbers for the A-record in question. Whenthe return value of this function exceeds a thresholdvalue, the record in question is assumed to be fluxing.
When Equation 12 is implemented against livetraffic, issues with false positives become quite ap-parent, most likely from the lack of CDN member-ship in the Top 500 list. In order to address this,
CRPIT Volume 116 - Information Security 2011
62

a second equation was proposed in Campbell (2008)which notes that the ratio of nA and nASN providesa way for correcting against large numbers of uniqueIP addresses associated with a small number of ASNs.All other constants and variables retain their originalmeaning.
fluxA(nA, nASN ) =
(nASNnA
)(1.32·nA+18.54·nASN )
(13)The rationale for this change in addressing problemsdifferentiating CDN and FFDN networks was thatCDN infrastructure tends to contain more local re-dundancy than FFDN which must be somewhat ad-hoc. In the Evaluation section it is Equation 13 thatis used for the results rather than Equation 12.
5 Evaluation
In this section the experimental setup, configurationand results are discussed. For developing our method-ology and running initial tests, a series of runs weredone on unfiltered DNS traffic as seen on the bor-der of a large national laboratory consisting of nearly6000 users. These data collections were used to ob-serve long-term behavior of the different DNS recordtypes as well as the usefulness of the traffic multiplierdescribed in 3.5.
Data presented in Section 3 is derived from twotraffic-gathering sessions. The first, used in Table 1,was gathered over a 48-hour period in December 2008.The data for the remainder of subsections was takenfrom a 48-hour period in January 2009. The onlysignificant difference is the settings of the traffic mul-tiplier mechanism. For the first sample we re-issuedqueries at periods of 5 min, 1 hour, 24 hours and 36hours. For the second sample the lookup times weremore aggressive at 5 min, 30 min, 30 min, 30 min.
For the actual evaluation the same configurationwas used except that the data was from three 12-hourintervals. The rationale for using three different in-tervals was not only to stress a shorter time windowfor the detection scenarios, but also to have differenttraffic profiles (day vs. night, different days) in or-der to exercise the different strengths and weaknessesof the various implementations. In order to providea source of true positives to test against, a list ofknown FFDN domains was queried during the timethat the detectors were running. To ensure this didnot bias the results, an equal number of CDN hostswere resolved at the same time. The CDN list is cho-sen from the most aggressive examples extracted fromdata gathered for Section 3.1.
5.1 Variation of Test Cases and Network Seg-mentation
To identify the most effective form of address parti-tioning for locality, we looked at a number of options.From Holz, et al. (2008) we started with a routingabstraction - the Autonomous System Unit (ASN).An ASN is a set of local subnets abstracted togetherin an efficient data structure to exchange local IP in-formation with other entities on the Internet to helpthem make routing decisions. Details can be found inRFC1935 by Bates (1996). This seems like a naturalunit for analysis in that an ASN follows logical busi-ness order rather than subnet boundaries. Multiplesubnets can be represented by a single ASN, providingsome notion of order not based on strict sub-netting.In addition to segmenting on ASN boundaries, we alsoexplored using a variety of subnet prefixes.
In total we created five different analyzers based ondiffering segmentation and behaviors using dynamicwhitelisting in all cases. These types using the newTRW analyzer are: ASN with and without dynamicblacklisting, and subnet prefixes on /8, /12 and /16boundaries, additionally we used Equation 13, this isdescribed in detail in Campbell (2008).
5.2 Determination of θ0 and θ1
For our hypothesis testing, the most significant pa-rameters describe the likelihood that a prefix willbe new for a fluxing (FFDN) or not fluxing (CDN)lookup. There is a tension here since if the CDN valueis too low, then aggressive CDN behavior will be mis-classified as flux like behavior, while if it is too highthen actual fluxing behavior will be misidentified.
To estimate the values, we took a set of knownFFDN and CDN hosts and ran them through a re-solver every 5 minutes for two days. In both casesthe list of hosts was generated from known FFDN listsArbor (2008) and our own records. The initial valuesof θ1 were calculated from the value of repeat/totalprefixes for each of the observed records in the CDNdata set, then averaged over all records. For θ0 wedid the same using known FFDN data.
In terms of repeatability we have concerns aboutthe accuracy of the estimated values. For θ0 there issome leeway for low values, as FFDN tend to be some-what aggressive in their initial behavior. θ1 needs tostrike the balance between a value that is too low(driving up the instance of false positives) and toohigh (which will decrease the number of identifiedCDN records).
5.3 Test Results
As previously described, the series of trials took placeover three 12 hour intervals on live traffic with all an-alyzers seeing the same traffic. This section evaluatesthe performance of the new detection algorithm look-ing at both false positive and false negative results.
In each case, the number referred to as ’test cases’is the number of true positives injected into live net-work traffic. In several instances the number of iden-tified FFDN hosts was higher than maximum truepositive value due to additional fast flux activity onthe network. To correct for this, identified FFDNhosts were compared against the test case list andany additional activity is not reported.
For Table 2, each of the larger columns (for exam-ple /8 Subnet) contain three smaller columns whichare the three different test scenarios
From these results we think that the most accurateversion of the algorithm in this series of tests was the/12 subnet prefix. This was principally due to the lowfalse negative values in conjunction with our thoughtson the false positive numbers discussed below.
There were a number of interesting things we ob-served which should be pointed out. For previous runsof the ASN and modified Holz (Equation. 13) we hadseen a somewhat different distribution of true andfalse positives. In these cases, no additional seedingof representative FFDN or CDN records took place.From this perspective, the results are somewhat arti-ficial but represent the best way to measure false pos-itive and negative given such a large corpus of data.
Another point of interest was why the /12 net-works provided a lower number of false positives thanthe ASN based analysis. Using ASNs seemed like anatural unit, as boundaries tend to follow businessand routing lines, providing a type of metadata. Our
Proceedings of the Ninth Australasian Information Security Conference (AISC 2011), Perth, Australia
63

Table 2: Comparison of Algorithms Across 3 Runs
True False False TestPos Pos Neg Cases
ASN w/ Blacklist50 25 5 5553 30 7 6048 28 3 51
ASN no Blacklist50 17 5 5553 22 7 6048 22 3 51
/810 5 45 5526 1 34 6013 2 38 51
/1255 16 0 5552 6 8 6051 9 0 51
/1655 62 0 5559 26 1 6050 42 1 51
Modified Holz50 5 5 5552 3 8 6048 5 3 51
initial mental model was that for the sort of nearrandom distribution expected for the IP addressesof compromised systems, there would be as wide (orwider) a distribution of ASN values than subnet val-ues.
Examining sample false positives is revealing inunderstanding where the model fails. For the hostcsp.nyc3.verisign.com we get at a list of returned ad-dresses and the associated ASNs that look like:
199.7.48.72 AS36617 VeriSign, Inc199.7.50.72 AS36619 VeriSign, Inc....199.7.59.72 AS36628 VeriSign, Inc199.7.71.72 AS36622 VeriSign, Inc216.168.253.58 AS7342 VeriSign, Inc
Here we ended up with a block of address space bro-ken into small chunks, each of which have a largenumber of ASNs, this was unexpected.
The second interesting thing to look at was thefailure of the dynamic black listing. Given the degreeof overlap in FFDN networks, we expected better re-sults. Our working hypothesis is that the same effectsthat are making problems for the ASN based algo-rithm are poisoning the blacklist with false positives.Since we are interested in using this capacity, it willwarrant further investigation.
5.4 False Positive Consistencies
Looking at consistencies within the sets of false posi-tives, we noticed a number of systems not falling intothe normal categories defined by the taxonomy westarted with. Our initial notion of host types is de-scribed in Table 1: all DNS traffic can be split intoFFDN, CDN and everything else types with every-thing else being uninteresting. Looking closer at theeverything group, there is a outlier set of hosts whichreturned a large number of subnet prefixes yet werenot represented by our classification of CDN or FFSNtypes.
On closer investigation we identified a common-ality between this group and the set of hosts con-sistently causing false positives for the entire groupof detection algorithms. This set of hosts is usedto disseminate information or services (as opposed
to content) and typically involve significant user in-volvement. For the environment we ran the tests inthe most common lookups of this sort are from thentp.org, freenet.org and planetlab.org domains. Wechose to identify these systems as Open Content Dis-tribution Networks (OCDN).
The distinction between OCDN and CDN systemsis based on function and how the system membersare distributed. Typically the members of OCDNsare composed of volunteer companies, schools or indi-vidual users hosting some sort of information service.This distribution of membership creates the same sortof network non-locality seen in FFSN systems.
6 Future Work
There is a great deal more work that needs to be donein this area. One of the most useful directions will bethe development of a corpus of tools and algorithmsthat can be applied to non-independent probabilityratios. There are a small number of example problemsfrom other domains, which provide an excellent placeto begin. Xiong has a number of articles Xong (1995),Tan (1995) relating to Clinical Trials that would be agood place to start. A different approach can also befound in Blazek (2001). Additionally using some toolsfrom the botnet community would help is definingsignatures as in Giroire (2009).
Resolving problems around implanting reliable dy-namic blacklisting should be interesting. A new tech-nique known as Footprint Index in Honeypot (2007)and Emanuele et. al (2008) has also been shown tohave a very low degree of false positives and shouldbe examined as a possible technique to couple withthe work here to increase the overall effectiveness ofthis algorithm.
7 Summary
The literature on identifying Fast Flux Service Net-works has generally been derived from examiningstatic lists of known CDN and Fast Flux domainsto arrive at an algorithm Honeypot (2007) and Holz,et al. (2008), or extracting a list of suspicious hostsfrom content related to illicit activities and applyingsome heuristic for FFSN identification Emanuele et.al (2008), J. Nazario, T. Holz (2008) and Konte et al.(2000). These approaches gloss over the CDN net-works that appear in live DNS traffic, which tend togenerate either high false positives or high false neg-atives in algorithms such as proposed by Holz, et al.(2008). Approaches based on heuristics or manualinspection are useful for forensic analysis, but inap-propriate for automated, real time detectors. Newerand more mature methods such as Caglayan (2010)have appeared recently that tackle this problem andcomplement the work here.
Our approach addresses the gap in the literature,by providing a real time, live traffic Fast Flux de-tector that successfully handles false positives fromlarge CDNs. The TRW detection algorithm allowsus to ask the questions; Is this Fast Flux? Is thisnot Fast Flux?, after every response to a DNS query.The detector converges on a response based on therelative likelihood of each hypothesis. This work issimilar to ongoing work in Kevin (2009) which has arelated model.
After a comparison of different methods to quan-tify network locality for FFSN detection, we find thatthe first 12 bits of a hosts IP address is more effec-tive than ASNs or other subnet masks. We have also
CRPIT Volume 116 - Information Security 2011
64

demonstrated dynamic whitelisting of subnets as a vi-able mean of reducing false positives, due to the highdegree of overlap among CDN network prefixes. Oncethe whitelists have been populated through observingnetwork traffic, the detector is able to accurately iden-tify Fast Flux hosts that have been queried via DNS,typically within seconds or 10s of seconds of the ini-tial query. In addition to providing insight into theDNS patterns of CDN and FFSN hosts, the detectoris a useful tool in operational computer security, ben-efiting both researchers and practitioners in the fieldof computer security.
References
The Honeynet Project, Know Your Enemy:Fast-Flux Service Networks, July 2007.http://www.honeynet.org/papers/ff
Measuring and Detecting Fast-Flux Service Networks.In Proceedings of the 15th Annual Network andDistributed System Security Symposium (NDSS),2008.
J. Nazario, T. Holz. As the net churns: Fast-flux bot-net observations. International Conference on Ma-licious and Unwanted Software, 2008. MALWARE2008
Emanuele Passerini, Roberto Paleari, Lorenzo Mar-tignoni, and Danilo Bruschi. Fluxor: detecting andmonitoring fast-flux service networks. In Proceed-ings of the 5th Conference on Detection of In-trusions and Malware & Vulnerability Assessment,DIMVA, Paris, France, Lecture Notes in ComputerScience. Springer, July 2008.
M. Konte, N. Feamster, J. Jung. Fast Flux ServiceNetworks: Dynamics and Roles in Hosting OnlineScams.
Abraham Wald, Sequential Analysis. J. Wiley & Sons,New York 1947.
J. Jung, V. Paxson, A. Berger, and H. Balakrishnan,Fast Portscan Detection Using Sequential Hypoth-esis Testing, Proc. IEEE Symposium on Securityand Privacy, May 2004.
Stuart E. Schechter, Jaeyeon Jung, Arthur W. Berger.Fast Detection of Scanning Worm Infections. InProceedings of the 7 th International Symposiumon Recent Advances in Intrusion Detection (RAID)2004.
V. Paxson, Bro: A System for Detecting NetworkIntruders in Real-Time. Proceedings of the 7thUSENIX Security Symposium, San Antonio, TX,January 1998.
MaxMind. IP to ASN mapping Database.http://www.maxmind.com/app/asnum
M. G. Kang, J. Caballero, D. Song. Distributed Eva-sive Scan Techniques and Countermeasures. Pro-ceedings of the 4th international conference on De-tection of Intrusions and Malware, and Vulnerabil-ity Assessment, 2007, Lucerne Switzerland
Alexa, the Web Information Company. Global Top500 Sites, January 2009. http://alexa.com/
Netscape Communications Corporation. ODP - OpenDirectory Project. http://dmoz.org, 2009
Detection and Analysis of Fast Flux Service Net-works, Scott Campbell, Steve Chan Paper for CS294-28 Class at Cal, Spring 2008
T. Bates, J. Hawkinson. Guidelines for creation, selec-tion and registration of Autonomous System (AS)RFC1935,BBN Planret, MCI. March 1996
Arbor Networks, ATLAS Project 2008
Xong, X. A Class of Sequential Conditional Probabil-ity Ratio Tests, Journal of the American StatisticalAssociation, 90, (In Press, Dec Issue, 1995).
Min Tan, Xiaoping Xiong. Continuous and Group Se-quential Probability Ratio Tests For Phase II Clin-ical Trials. Department of Biostatistics and Epi-demiology. 1995
R. Blazek, K. Hongjoong, B. Rozovskii, A. Tar-takovsky. A novel approach to detection of denial-of-service attacks via adaptive sequential andbatch-sequential change-point detection methods.Proceedings of the 2001 IEEE Workshop on Infor-mation Assurence and Security, West point, 2001.
The Security and Stability Advisory CommitteeSSAC of ICANN, ”SAC025, SSAC Advisoryon Fast Flux Hosting and DNS” January, 2008,http://www.icann.org/committees/security/sac025.pdf
Caglayan, A., Toothaker, M., Drapeau, D., Burke,D. and Eaton, G. Real Time Detection of FastFlux Service Networks , Cybersecurity Applica-tions and Technologies Conference for HomelandSecurity (CATCH 2009), Washington, DC, March3, 2009
D. Kevin McGrath, Andrew J. Kalafut, and Mi-naxi Gupta. ”Phishing Infrastructure Fluxes Allthe Way, IEEE Security and Privacy Magazine’sspecial issue on DNS Security 2009.
Pawan Prakash, Manish Kumar, Ramana Rao Kom-pella, and Minaxi Gupta. PhishNet: PredictiveBlacklisting to Detect Phishing Attacks IEEE In-focom Mini-Conference 2010.
Alper Caglayan, Mike Toothaker, Dan Drapaeau,Dustin Burke, Gerry Eaton, ”Behavioral Patternsof Fast Flux Service Networks,” Hawaii Interna-tional Conference on System Sciences, pp. 1-9, 201043rd Hawaii International Conference on SystemSciences, 2010.
F Giroire, F, Chandrashekar, J.,Taft N., Schooler E.and Dina Papagiannaki ”Exploiting Temporal Per-sistence to Detect Covert Botnet Channels”, IntelResearch2 and CNRS, France 2009
Proceedings of the Ninth Australasian Information Security Conference (AISC 2011), Perth, Australia
65

CRPIT Volume 116 - Information Security 2011
66

Development and Evaluation of a Secure, Privacy Preserving
Combinatorial Auction
Ben Palmer Kris Bubendorfer Ian Welch
School of Engineering and Computer ScienceVictoria University Wellington,
PO Box 600, Wellington, New Zealand 6140,Email: {Ben,Kris,Ian}@ecs.vuw.ac.nz
Abstract
The use of electronic auctions as a means of tradinggoods has increased year after year. eBay has gonefrom half a million registered users in 1998 to 88 mil-lion today. Businesses have also shown interest inusing auctions. However, the traditional single goodauction as used by eBay lacks the required ability toexpress dependencies between goods in complex pro-curement auctions leading to risky bidding strategiesand sub optimal allocations. The use of combinatorialauctions, where bidders can place bids on combina-tions of goods, allows bidders to take advantage of anydependencies and auctioneers to generate optimal al-locations of goods. In this paper we introduce a newalgorithm for creating a combinatorial auction circuitthat can be used to compute the result of a combina-torial auction by any garbled circuit auction protocol.In an electronic auction bids from competing partiesare commercially sensitive information as bidders willnot want their competitors finding out the value theyplace on a given item. Therefore, there has been con-siderable research into auction protocols that protectknowledge of all bids except the winning bid fromeveryone, including the auctioneer. The Garbled Cir-cuit (GC) protocol as described by Naor, Pinkas andSumner is an example of such an auction. However, ithas only been used to provide privacy for single goodauctions rather than combinatorial auctions and hasbeen considered impractical for realistically sized auc-tions due to the protocol’s communication overheads.Using our algorithm for creating combinatorial auc-tion circuits, the GC protocol can conduct combinato-rial auction while keeping losing bid values secret. Wehave also conducted performance measurements onboth the computation and communication overheadof the GC protocol using our combinatorial auctioncircuit. These experiments show that the commu-nication overhead is low enough to allow its use forrealistically sized auctions (6MB for an auction with3 goods, a maximum price of 16, and 100 bidders).Keywords: E-Commerce, Distributed Systems, Secu-rity.
1 Introduction
Electronic markets such as eBay and Trade Me havechanged the way people buy and sell goods online.eBay and Trade Me support fixed price (the buy nowbutton) and standard auctions using an open out-cry English auction protocol. Through the use of
Copyright c©2011, Australian Computer Society, Inc. Thispaper appeared at the 9th Australasian Information SecurityConference (AISC 2011), Perth, Australia, January 2011. Con-ferences in Research and Practice in Information Technology(CRPIT), Vol. 116, Colin Boyd and Josef Pieprzyk, Ed. Re-production for academic, not-for profit purposes permitted pro-vided this text is included.
such web-based auction services, auctions have be-come an understood and accepted way for people totrade goods.
A combinatorial auction differs from a normal auc-tion by permitting bidders to express a preference formore than a single good. An arbitrary collection ofitems defined by the bidder, can have a combinedvalue greater than the sum of the individual items.Bids can be made that are conditional upon obtainingthe entire set of desired items. As a simple example,consider a real estate auction, where three adjacentlots (A,B and C) are up for sale. The developer ofa retail centre needs a minimum of 2 adjacent lots.If this was treated as 3 separate auctions, the valueof lot B (to the developer) would be greater than Aor C as winning A or C without B would have novalue. The various bidder strategies in this auctionare complex, involve risk, and are dependent on theorder of the auctions due to the dependencies betweenthe lots. The inability of the single good auction toexpress such dependencies can lead to sub optimalallocations. A combinatorial auction permits biddersto express these dependencies and thereby enable theauction to result in optimal allocations of goods tobidders.
Garbled circuits are a software technique first pre-sented by Yao (Yao 1982) as a solution to the Mil-lionaire’s Problem, in which two millionaires wish todetermine who is richer – without revealing their ac-tual wealth to the other. A garbled circuit involvesthe creation of a set of Boolean gates in software tocompute a function, and then the garbling of the cir-cuit to obfuscate the input and intermediate values,but still allow execution of the function. The principleidea of a garbled circuit is to act as a replacement forthe trusted party in transactions between mutuallydistrustful parties.
Trust is a concept that we humans implicitly un-derstand, but have difficulty in applying this under-standing digitally. Trust takes into account the roleof the entity, the degree of potential loss and some-times prior experience or experience of those trustedby you. However, trust can be misplaced, and thedegree of risk underestimated. A trusted entity isnot necessarily trustworthy. This applies to electronicauctions in particular, as the social mechanisms thatenforce trustworthy behaviour in traditional auctionsare missing.
Imagine the following scenario from (Bubendorferet al. 2009). Bob and Jane have surplus resourcesand wish to sell these resources via Alice, their auc-tioneer. The auction is a sealed bid reverse auction(or tender), where clients issue requests for resourcesand resource providers bid (and compete) to supplythem. Alice’s auction house is hosted using resourcesprovided by Sam. When a client submits a resourcerequest to Alice, Alice creates an auction and adver-tises the new auction to Bob and Jane. Bob and Jane
Proceedings of the Ninth Australasian Information Security Conference (AISC 2011), Perth, Australia
67

respond by submitting their bids to Alice. At the endof the auction, Alice examines the bids and declaresthe winner of the auction.
In this scenario bid privacy can be compromised ina number of ways. Alice can freely examine the bidsfrom Bob and Jane. She can then leak this informa-tion to others giving them a competitive advantage.Sam could also obtain this information directly fromthe memory allocated to Alice, or if it were encrypted,extract Alice’s key from memory. If Alice or Sam werealso resource providers, then the incentive to cheat isconsiderable.
One way to solve these problems is to ensure thatbids are kept private, that is, hidden from Alice andSam. At first it seems that this is impossible, as Alicewould be unable to compute the winner of the auc-tion. However, we can utilise garbled circuits thatenable Alice to compute the outcome of the auction,without revealing anything other than the winner andthe price paid. The most notable single good garbledcircuit auction protocol that utilises this solution isby Naor, Pinkas and Sumner (Naor et al. 1999), othergarbled circuit auction protocols include (Jakobsson& Juels 2000, Baudron & Stern 2001, Kurosawa &Ogata 2002). There are no existing auction protocolsthat utilise this solution for combinatorial auctions.
The contribution of this paper is the creation ofa novel algorithm to construct combinatorial auctioncircuits. The resulting circuit is then used to computethe results of a combinatorial auction when given thenumber of goods, bidders, and the maximum price.Our combinatorial auction circuit can be used withany single good privacy preserving auction protocol,based on garbled circuits (Naor et al. 1999, Jakobsson& Juels 2000, Baudron & Stern 2001), to extend it forcombinatorial auctions. This is the first example ofa combinatorial auction circuit to appear in the liter-ature and we present the circuit and the algorithmsused to generate it.
A criticism that is often levelled at garbled cir-cuits is the communication overhead caused by thegarbled circuit that is sent from the auction issuer tothe auctioneer (Yokoo & Suzuki 2004, 2002, Perriget al. 2001). Even the creators of the garbled circuitauction protocol state that:
As for the communication overhead, the ta-bles that code the circuit can be sent fromthe AI to the auctioneer in advance, beforethe auction begins, possibly on a CD-ROMor DVD (Naor et al. 1999).
The above quote suggests that it may not be fea-sible to transmit an auction circuit over a network.However, we can show empirically that that it isindeed feasible and this is the case even for mul-tiple good combinatorial auctions. We have imple-mented the garbled circuit auction protocol by Naorand Pinkas (Naor et al. 1999) and the Verifiable ProxyOblivious Transfer (VPOT) protocol (Juels & Szydlo2003) introduced by Juels and Szydlo to fix a problemwith the original garbled circuits auction protocol. Noperformance results have been published for the gar-bled circuit auction protocol using VPOT before thiswork. Finally we compare the performance of thisprotocol with another well known privacy preserv-ing combinatorial auction protocol based on thresholdtrust.
2 Related Work
There are two main approaches used to ensure the pri-vacy of bidder valuations; threshold trust (Franklin &Reiter 1995, Yokoo & Suzuki 2002, Suzuki & Yokoo
2002, Harkavy et al. 1998, Peng et al. 2002, Buben-dorfer & Thomson 2006) and two party trust (Lipmaaet al. 2002, Naor et al. 1999, Juels & Szydlo 2003,Cachin 1999, Kikuchi 2001). In threshold trust, theco-operation of some quorum of hosts is required toreconstruct a bid. Threshold trust is secure as longas the quorum of honest hosts can be met. To imple-ment threshold trust, different protocols have useddifferent techniques. A threshold El-Gamal homo-morphic crypto system has been used to allow com-putation on encrypted bids while needing a quorumof hosts to decrypt the bids (Yokoo & Suzuki 2002).This homomorphic auction protocol is able to con-duct combinatorial auctions. Polynomial secret shar-ing has also been used (Kikuchi 2001) and extendedto conduct combinatorial auctions (Suzuki & Yokoo2002). Threshold trust has been criticised for requir-ing a heterogeneous collection of hosts from differentorganisations willing to commit computing resourcesto host an auction (Lipmaa et al. 2002). It is easierto find two parties from separate organisations will-ing to conduct an auction for two party trust than tofind a larger group of parties to conduct an auctionusing threshold trust.
Two party trust relies on a symmetric separationof duty between two parties with the information be-ing kept private as long as the two parties do notcollude. Garbled circuits are a two party trust proto-col (Naor et al. 1999, Juels & Szydlo 2003) that usesan auctioneer and an auction issuer as the two parties.Garbled circuits preserve the communication patternof traditional auctions in that bidders just send in-formation to the auctioneer, and only the auctioneersends information to the auction issuer. The biddersin a garbled circuit auction do not have to encryptbid values, which can be computationally expensiveif the bidders are low power devices. The VPOT pro-tocol addresses a security flaw in the original garbledcircuit auction protocol by replacing the proxy oblivi-ous transfer protocol with a verifiable proxy oblivioustransfer protocol.
A novel auction protocol has been developed wherean auctioneer uses a third party to obliviously com-pare bid values (Cachin 1999) . In this protocol one ofthe parties learns a partial ordering of the bids, andif the other party colludes with a bidder, then thatbidder could see all the comparisons.
A similar auction protocol to garbled circuits thatdoes not use an auction issuer but where instead bid-ders perform the role of the auction issuer has alsobeen developed (Baudron & Stern 2001). Unfortu-nately this protocol is restricted to five or six biddersin real world situations and a malicious auctioneercould collude with a bidder to break the assumptionsof the protocol.
3 A Combinatorial Auction Circuit
A circuit is a network of Boolean gates with a set of in-puts, a set of intermediate gates, and a set of outputsgates. Figure 1 shows a simple worked example of anauction circuit. This circuit can compute the result ofan auction with one good, two bidders and uses twobits to represent the prices. The inputs to the circuitare the 2-bit bids from the two bidders. The outputsof the circuit are two Boolean values that indicatewhether bidder one or bidder two was the winner anda 2-bit value that is the maximum (winning) price. Inour example, when presented with the input values inthe figure, bidder one bids 10 and bidder two bids 11,the circuit computes that bidder two wins the auctionwith a maximum price of 11. As a further examplelet’s change the inputs, and keep the same circuit.Bidder one now bids 10 and bidder two now bids 01.
CRPIT Volume 116 - Information Security 2011
68
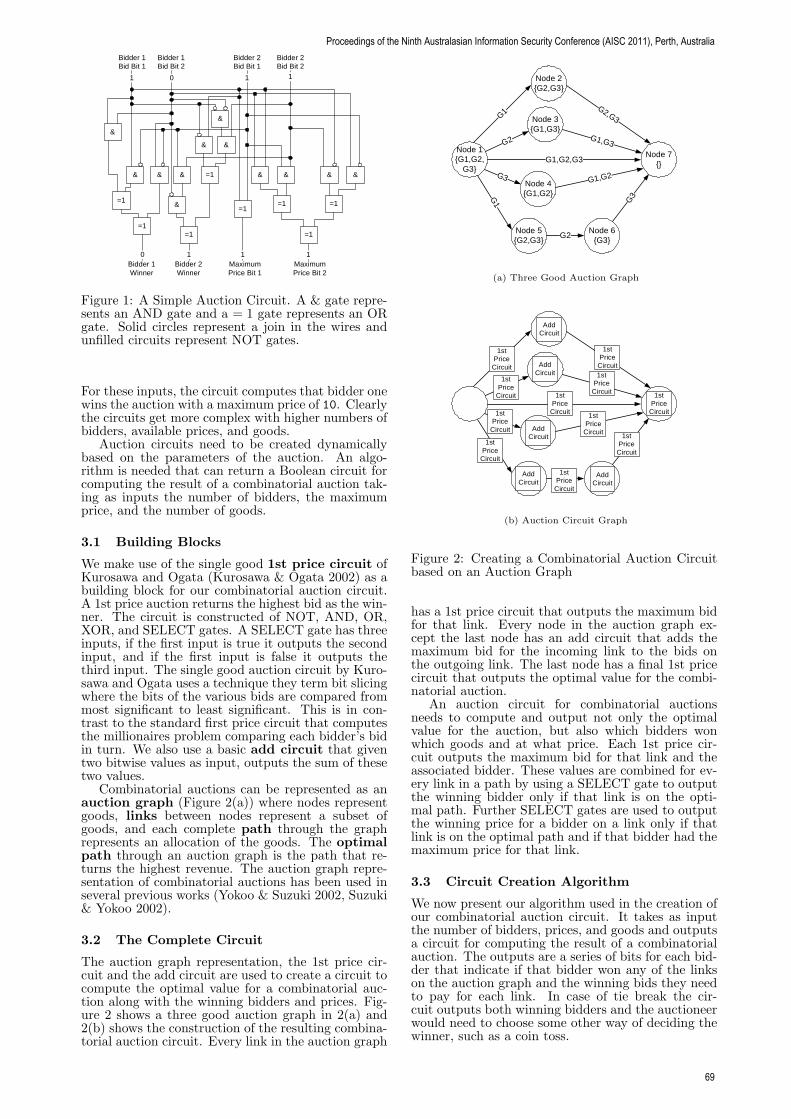
Bidder 1Bid Bit 1
Bidder 1Bid Bit 2
Bidder 2Bid Bit 1
Bidder 2Bid Bit 2
&
=1
=1 =1
&&&
=1
&
=1
& & &
&
& &
=1
=1
&=1
Bidder 1Winner
Bidder 2Winner
MaximumPrice Bit 1
MaximumPrice Bit 2
1 1 10
1 1 10
Figure 1: A Simple Auction Circuit. A & gate repre-sents an AND gate and a = 1 gate represents an ORgate. Solid circles represent a join in the wires andunfilled circuits represent NOT gates.
For these inputs, the circuit computes that bidder onewins the auction with a maximum price of 10. Clearlythe circuits get more complex with higher numbers ofbidders, available prices, and goods.
Auction circuits need to be created dynamicallybased on the parameters of the auction. An algo-rithm is needed that can return a Boolean circuit forcomputing the result of a combinatorial auction tak-ing as inputs the number of bidders, the maximumprice, and the number of goods.
3.1 Building Blocks
We make use of the single good 1st price circuit ofKurosawa and Ogata (Kurosawa & Ogata 2002) as abuilding block for our combinatorial auction circuit.A 1st price auction returns the highest bid as the win-ner. The circuit is constructed of NOT, AND, OR,XOR, and SELECT gates. A SELECT gate has threeinputs, if the first input is true it outputs the secondinput, and if the first input is false it outputs thethird input. The single good auction circuit by Kuro-sawa and Ogata uses a technique they term bit slicingwhere the bits of the various bids are compared frommost significant to least significant. This is in con-trast to the standard first price circuit that computesthe millionaires problem comparing each bidder’s bidin turn. We also use a basic add circuit that giventwo bitwise values as input, outputs the sum of thesetwo values.
Combinatorial auctions can be represented as anauction graph (Figure 2(a)) where nodes representgoods, links between nodes represent a subset ofgoods, and each complete path through the graphrepresents an allocation of the goods. The optimalpath through an auction graph is the path that re-turns the highest revenue. The auction graph repre-sentation of combinatorial auctions has been used inseveral previous works (Yokoo & Suzuki 2002, Suzuki& Yokoo 2002).
3.2 The Complete Circuit
The auction graph representation, the 1st price cir-cuit and the add circuit are used to create a circuit tocompute the optimal value for a combinatorial auc-tion along with the winning bidders and prices. Fig-ure 2 shows a three good auction graph in 2(a) and2(b) shows the construction of the resulting combina-torial auction circuit. Every link in the auction graph
Node 1{G1,G2,
G3}
Node 7{}
Node 2{G2,G3}
Node 3{G1,G3}
Node 5{G2,G3}
Node 6{G3}
G1G2,G3
G1,G2,G3
G2 G1,G3
Node 4{G1,G2}
G3 G1,G2
G1
G2
G3
(a) Three Good Auction Graph
G1G2,G3
G2 G1,G3
G3
G1
G2
G3
AddCircuit
1st Price
Circuit1st
Price Circuit1st
Price Circuit
1st Price
Circuit
1st Price
Circuit
1st Price
Circuit
1st Price
Circuit
1st Price
Circuit
1st Price
Circuit
AddCircuit
AddCircuit
AddCircuit
AddCircuit
1st Price
Circuit1st Price
Circuit
(b) Auction Circuit Graph
Figure 2: Creating a Combinatorial Auction Circuitbased on an Auction Graph
has a 1st price circuit that outputs the maximum bidfor that link. Every node in the auction graph ex-cept the last node has an add circuit that adds themaximum bid for the incoming link to the bids onthe outgoing link. The last node has a final 1st pricecircuit that outputs the optimal value for the combi-natorial auction.
An auction circuit for combinatorial auctionsneeds to compute and output not only the optimalvalue for the auction, but also which bidders wonwhich goods and at what price. Each 1st price cir-cuit outputs the maximum bid for that link and theassociated bidder. These values are combined for ev-ery link in a path by using a SELECT gate to outputthe winning bidder only if that link is on the opti-mal path. Further SELECT gates are used to outputthe winning price for a bidder on a link only if thatlink is on the optimal path and if that bidder had themaximum price for that link.
3.3 Circuit Creation Algorithm
We now present our algorithm used in the creation ofour combinatorial auction circuit. It takes as inputthe number of bidders, prices, and goods and outputsa circuit for computing the result of a combinatorialauction. The outputs are a series of bits for each bid-der that indicate if that bidder won any of the linkson the auction graph and the winning bids they needto pay for each link. In case of tie break the cir-cuit outputs both winning bidders and the auctioneerwould need to choose some other way of deciding thewinner, such as a coin toss.
Proceedings of the Ninth Australasian Information Security Conference (AISC 2011), Perth, Australia
69

Algorithm 1 is the main algorithm used in thecreation of the circuit. The algorithm is split in totwo parts. The first part calculates the optimal paththrough the auction graph by calculating the maxi-mum bid for each link in the graph, adding togetherthe maximum bids for each path, and then calculat-ing the optimal path based on the maximum bids foreach path. The second part of the algorithm calcu-lates the winning bidders and prices using SELECTgates for each bidder and every link and path in theauction graph.
Algorithm 1Procedure CreateCombinatorialAuctionCircuitInput: nBidders, nPrices, nGoodsOutput: AuctionCircuit AC1. (∗ Create the Auction Graph ∗)2. AuctionGraph Graph ← CreateAuction-
Graph(nGoods)3. (∗ Loop Through All Paths ∗)4. for Paths i ∈ Graph5. (∗ Loop Through Links on Path ∗)6. for Links j ∈ i7. Create 1st Price Circuit with in-
puts of the bids for link j8. (∗ Get the Max Bid for Path i ∗)9. if Number Links on Path i > 1)10. for Links j ∈ i11. AddOutputs(j,j+1,AC)12. (∗ find the optimal path ∗)13. Create 1st Price Circuit with Inputs of the Final
Add Circuits For Each Path14. (∗ Now find what bidders won for what price ∗)15. (∗ Loop Through All Bidders ∗)16. for Bidder i ∈ nBidders17. (∗ Loop Through All Paths ∗)18. for Paths j ∈ Graph19. (∗ Loop Through Links on
Path ∗)20. for Links k ∈ j21. WinningBiddersPrices
(i,j,k,nPrices,AC)22. return AC
Algorithm 2 is a helper method that is used to addthe outputs of the 1st Price Circuit for each link in apath together to get the maximum price for a path inthe auction graph. These maximum prices for eachpath are then compared in the final 1st Price Circuitthat outputs the optimal path for an auction.
Algorithm 2Procedure AddOutputsInput: Link j, Link j + 1, AuctionCircuit AC1. if (j is the first link in the path)2. Create Add Circuit with inputs of the
maximum bids for link j and j + 13. else4. Create Add Circuit with inputs of the
maximum bids for link j+1 and the out-put of the previous Add Circuit
Algorithm 3 is executed for every bidder and everylink in every path of the graph. The first SELECTgate outputs the winning bidder of the 1st Price Cir-cuit for this link in the auction graph provided thelink is on the optimal path. The second two SELECTgates output the winning price of the 1st Price Circuitfor this bidder and link in the auction graph providedthe path is on the optimal path and this bidder wasthe winner of the link.
Algorithm 3Procedure WinningBiddersPricesInput: Bidder i, Path j, Link k, nPrices, Auction-
Circuit AC
Auctioneer
Auction Issuer
B idde r
B idde r
B idderC lien t
Figure 3: Garbled Circuit Parties
1. (∗ Creates gate to work out the winning biddersand prices for this link in the graph ∗)
2. Create a SELECT gate with 3 inputs. The firstinput is the output of the final 1st Price Circuitfor path j, the second input is the output of the1st Price Circuit for bidder i and link k, and thethird input is the output of the final 1st PriceCircuit for path j
3. for m < nPrices4. Create a SELECT gate with 3 inputs.
The first input is the output of the final1st Price Circuit for path j, the secondinput is the winning price for link k atprice m, and the third input is the out-put of the final 1st Price Circuit for pathj
5. Create a SELECT gate with 3 inputs.The first input is the output of the 1stPrice Circuit for bidder i and link k, thesecond input is the previous SELECTnode, and the third input is the outputof the 1st Price Circuit for bidder i andlink k
4 Garbled Circuits Auction Protocol
A garbled circuit is a Boolean circuit for computingthe result of some function that has been obfuscatedby one party to hide the input and intermediate val-ues of the gates of the circuit. When presented witha garbled circuit any party can calculate the resultof the function when provided with the garbled inputvalues to the circuit and an output mapping fromgarbled outputs to the actual output of the origi-nal circuit. In the garbled circuit auction protocol,a Boolean circuit is created that outputs the result ofthe auction (Naor et al. 1999). This circuit is thengarbled by a party known as the auction issuer andsent to the auctioneer. Using the garbled circuit cre-ated by the auction issuer, the auctioneer is then ableto compute the result of the auction after discoveringthe garbled inputs of the garbled circuit. As long asthe auction issuer does not reveal a set of random val-ues it used when garbling the circuit, the input andintermediate values remain hidden from the auction-eer. The verifiable proxy oblivious transfer (VPOT)protocol (Juels & Szydlo 2003) addresses a securityflaw in the original garbled circuit auction protocolwhere the auction issuer could change bids withoutdetection. Figure 3 shows the parties in the garbledcircuits auction protocol. The bidders and the clientonly need to have a connection to the auctioneer, andthe auctioneer is the only party that needs a connec-tion to the auction issuer.
The basic steps of a Sealed-Bid auction using thegarbled circuit protocol are:
CRPIT Volume 116 - Information Security 2011
70

• The client contacts the auctioneer with details ofthe auction they wish to run.
• The auctioneer advertises details of the auctionincluding the number of goods, number of prices,and the auction issuer being used.
• The auction issuer constructs a garbled circuitfor the auction based on how many bidders,goods, and the number of bits in the price as wellas a mapping from garbled outputs to outputs.
• The auction issuer sends the garbled circuit andoutput mapping to the auctioneer.
• The auction issuer, auctioneer, and bidders use aprotocol called verifiable proxy oblivious transfer(VPOT) which results in the auctioneer learningthe garbled values of the inputs, and the auctionissuer and bidders learning no new information.
• The auctioneer executes the garbled circuit usingthe garbled input and decodes the output usingthe output mapping sent by the auction issuer.
More details of the garbled circuit auction proto-col, including the algorithms used, can be found inthe Appendix.
4.1 Security
The security of the garbled circuit auction protocolcomes from the garbling of the circuit that is done bythe auction issuer. This garbled circuit is then sentto the auctioneer to execute. As long as the auctionissuer does not collude with the auctioneer losing bidvalues are kept secret. During the garbling of the cir-cuit, each wire connecting the nodes in the circuit isassigned a randomly generated value and a randomlygenerated permutation of the values of the wire thatis used to create the garbled value of the wire. A gatetable is then created for each node in the circuit thatmaps the garbled input of the node to the garbledoutput. A publicly known random function is used tocreate the gate table ensuring that knowledge of onecombination of the garbled inputs of a node does notreveal the other garbled outputs. The VPOT proto-col is then executed by the bidders, auctioneer, andthe auction issuer after which the auctioneer learnsthe garbled inputs of the circuit and can execute thecircuit to find the garbled outputs. A mapping isprovided by the auction issuer that maps the garbledoutputs of the circuit to the actual output. Parties inthe garbled circuit auction protocol are assumed tobe passive adversaries, although in the original paperverification techniques are discussed which can extendthe garbled circuit auction protocol to handle activeadversaries. A more detailed security analysis of thegarbled circuit auction protocol can be found in theoriginal paper (Naor et al. 1999), and a the paper pre-senting the VPOT protocol contains a detailed anal-ysis of the security of VPOT (Juels & Szydlo 2003).
5 Circuit Size
As stated in the introduction, one of the main criti-cisms of the garbled circuit auction protocol is the sizeof the garbled circuit, which is composed of gate ta-bles and an output mapping, that has to be sent fromthe auction issuer to the auctioneer. Even the cre-ators of the garbled circuit auction protocol suggestsending the gate tables on a CD-ROM or DVD (Naoret al. 1999). In order to investigate these claims, inthis section we quantify the size of the gate tablesfor different combinatorial auctions. We first inves-tigate the complexity of the circuit before providingexperimental results on the size of the circuit.
Figure 4: Circuit Size vs Number of Bidders
5.1 Complexity
Table 1 shows the upper bound on the number ofgates used in our combinatorial auction circuit whereg is the number of goods, b the number of bidders,and p the bits in the price. There are 2g possibleunique combinations of goods. There are Bg possibleunique allocations of the g goods where Bg is the BellNumber for the number of goods. For every allocationthere can be at most g links in the graph so we assumethere are g links for every allocation.
The largest factor influencing the size of the circuitis the number of goods g. Increasing the number ofbidders b results in a linear growth in the number ofnodes in the circuit. Increasing the number of bits inthe price p results in a linear increase in the size ofthe circuit and an exponential increase in the numberof available prices. More available prices mean thatbids can be more finely expressed – increasing thebid granularity of the auction protocol. For example,with p = 4 there are 16 = 24 available prices but withp = 5 there are 32 = 25 possible prices. When thenumber of goods g is increased, the total number ofnodes in the auction circuit increases exponentially.When the number of goods is increased linearly thenumber of possible combinations of goods increasesexponentially as there are 2g possible combinationsof goods.
5.2 Experimental Results
To calculate the size of the garbled circuit, we havetaken the number of two input gates in the combina-torial auction circuit and multiplied them by 4 andthen by 128. This is because for every two input gatethere are 4 entries in the gate table and every entryis 128 bits. The size of the output mapping is not in-cluded in this calculation, but is significantly smallerthan the size of the gate tables. We have quantifiedthe size of the garbled circuit in respect to the numberof bidders, number of goods, and the number of bitsin the price. Other than the variable under test, thedefault parameters selected were ten bidders, threegoods, and four bits in the price (for a maximum bidof sixteen).
Figure 4 shows the size of the garbled circuit in-creasing linearly as the number of bidders increases.
The size of the garbled circuit is proportional toln(maximum bid) as shown in Figure 5.
Figure 6 shows the size of the garbled circuit(shown on a logarithmic scale) increasing exponen-tially as the number of goods increases.
The size of the garbled circuits in these tests wouldnot require a CD or DVD to be sent from the auc-tion issuer to the auctioneer and could be sent overthe network. For example, an auction with 3 goods,a maximum bid of 16, and 100 bidders has a garbled
Proceedings of the Ninth Australasian Information Security Conference (AISC 2011), Perth, Australia
71

No. of Input Nodes 2gbpNo. of Output Nodes b(p+ (2gp))No. of AND Nodes 2Bggp(b+ 1)No. of OR Nodes Bgbg(1 + p) +Bggp(b+ 1)
No. of SELECT Nodes Bgbg(2p+ 1) +BgbgpNo. of XOR Nodes 2Bggp
Total No. of Nodes 2g+1bp+Bggp(4b+ 5) +Bgbg(3p+ 2) + bp
Table 1: Number of Nodes in the Auction Circuit
Figure 5: Circuit Size vs Maximum Bid
Figure 6: Circuit Size vs No of Goods
circuit of approximately 5MB. A larger auction with5 goods, a maximum bid of 200, and 50 bidders has agarbled circuit size of approximately 85MB. The sizeof the garbled circuits gets very large for large num-ber of goods but, if some combinations of goods canbe removed as invalid, the garbled circuit size woulddrop. It is also worth noting that construction of amore compact combinatorial auction circuit with lessgates would decrease the size of the garbled circuit.
6 Performance Results
We have tested the performance of the garbled cir-cuits protocol in respect to the number of bidders,number of goods, and the number of bits in the price.Other than the variable under test, the default pa-rameters selected for performance measurements wereten bidders, three goods, and four bits in the price.The test machines were a group of four Dell OptiplexGX755s each with an Intel Core 2 Duo processor and2048MB DDR SDRAM. The auction time recorded isthe total time to compute the auction, this includesthe creation of the circuit, the garbling of the circuit,the VPOT protocol to learn the garbled inputs, andthe garbled circuit execution time.
The time taken to complete the auction increaseslinearly as the number of bidders increases as shownin Figure 7. This is due to the linear growth in thetime taken to execute the VPOT protocol and to gar-
Figure 7: Auction Time vs No of Bidders
Figure 8: Auction Time vs Bits in Price
ble and execute the circuit as the number of biddersincreases.
Figure 8 shows the time taken to complete theauction when the number of bits in the price is in-creased. The relationship between the number of bitsin the price and the time taken appears to be linear.Increasing the number of bits in the price by 1 bitincreases the maximum bid by a power of 2. Figure 9illustrates the relationship between the time taken tocompute the auction and the maximum bid.
Figure 10 compares the performance of garbled cir-cuits with the performance (Bubendorfer & Thom-
Figure 9: Auction Time vs Maximum Bid
CRPIT Volume 116 - Information Security 2011
72
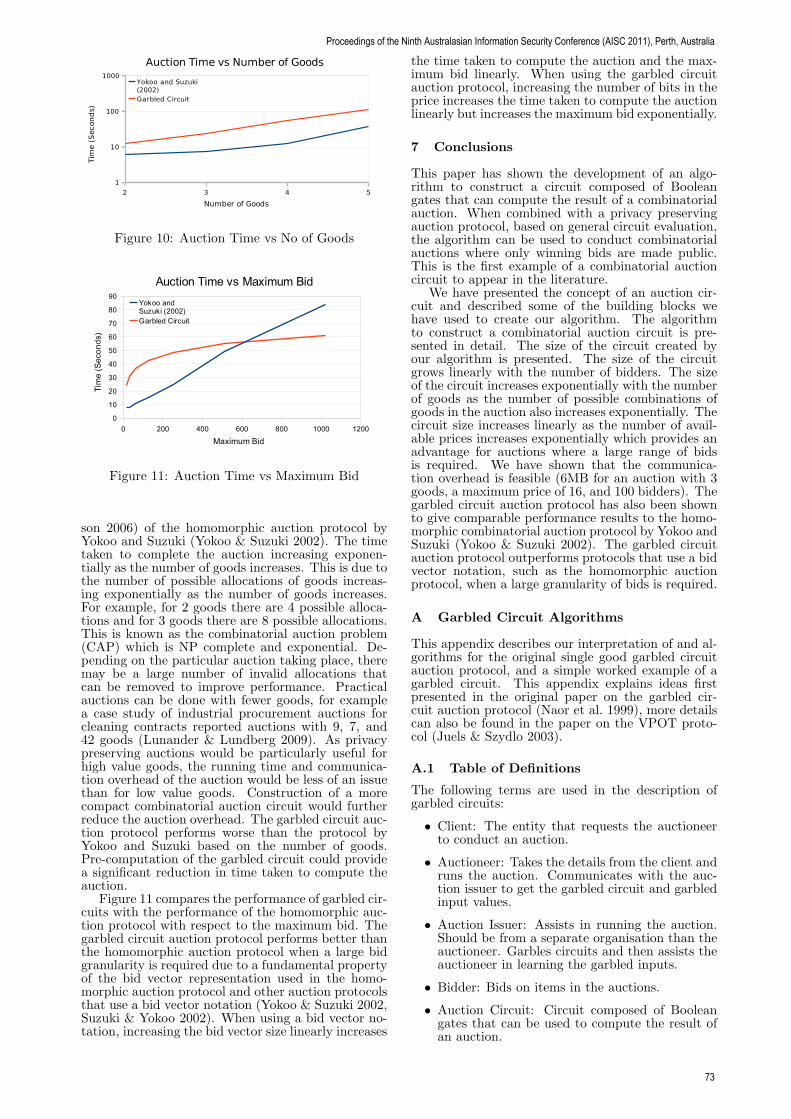
Figure 10: Auction Time vs No of Goods
Figure 11: Auction Time vs Maximum Bid
son 2006) of the homomorphic auction protocol byYokoo and Suzuki (Yokoo & Suzuki 2002). The timetaken to complete the auction increasing exponen-tially as the number of goods increases. This is due tothe number of possible allocations of goods increas-ing exponentially as the number of goods increases.For example, for 2 goods there are 4 possible alloca-tions and for 3 goods there are 8 possible allocations.This is known as the combinatorial auction problem(CAP) which is NP complete and exponential. De-pending on the particular auction taking place, theremay be a large number of invalid allocations thatcan be removed to improve performance. Practicalauctions can be done with fewer goods, for examplea case study of industrial procurement auctions forcleaning contracts reported auctions with 9, 7, and42 goods (Lunander & Lundberg 2009). As privacypreserving auctions would be particularly useful forhigh value goods, the running time and communica-tion overhead of the auction would be less of an issuethan for low value goods. Construction of a morecompact combinatorial auction circuit would furtherreduce the auction overhead. The garbled circuit auc-tion protocol performs worse than the protocol byYokoo and Suzuki based on the number of goods.Pre-computation of the garbled circuit could providea significant reduction in time taken to compute theauction.
Figure 11 compares the performance of garbled cir-cuits with the performance of the homomorphic auc-tion protocol with respect to the maximum bid. Thegarbled circuit auction protocol performs better thanthe homomorphic auction protocol when a large bidgranularity is required due to a fundamental propertyof the bid vector representation used in the homo-morphic auction protocol and other auction protocolsthat use a bid vector notation (Yokoo & Suzuki 2002,Suzuki & Yokoo 2002). When using a bid vector no-tation, increasing the bid vector size linearly increases
the time taken to compute the auction and the max-imum bid linearly. When using the garbled circuitauction protocol, increasing the number of bits in theprice increases the time taken to compute the auctionlinearly but increases the maximum bid exponentially.
7 Conclusions
This paper has shown the development of an algo-rithm to construct a circuit composed of Booleangates that can compute the result of a combinatorialauction. When combined with a privacy preservingauction protocol, based on general circuit evaluation,the algorithm can be used to conduct combinatorialauctions where only winning bids are made public.This is the first example of a combinatorial auctioncircuit to appear in the literature.
We have presented the concept of an auction cir-cuit and described some of the building blocks wehave used to create our algorithm. The algorithmto construct a combinatorial auction circuit is pre-sented in detail. The size of the circuit created byour algorithm is presented. The size of the circuitgrows linearly with the number of bidders. The sizeof the circuit increases exponentially with the numberof goods as the number of possible combinations ofgoods in the auction also increases exponentially. Thecircuit size increases linearly as the number of avail-able prices increases exponentially which provides anadvantage for auctions where a large range of bidsis required. We have shown that the communica-tion overhead is feasible (6MB for an auction with 3goods, a maximum price of 16, and 100 bidders). Thegarbled circuit auction protocol has also been shownto give comparable performance results to the homo-morphic combinatorial auction protocol by Yokoo andSuzuki (Yokoo & Suzuki 2002). The garbled circuitauction protocol outperforms protocols that use a bidvector notation, such as the homomorphic auctionprotocol, when a large granularity of bids is required.
A Garbled Circuit Algorithms
This appendix describes our interpretation of and al-gorithms for the original single good garbled circuitauction protocol, and a simple worked example of agarbled circuit. This appendix explains ideas firstpresented in the original paper on the garbled cir-cuit auction protocol (Naor et al. 1999), more detailscan also be found in the paper on the VPOT proto-col (Juels & Szydlo 2003).
A.1 Table of Definitions
The following terms are used in the description ofgarbled circuits:
• Client: The entity that requests the auctioneerto conduct an auction.
• Auctioneer: Takes the details from the client andruns the auction. Communicates with the auc-tion issuer to get the garbled circuit and garbledinput values.
• Auction Issuer: Assists in running the auction.Should be from a separate organisation than theauctioneer. Garbles circuits and then assists theauctioneer in learning the garbled inputs.
• Bidder: Bids on items in the auctions.
• Auction Circuit: Circuit composed of Booleangates that can be used to compute the result ofan auction.
Proceedings of the Ninth Australasian Information Security Conference (AISC 2011), Perth, Australia
73

• Node: Boolean gate in an auction circuit.
• Wire: Link between two nodes of an auction cir-cuit. A wire can have a value b of 0 or 1.
• W 0 and W 1: Multi-bit random values that areused to represent the 1 and 0 value of a wire.
• c: Result of a random permutation of a wiresvalue b.
• 〈W b, c〉: Garbled value of a wire. Formed byconcatenating W for the value b of the wire withthe result of the permutation c of the value b ofthe wire.
• g: The node function which calculates the outputof the node based on the inputs. For example,for an AND gate g(0, 1) = 0 and g(1, 1) = 1.
• Gate Table: Each node in the auction circuit hasa gate table that maps the garbled inputs to agarbled output.
• Output Mapping: Table that maps the garbledoutputs to actual outputs. Each output wire hasan output mapping.
• Pseudo Random Function F (a, b): Pseudo ran-dom function F takes a as a seed and b as anargument and returns a random value. We usethe SHA-1 hash function to represent this func-tion.
A.2 Garbled Circuit Generation
To garble a circuit, the auction issuer executes thefollowing algorithm on the nodes and wires of the auc-tion circuit.
Algorithm 4Procedure GarbleCircuitInput: AuctionCircuit AC, RandomFunction FOutput: GateTable GT, OutputMapping OM1. (∗ Assign random values to the wires ∗)2. for wire i ∈ AC3. Randomly generate W 0
i and W 1i corre-
sponding to 0 and 1.4. Choose a random permutation over
{0,1}, πi : bi → ci.5. (∗ Construct function tables for every node ∗)6. for node k ∈ AC with input nodes i,j7. for ci ← 0 to 18. for cj ← 0 to 19. GT (k)(ci, cj)←10. GetGTV alue(i, j, k)11. (∗ Construct output mapping ∗)12. for output wire k ∈ AC13. OM(k, 0)← 〈W 0
k , πk(0)〉14. OM(k, 1)← 〈W 1
k , πk(1)〉
Algorithm 4 garbles an auction circuit. The firststep is to assign random values to every wire of theauction circuit. Every wire has a value correspondingto 0 and 1 (W 0,W 1) assigned to it as well as a randommapping of its output π that maps the wires value bto c.
For every node in the auction circuit a table isconstructed that, given the garbled input of the node,outputs the garbled output. If the node is an outputnode, an output mapping is also produced mappingthe garbled output of the node to the actual output.These steps can only be performed with the knowl-edge of the random values assigned to all the wires.Algorithm 5 details the calculation done for an entryin the gate table. The tables for each node and theoutput mappings are then sent to the auctioneer toexecute the circuit.
Algorithm 5Procedure GetGTValueInput: InputNode i, InputNode j, Node kOutput: bit [] Value1. V alue←2. {(W
g(bi,bj)k , ck)⊕ (F (W bi
i , cj))⊕ (F (Wbjj , ci))}
3. return V alue
A.3 Executing a Circuit
The following algorithm is executed by the auctioneerafter it has received the GateTable and OutputMap-ping arrays from the auction issuer. The auctioneerwill also have received the garbled inputs after com-pleting the VPOT protocol with the bidders and auc-tion issuer.
Algorithm 6Procedure ExecuteCircuitInput: AuctionCircuit AC, GateTables GT, Out-
putMapping OM, GarbledInputs GI, Random-Function F
Output: ActualValues AV1. (∗ Reset All Nodes ∗)2. for Nodes k ∈ AC3. Computed(k)← false4. (∗ Compute All Nodes ∗)5. repeat6. for Node k with input nodes i and j7. if ((Computed(i) ∩Computed(j)) ∪
(i ∈ GI ∩ j ∈ GI)8. GarbledOutputk ←9. GetGO(i, j, k,GT )10. Computed(k)← true11. until All Nodes have been Computed
(∗ Convert Garbled Output to Actual Output ∗)12. for output nodes o13. if (GarbledOutputo = OM(o, 1))14. then AV (o)← 115. else AV (o)← 0
Algorithm 6 executes a garbled circuit given theauction circuit, gate tables, output mapping, garbledinputs, and random function. It loops through all thenodes in the auction circuit until they have all beencomputed. The gate tables are used to compute thegarbled output of a node k with input wires i andj. Inputs i and j will have garbled input values of
〈W bii , ci〉 and 〈W
bjj , cj〉. From the garbled inputs the
values ci, cj , Wbii , and W
bjj can be extracted from the
concatenated garbled inputs. Then the garbled out-put can be computed using algorithm 7. Algorithm 7uses the entry in the gate table for ci and cj as well
as the output of the random function with seed W bii
and input cj and with seed Wbjj and input ci. The
output mapping is used to convert the garbled outputto the actual output for an output node.
Algorithm 7Procedure GetGOInput: InputNode i, InputNode j, Node k, GateTa-
bles GTOutput: bit [] GarbledOutput1. GarbledOutput←
2. F (W bii , cj)⊕ F (W
bjj , ci)⊕GT [k](ci, cj)
3. return GarbledOutput
A.4 A Simple Garbled Circuit
Figure 12 illustrates a small garbled circuit with anAND and an OR gate as well as the ’Random ValuesAssigned to Wires’ which are the random values and
CRPIT Volume 116 - Information Security 2011
74

Ci,Cj Output
00
01
10
11
AND Table
110
010
001001
11
10
01
00
Ci,Cj Output
OR Table
101
110
000100
Random Values Assigned to Wires
Wire W0 W1
V
W
X
Y
Z
0 1
1
1
1
0
0
0
10
01 1 0
11
10
01
00
01
00
1001
C1C0
Seed FSeed(0) FSeed(1)
0001
10
11
101
100
110
000
011111001
010
Random Function F
Garbled Output Output
1
0
101
010
Input 2
Input 3
Input 1&
>= 1Output
V
X
YZ
W
Gatetables
Garbled Output to Output Mapping
Figure 12: Garbled Circuit Example
permutation computed by the auction issuer and keptsecret from any of the other parties taking part in theprotocol. The auction issuer would have executed al-gorithm 4 to produce the random values assigned towires, the gate tables and the garbled output to out-put mapping. The ’Random Function F’ is availableto any party in the protocol. The garbled value of awire is set to 〈W b, c〉 so for wire Z the garbled valueof 0 is 〈01, 0〉 = 010.
To execute the circuit in Figure 12 the auctioneerwould take the following steps:
• Find out the garbled input values. For say V = 1,W = 1, and Y = 0 the output should be 1. Thegarbled input value for V is 001, for W is 010,and for Y is 010. The garbled input value is thegarbled value of the wire for the input value.
• Now we need to execute the gates. To executethe AND gate we use our garbled inputs and thegatetable. The output is 001⊕ 111⊕ 100 = 010.
• Now we need to execute the OR gate. The outputis 101 ⊕ 001 ⊕ 001 = 101. Using the garbledoutput to output mapping we can see the outputof the garbled circuit is 1.
This is a small example that shows how a garbledcircuit works. A circuit that executes an auction hasthousands of gates depending on the parameters ofthe circuit.
References
Baudron, O. & Stern, J. (2001), Non-interactive pri-vate auctions, in P. Syverson, ed., ‘FC’01: Pro-ceedings of the 5th Annual Conference on FinancialCryptography’, Lecture Notes in Computer Sci-ence, Springer-Verlag.
Bubendorfer, K., Palmer, B. & Thomson, W. (2009),Dynamic ambient paradigms, in R. Buyya &K. Bubendorfer, eds, ‘Market Oriented Grid andUtility Computing’, Wiley, pp. 541–568.
Bubendorfer, K. & Thomson, W. (2006), ResourceManagement Using Untrusted Auctioneers in aGrid Economy, in ‘proceedings of the Second IEEEInternational Conference on e-Science and GridComputing (E-SCIENCE)’, Amsterdam, Holland.
Cachin, C. (1999), Efficient private bidding and auc-tions with an oblivious third party, in ‘CCS ’99:
Proceedings of the 6th ACM conference on Com-puter and communications security’, ACM, NewYork, NY, USA, pp. 120–127.
Franklin, M. & Reiter, M. (1995), The design and im-plementation of a secure auction service, in ‘Pro-ceedings IEEE Symposium on Security and Pri-vacy’, IEEE Computer Society Press, Oakland, Ca,pp. 2–14.
Harkavy, M., Tygar, J. D. & Kikuchi, H. (1998), Elec-tronic auctions with private bids, in ‘WOEC’98:Proceedings of the 3rd conference on USENIXWorkshop on Electronic Commerce’, pp. 61–74.
Jakobsson, M. & Juels, A. (2000), Mix and match:Secure function evaluation via ciphertexts, in ‘ASI-ACRYPT ’00: Proceedings of the 6th InternationalConference on the Theory and Application of Cryp-tology and Information Security’, Springer-Verlag,London, UK, pp. 162–177.
Juels, A. & Szydlo, M. (2003), A two-server, sealed-bid auction protocol, in ‘FC ’02: Proceedings ofthe 6th Annual Conference on Financial Cryptog-raphy’, Springer-Verlag, pp. 72–86.
Kikuchi, H. (2001), (m+1)st-price auction protocol,in ‘FC ’01: Proceedings of the 5th InternationalConference on Financial Cryptography’, Springer-Verlag, pp. 351–363.
Kurosawa, K. & Ogata, W. (2002), Bit-slice auctioncircuit, in ‘ESORICS ’02: Proceedings of the 7thEuropean Symposium on Research in ComputerSecurity’, Springer-Verlag, London, UK, pp. 24–38.
Lipmaa, H., Asokan, N. & Niemi, V. (2002), Securevickrey auctions without threshold trust, in ‘FC’02:Proceedings of the 6th Annual Conference on Fi-nancial Cryptography’, Springer-Verlag, pp. 85–101.
Lunander, A. & Lundberg, S. (2009), Do combina-torial procurement auctions lower cost? - an em-pirical analysis of public procurement of multiplecontracts, Umea Economic Studies 776, Umea Uni-versity, Department of Economics.
Naor, M., Pinkas, B. & Sumner, R. (1999), Privacypreserving auctions and mechanism design, in ‘EC’99: Proceedings of the 1st ACM conference onElectronic commerce’, ACM, pp. 129–139.
Peng, K., Boyd, C., Dawson, E. & Viswanathan,K. (2002), Robust, privacy protecting and publiclyverifiable sealed-bid auction., in ‘ICICS ’02: FourthInternational Conference on Information and Com-munications Security’, pp. 147–159.
Perrig, A., Smith, S., Song, D. & Tygar, J. (2001),‘Sam: a flexible and secure auction architectureusing trusted hardware’, Parallel and DistributedProcessing Symposium., Proceedings 15th Interna-tional pp. 1764–1773.
Suzuki, K. & Yokoo, M. (2002), Secure combinatorialauctions by dynamic programming with polyno-mial secret sharing, in ‘Sixth International Finan-cial Cryptography Conference (FC-02)’, Springer-Verlag, pp. 44–56.
Yao, A. C. (1982), Protocols for Secure Computa-tions, in ‘proceedings of the 23rd Annual IEEESymposium on Foundations of Computer Science’,Chicago, IL, USA, pp. 160–164.
Proceedings of the Ninth Australasian Information Security Conference (AISC 2011), Perth, Australia
75

Yokoo, M. & Suzuki, K. (2002), Secure multi-agentdynamic programming based on homomorphic en-cryption and its application to combinatorial auc-tions, in ‘proceedings of the First InternationalConference on Autonomous Agents and MultiagentSystems (AAMAS-2002)’, ACM, New York, NY,USA, pp. 112–119.
Yokoo, M. & Suzuki, K. (2004), Secure generalizedvickrey auction without thirdparty servers, in ‘pro-ceedings of the 8th International Financial Cryp-tography Conference (FC-2004)’, Florida, USA.
CRPIT Volume 116 - Information Security 2011
76

Comparison of Low-Latency Anonymous Communication Systems -
Practical Usage and Performance
Thorsten Ries, Andriy Panchenko, Radu State and Thomas Engel
Interdisciplinary Centre for Security Reliability and TrustUniversity of Luxembourg
Email: {thorsten.ries, andriy.panchenko, radu.state, thomas.engel}@uni.lu
Abstract
The most popular system for providing practical low-latency anonymity on the Internet is Tor. However,many other tools besides Tor exist as both free andcommercial solutions. In this paper, we consider�ve most popular low-latency anonymisation servicesthat represent the current state of the art: single-hop proxies (Perfect Privacy and free proxies) andOnion Routing based solutions (Tor, I2P, and Jon-Donym). We assess their usability and rank themin regard to their anonymity. We also assess theire�ciency and reliability. To this end, we de�ne aset of metrics and present extensive measurementsbased on round-trip time, inter-packet delay variationand throughput. Apart from the technical realization,economic aspects are also crucial for anonymous com-munication systems. In order to attract more users,which is mandatory in order to improve anonymityper se, systems need to exhibit a certain payo�. Wetherefore de�ne an economic model that takes all rel-evant aspects into consideration. In this paper, wedescribe the results obtained, lessons learned, andprovide guidance for selecting the most appropriatesystem with respect to a set of requirements.
1 Introduction
For various reasons, people want to protect their iden-tity when communicating over the Internet. Doingso, they protect their privacy. Freedom of expressionmay be one motivation, while another reason may bea company or customer with the need to stay anony-mous1 for certain business transactions.
Based on this need, the aim of this paper is to com-pare existing implementations of anonymising sys-tems with respect to users' requirements such as per-formance and usability, also taking into account as-pects of anonymity and security as well as the realcosts, i.e., monetary costs the user faces. To this end,we assessed �ve tools that represent the di�erent ap-proaches and the current state-of-the-art in practicalanonymisation: free proxies, Perfect Privacy 2, Jon-Donym 3, Tor 4, and I2P 5.
1The term anonymity derives from the Greek word ανωνυµιαand means "without a name" or "namelessness"
2http://www.perfect-privacy.com3https://anonymous-proxy-servers.net/en/index.html4http://torproject.org5http://www.i2p2.de/
Copyright c©2011, Australian Computer Society, Inc. This pa-per appeared at the 9th Australasian Information Security Con-ference (AISC 2011), Perth, Australia, January 2011. Confer-ences in Research and Practice in Information Technology (CR-PIT), Vol. 116, Colin Boyd and Josef Pieprzyk, Ed. Reproduc-tion for academic, not-for pro�t purposes permitted providedthis text is included.
In recent years, research in anonymity has beenvery active, with many approaches developed. How-ever, only a very few of these reached wide-scale de-ployment and are used in practice. The predominantsystem in use today is Tor, developed by Dingledineet al. (2004). Tor is considered to be a low-latencyanonymisation tool, which means that data is sup-posed to be delivered within a reasonable time, al-lowing the usage of interactive applications such asweb browsing.
In contrast, high-latency systems such as Mixmas-ter and Mixminion, developed by Moeller et al. (2003)and Danezis et al. (2003) respectively, provide a highdegree of anonymity and should be considered for ex-change of �more sensitive� information. As a draw-back, communications like anonymous web browsingwould not practically possible because of the longdelays. Beside these, several other anonymisationtools exist as both free or commercial solutions follow-ing di�erent design approaches; current low-latencyapproaches can basically be divided into single-hopproxies and Onion Routing approaches, initially in-vented by Reed et al. (1998).
The easiest solution to hiding the identity of a useris the use of a single proxy server. Tra�c is routedthrough a node that strips o� the origin IP addressand presents its own instead. The main problem ofsingle-host proxies is that they are a single point offailure in regard to availability and trust.
The current step in the evolution of anonymousnetworks is Onion Routing, where messages are en-crypted in layers and sent from one node to the next.At each hop one layer of encryption is removed (oradded, depending on the direction) and the result fur-ther forwarded.
Further, users need to distinguish between serviceswhere one entity operates both the anonymisationnodes, and the information service (e.g., Perfect Pri-vacy) and services where nodes can be operated byindependent third parties (e.g., Tor, I2P).
However, independent of the used anonymisationtechnique, users' identities may still be discoveredusing other techniques such as information leakageat the application layer. This can be accomplishedthrough analysis of the HTTP headers or by inter-section attacks, using language or font presets for in-stance as proved by Raymond (2000) andWright et al.(2003). Therefore, either a service to alter HTTPheader information should be provided by proxy ser-vice operators, or it is recommended to use �lteringproxy on the user side before sending the data to theanonymisation network.
This super�cial classi�cation of anonymisationsystems already shows the complexity a user facesdeciding upon an appropriate solution. During thisselection process, several aspects are usually consid-ered. In addition to the most important aspect, thedegree of anonymity and performance plays a large
Proceedings of the Ninth Australasian Information Security Conference (AISC 2011), Perth, Australia
77

role, as do reliability, usability, and economic aspects(see Fig. 1).
Anonymisation Tool
LNA
WSP
PP Jondo (Free) Jondo (Com.) TorI2PFP
ISP
Gov.
LNA
IX
WSP
NO
SO
ISP
Gov.
LNA
IX
WSP
NO
SO
ISP
Gov.
LNA
IX
WSP
NO
SO
ISP
Gov.
LNA
IX
WSP
NO
SO
LNA
WSP
Gov.NOSO
EPEP
EPEP
EPEPEx
posu
re
Gov.NOSOIX IXISP ISP
Performance
Anonymity
Usability
Cost
AnonymisationSystem
Reliability
SO Service Operator
NO Node Operator
Gov. Government / Secret Service
IX
ISP
LNAWSP
Internet Exchagne
Internet Service Provider
Local Network AdministratorWeb Service Provider
EP External Party
Figure 1: Aspects of systems selection
In this paper, we examine all relevant incentivesand combine them to provide usage guidance onalready-deployed anonymisation networks by classify-ing the systems and showing their strength and weak-nesses. Applying this guidance, users can select theanonymisation service that best suits their needs in aconcrete situation.
The remainder of this paper is organized as fol-lows: �rstly, we give an overview of the tools wecompare. Section 2 describes the anonymisation sys-tems we used for comparison, and is followed by anoverview of related work (Section 3). In Section 4,we brie�y examine usability in regard to its impacton acceptance of the tools. Further, we measureand evaluate the performance in terms of round triptime (RTT), Inter-Packet Delay Variation (IPDV),and throughput. We classify anonymisers in regardto their e�ciency in Section 5 before addressing prac-tical issues of anonymity and security in Section 6.In Section 7, we calculate and discuss the aspect ofreliability, before all relevant aspects are combined todescribe the economic impact on a user's decision pro-cess in Section 8. Finally, Section 9 concludes withthe lessons learned and future work.
2 Anonymisation Systems
The simplest way of hiding someone's identity is touse of a proxy server. The receiver of the messageonly gets the IP address of an intermediate server,not of the sender. The main drawback is that adver-saries can easily de-anonymise users by compromis-ing a server or simply providing one. However, thisservice may still assure a basic level of anonymity.Due to the simple setup, proxy servers are very com-mon, either as free or commercial solutions and can beeasily found in the Internet. The providers of theseproxy servers are mostly unknown, so one does notknow how trustworthy they actually are. Commer-cial services exist too, such as Perfect Privacy, whichcurrently provides 48 servers in 23 countries world-wide, allowing users to choose either their preferredproxy or a self-de�ned cascade of proxies, meaningthat several proxy servers are combined into a chain.This may increase anonymity and security against anexternal adversary, but still has the drawback thatthe service as a whole is operated by a single entity.Perfect Privacy o�ers a variety of ways of connecting:users can simply use the servers as an HTTP- SOCKSproxy6. In addition, users can connect to the proxy
6SOCKS is an Internet Protocol to facilitate routing of packetsusing a proxy server
server via OpenVPN, PPTP VPN, or SSH. As longas the user does not use their own layer of encryption,the tra�c from the proxy server to the destination isnot encrypted and consequently completely visible tothe server provider. This is true for all anonymisationtools presented here.
Another low-latency anonymisation approach pro-vides the possibility of active mixing7 of the tra�ctogether with Onion Routing. A popular exampleof using this approach is JonDonym. Started as anopen source project at the TU Dresden, JonDonym(formerly known as JAP) became a popular tool togain anonymity in the Internet. Users can choose be-tween several �xed paths, known as cascades, withnodes provided by JonDonym operators and nodesoperated by other organizations or individuals. Cur-rently, there are 34 nodes in the network forming 16cascades. The operators of JonDonym provide twokinds of service: a free service, usually having twonodes in a cascade with several hundreds users anda commercial service with usually three nodes in acascade. Compared to the free service, the numberof concurrent participants is relatively low (less than100). Even though tra�c mixing is supported in thisapproach, to the best of our knowledge, it is not ac-tivated because of performance issues.
Today's most widely used anonymisation system isTor. Also based on onion routing, Tor tries to providean acceptable degree of anonymity, while allowing theuse of interactive web applications. Recently, Dingle-dine (2009) showed that Tor has about 300,000 usersdaily and about 2,000 relaying nodes. The main dif-ference from JonDonym is its volunteer-based nodeoperation. In order to achieve optimal system per-formance, Tor currently relies on directory servers,which gather all relevant information about the net-work and provide information about the performanceof nodes to the clients.
I2P is a system similar to Tor and JonDonym. Incontrast to JonDonym and Tor, the main objectiveof I2P is communication within its own network andnot with external services. As a consequence, there iscurrently only one outbound HTTP gateway respon-sible for all outgoing web tra�c. Another di�erencefrom Tor and JonDonym is its fully-distributed net-work, which has no centralised server for coordinationand organisation. Hence, the network consists of a setof nodes that communicate with each other in orderto achieve anonymity. All tra�c is encrypted usinggarlic encryption, which combines multiple messagesinto one single message to make tra�c analysis moredi�cult.
3 Related Work
In the many years since the establishment of the Inter-net, network performance has been an extensive �eldof research, showing di�erent issues and optimizationsin a large number of publications, e.g., by Keshav(1999). In recent years, logical networks, also knownas overlay networks, were introduced to allow the easycreation of additional network services without mod-i�cation of the underlying network. These have be-came a popular topic of interest in network researchand shifted several network paradigms to the appli-cation layer. Peer-to-peer networks and other overlaynetwork topologies were introduced to improve dataexchange or to add additional functionality. Amongthese is anonymity, which elicited so much interest,that a special �eld of research, anonymous communi-cation, was established.
Several surveys on anonymous communication sys-tems exist, e.g., conducted by Kelly (2009) or Ren
7actively delaying and batching messages
CRPIT Volume 116 - Information Security 2011
78

et al. (2009). In the work of Pries et al. (2008),in which the authors describe the concepts of basicanonymous communication, as well as implementedsystems, the need of low-latency anonymous commu-nication systems is highlighted. However, most sur-veys focus on MixNet based schemes based on the ap-proach of Chaum (1981) for anonymous remailers andOnion Routing (particularly on Tor); minor work hasbeen conduction on other network routing-based tech-niques like Crowds and P2P networks such as Tarzan,which was developed by Freedman et al. (2002) andMorphMix, an approach by Rennhard et al. (2002).Due to its widespread usage with about 300,000 usersdaily, existing performance measurements in anony-mous communication mainly concentrate on Tor. Themain objective is the improvement of performance, forinstance using alternative methods of path selection.Very often, authors of related publications concen-trate on throughput improvements in Tor and eitherpropose algorithms to achieve higher performance orhigher anonymity as shown by Snader et al. (2008).In contrast, the importance of latency in anonymi-sation networks as performance metric is highlightedby Murdoch et al. (2008). However, both publicationsconsider only a single property, while our study com-bines these with the variance to determine the overallperformance.
Other relevant matters in choosing the appropri-ate anonymisation system are rarely considered. Theoptimal system needs to be reliable, and also has tobe usable and cheap. Economic aspects are coveredby Acquisti et al. (2003) to build a general model inorder to describe the incentives for participation inanonymous networks. This approach was elaboratedby Ngan et al. (2010), going one step further and de-scribing incentives for relaying tra�c within Tor withthe aim of an overall performance improvement.
The work of Dingledine et al. (2006) emphasizesthe usability and the network e�ect in anonymisationnetworks. The authors argue the importance of us-ability to increase the user base and, consequently,on the achievable anonymity. Related to both us-ability and performance is the time needed for send-ing and receiving messages. Even when just sur�ngin the Internet, users expect an appropriate perfor-mance. If these expectations are not met, users willmost likely not use the service. Various studies haveattempted to �nd out the maximum tolerable time forloading a website. Di�erent numbers can be found inliterature, depending on the culture, etc., but recentstudies studies, e.g., by Kopsel (2006) and Wendol-sky et al. (2007) conclude that about four seconds isa maximum tolerable delay for most users.
To the best of our knowledge, to date there hasbeen no practical comparison of all relevant aspects(degree of anonymity, performance, usability, reli-ability, and cost) of already deployed low-latencyanonymisation tools. This paper aims to close thisgap.
4 Usability
As already mentioned, usability is a crucial aspectsince it is essential to attract more users, which isa prerequisite for improving anonymity. The higherthe number of participants, the better the theoreticalanonymity due to the increased size of the anonymityset (as in the work of P�tzmann et al. (2009)). Conse-quently, providers of anonymity services aim to have ahigh number of users, which, which incurs the cost ofa degradation in the system's performance. However,even before evaluating the systems' features, the userinformally evaluates the usability of the anonymisa-tion system during installation and initial con�gura-
tion. This is of particular importance, as she mayalready form a negative opinion of the system andmay reject its further use.
To evaluate usability, we use the cognitive walk-through (CW) method, developed by Wharton et al.(1992). Hereby users try to accomplish tasks withthe aim of identifying usability issues. The particularevaluation was divided into three steps:
1. CW1: Installation of the anonymising software.
2. CW2: Con�guration of the browser/other soft-ware.
3. CW3: Veri�cation of the anonymised connection.
In the following, we describe these steps more in de-tail.
CW1: Installation of the anonymising software
Although some prerequisite software installationsmay be challenging to inexperienced users, all systemsprovide well documented websites to support usersduring the installation process. Very often, step-by-step instructions are given, which vary from a sim-ple double-click (JonDonym) to some more advancedcon�guration being necessary (Tor and I2P).
CW2: Con�guration of the browser/othersoftware
As already mentioned, we tested both free and com-mercial systems. The two commercial systems, Per-fect Privacy and the premium service of JonDonym,have to be paid for in advance. This can by doneby credit card or anonymously by using vouchers (seeSection 6). Thus, the process of paying makes someadditional e�ort necessary, but is relatively easy tohandle.
The aim of Tor is to protect data transport. Forweb browsing, there are no speci�c measures to hidepotentially unmasking information as such as browsertype, language settings, and so forth, which is sent bydefault to the web server. Therefore the developershighly recommend the installation of a local proxyserver that modi�es or deletes this information be-fore sending the data. After the installation of thelocal proxy server, the �nal step is the same for allother tested systems: the users have to con�gure theapplication (in this case, the browser) in order to usea proxy server. Depending on the browser, the step ofproxy con�guration may be di�cult for a less sophisti-cated user the �rst time because of the sometimes notobvious location of these settings. Only Tor simpli�esthis process by installing an add-on (Torbutton) thatthat allows the proxy settings to be easily switchedon and o�.
CW3: Veri�cation of the anonymised connec-tion
Once the user has con�gured the browser or the ad-ditional software, she needs to verify whether theanonymisation service is running properly. On dedi-cated web sites that reveal the IP address of the con-necting user, it is easy to check the system's func-tionality. Some of these web sites8 provide additionalinformation about security/anonymity issues, like theconnecting IP address, HTTP header information andwhether Java/Javascript is turned on in the browser.Except for �nding an appropriate website, this stepwas found to be relatively easy to accomplish.
8E.g., http://test.anonymity.com
Proceedings of the Ninth Australasian Information Security Conference (AISC 2011), Perth, Australia
79

5 Performance
Probably the most important aspect for users on theInternet, even when acting anonymously, is perfor-mance. In particular, Round Trip Time (RTT), Inter-Packet Delay Variance (IPDV) and throughput havea signi�cant in�uence on the overall performance asperceived by users. Because this has a direct impacton the user's satisfaction, we examine these parame-ters in detail and calculate the overall e�ciency.
5.1 Testbed environment
All measurements described in this section wereperformed between a client (running Ubuntu 10.04,Intel Core2 Duo, 3GHz, connected at 100Mbit/sto the campus network and with 300Mbit/s tothe outside world) located at the University ofLuxembourg and two web servers, one located inLuxembourg and one on St. Vincent Island. Thebasic measurement setup is depicted in Figure 2.In order to allow the comparison of all tools underthe same conditions, we used the HTTP protocol asthe least common denominator supported by all tools.
Client Node A Node B Node C{ {Webserver 1
Webserver 2
Figure 2: Testbed setup with either one proxy or achain of intermediate nodes
For RTT measurements, we chose the Apache webserver benchmarking tool9. It allows measurementof the time a request needs to get about 200 bytesfrom an HTTP server. Even though this approachinvolves a certain overhead, it allows a relativecomparison of the systems. In order to consider time-shifts and varying network usage at di�erent timesof a day, we repeated the measurements over six days.
Measurements of IPDV were conducted everyminute over a period of four days, using a dedicatedclient-server application. We measured the inter-arrival time between every sequence sent with a onesecond interval in between. The main motivationof the following measurements is the question ofwhether it is possible to use applications such asVoIP over the anonymisation systems.
Finally, we measured the throughput for three con-secutive days using GNU wget10. We chose to down-load �les of two sizes (100KB and 1MB) to examinethe interaction between the amount of the transferreddata and the TCP slow start algorithm. We usedthese �le sizes to identify di�erences between smalland large �les based on a recent report that statesthat the average size of a web site is 320KB ( Google(2010)). Thus, we cover cases of both smaller andlarger �les.
All measurements were performed using the al-ready described anonymisation tools, applying thefollowing settings:
• Free proxies (FP) were chosen from a web pagelisting free proxy servers ranked by their perfor-mance11. As these servers typically have a high
9http://httpd.apache.org/docs/2.0/programs/ab.html10http://www.gnu.org/software/wget/11http://proxy.speedtest.at/proxybyPerformance.php?o�set=0
�uctuation, we had to switch between serversduring the test, causing signi�cant downtimes(see Section 7).
• Perfect Privacy (PP) currently o�ers servers at23 locations worldwide. Some locations provideonly a single server, others up to eight for thepurpose of load balancing. We used three ran-domly chosen nodes out of 48, located in Ams-terdam, Moscow, and Chicago.
• JonDonym, using three di�erent random pre-mium service cascades (out of nine), having threenodes each. Measurements were not performedusing free cascades because the user limit is oftenreached and, consequently, the service continu-ally becomes unavailable.
• Tor with its default con�guration, changing cir-cuits at least every 10 minutes.
• I2P, which also changes internal paths every 10minutes, but uses always the same single out-bound server with estimated 1,000 concurrentusers 12.
In addition, we performed the same measurementswithout any anonymisation tool. This informationserves as the reference value to calculate the e�ciencyand performance losses of anonymisation tools.
200 400 600 800 1000
0.0
0.2
0.4
0.6
0.8
1.0
CDF−RTT−Luxembourg
RTT [ms]
CD
F
NoneFree ProxyPerfect Privacy
JondoTorI2P
Figure 3: CDF Luxembourg
5.2 Round Trip Time
Network latency and RTT have a fundamental im-pact on end-to-end performance in computer net-works. Voice over IP (VoIP) applications for instancerequire a RTT of less than 600ms13 to provide ade-quate quality.
Evaluating our measurements, signi�cant di�er-ences were identi�ed: the commercial approaches,Perfect Privacy and JonDonym, show the lowestaverage RTTs together with the free proxy, whileTor and I2P are signi�cantly slower by a factor ofthree to four. The Cumulative Distribution Function(CDF) plots (Fig. 3 and 4) show the fraction ofmeasurements of RTT that are below a certainvalue. Taking Tor and I2P as an example, the testson the server in Luxembourg show that Tor canachieve lower RTTs, but between 550ms and 1s, I2P
12http://stats.i2p.to/13http://www.itu.int/itudoc/itu-t/aap/sg12aap/history/g.114/g114.html
CRPIT Volume 116 - Information Security 2011
80

200 400 600 800 1000
0.0
0.2
0.4
0.6
0.8
1.0
CDF−RTT−St. Vincent
RTT [ms]
CD
F
NoneFree ProxyPerfect Privacy
JondoTorI2P
Figure 4: CDF St. Vincent
Time
Milli
seco
nds
(ms)
8am 12pm 4pm 8pm 12am 4am 8am
025
0050
0075
0010
000
1500
020
000
(a) Perfect Privacy
Time
Milli
seco
nds
(ms)
025
0075
0012
500
1750
022
500
2750
0
8am 12pm 4pm 8pm 12am 4am 8am
(b) Tor
Figure 5: RTTs measured during one day using Per-fect Privacy(a) and Tor(b).
performs better, meaning that, for instance in 60%of the measurements, Tor showed a RTT of about800ms, while I2P achieved about 720ms. The resultsshow also that VoIP is only possible with PerfectPrivacy (Amsterdam), FP, and JonDonym with somerestrictions, because their RTTs are less than 400msfor at least 80% of the measurements.
During our measurements, Perfect Privacy showsthree distinct levels of RTTs with each level �uctuat-ing in only a narrow band of a few milliseconds (Fig.5(a)). Due to the usage of TCP packets, this patternis most likely created by packet retransmits. Thetimeout of TCP packets on GNU/Linux is 3000msand would explain the very constant additional de-lays. This suggests that there was congestion on thecommunication line or the proxy server. The samebehaviour has been observed on other Perfect Pri-vacy proxy servers as well. Tor instead shows a widervariance of RTT values (see Fig. 5(b)) due to the va-riety of possible circuits. Possible retransmits are noteasily detectable in this plot.
5.3 Inter-Packet Delay Variation
Interactive real-time applications such as VoIP de-pend heavily on a constant IPDV. While multime-dia streaming applications can compensate di�eringIPDV by the use of bu�ers, this is not possible inVoIP. In the sense of Quality of Service of VoIP, IPDVshould be <100ms to avoid distortion14.
Figure 6(a) shows the IPDV observed at both
14http://www.gig-ip.com/help/voip_and_qos_sensors.htm
−20 0 20 40 60 80 100
0.00
0.05
0.10
0.15
0.20
No Anonymisation − Luxembourg and St. Vincent
PDV [ms]
Den
sity
LuxembourgSt. Vincent
−100 −50 0 50 100
0.00
0.02
0.04
0.06
Perfect Privacy (Amsterdam), Jondo, Free Proxy − Luxembourg
PDV [ms]D
ensi
ty
Perfect PrivacyJondoFree proxy
−2000 −1000 0 1000 2000
0e+
001e
−04
2e−
043e
−04
4e−
045e
−04
Tor, I2P − St. Vincent
PDV [ms]
Den
sity
TorI2P
Figure 6: Inter-Packet Delay Variations
servers without anonymisation service. The serverin St. Vincent has a smoother and wider distribution,probably caused by the longer distance between clientand server, compared to the server in Luxembourg.However, Figure 6 suggests that apart from PerfectPrivacy and JonDonym, no other anonymisation ser-vice would be able to comply with the recommendedvalue of IPDV for VoIP applications. The values forTor and I2P are far too high for this kind of communi-cation (Fig. 6(c)), most likely due to congestion. Per-fect Privacy, the free proxy, and JonDonym in partic-ular provide a IPDV of less than 50ms (cf. Fig. 6(b)),and satisfy the requirements for carrying VoIP tra�c.
5.4 Throughput
In order to evaluate application performance withindi�erent scenarios, we measured throughput whiletransferring �les with the sizes of 100KB and 1MB.Due to similarities of the results, only the throughputresults to St. Vincent server are shown here.
The �rst CDF graph (Figure 7(b)) shows thethroughput of an anonymisation system while trans-
Proceedings of the Ninth Australasian Information Security Conference (AISC 2011), Perth, Australia
81
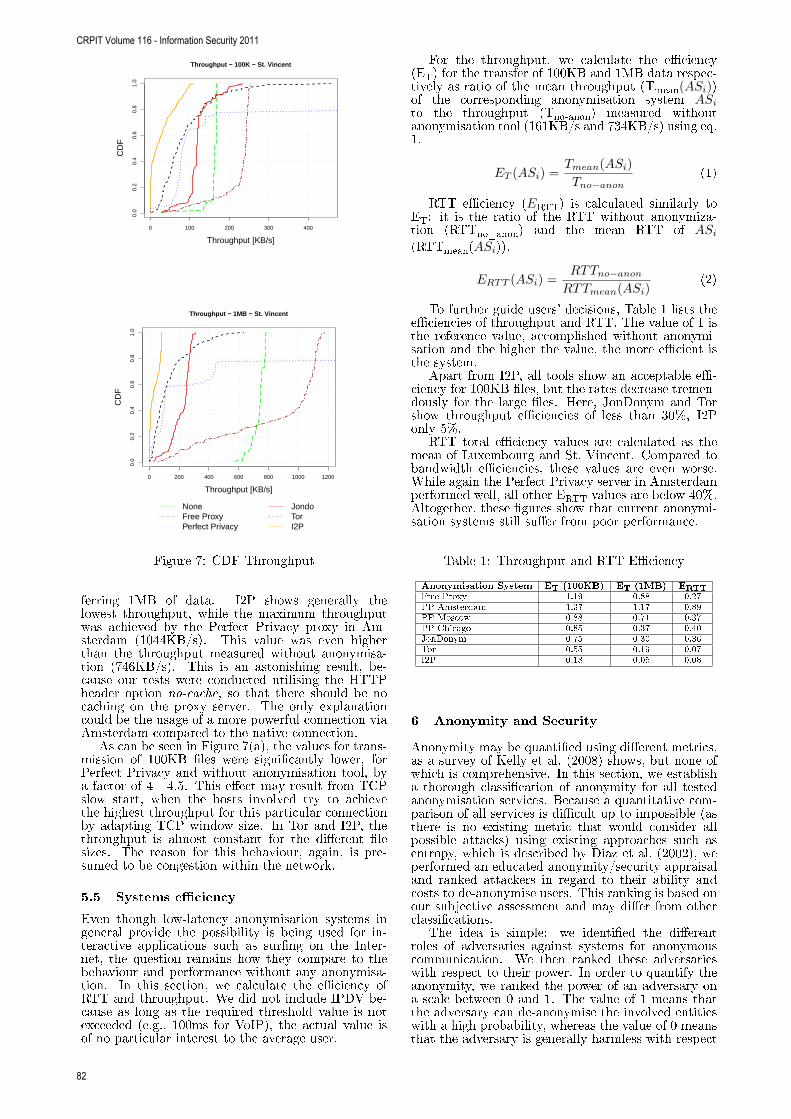
0 100 200 300 400
0.0
0.2
0.4
0.6
0.8
1.0
Throughput − 100K − St. Vincent
Throughput [KB/s]
CD
F
0 200 400 600 800 1000 1200
0.0
0.2
0.4
0.6
0.8
1.0
Throughput − 1MB − St. Vincent
Throughput [KB/s]
CD
F
NoneFree ProxyPerfect Privacy
JondoTorI2P
Figure 7: CDF Throughput
ferring 1MB of data. I2P shows generally thelowest throughput, while the maximum throughputwas achieved by the Perfect Privacy proxy in Am-sterdam (1044KB/s). This value was even higherthan the throughput measured without anonymisa-tion (746KB/s). This is an astonishing result, be-cause our tests were conducted utilising the HTTPheader option no-cache, so that there should be nocaching on the proxy server. The only explanationcould be the usage of a more powerful connection viaAmsterdam compared to the native connection.
As can be seen in Figure 7(a), the values for trans-mission of 100KB �les were signi�cantly lower, forPerfect Privacy and without anonymisation tool, bya factor of 4 - 4.5. This e�ect may result from TCPslow start, when the hosts involved try to achievethe highest throughput for this particular connectionby adapting TCP window size. In Tor and I2P, thethroughput is almost constant for the di�erent �lesizes. The reason for this behaviour, again, is pre-sumed to be congestion within the network.
5.5 Systems e�ciency
Even though low-latency anonymisation systems ingeneral provide the possibility is being used for in-teractive applications such as sur�ng on the Inter-net, the question remains how they compare to thebehaviour and performance without any anonymisa-tion. In this section, we calculate the e�ciency ofRTT and throughput. We did not include IPDV be-cause as long as the required threshold value is notexceeded (e.g., 100ms for VoIP), the actual value isof no particular interest to the average user.
For the throughput, we calculate the e�ciency(ET) for the transfer of 100KB and 1MB data respec-tively as ratio of the mean throughput (Tmean(ASi))of the corresponding anonymisation system ASito the throughput (Tno-anon) measured withoutanonymisation tool (161KB/s and 734KB/s) using eq.1.
ET (ASi) =Tmean(ASi)
Tno−anon(1)
RTT e�ciency (ERTT) is calculated similarly toET: it is the ratio of the RTT without anonymiza-tion (RTTno_anon) and the mean RTT of ASi(RTTmean(ASi)).
ERTT (ASi) =RTTno−anon
RTTmean(ASi)(2)
To further guide users' decisions, Table 1 lists thee�ciencies of throughput and RTT. The value of 1 isthe reference value, accomplished without anonymi-sation and the higher the value, the more e�cient isthe system.
Apart from I2P, all tools show an acceptable e�-ciency for 100KB �les, but the rates decrease tremen-dously for the large �les. Here, JonDonym and Torshow throughput e�ciencies of less than 30%, I2Ponly 5%.
RTT total e�ciency values are calculated as themean of Luxembourg and St. Vincent. Compared tobandwidth e�ciencies, these values are even worse.While again the Perfect Privacy server in Amsterdamperformed well, all other ERTT values are below 40%.Altogether, these �gures show that current anonymi-sation systems still su�er from poor performance.
Table 1: Throughput and RTT E�ciency
Anonymisation System ET (100KB) ET (1MB) ERTTFree Proxy 1.19 0.88 0.27PP Amsterdam 1.37 1.17 0.89PP Moscow 0.88 0.71 0.37PP Chicago 0.85 0.37 0.40JonDonym 0.75 0.30 0.36Tor 0.55 0.19 0.07I2P 0.18 0.05 0.08
6 Anonymity and Security
Anonymity may be quanti�ed using di�erent metrics,as a survey of Kelly et al. (2008) shows, but none ofwhich is comprehensive. In this section, we establisha thorough classi�cation of anonymity for all testedanonymisation services. Because a quantitative com-parison of all services is di�cult up to impossible (asthere is no existing metric that would consider allpossible attacks) using existing approaches such asentropy, which is described by Diaz et al. (2002), weperformed an educated anonymity/security appraisaland ranked attackers in regard to their ability andcosts to de-anonymise users. This ranking is based onour subjective assessment and may di�er from otherclassi�cations.
The idea is simple: we identi�ed the di�erentroles of adversaries against systems for anonymouscommunication. We then ranked these adversarieswith respect to their power. In order to quantify theanonymity, we ranked the power of an adversary ona scale between 0 and 1. The value of 1 means thatthe adversary can de-anonymise the involved entitieswith a high probability, whereas the value of 0 meansthat the adversary is generally harmless with respect
CRPIT Volume 116 - Information Security 2011
82

to the considered anonymisation technique. For in-stance, while a web service provider has limited powerto identify a user coming from an anonymisation net-work, an Internet exchange (IX) and a Governmenthas much greater power and abilities. Figure 8 showsthe results of our appraisal.
Anonymization Tool
LNA
WSP
PP Jondo (Free) Jondo (Com.) TorI2PFP
ISP
GOV
LNA
IX
WSP
NO
SO
ISP
GOV
LNA
IX
WSP
NO
SO
ISP
GOV
LNA
IX
WSP
NO
SO
ISP
GOV
LNA
IX
WSP
NO
SO
LNA
WSP
GOVNOSO
EP
EP
EPEP
EPEPPo
wer
GOVNOSOIX IXISP ISP
Performance
Anonymity
Usability
Cost
AnonymisationSystem
Reliability
SO Service Operator
NO Node Operator
GOV Government / Secret Service
IX
ISP
LNAWSP
Internet Exchange
Internet Service Provider
Local Network AdministratorWeb Service Provider
EP External Party
1
0
Figure 8: Classi�cation of anonymisation systems
No single low-latency anonymisation techniquecan provide an adequate protection against an at-tacker having a government or anonymisation serviceoperator status. Therefore, users of anonymisationsystems are required to trust the service operator. Us-ing for instance Tor, users get good protection againstthe Web Service Provider, the Local Network Admin-istrator (LNA), as well as the ISP. This is due tothe encryption used between the sender and the �rstTor node. A node operator and the External Party(EP) have some more power, as they can add as manynodes to the network as they have resources. Here,an External Party is de�ned as an entity outside theanonymisation system, that is trying to become a partof it. Hence, every other entity we consider in our cat-egorization can be seen as an EP too.
An even more powerful attacker is the InternetExchange, as it can observe a considerable amountof tra�c between the Tor nodes. Recent studies,e.g., by Edman et al. (2009) show that there isa certain risk that provider of large AutonomousSystems (AS) can control a signi�cant number ofentry and exit nodes, hence this is also true for thecorresponding Internet Exchange. Service Operatorand Government or Secret Service are the mostpowerful players. They may have enough power tobias path selection, analyse all network tra�c, breakthe encryption, or even apply non-technical means toachieve their goal (e.g., rubber-hose cryptanalysis15).We also di�erentiate between the the two availableversions of JonDonym. While the free versionprovides a path-length of two nodes, the premiumservices always use three nodes. However, we rankthe LNA higher for the premium service due tosimpli�ed �ngerprinting, as proved by Panchenkoet al. (2009) because of a smaller number of users.
Calculating the degree of anonymity using thisclassi�cation, single values are weighted, summed andnormalized:
15Torture of a person to extract cryptographic secrets, e.g., apassword
A = 1−
n∑i=1
(wi ∗ ai)
n∑i=1
wi
, (3)
where ai is the power of attacker i, wi the weightan user puts on the attacker ai and n is the numberof attackers considered (here: eight). Table 2 showsthe degree of anonymity of the tested anonymisationservices for two particular cases. Case 1 (C1) showsthe values without consideration of any user-basedweighting; C2 could be an employee using serviceslike eBay at the workplace. Here, we mainly con-sider the LNA and the WSP as critical, i.e., givingthem a higher weight (LNA: 10, WSP: 3). The otheridentities are weighted 1. Overall, Tor achieves thehighest degree of anonymity and the free proxy theworst. The degree of anonymity of Tor is even higherthan in I2P, mainly given because of the single out-bound node I2P provides. Due to the higher rankingof a LNA, the free version of JonDonym may be moreappropriate in C2.
Table 2: Degree of anonymity
Anonymisation System A (C1) A (C2)Free Proxy 0.18 0.32Perfect Privacy 0.26 0.42JonDonym 0.33 0.54JonDonym 0.36 0.53I2P 0.44 0.62Tor 0.47 0.66
In addition to the degree of anonymity, other as-pects, such as anonymous payment for the use of com-mercial anonymisation tools, are of relevance too, asthey may directly in�uence the anonymity. For exam-ple, providing the real name and/or the bank accountnumber would reveal the identity of the user to thecompany o�ering an anonymisation service.
The commercial service providers in this compari-son, Perfect Privacy and JonDonym, o�er an alterna-tive by also accepting payments by anonymous pay-ment schemes such as PaySafeCard16 or UKash17.Users can anonymously buy a code in an ordinaryshop and to pay for the anonymisation service withthis code as with pre-paid telephone cards, but with-out any personal registration being required. Anotherpossibility for ensuring anonymity during the pay-ment process is the usage of anonymous credit cards,which work either like pre-paid cards or like gift cards.Pre-paid cards need to be charged before usage, giftcards can be bought already containing a certain bal-ance.
Considering the di�erence between free and com-mercial service operators, we cannot preempt theuser's decision to which service is more trustworthy;users have to trust the operator in both cases. Onlythe operator's intention may vary, and range fromcommercially-driven to belief in expression of freedomor the hope of creating a trap to harvest sensitive in-formation.
7 Network Reliability
The next essential aspect, which is particularly im-portant for user satisfaction, is the reliability of thenetwork. We assess it in terms of the failure rate. To
16http://www.paysafecard.com/17http://www.ukash.com
Proceedings of the Ninth Australasian Information Security Conference (AISC 2011), Perth, Australia
83

calculate the failure rate, all unanswered RTT bench-marking requests were counted during the period ofexperiment execution.
A common parameter to describe the failure rateis MTBF, which expresses the Mean Time BetweenFailures of a system. In this context, MTBF is cal-culated as the sum of the uptime periods divided bythe number of downtimes:
MTBF =Σ(tdown − tup)
ndown(4)
where ndown is the number of failures.
We also calculated the Mean Time To Recovery(MTTR), which is computed in the same way asMTBF (Equation 5). In order to evaluate reliability,both factors need to be considered.
MTTR =Σ(tup − tdown)
nup(5)
Tables 3 and 4 show that the loss of RTT con-nections occurred by the free proxy, which is the re-sult of proxy servers going o�-line periodically fromtime to time. During our experiment, we twice had toswitch to a new proxy server. Another issue is relatedto the connection to the webserver in St. Vincent,which showed problems for two hours when some ofthe packets did not get through. The relatively highpacket loss of JonDonym was caused by a service in-terruption of more than two hours. This interruptiononly a�ected JonDonym tra�c to the server in Lux-embourg while all other services were working well,including the connections to St. Vincent. This resultsuggests that there was a problem of connectivity be-tween the �nal JonDonym relay and the server. How-ever, the numbers only present a snapshot and maynot necessarily re�ect the long-term behaviour.
Table 3: Snapshot of MTBF and MTTR - St. Vincent(SV)
AS PL MTBF (SV) MTTR (SV)None 0.33% 72:54:35 0:00:39Free Proxy 2.22% 0:10:05 0:04:14PPA 0.29% 1:20:56 0:01:04PPM 0.37% 1:05:35 0:01:12PPC 0.29% 1:21:14 0:01:12JonDonym 0.36% 1:04:51 0:01:07Tor 0.36% 0:49:49 0:01:00I2P 0.56% 0:19:22 0:01:23
Table 4: Snapshot of MTBF and MTTR - Luxem-bourg (Lux)
AS PL MTBF (Lux) MTTR (Lux)None 0% 144:23:04 0:00:00Free Proxy 2.06% 0:38:54 0:00:59PPA 0.05% 1:02:06 0:01:00PPM 0.06% 0:05:04 0:01:00PPC 0.02% 2:45:55 0:01:10JonDonym 0.76% 3:44:16 1:05:04Tor 0.06% 1:30:04 0:04:44I2P 0.22% 0:02:04 0:45:00
Fig. 9 illustrates the number of unanswered RTTrequests during the measuring period. A high numberof lost messages without the use of any anonymisationsystem is a sign of a general network problem. How-ever, the �gure also shows the in�uence of path selec-tion on reliability. It is again possible to see a high
None PPA PPM PPC Jondo Tor I2P FP
Packet loss
010
020
030
040
050
060
070
0 St. VincentLuxembourg
Figure 9: Lost packets during 6 days
number of lost packets for FP. This result con�rmsour observations during previous tests.
Another observation from reliability tests is thein�uence of the server location. Excluding the freeproxy due its outages, connections to the server in St.Vincent summed up over all services show a higherloss in total (822) compared to Luxembourg (561).The reason for this issue may be a general networkproblem, not related to any anonymisation service.Normalising these results, the number of unansweredRTTs for all services, except I2P and the free proxyserver, is quite low.
8 Economic aspects
Apart from the technical aspects of �nding the appro-priate anonymisation tool, users have also to decideon the economic value/cost. Some services rely on anactive participation where users pay indirectly (Ci) byproviding, e.g., computational resources. Using I2Pfor instance requires provision of bandwidth and com-putational power in order to use the network, while inTor, users have the choice of either donating resourcesby acting as a relay node or as a client only. Payingindirect costs may be negligible in most cases, butmay, on the other hand, limit the maximum achiev-able performance. We calculate Ci as the sum of Cr,Ce and Cb, where Cr is the relaying/routing costs, Cecosts of de- or encryption (computational e�ort) andCb the costs of providing additional bandwidth.
Ci = Σ(Cr, Ce, Cb) (6)
Using commercial anonymisation systems, usershave to pay fees. These direct costs Cd are basedon usage time or data volume. For instance the busi-ness model of Perfect Privacy is based on a monthlyfee, o�ering a data �at rate. JonDonym instead billsaccording to the amount of data. Consequently, theoverall costs are calculated as a sum of the two costs:
C = (Ci + Cd) (7)
The payo� costs for every tool are then calculatedas follows:
Pi =waA ∗ weE ∗ wuU
wrR− wcC (8)
where A is the degree of anonymity, E the e�-ciency, R the reliability and U the usability; w{a,e,u,r,c}
CRPIT Volume 116 - Information Security 2011
84

are the di�erent weights the user de�nes dependingon her particular needs. Consequently, the calcula-tion strongly depends on user requirements and hasto take into account the actual situation.
At �rst glance, users main goal may be a highdegree of anonymity together with a high e�ciencyand reliability of the system at low cost. This doesnot mean that users will not pay for such a service;statistics for Perfect Privacy show about 25,000 con-current connections. Even though this might be notthe accurate statistic, it still shows that a fast andreliable service can attract many users willing to paya certain amount of money. Another example is Tor,with about 300,000 daily users. Tor is also known forits high anonymity and reliability, even at no cost,but with the drawback of poor performance. For thelaunch of future anonymisation systems, especially forcommercial products, the operators need to take allthese aspects into consideration.
9 Conclusion and future work
In this paper, we have de�ned a set of metrics in orderto compare and evaluate �ve already deployed state-of-the-art anonymous communication systems in re-gard to their anonymity, performance, reliability, us-ability, and cost.
Besides the installation, which is relatively simplefor all systems, the usability of the tools is generallygood and should not be a reason for non-use. Usabil-ity does not vary not much from the users' point ofview; they always have to con�gure their application,i.e., web browser, to use a proxy server, a processwhich is practically the same for all tools.
In order to provide a comprehensive comparisonof the anonymisation tools, we ranked them in regardto the power of possible adversaries. Our classi�ca-tion is subjective and may vary from other opinions,but gives users an indication of strength and weak-nesses of corresponding anonymisers. A future goalmight be to simplify the presentation of the resultsand present them to users in a more appropriate way.This will be subject of further work. In addition, wemeasured throughput, RTT, IPDV and failure rateand calculated e�ciencies. The results show that theproxy-based anonymisation systems outperform theOnion Routing approaches in throughput and RTT,but provide less anonymity. This trade-o� appliesto all systems and in the end, the user must decidewhich system best �ts her requirements. However,web browsing is possible using all the tested tools,even though I2P in particular has long response times.Latency-critical applications like VoIP, which rely onhighly responsive networks, are only usable to a cer-tain extent with the the systems we examined.
An important �nding is the e�ciency of thethroughput performance of single proxy solutions.They perform as well the native communication,sometimes even better.
We also observed that the selected anonymisationpath and the recipient's location have a strong in-�uence on performance and reliability. The PerfectPrivacy proxy in Amsterdam, which outperformedthe communication without anonymisation, demon-strates this. In general, all Perfect Privacy proxies wetested, as well as Tor, showed particularly reliabilityin terms of successful connections. While JonDonymand I2P were slightly less reliable, the most unreliableservice was the free proxy service due to a high �uctu-ation of nodes. This demonstrates the main problemwith single-proxy solutions but makes them applica-ble to high-performance short term downloads.
Economics in anonymity is still an under-investigated �eld of research, with only a few publica-
tions. In this paper, we show that besides real costsin terms of money, all relevant aspects such as per-formance, anonymity, reliability, usability, and cost,need to be evaluated in order to calculate system'spayo�. However, as already mentioned, this calcula-tion strongly depends on individual users' preferences.
To summarise our results, we established a com-parison table, containing all examined anonymisationsystems. We classi�ed the systems in �ve groups,expressed on a scale of very good (++), good (+),average(0 ), bad(-) and very bad(- -). Table 5 showsthis classi�cation.
Table 5: Evaluation of anonymous communicationsystems
Anonymisation system V A E R CFree Proxy 0 - - + - - ++Perfect Privacy 0 0 + + -JonDonym 0 0 - + -Tor 0 ++ - - ++ ++I2P 0 + - - + ++
U = Usability, A = Anonymity, E = E�ciency,R = Reliability and C = Cost.
Overall, Tor shows the best results, followed byI2P. They score well in all disciplines except perfor-mance, which is their main weak point. Here, singleproxy solutions score with the best performance.Unfortunately, their degree of anonymity is poor andadditionally reliability leaves much to be desired.JonDonym performs averagely, showing no particularstrength or weakness. However, it is very di�cult toconsider all users' requirements and it is �nally upto them to evaluate the results in order to �nd themost appropriate solution.
To conclude, future work will be necessary in thefollowing areas:
• Extending the usability evaluations by also in-volving less sophisticated users,
• Further investigation of the very high throughputvia certain anonymisation paths,
• Economic aspects need to be evaluated in moredetail, especially in regard to business purposes,
• It may be worthwhile to include social aspectsinto the proposed payo� function, e.g., particulargroup behaviour in an anonymous network.
Overall, this comparison shows the need and mo-tivation to spend further e�ort on the improvementof existing anonymisation services or to work onalternative solutions.
Acknowledgement. This work has been par-tially supported by EC FP7 EFIPSANS project(INFSO-ICT-215549). Furthermore, we would like tothank Dominic for his extensive proof reading.
References
Acquisti, A., Dingledine, R. & Syverson, P. (2003),On the Economics of Anonymity, in R.N. Wright,eds, `Financial Cryptography', Springer LectureNotes in Computer Science, pp. 84�102.
Chaum, D.L. (1981), Untraceable electronic mail, re-turn addresses, and digital pseudonyms , in `ACMJournal of Communication', ACM, pp. 84�90.
Proceedings of the Ninth Australasian Information Security Conference (AISC 2011), Perth, Australia
85

Danezis, G., Dingledine, R. & Mathewson, N. (2003),Mixminion: Design of a Type III Anonymous Re-mailer Protocol , in `Proceedings of the 2003 IEEESymposium on Security and Privacy', IEEE 'Com-puter Society, pp. 2-15.
Díaz, C., Seys, S., Claessens, J. & Preneel, B. (2002),Towards Measuring Anonymity in '`R. Dingledine& P. Syverson, eds, `Privacy Enhancing Technolo-gies', Springer Lecture Notes in Computer Science,pp. 54�68.
Dingledine, R., Mathewson, N. & Syverson, P. (2004),Tor: the second-generation onion router in 'Pro-ceedings of the 13th conference on USENIX Secu-rity Symposium - Volume 13', USENIX Associa-tion, San Diego, CA, p. 21.
Dingledine, R. & Mathewson, N. (2006), AnonymityLoves Company: Usability and the Network E�ectin 'Proceedings of the Fifth Workshop on the Eco-nomics of Information Security (Weis 2006)'.
Dingledine, R. (2009), Tor and circumvention:Lessons learned at '26th Chaos CommunicationCongress', Berlin, Germany.
Edman, M. & Syverson, P. (2009), As-awareness inTor path selection , in `Proceedings of the 16thACM conference on Computer and communicationssecurit (CSS '09)', ACM, pp. 380�389.
Freedman, M.J. & Morris, R. (2002), Tarzan: apeer-to-peer anonymizing network layer , in `Pro-ceedings of the 9th ACM conference on computerand communications security (CCS '02)', ACM, pp.193�206.
Google (2010), Web metrics:Size and number of resources,http://code.google.com/speed/articles/web-metrics.html,[Online; last accessed 2010-10-01].
Kelly, D.J., Raines, R.A., Grimaila, M.R., Bald-win, R.O. & Mullins, B.E. (2008), A survey ofstate-of-the-art in anonymity metrics , in `Proceed-ings of the 1st ACM workshop on network dataanonymization - NDA '08', ACM Press, p. 31.
Kelly, D. (2009), A taxonomy for and analysis ofanonymous communications networks, Ph.D., AirForce Institute of Technology.
Keshav, S. (1999), On individual and aggregate TCPperformance , in `Proceedings of Seventh Inter-national Conference on Network Protocols', IEEEComputer Society Press, pp. 203�212.
Köpsell, S. (2006), Low Latency Anonymous Commu-nication How Long Are Users Willing to Wait? , in`Journal of Emerging Trends in Information andCommunication', Volume 3995 Springer, LectureNotes in Computer Science, Berlin / Heidelberg,pp. 221�237.
Möller, U., Cottrell, L., Palfrader, P. & Sassamanm L.(2003), Mixmaster Protocol � Version 2, in 'IETFInternet Draft', IETF.
Murdoch S.J. & Watson, R.N.M. (2008), Metricsfor Security and Performance in Low-LatencyAnonymity Systems, in `N. Borisov & I. Goldberg,eds, `Privacy Enhancing Technologies', SpringerLecture Notes in Computer Science, pp. 115�132.
Ngan, T.-W., Dingledine, R. & Wallach, D.S. (2010),Building Incentives into To, in R. Sion, ed, `Fi-nancial Cryptography', Springer Lecture Notes inComputer Science, pp. 238�256.
Panchenko, A., Herrmann, D., Wendolsky, R. & Fed-errath, H. (2009), Website �ngerprinting: attackingpopular privacy enhancing technologies with themultinomial naïve-bayes classi�er, in `Proceedingsof the 2009 ACM workshop on Cloud computingsecurity', ACM, Chicago, Il, USA, pp. 31�42.
P�tzmann, A. & Hansen, M. (2009), A termi-nology for talking about privacy by data mini-mization: Anonymity, Unlinkability, Undetectabil-ity, Unobservability, Pseudonymity, and Iden-tity Management , Online: 'http://dud.inf.tu-dresden.de/Anon_Terminology.shtml'.
Pries, R., Yu, W., Graham, S. & Fu, X. (2008),On performance bottleneck of anonymous commu-nication networks , in `22nd IEEE InternationalSymposium on Parallel and Distributed Process-ing, IPDPS 2008', IEEE Computer Society Press,Miami, Florida USA, pp. 1�11.
Raymond, J.-F. (2000), Tra�c Analysis: Protocols,Attacks, Design Issues, and Open Problems , in`Proceedings of Designing Privacy Enhancing Tech-nologies: Workshop on Design Issues in Anonymityand Unobservability', Springer Verlag, pp. 10-29.
Reed, M.G., Syverson, P.F. & Goldschlag, D.M.(1998), Anonymous connections and onion routing, in `IEEE Journal on Selected Areas in Communi-cations', IEEE Computer Society, pp. 482�494.
Ren J. & Wu, J. (2009), Survey on anonymous com-munications in computer networks, in `ComputerCommunications' Volume 33, Issue 4, pp. 420-431.
Rennhard, M. & Plattner, B. (2002), IntroducingMorphMix: peer-to-peer based anonymous Inter-net usage with collusion detection, in `Proceedingsof the 2002 ACM workshop on Privacy in the Elec-tronic Society (WPES '02)', ACM, pp. 91�102.
Snader, R. & Borisov, N. (2008), A Tune-up for Tor:Improving Security and Performance in the TorNetwork , in `Proceedings of the Network and Dis-tributed Security Symposium - NDSS '08', InternetSociety.
Wendolsky, R., Herrmann, D. & Federrath, H.(2007), Performance Comparison of Low-LatencyAnonymisation Services from a User Perspective, in`', N. Borisov & P. Golle, eds, `Privacy EnhancingTechnologies', Springer Lecture Notes in ComputerScience, pp. 233�253.
Wharton, C., Bradford, J., Je�ries, R. & Franzke, M.(1992), Applying cognitive walkthroughs to morecomplex user interfaces: experiences, issues, andrecommendations, in `Proceedings of the SIGCHIconference on Human factors in computing sys-tems', ACM Press, Monterey, CA, pp. 381�388.
Wright, M., Adler, M, Levine, B. N. & Shields,C. (2003), Defending Anonymous CommunicationAgainst Passive Logging Attacks , in `Proceedingsof the 2003 IEEE Symposium on Security and Pri-vacy', IEEE Computer Society, pp. 28�.
CRPIT Volume 116 - Information Security 2011
86

Author Index
Agnesse, Andrea, 9
Baba, Kensuke, 3Bai, Yun, 51Boyd, Colin, iiiBubendorfer, Kris, 67
Campbell, Scott, 57Chan, Steve, 57Clark, Andrew, 23Corney, Malcolm, 23
Gao, Xiaoying, 33
Ikeda, Daisuke, 3Inenaga, Shunsuke, 3
Kaosar, Md. Golam, 15Khan, Khaled, 51Komisarczuk, Peter, 33
Lackner, Gnther, 41Le, Van Lam, 33
Lee, Jason, 57
Mohay, George, 23
Nakamura, Toru, 3
Palmer, Ben, 67Panchenko, Andriy, 77Paulet, Russell, 15Pedicini, Marco, 9Pieprzyk, Josef, iii
Ries, Thorsten, 77
State, Radu, 77
Teufl, Peter, 41
Welch, Ian, 33, 67
Yasuura, Hiroto, 3Yi, Xun, 15
Proceedings of the Ninth Australasian Information Security Conference (AISC 2011), Perth, Australia
87

Recent Volumes in the CRPIT Series
ISSN 1445-1336
Listed below are some of the latest volumes published in the ACS Series Conferences in Research andPractice in Information Technology. The full text of most papers (in either PDF or Postscript format) isavailable at the series website http://crpit.com.
Volume 91 - Computer Science 2009Edited by Bernard Mans Macquarie University.January, 2009. 978-1-920682-72-9.
Contains the proceedings of the Thirty-Second Australasian Computer Science Conference(ACSC2009), Wellington, New Zealand, January 2009.
Volume 92 - Database Technologies 2009Edited by Xuemin Lin, University of NewSouth Wales and Athman Bouguettaya, CSIRO.January, 2009. 978-1-920682-73-6.
Contains the proceedings of the Twentieth Australasian Database Conference (ADC2009),Wellington, New Zealand, January 2009.
Volume 93 - User Interfaces 2009Edited by Paul Calder Flinders University andGerald Weber University of Auckland. January,2009. 978-1-920682-74-3.
Contains the proceedings of the Tenth Australasian User Interface Conference (AUIC2009),Wellington, New Zealand, January 2009.
Volume 94 - Theory of Computing 2009Edited by Prabhu Manyem, University ofBallarat and Rod Downey, Victoria University ofWellington. January, 2009. 978-1-920682-75-0.
Contains the proceedings of the Fifteenth Computing: The Australasian Theory Symposium(CATS2009), Wellington, New Zealand, January 2009.
Volume 95 - Computing Education 2009Edited by Margaret Hamilton, RMIT Universityand Tony Clear, Auckland University of Technol-ogy. January, 2009. 978-1-920682-76-7.
Contains the proceedings of the Eleventh Australasian Computing Education Conference(ACE2009), Wellington, New Zealand, January 2009.
Volume 96 - Conceptual Modelling 2009Edited by Markus Kirchberg, Institute for In-focomm Research, A*STAR, Singapore and Se-bastian Link, Victoria University of Wellington,New Zealand. January, 2009. 978-1-920682-77-4.
Contains the proceedings of the Fifth Asia-Pacific Conference on Conceptual Modelling(APCCM2008), Wollongong, NSW, Australia, January 2008.
Volume 97 - Health Data and Knowledge Management 2009Edited by James R. Warren, University of Auck-land. January, 2009. 978-1-920682-78-1.
Contains the proceedings of the Third Australasian Workshop on Health Data and KnowledgeManagement (HDKM 2009), Wellington, New Zealand, January 2009.
Volume 98 - Information Security 2009Edited by Ljiljana Brankovic, University of New-castle and Willy Susilo, University of Wollon-gong. January, 2009. 978-1-920682-79-8.
Contains the proceedings of the Australasian Information Security Conference (AISC 2009),Wellington, New Zealand, January 2009.
Volume 99 - Grid Computing and e-Research 2009Edited by Paul Roe and Wayne Kelly, QUT.January, 2009. 978-1-920682-80-4.
Contains the proceedings of the Australasian Workshop on Grid Computing and e-Research(AusGrid 2009), Wellington, New Zealand, January 2009.
Volume 100 - Safety Critical Systems and Software 2007Edited by Tony Cant, Defence Science and Tech-nology Organisation, Australia. December, 2008.978-1-920682-81-1.
Contains the proceedings of the 13th Australian Conference on Safety Critical Systems andSoftware, Canberra, Australia, December, 2008.
Volume 101 - Data Mining and Analytics 2009Edited by Paul J. Kennedy, University of Tech-nology, Sydney, Kok–Leong Ong, Deakin Univer-sity and Peter Christen, The Australian NationalUniversity. November, 2009. 978-1-920682-82-8.
Contains the proceedings of the 8th Australasian Data Mining Conference (AusDM 2009),Melbourne, Victoria, Australia, November, 2009.
Volume 102 - Computer Science 2010Edited by Bernard Mans, Macquarie Univer-sity, Australia and Mark Reynolds, Universityof Western Australia, Australia. January, 2010.978-1-920682-83-5.
Contains the proceedings of the Thirty-Third Australasian Computer Science Conference(ACSC 2010), Brisbane, Queensland, Australia, January 2010.
Volume 103 - Computing Education 2010Edited by Tony Clear, Auckland University ofTechnology, New Zealand and John Hamer, Uni-versity of Auckland, New Zealand. January,2010. 978-1-920682-84-2.
Contains the proceedings of the Twelfth Australasian Computing Education Conference (ACE2010), Brisbane, Queensland, Australia, January 2010.
Volume 104 - Database Technologies 2010Edited by Heng Tao Shen, University ofQueensland, Australia and Athman Bouguet-taya, CSIRO ICT Centre, Australia. January,2010. 978-1-920682-85-9.
Contains the proceedings of the Twenty-First Australasian Database Conference (ADC 2010),Brisbane, Queensland, Australia, January 2010.
Volume 105 - Information Security 2010Edited by Colin Boyd, Queensland Universityof Technology, Australia and Willy Susilo, Uni-versity of Wollongong, Australia. January, 2010.978-1-920682-86-6.
Contains the proceedings of the Eight Australasian Information Security Conference (AISC2010), Brisbane, Queensland, Australia, January 2010.
Volume 106 - User Interfaces 2010Edited by Christof Lutteroth, University ofAuckland, New Zealand and Paul CalderFlinders University, Australia. January, 2010.978-1-920682-87-3.
Contains the proceedings of the Eleventh Australasian User Interface Conference (AUIC2010),Brisbane, Queensland, Australia, January 2010.
Volume 107 - Parallel and Distributed Computing 2010 2010Edited by Jinjun Chen, Swinburne University ofTechnology, Australia and Rajiv Ranjan, Uni-versity of New South Wales, Australia. January,2010. 978-1-920682-88-0.
Contains the proceedings of the Eigth Australasian Symposium on Parallel and DistributedComputing (AusPDC 2010), Brisbane, Queensland, Australia, January 2010.
Volume 108 - Health Informatics and Knowledge Management 2010Edited by Anthony Maeder, University of West-ern Sydney, Australia and David Hansen, CSIROAustralian e-Health Research Centre, Australia.January, 2010. 978-1-920682-89-7.
Contains the proceedings of the Fourth Australasian Workshop on Health Informatics andKnowledge Management (HIKM 2010), Brisbane, Queensland, Australia, January 2010.
CRPIT Volume 116 - Information Security 2011
88

Volume 109 - Theory of Computing 2010Edited by Taso Viglas, University of Sydney,Australia and Alex Potanin, Victoria Universityof Wellington, New Zealand. January, 2010. 978-1-920682-90-3.
Contains the proceedings of the Sixteenth Computing: The Australasian Theory Symposium(CATS 2010), Brisbane, Queensland, Australia, January 2010.
Volume 110 - Conceptual Modelling 2010Edited by Sebastian Link, Victoria University ofWellington, New Zealand and Aditya Ghose, Uni-versity of Wollongong, Australia. January, 2010.978-1-920682-92-7.
Contains the proceedings of the Seventh Asia-Pacific Conference on Conceptual Modelling(APCCM2010), Brisbane, Queensland, Australia, January 2010.
Volume 112 - Advances in Ontologies 2009Edited by Edited by Thomas Meyer, Meraka In-stitute, South Africa and Kerry Taylor, CSIROICT Centre, Australia. December, 2009. 978-1-920682-91-0.
Contains the proceedings of the Australasian Ontology Workshop 2009 (AOW 2009), Mel-bourne, Australia, December, 2009.
Proceedings of the Ninth Australasian Information Security Conference (AISC 2011), Perth, Australia
89

CRPIT Volume 116 - Information Security 2011
90


