33
Information Technology Finance 724/824 SIM Class
| Date post: | 03-Jan-2016 |
| Category: |
Documents |
| Upload: | crystal-lloyd |
| View: | 219 times |
| Download: | 0 times |

Information Technology
Finance 724/824SIM Class

Agenda• Sector Overview• Business Analysis• Economic Analysis• Financial Evaluation• Valuation• Recommendation
Agenda

SIM Portfolio CompositionS&P 500 Weight
SIM Weight
Consumer Discretionary 9.52% 7.93%
Consumer Staples 12.04% 13.06%
Energy 12.51% 11.31%
Financials 12.19% 8.14%
Health Care 13.83% 17.74%
Industrials 10.44% 9.44%
Information Technology 18.40% 19.92%
Materials 3.37% 3.88%
Telecommunication Services 3.71% 2.40%
Utilities 3.98% 2.50%
Cash 0.00% 3.69%
SIM Portfolio Composition
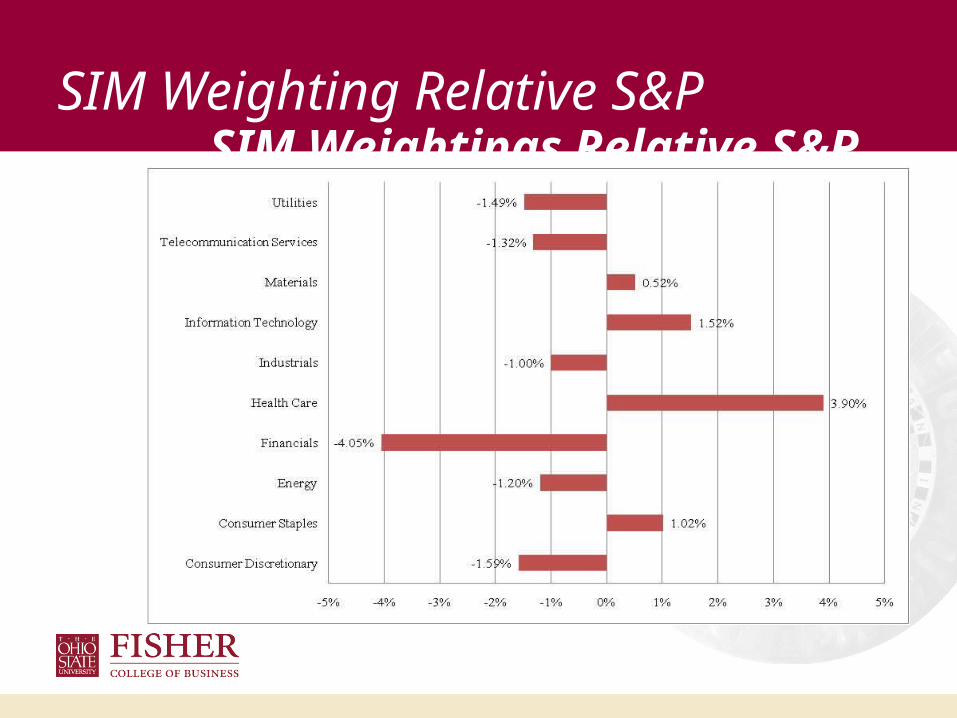
SIM Weightings Relative S&P 500
SIM Weighting Relative S&P

SIM Weightings Relative S&P 500
IT Historical Weighting

Price Change YTD 15.10%
Dividend YLD 1.10%
Price to Earnings 14
Market Capitalization 82.1 Billion
Institutional Ownership 74%
% LT Debt to Cap 17%
Key Ratios & Measures 5 - Year Range Current
P/E 9 - 39 14
Price to Book 2 - 5 3.1
Price to Cash Flow 6.9 - 17.9 9.9
Price to Sales 1.1 - 3 1.65
Return on Equity 18.7% - 22.5% 21.70%
Earnings $ % Change
Latest Quarter (Dec 08) 4.4 -23.0%
Latest 12 Months 19.12 1.0%
Revenues (Per Share) $ % Change
Latest Quarter (Dec 08) 38.95 -8.0%
Latest 12 Months 161.5 4.0%
Dividends % % Change
Indicated Rate & Yield 3.07 1.10%
IT Summary

Historical Earnings
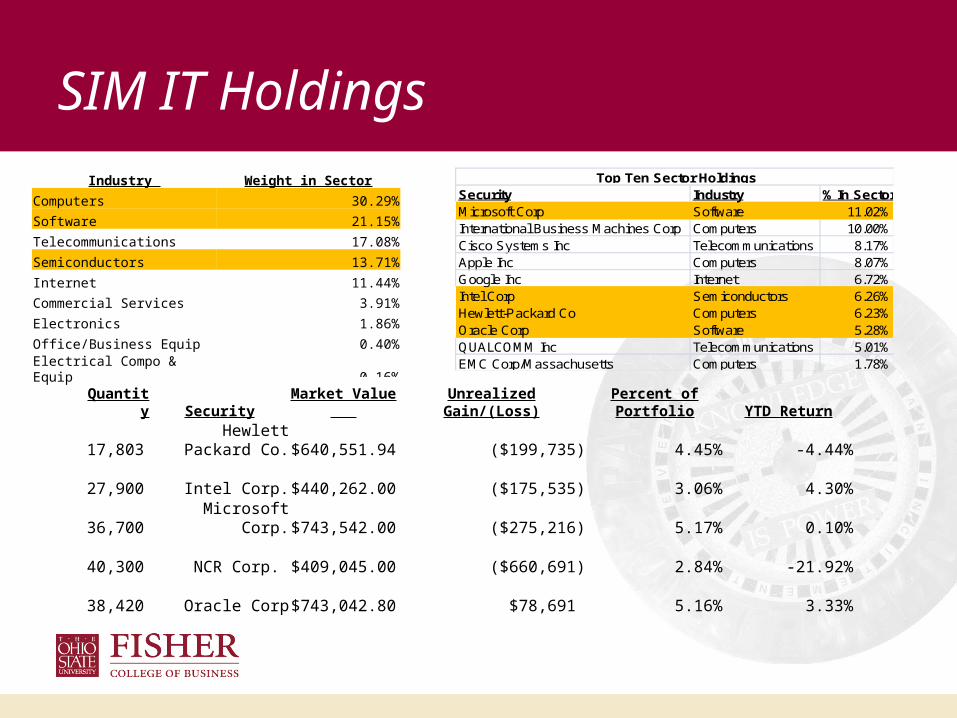
SIM IT HoldingsIndustry Weight in Sector
Computers 30.29%
Software 21.15%
Telecommunications 17.08%
Semiconductors 13.71%
Internet 11.44%
Commercial Services 3.91%
Electronics 1.86%
Office/Business Equip 0.40%
Electrical Compo & Equip 0.16%
Quantity Security Market Value Unrealized Gain/(Loss)Percent of Portfolio YTD Return
17,803
Hewlett Packard Co. $640,551.94 ($199,735) 4.45% -4.44%
27,900 Intel Corp. $440,262.00 ($175,535) 3.06% 4.30% 36,700 Microsoft Corp. $743,542.00 ($275,216) 5.17% 0.10% 40,300 NCR Corp. $409,045.00 ($660,691) 2.84% -21.92% 38,420 Oracle Corp $743,042.80 $78,691 5.16% 3.33%
Security Industry % In SectorMicrosoft Corp Software 11.02%International Business Machines Corp Computers 10.00%Cisco Systems Inc Telecommunications 8.17%Apple Inc Computers 8.07%Google Inc Internet 6.72%Intel Corp Semiconductors 6.26%Hewlett-Packard Co Computers 6.23%Oracle Corp Software 5.28%QUALCOMM Inc Telecommunications 5.01%EMC Corp/Massachusetts Computers 1.78%
Top Ten Sector Holdings

Business Analysis
• Diverse sector with a focus on computer technology.• Innovation is a key driver for success within the sector.• High R&D costs are required to generate future growth.• Industry is very cyclical. Often seen to lead the economy
out of down cycles.

Business Analysis (cont.)
• High Barriers to Entry.• Corporate spending may have slowed in the face of
current economic conditions. As the economy picks up we feel corporate IT spending will follow.
• Substitution is not an issue, continued growth in IT will depend on innovation and new market penetration.

Barrowed from Merrill Lynch
Business Cycle Analysis

Why is it still “Growth” time?

Why is it still “Growth” time?
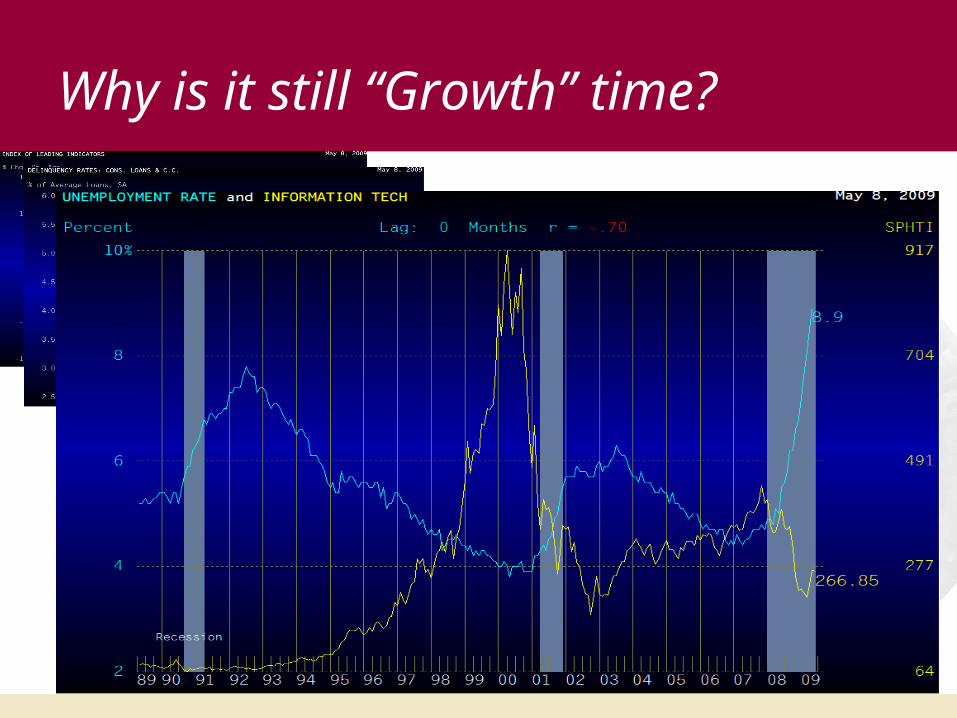
Why is it still “Growth” time?
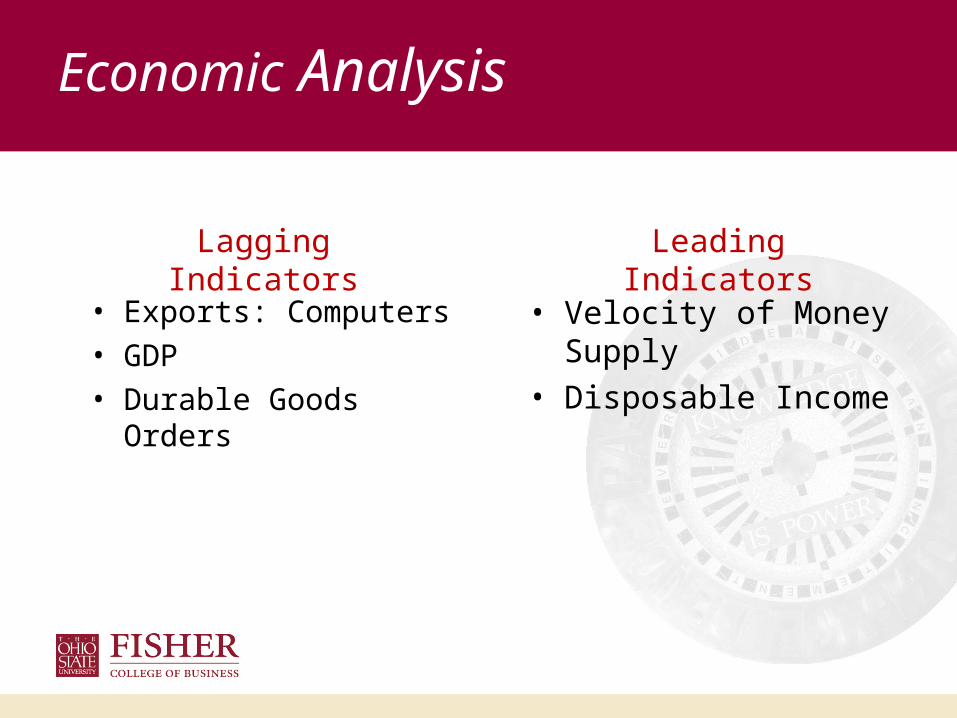
Economic Analysis
• Lagging Indicators• Leading Indicators

• Exports: Computers• GDP• Durable Goods Orders
Lagging Indicators
Economic Analysis

Export: Computers vs. IT
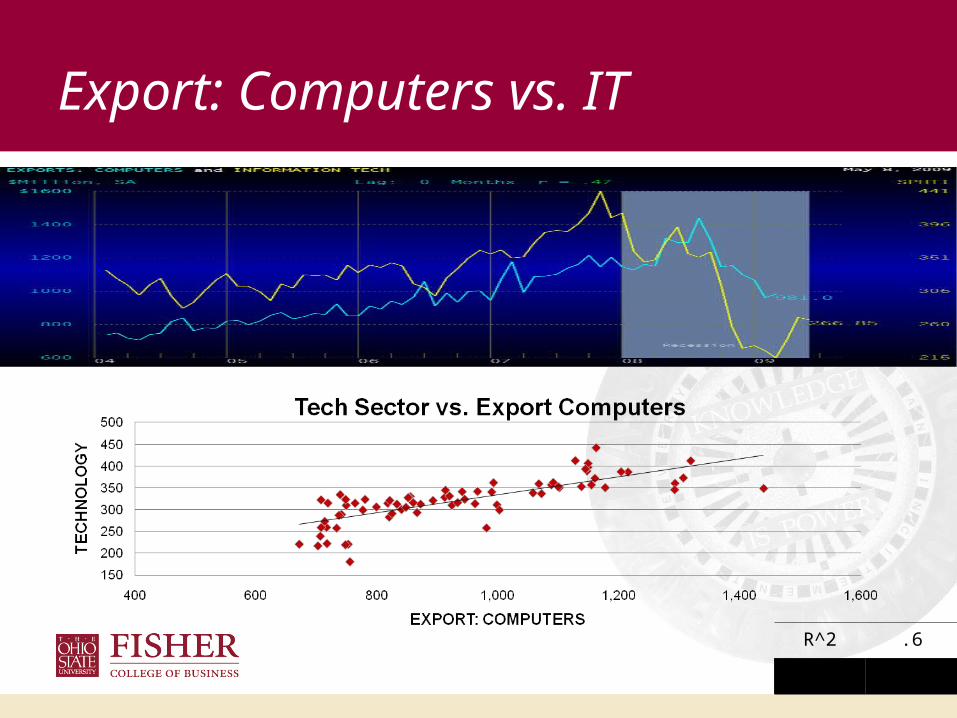
Export: Computers vs. IT
R^2 .6
T-Stat 10.39

GDP & Durable Goods vs. IT
Economic Analysis
• Exports: Computers• GDP• Durable Goods Orders
• Velocity of Money Supply• Disposable Income
Lagging Indicators Leading Indicators
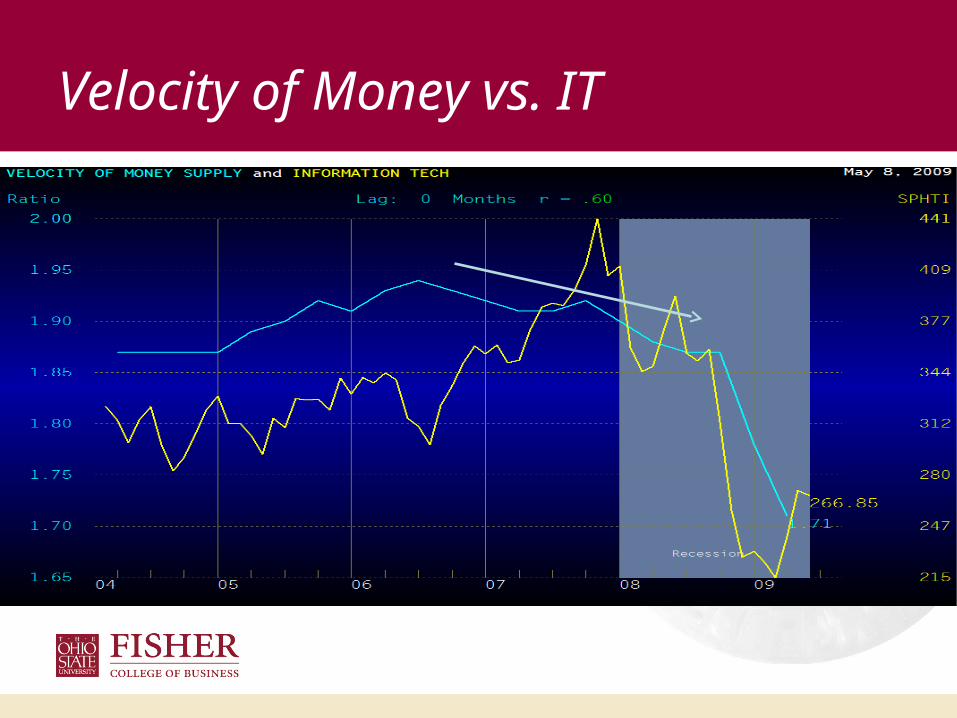
Velocity of Money vs. IT

What is the Velocity of Money?
The velocity of money is the average frequency with which a unit of money is spent in a specific period of time. Velocity associates the amount of economic activity associated with a give money supply.
Where:
VT = the velocity of money for all transactions
nT = the nominal value of aggregate transactions
M = the total amount of money in circulation (Money Supply)

Disposable Income vs. IT

Absolute
High 24.6
Low 12.1
Median 20.4
Current 16.8
Price/ Earnings - Forward
Relative to S&P 500
High 1.4
Low .98
Median 1.3
Current 1.1

RELATIVE TO S&P 500
Price/ Earnings - Trailing
Relative to S&P 500
Absolute
High 31.5
Low 11.1
Median 22.5
Current 14.0
High 1.6
Low .91
Median 1.3
Current 1.0

RELATIVE TO S&P 500
Price / Book
Relative to S&P 500
Absolute
High 4.8
Low 2.3
Median 4.0
Current 3.1
High 1.7
Low 1.2
Median 1.4
Current 1.5

RELATIVE TO S&P 500
Price / Sales
Relative to S&P 500
Absolute
High 3.1
Low 1.3
Median 2.6
Current 1.7
High 2.0
Low 1.5
Median 1.7
Current 1.9

RELATIVE TO S&P 500
Price / Cash Flow
Relative to S&P 500
Absolute
High 17.7
Low 8.0
Median 14.7
Current 9.9
High 1.6
Low 1.1
Median 1.4
Current 1.3

RELATIVE TO S&P 500
Net Profit Margin
Relative to S&P 500
Absolute
High 12.2
Low 11.0
Median 11.3
Current 11.8
High 1.8
Low 1.2
Median 1.3
Current 1.8

RELATIVE TO S&P 500
Return on Equity
Relative to S&P 500
Absolute
High 22.5
Low 16.7
Median 19.5
Current 21.7
High 1.5
Low 0.9
Median 1.1
Current 1.5

5- Year High Low Median Current
P/E Forward 24.6 12.1 20.4 16.8
P/E Trailing 31.5 11.1 22.5 14.0
P/B 4.8 2.3 4.0 3.1
P/S 3.1 1.3 2.6 1.7
P/CF 17.1 8.0 14.7 9.9
Net Prft Mrg 12.2 11.0 11.3 11.8
ROE 22.5 16.7 19.5 21.7
Valuation Analysis Summary
• Of the 13 industries with Rising Relative strength in S&P 500, 6 are in the Info Tech Sector. On March 24, S&P Equity Strategy upgraded the technology sector to overweight from market weight.
• Above average balance sheet strength and potential to continue outgrowing the overall economy.
• Industry leaders in this Sector trade predominantly in the U.S Stock market.
• Sector is less cyclical than it was earlier this decade. Many tech companies’ offerings are essential to operate and grow businesses, and they can often help firms save money and be more efficient.
Reason to Invest in Info Tech

Recommendation
• We recommend maintaining the current SIM IT weight within the portfolio.
• Although industries within the sector can be dependent on consumer spending patterns, this should not be enough to negatively impact the entire sector.
• There is potential upside from funds designated to IT spending from US stimulus plan.


