This reproduction was made from a copy of a document sent to us for microfilming. While the most advanced technology has been used to photograph and reproduce this document, the quality of the reproduction is heavily dependent upon the quality of the material submitted.
The following explanation of techniques is provided to help clarify markings or notations which may appear on this reproduction.
1.The sign or "target" for pages apparently lacking from the document photographed is "Missing Page(s)". If it was possible to obtain the missing page(s) or section, they are spliced into the film along with adjacent pages. This may have necessitated cutting through an image and duplicating adjacent pages to assure complete continuity.
2. When an image on the film is obliterated with a round black mark, it is an indication of either blurred copy because of movement during exposure, duplicate copy, or copyrighted materials that should not have been filmed. For blurred pages, a good image of the page can be found in the adjacent frame. If copyrighted materials were deleted, a target note will appear listing the pages in the adjacent frame.
3. When a map, drawing or chart, etc., is part of the material being photographed, a definite method of "sectioning" the material has been followed. It is customary to begin filming at the upper left hand corner of a large sheet and to continue from left to right in equal sections with small overlaps. If necessary, sectioning is continued again—beginning below the first row and continuing 011
until complete.
4. For illustrations that cannot be satisfactorily reproduced by xerographic means, photographic prints can be purchased at additional cost and inserted into your xerographic copy. These prints are available upon request from the Dissertations Customer Services Department.
5. Some pages in any document may have indistinct print. In all cases the best available copy has been filmed.
University Microfilms
International 300 N. Zeeb Road Ann Arbor, Ml 48106
1324576
CRABB, CYNTHIA LYNNE
ODOROUS EMISSIONS FROM NEW CARPETING DEVELOPMENT OF FIELD-MONITORING AND ANALYTICAL TECHNIQUE
THE UNIVERSITY OF ARIZONA M.S. 1984
University Microfilms
International 300 N. Zeeb Road, Ann Arbor, MI 48106
ODOROUS EMISSIONS FROM NEW CARPETING
DEVELOPMENT OF FIELD-MONITORING AND ANALYTICAL TECHNIQUE
by
Cynthia Lynne Crabb
A Thesis Submitted to the Faculty of the
COMMITTEE ON TOXICOLOGY
In Partial Fulfillment of the Requirements For the Degree of
MASTER OF SCIENCE
In the Graduate College
THE UNIVERSITY OF ARIZONA
1984
STATEMENT BY AUTHOR
This thesis has been submitted in partial fulfillment of requirements for an advanced degree at The University of Arizona and is deposited in the University Library to be made available to borrowers under rules of the Library.
Brief quotations from this thesis are allowable without special permission, provided that accurate acknowledgement of source is made. Requests for permission for extended quotation from or reproduction of this manuscript in whole or in part may be granted by the head of the major department or the Dean of the Graduate Col lege when in his or her judgement the proposed use of the material in in the interests of scholarship. In all other instances, however, permission must be obtained from the author.
SIGNED:
APPROVAL BY THESIS DIRECTOR
This thesis has been approved on the date shown below:
>/c cy#*- /? /?/'/ Dr. M. Van Ert ~ Date Adjunct Assistant Professor of Occupational Safety and Health
Cisdz, % J L , / 7 / f / y Dr. D. E. Carter Associate Professor of Toxicology
ACKNOWLEDGEMENTS
For their understanding, encouragement and assistance during
the course of my graduate studies, I am indebted to my parents and
the rest of my family.
I am particularly grateful to Drs. Mark E. VanErt and
Dean E. Carter for their friendship, advice and counsel.
Appreciation also goes to Dr. J. Wesley Clayton and
Michael D, Lebowitz for their participation on my committee.
I wish to thank Dr. Gene Orf, Swede Kjellesvik, Cary Kittrell,
and Susan Hopf for their assistance during the course of this study.
iii
TABLE OF CONTENTS
Page
LIST OF ILLUSTRATIONS v
LIST OF TABLES . . . . vii
ABSTRACT viii
INTRODUCTION 1
LITERATURE REVIEW: INDOOR AIR POLLUTION 3
Basis for Concern 3 Potential Exposures < 4 Sources of Indoor Air Pollution 7 The Problem of Ventilation 10 The Issue of Public Policy 11 Carpet Emissions 13
MATERIALS AND METHODS 20
Preliminary GC-MS Analysis of Carpet Emissions 20 Development of GC Technique 21 GC Analysis of Emissions from Stock Carpet Samples ... 24 Environmental Sampling and Analysis 26 Confirmation of Identification by CC-MS 27
RESULTS 29
Preliminary GC-MS Analysis of Carpet Emissions 29 Development of GC Technique 37 GC Analysis of Emissions from Stock Carpet Samples ... 45 Environmental Sampling and Analysis 48 Confirmation of Identification by GC-MS 49
DISCUSSION 62
SELECTED BIBLIOGRAPHY 67
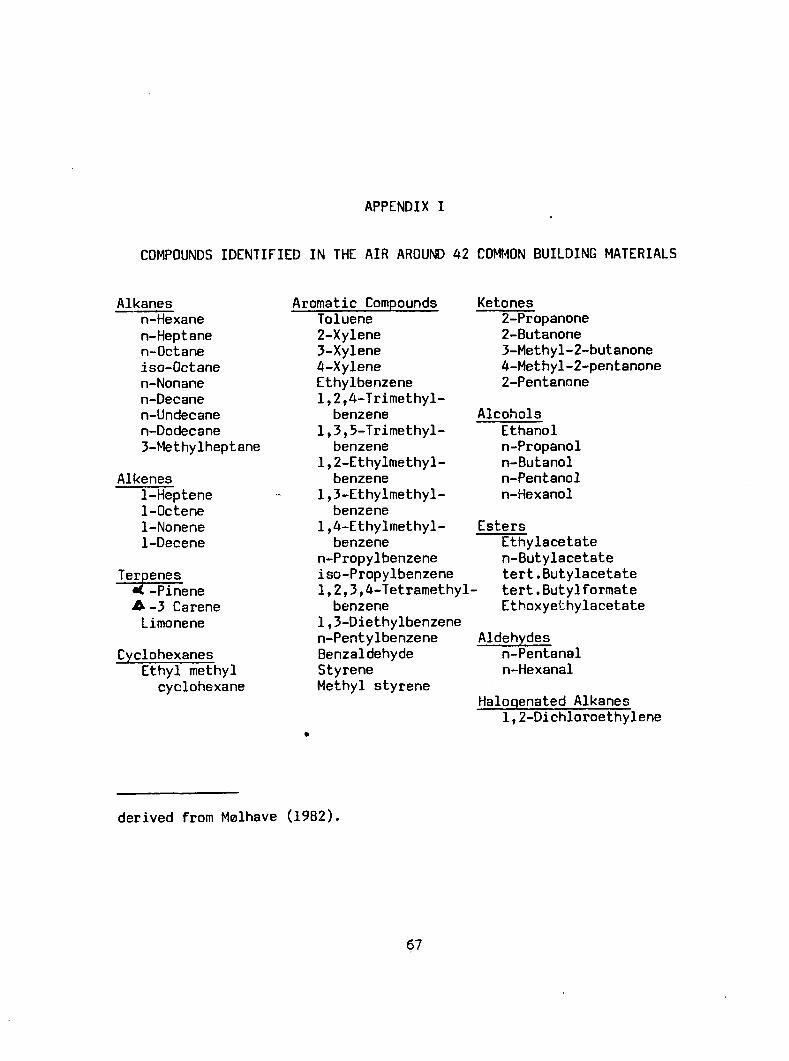
APPENDIX I: COMPOUNDS IDENTIFIED IN THE AIR AROUND 42 COMMON BUILDING MATERIALS 71
APPENDIX II: SYMPTOMS REPORTED AFTER NEW CARPET INSTALLATION . 72
APPENDIX III: RECOMMENDED TOXICOLOGICAL STUDIES FOR 1-PHENYL-3-CYCLOHEXENE 73
iv
LIST OF ILLUSTRATIONS
Figure Page
1. Construction of Carpets: Spinning, Plying, Tufting, Carpet Backing 15
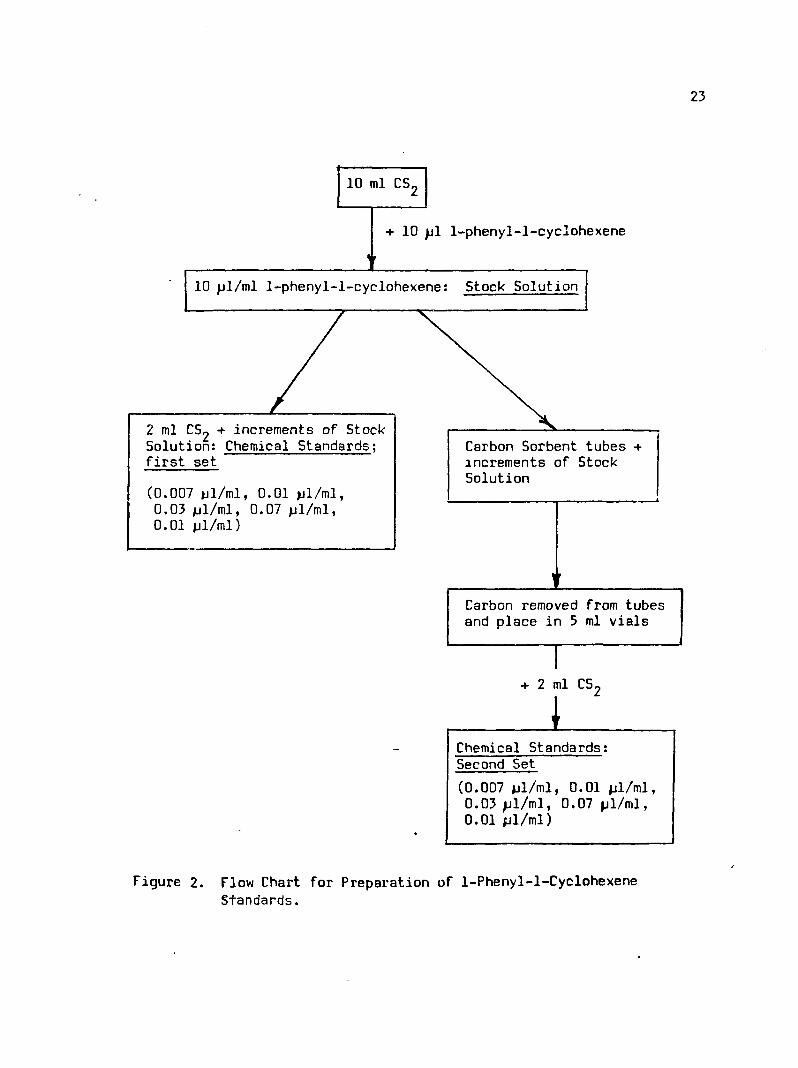
2. Flow Chart for Preparation of 1-Phenyl-l-Cyclohexene Standards 23
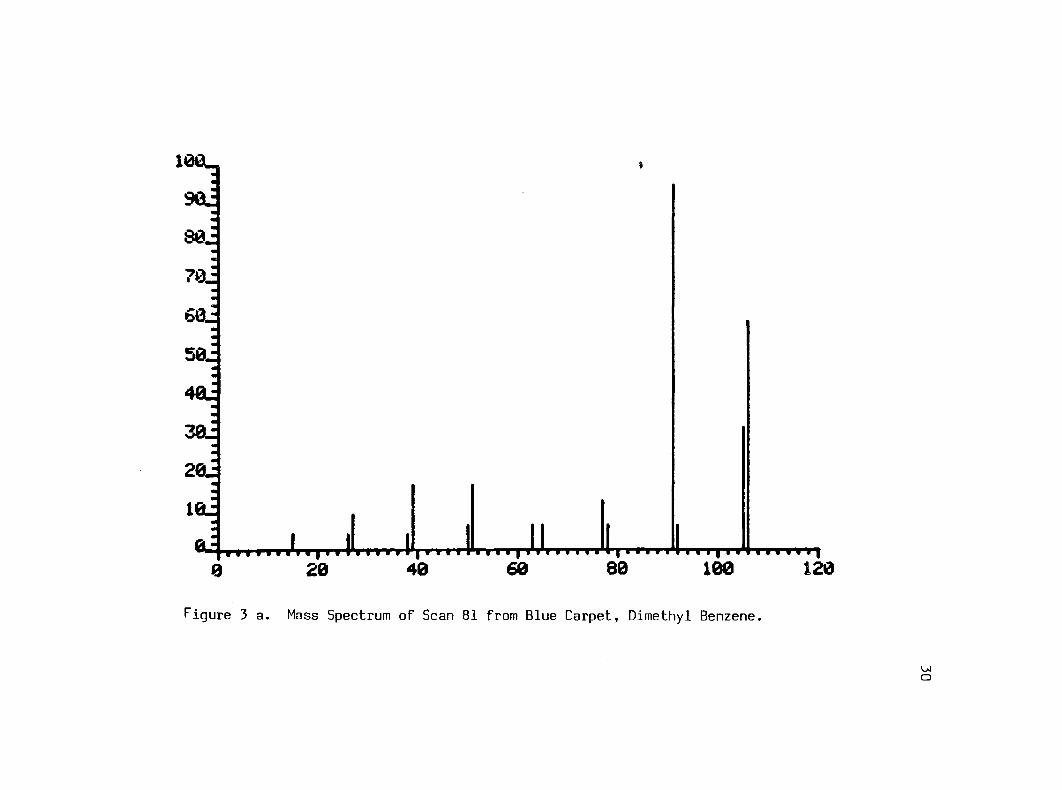
3 a. Mass Spectrum of Scan 81 from Blue Carpet, Dimethyl Benzene 30
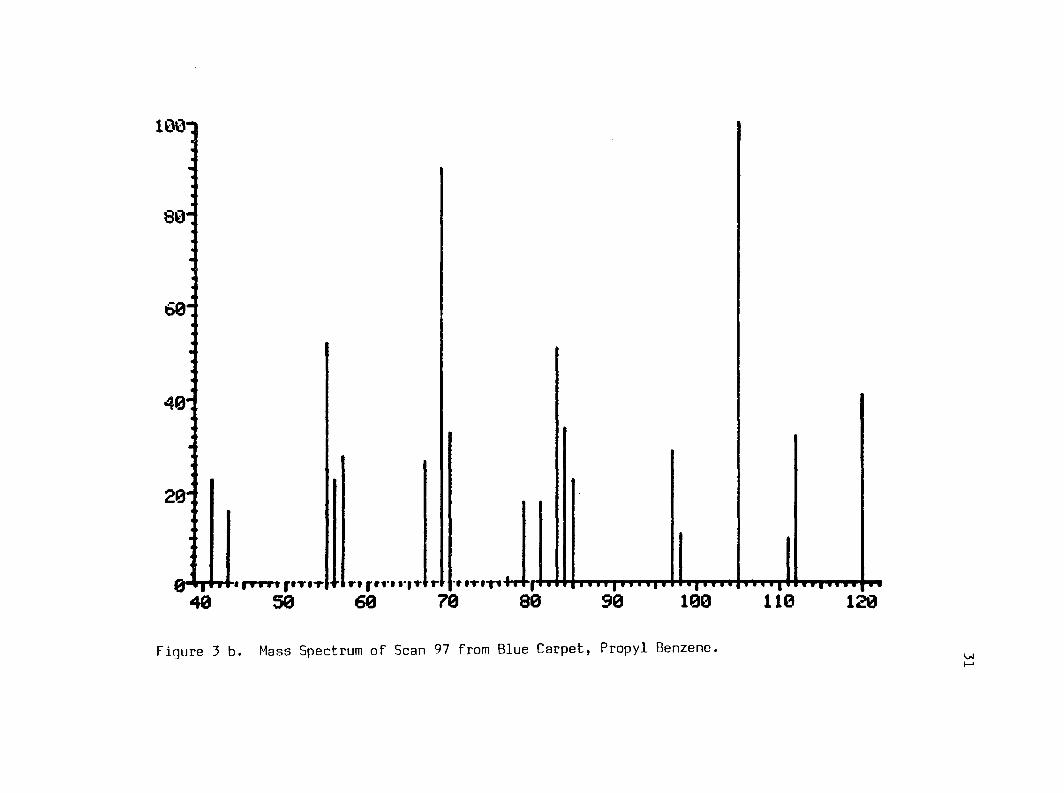
b. Mass Spectrum of Scan 97 from Blue Carpet, Propyl Benzene 31
c. Mass Spectrum of Scan 260 from Blue Carpet, Phenyl-3-Cyclohexene 32
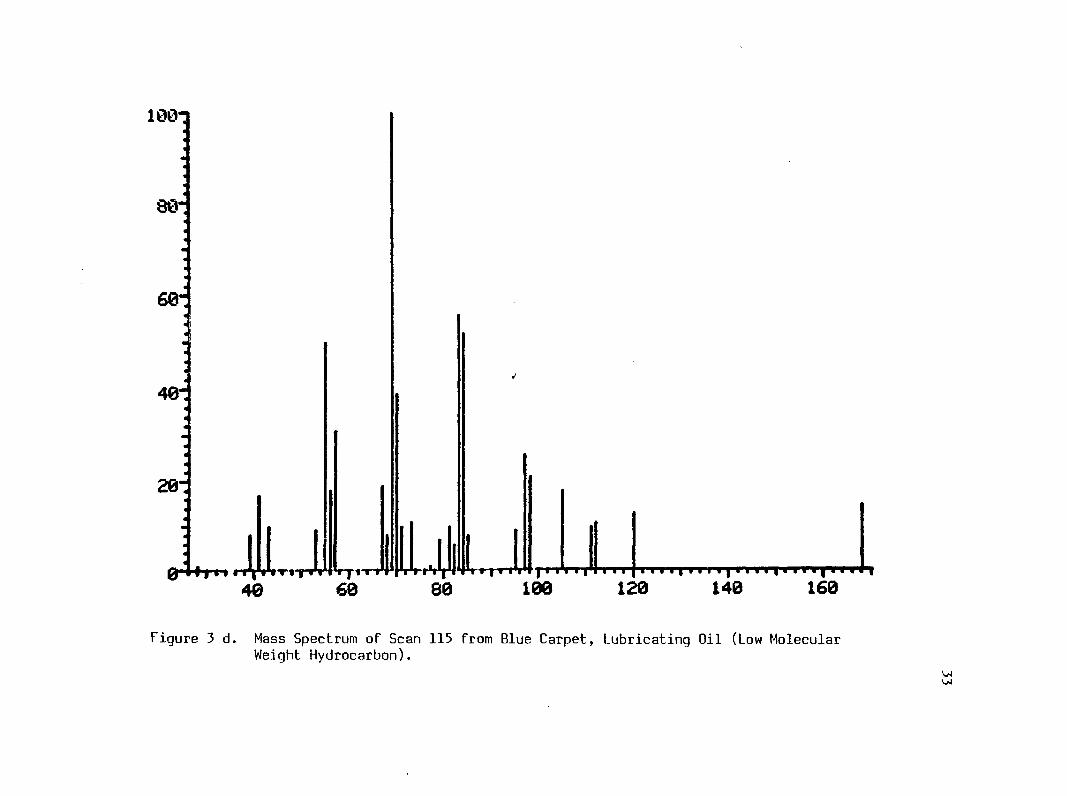
d. Mass Spectrum of Scan 115 from Blue Carpet, Lubricating Oil (Low Molecular Weight Hydrocarbon) . . 33
4 a. Mass Spectrum of Scan 81 from Brown Carpet, Linear Hydrocarbon 34
b. Mass Spectrum of Scan 108 from Brown Carpet, Lubricating Oil (Low Molecular Weight Hydrocarbon) . . 35
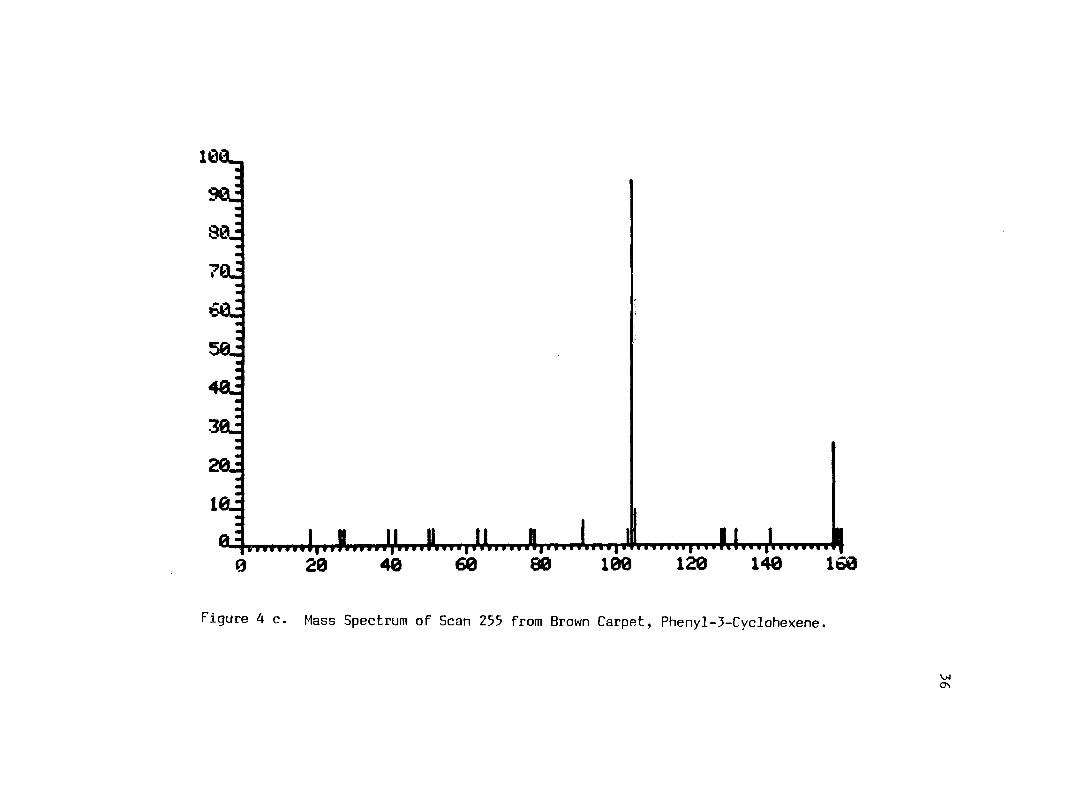
c. Mass Spectrum of Scan 255 from Brown Carpet, Phenyl-3-Cyclohexene 36
5 a. Mass Spectrum of Scan 232 from Toluene Solution of Carpet Backing, Residual Toluene 38
b. Mass Spectrum of Scan 470 from Toluene Solution of Carpet Backing, Phenyl-3-Cyclohexene 39
c. Mass Spectrum of Scan 636 from Toluene Solution of Carpet Backing, Lubricant (Low Molecular Weight Hydrocarbon) 40
d. Mass Spectrum of Scan 649 from Toluene Solution of Carpet Backing, Butylated Hydroxytoluene (BHT), an Antioxidant .... 41
e. Mass Spectrum of Scan 1117 from Toluene Solution of Carpet Backing, Possibly a Luw Molecular Weight Amide from the Carpet Fiber 42
v
LIST OF ILLUSTRATIONS—Continued
Figure Page
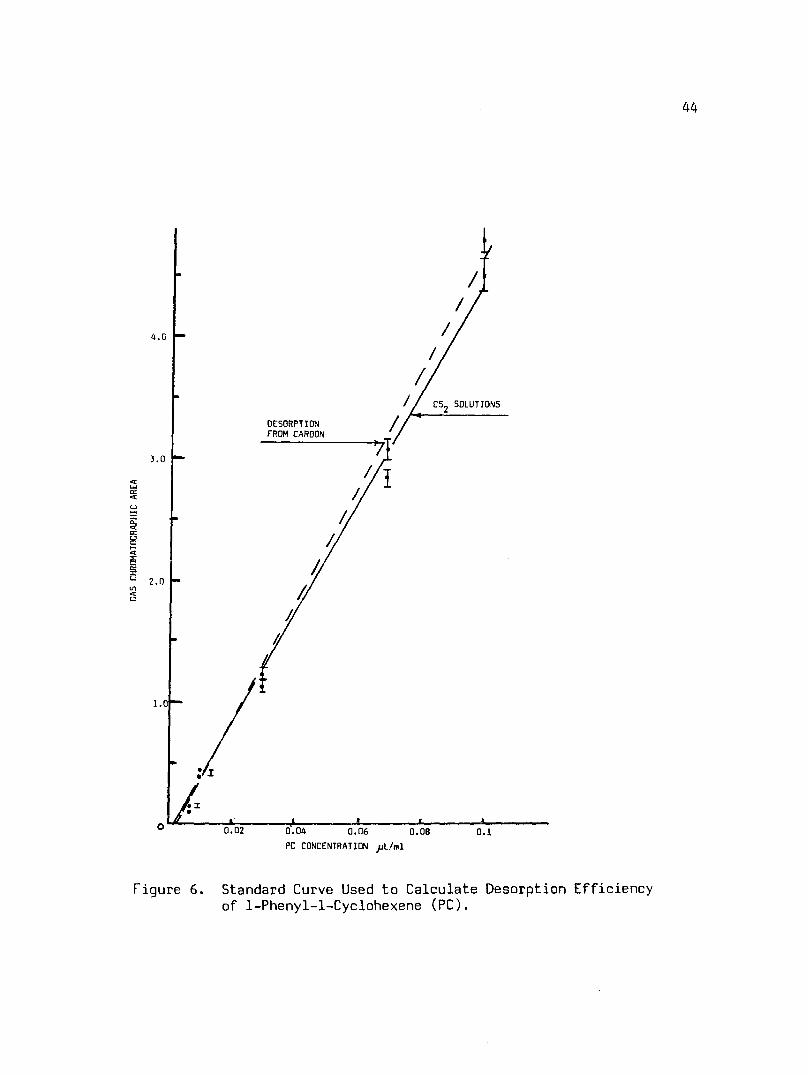
6. Standard Curve Used to Calculate Desorption Efficiency of 1-Phenyl-l-Cyclohexene (PC) 44
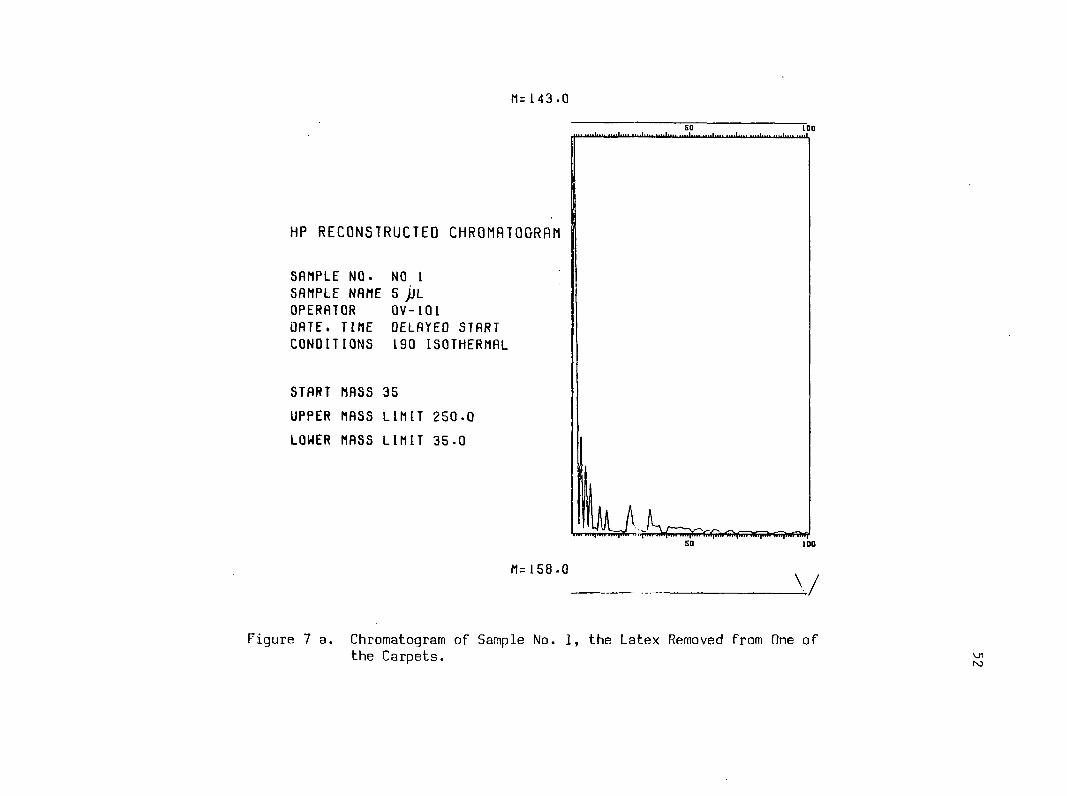
7 a. Chromatogram of Sample No. 1, the Latex Removed from One of the Carpets 52
b. Mass Spectrum of Scan 25 from Sample No. 1, l-Phenyl-3-Cyclohexene 53
8 a. Chromatogram from Sample No. 1, the Carbon Disulfide Solution was Concentrated to 0.5 ml Before Analysis . . 54
b. Mass Spectrum of Scan 23 from Sample No. 1 (Concentrated), l-Phenyl-3-Cyclohexene 55
9 a. Chromatogram of Sample No. 2, a Large Piece of Tan Carpet Obtained from a Carpet Retailer 56
b. Mass Spectrum of Scan 30 from Sample No. 2, l-Phenyl-3-Cyclohexene 57
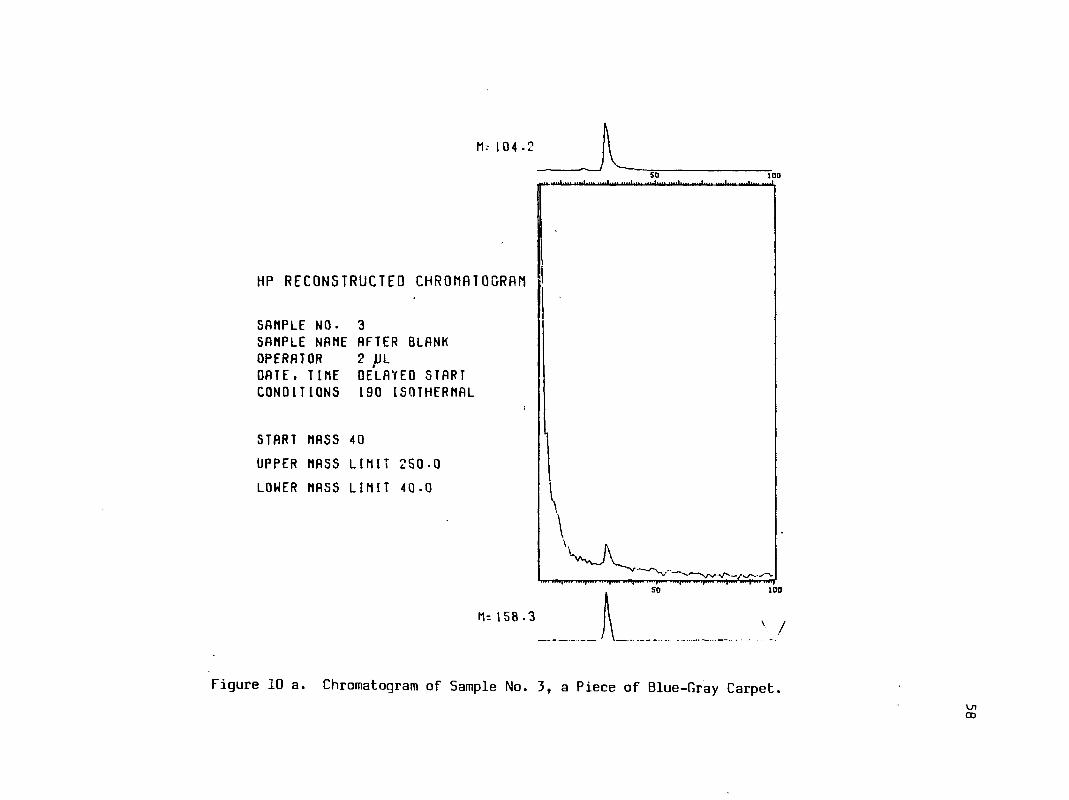
10 a. Chromatogram of Sample No. 3, a Piece of Blue-Gray Carpet. . 58
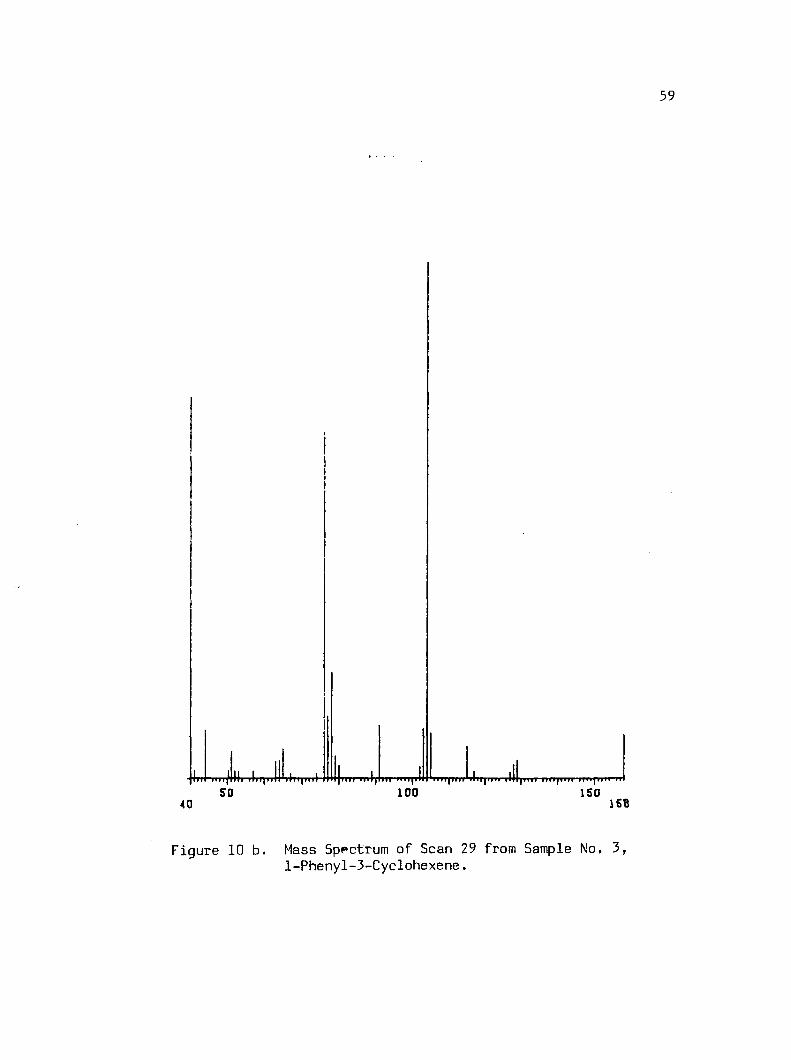
b. Mass Spectrum of Scan 29 from Sample No. 3, l-Phenyl-3-Cyclohexene 59
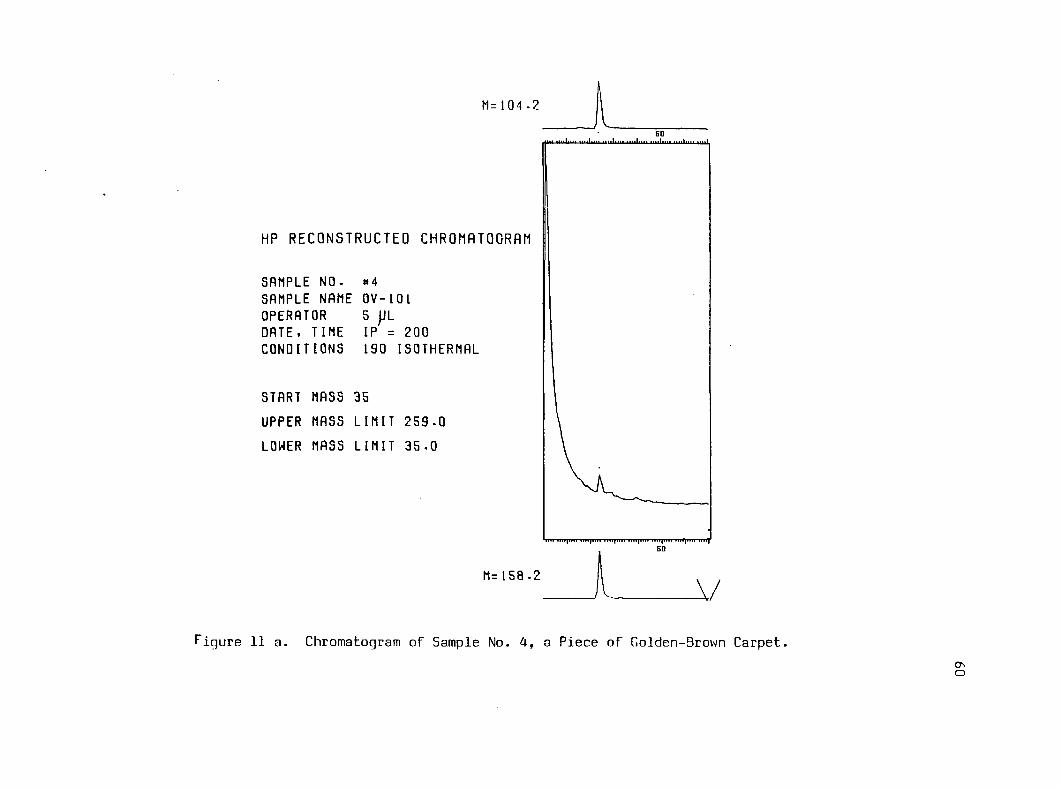
11 a. Chromatogram of Sample No. 4, a Piece of Golden-Brown Carpet 60
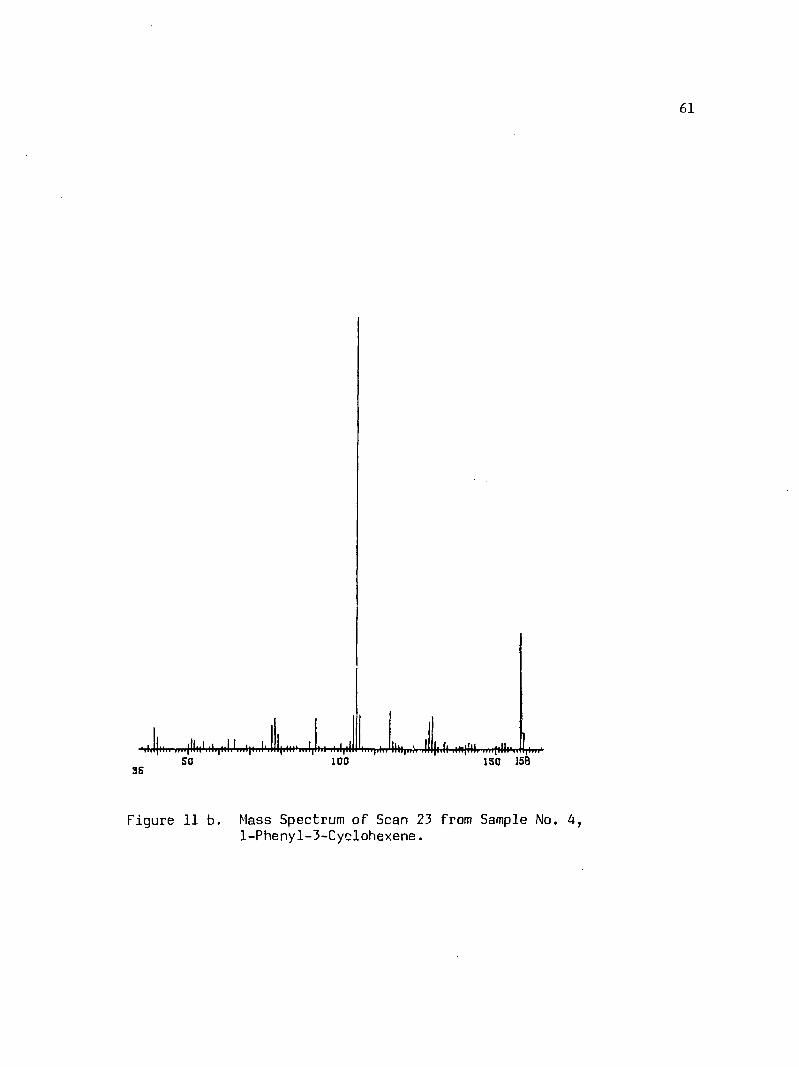
b. Mass Spectrum of Scan 23 from Sample No. 4, l-Phenyl-3-Cyclohexene 61
vi
LIST OF TABLES
Table Page
1. Time Allocation Differences Among Population Groups (Percentage of Total Hours) 5
2. Summary of Sources and Types of Indoor Air Pollution .... 8
3. Organic Contaminants Identified in Headspace Vapor Over Selected Carpet Samples 19
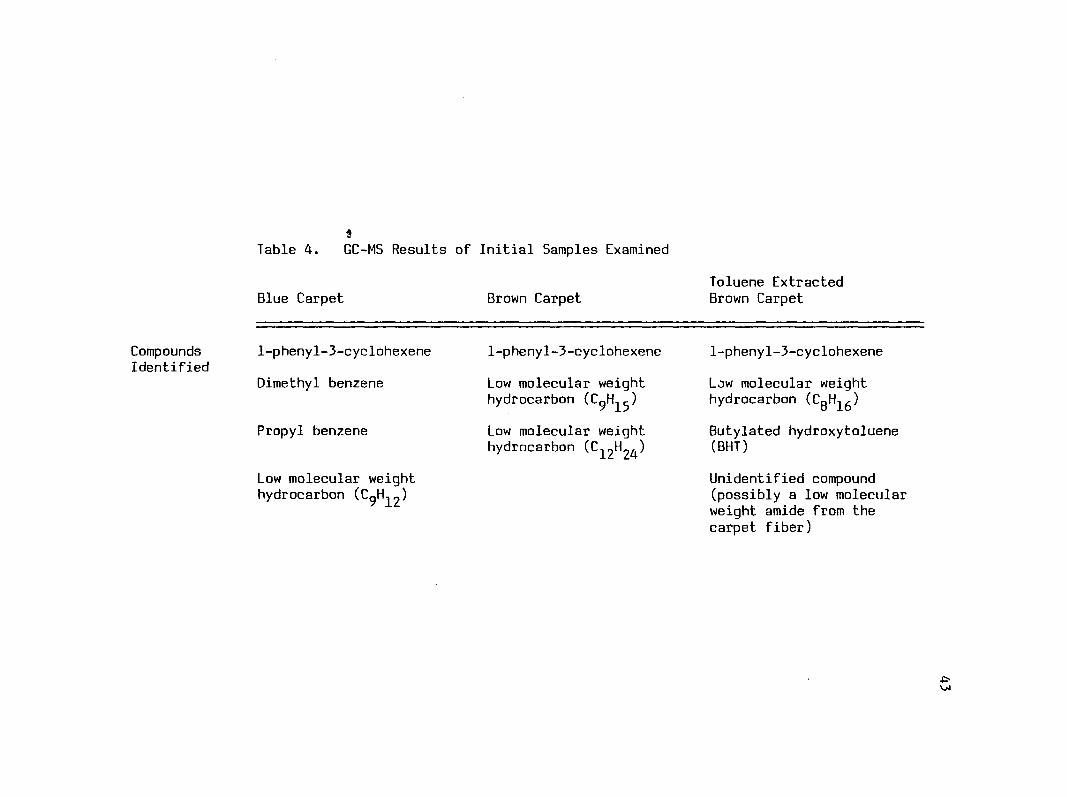
4. GC-MS Results of Initial Samples Examined 43
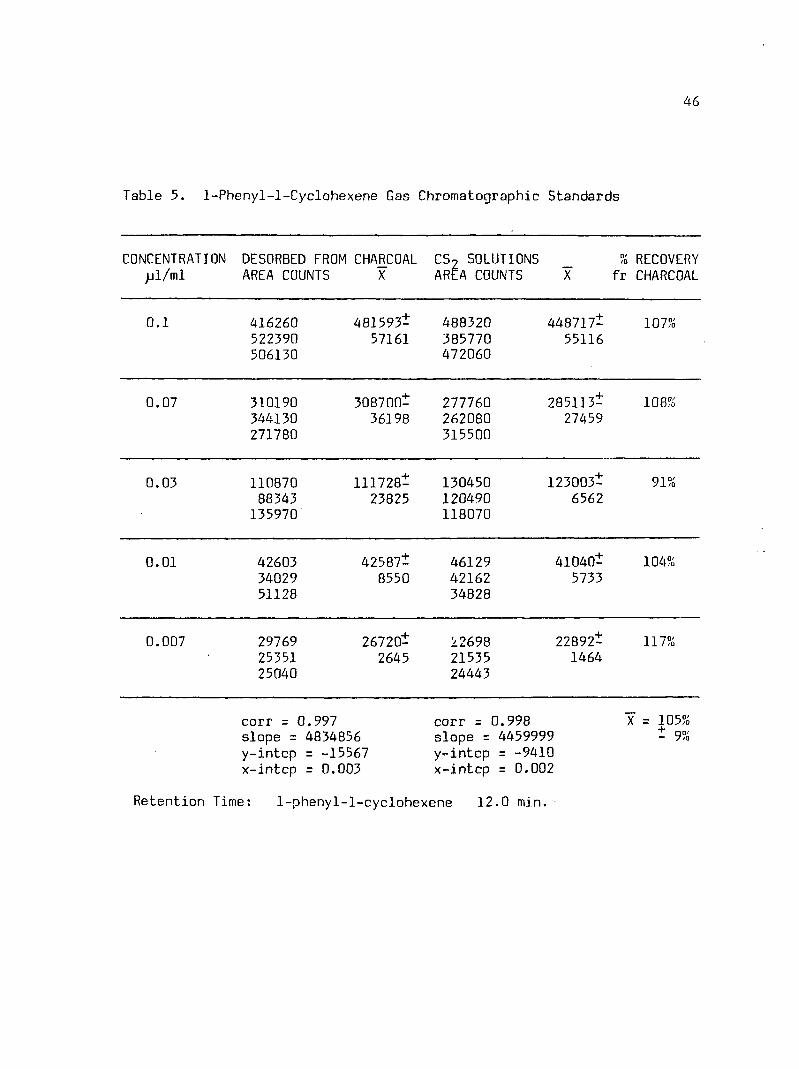
5. 1-Phenyl-l-Cyclohexene Gas Chromatographic Standards .... 46
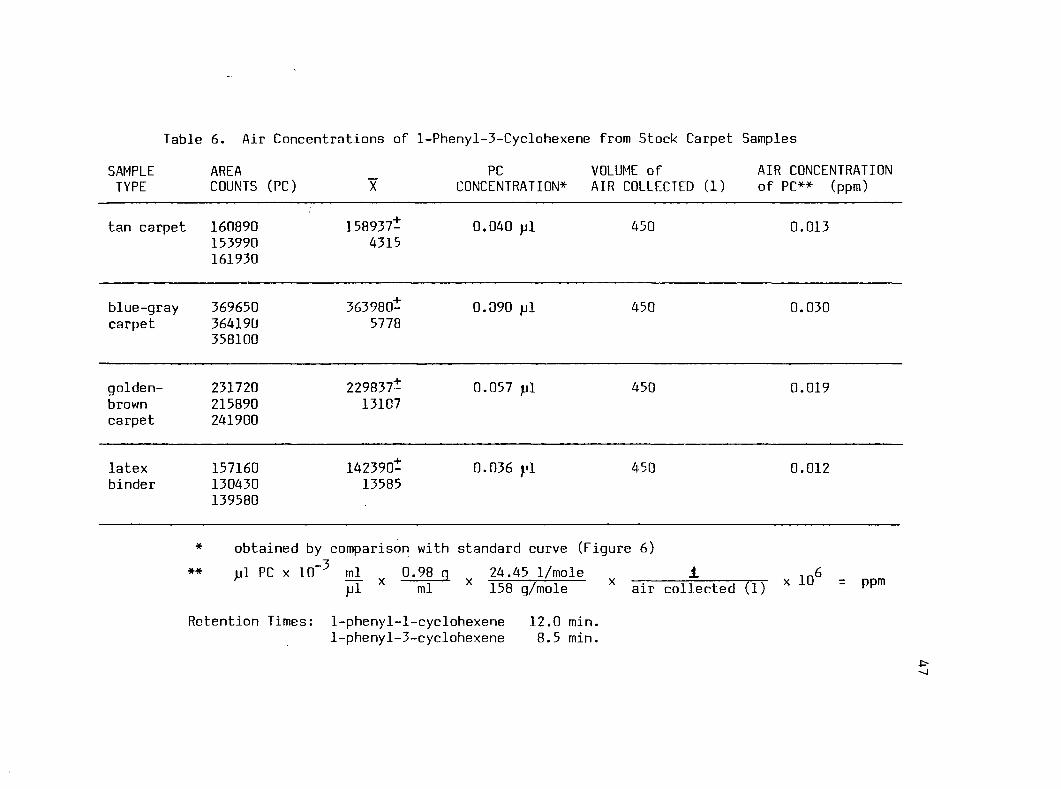
6. Air Concentrations of l-Phenyl-3-Cyclohexene from Stock Carpet Samples 47
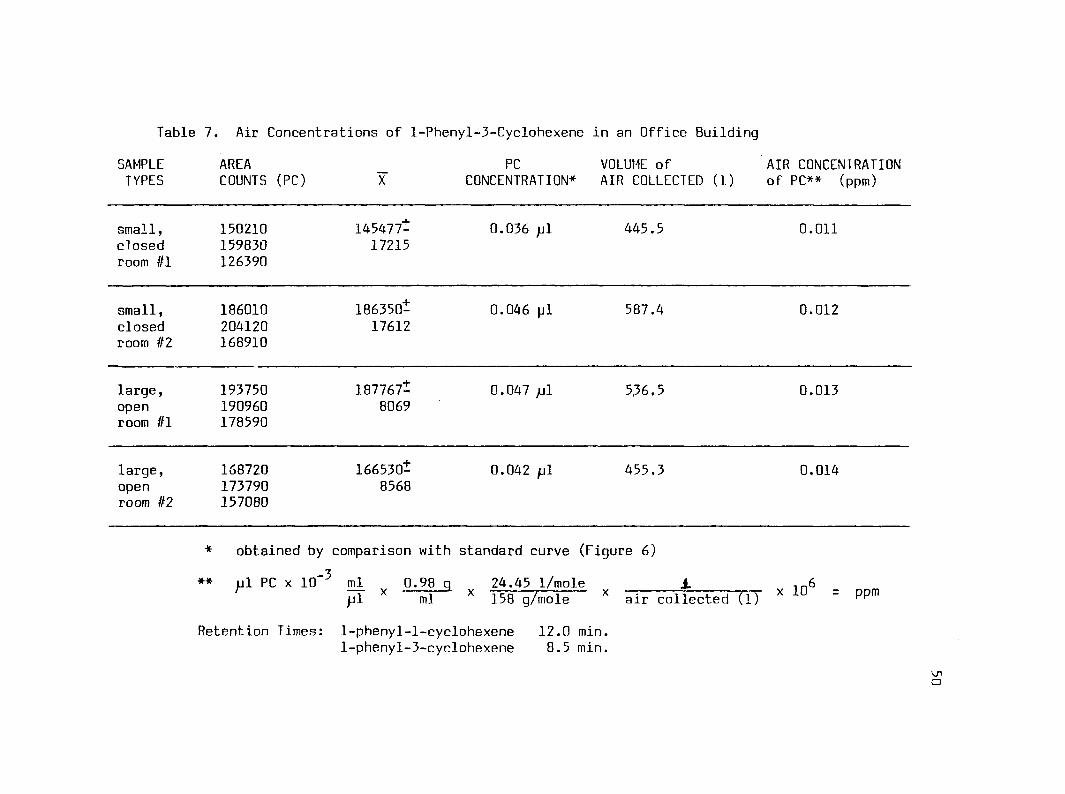
7. Air Concentrations of l-Phenyl-3-Cyclohexene in an Office Building 50
vii
ABSTRACT
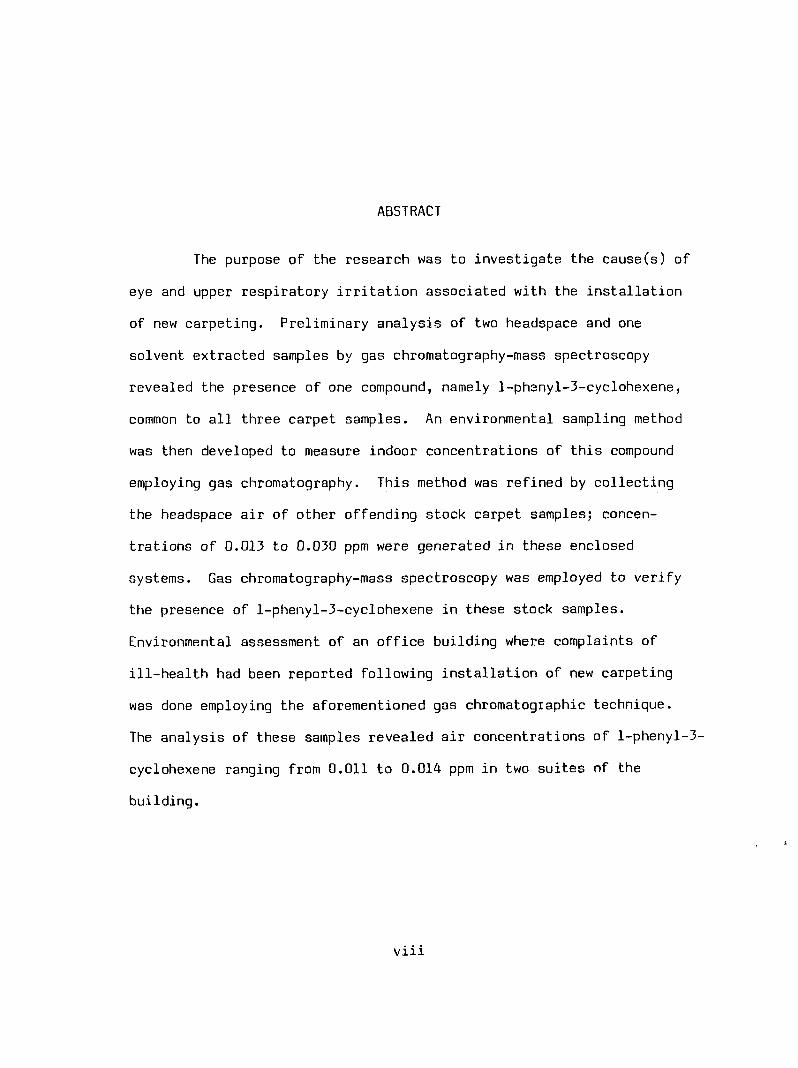
The purpose of the research was to investigate the cause(s) of
eye and upper respiratory irritation associated with the installation
of new carpeting. Preliminary analysis of two headspace and one
solvent extracted samples by gas chromatography-mass spectroscopy
revealed the presence of one compound, namely l-phsnyl-3-cyclohexene,
common to all three carpet samples. An environmental sampling method
was then developed to measure indoor concentrations of this compound
employing gas chromatography. This method was refined by collecting
the headspace air of other offending stock carpet samples; concen
trations of 0.013 to 0.030 ppm were generated in these enclosed
systems. Gas chromatography-mass spectroscopy was employed to verify
the presence of l-phenyl-3-cyclohexene in these stock samples.
Environmental assessment of an office building where complaints of
ill-health had been reported following installation of new carpeting
was done employing the aforementioned gas chromatographic technique.
The analysis of these samples revealed air concentrations of l-phenyl-3-
cyclohexene ranging from 0.011 to 0.014 ppm in two suites of the
building.
viii
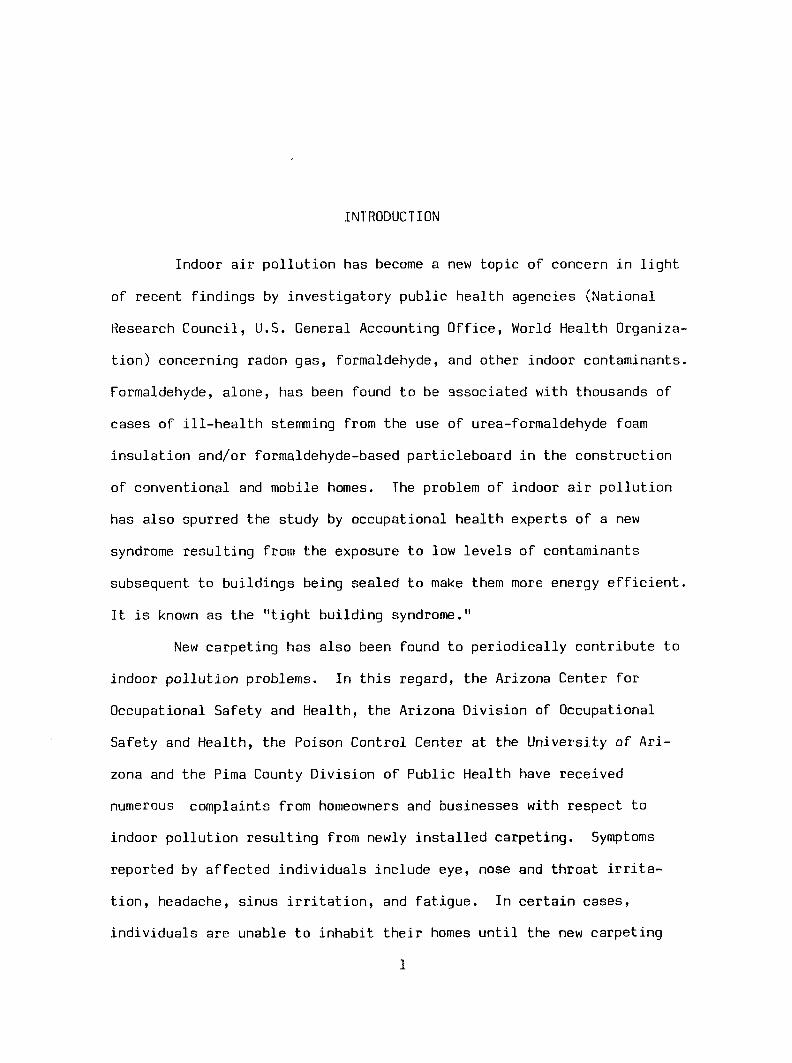
INTRODUCTION
Indoor air pollution has become a new topic of concern in light
of recent findings by investigatory public health agencies (National
Research Council, U.S. General Accounting Office, World Health Organiza
tion) concerning radon gas, formaldehyde, and other indoor contaminants.
Formaldehyde, alone, has been found to be associated with thousands of
cases of ill-health stemming from the use of urea-formaldehyde foam
insulation and/or formaldehyde-based particleboard in the construction
of conventional and mobile homes. The problem of indoor air pollution
has also spurred the study by occupational health experts of a new
syndrome resulting from the exposure to low levels of contaminants
subsequent to buildings being sealed to make them more energy efficient.
It is known as the "tight building syndrome."
New carpeting has also been found to periodically contribute to
indoor pollution problems. In this regard, the Arizona Center for
Occupational Safety and Health, the Arizona Division of Occupational
Safety and Health, the Poison Control Center at the University of Ari
zona and the Pima County Division of Public Health have received
numerous complaints from homeowners and businesses with respect to
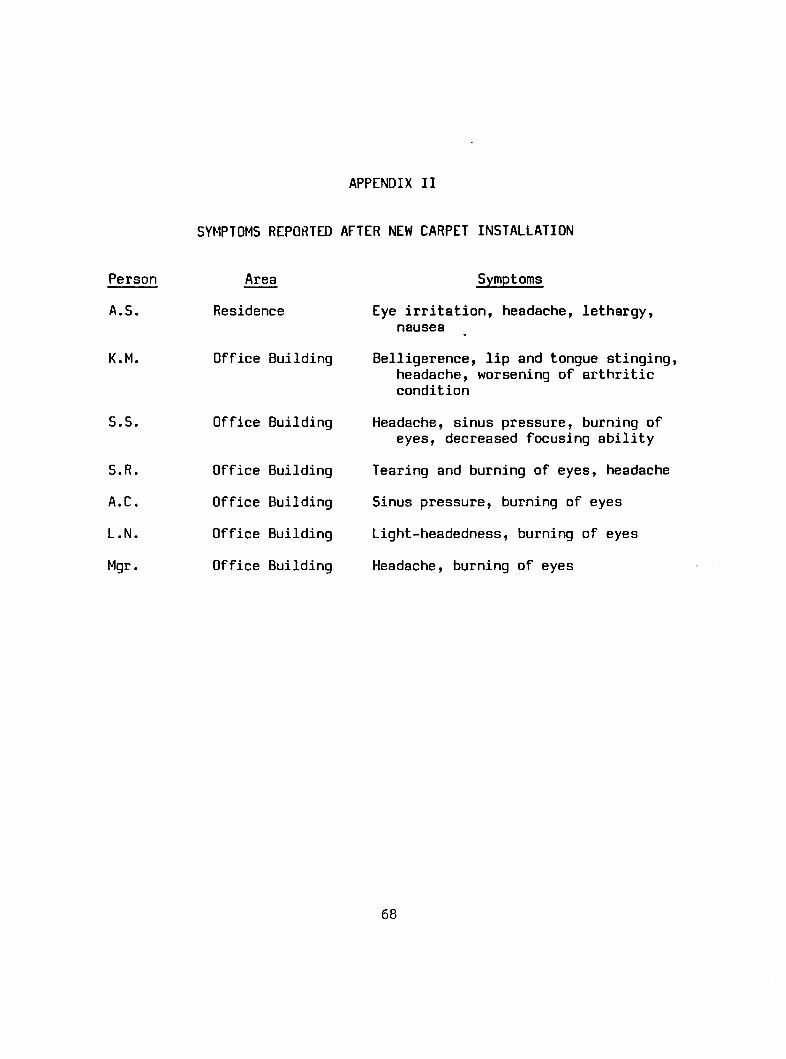
indoor pollution resulting from newly installed carpeting. Symptoms
reported by affected individuals include eye, nose and throat irrita
tion, headache, sinus irritation, and fatigue. In certain cases,
individuals are unable to inhabit their homes until the new carpeting
1
2
is removed. In other cases, individuals failing to recognize carpeting
as the contaminant source, have suffered repeated respiratory problems
until their carpeting was identified as the contaminant source.
Although these complaints have sometimes been traced to the
release of free formaldehyde from new carpet, recent investigations
undertaken by the Occupational Safety and Health Program at the Univer
sity of Arizona have indicated that formaldehyde is not always the
causitive agent. At present, however, little information is available
characterizing the nature of other contaminants outgassed from new
carpeting. It is the objective to determine the material being emitted
from certain carpet samples on the assumption that one or more may be
associated with symptoms of ill-health.
To date, there are many types of carpeting on the market. This
study will focus on one of the most popular of the carpet types in use
today; a short loop or tuft is woven through a mesh and a secondary
backing is then applied using bonding materials to increase the struct
ural stability and rigidity of the carpet. It is this type of carpet
that seems to have generated most of the complaints received by the
public health agencies.
In this initial project, the objectives are to 1) determine
qualitatively and quantitavely the odorous emissions from new carpet
samples under laboratory and field conditions, and 2) to develop a
convenient field method for collection and measurement of specific
contaminants in indoor environments.
LITERATURE REVIEW
INDOOR AIR POLLUTION
Basis for Concern
Indoor air quality in non-occupational settings, such as modern
office buildings and homes, is usually considered to be free of evident
health hazards. Until recently air pollution indoors was considered to
be at worst the same as outdoors, and probably significantly less.
Major reasons for the neglect in studying the air pollution in resi
dences and public places have been the much stronger focus on outdoor
and workplace environments as well as the difficulty in assessing more
complex indoor air environments.
A reasonable supposition is that the pollutants, and their
concentrations, which are present in an indoor, non-workplace environ
ment are significantly different from those present outdoors and in
workplace environments. The enclosed space may serve to trap pollut
ants which have seeped in from the outside and concentrate those which
are emitted by indoor building materials. Sterling and Kobayashi (1977)
have stated that "A building does not protect its inhabitants from
pollution. To the contrary. The body burden of toxic vapors and dusts
in the 'inside' may very well exceed the burden of pollution in the
'outside.1"
In recent years a growing number of building-related illnesses
have come to the attention of public health officials. The Consumer
3
4
Product Safety Commission (CPSC), as of July 1983, had received more
than 3000 complaints about exposures to contaminant releases from
building materials (Gupta, Ulsamer and Preuss 1982). Spengler and
Sexton (1983) recorded that between mid-1978 and 198C the National
Institute for Occupational Safety and Health (NIOSH) conducted over
100 investigations based on complaints from workers in non-industrial
settings who believed they were victims of buiTding-related pollution.
Investigations into the causes of building-related illness are begin
ning, but the local, state, and federal agencies commissioning the
investigations often lack the authority, the expertise, or the funding
to deal adequately with the issue.
Potential Exposures
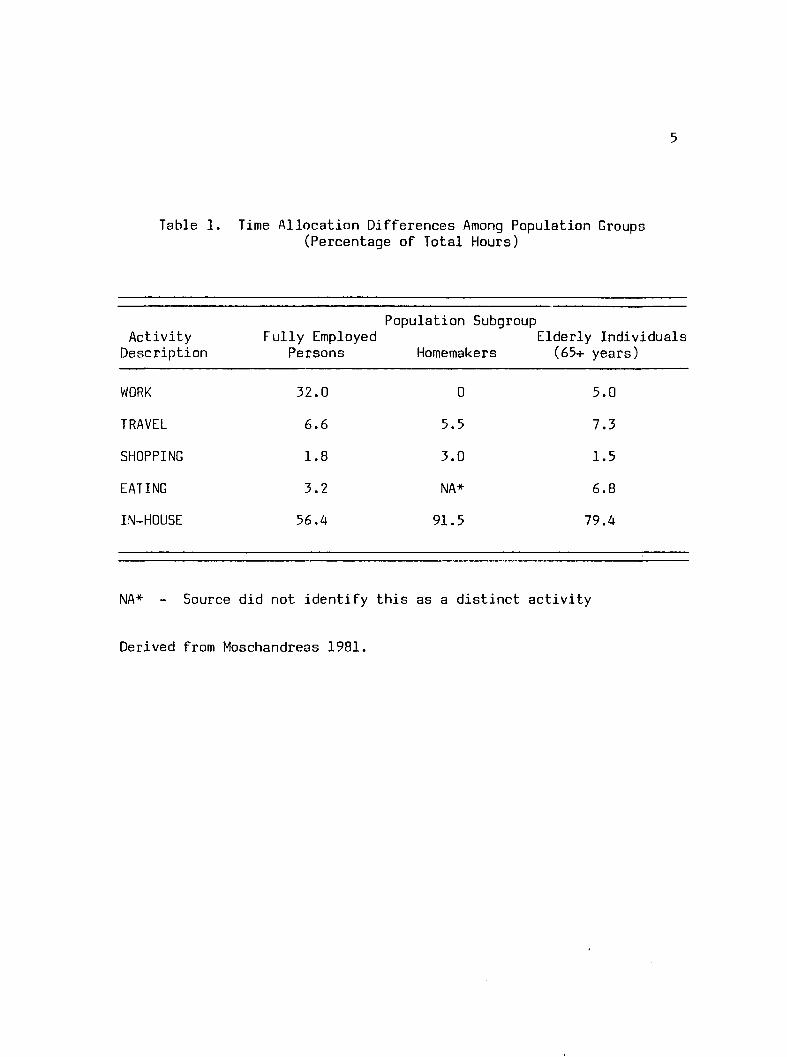
The exposure to indoor pollutants is a matter of importance in
that there are several sub-populations of people who spend up to 90%
of their day in indoor environments. Such sub-populations include the
elderly, infants, the handicapped and homemakers. Time budgets of
people are records of what a person does during a specified time period
and can be used to project estimates on the percentage of time a sub-
population spends in a particular environment, as illustrated in Table 1
(derived from Moschandreas 1981).
Although the concentrations of indoor pollutants may be low,
the cumulative response due to the long period of exposure may present
a significant problem. There has been little toxicological evidence on
the consequence of long-term exposure to low concentrations of multiple
pollutants. The standards set by the American Conference of
5
Table 1. Time Allocation Differences Among Population Groups (Percentage of Total Hours)
Activity Description
Fully Employed Persons
Population Subgroup
Homemakers Elderly Individuals (65+ years)
WORK 32.0 0 5.0
TRAVEL 6.6 5.5 7.3
SHOPPING 1.8 3.0 1.5
EATING 3.2 NA* 6.8
IN-HOUSE 56.4 91.5 79.4
NA* - Source did not identify this as a distinct activity
Derived from Moschandreas 1981.
6
Governmental Industrial Hygienists (ACGIH) for indoor industrial envi
ronments for a variety of hazardous substances are based on 8- to 10-
hour days and a 40-hour weekly exposure. Most studies use these
standards (Threshold Limit Values) in the evaluation of indoor air
pollution exposure; however, the longer period of exposure of a much
more varied population, including infants and the elderly, as well as
exposure to multiple pollutants represents an incorrect application of
these standards.
Several studies have been conducted to date as a general survey
of the pollutants present in a select group of indoor environments.
Johansson (1978) analyzed schoolroom air in Stockholm, Sweden for
volatile organic pollutants and found 160 contaminants indoors as
opposed to 50 detected outdoors. The concentrations of the organic
contaminants were always found to be higher indoors and to increase
when people were present in the room. Berglund, Johansson and Lindvall
(1982a) investigated the indoor air quality of a newly-built, problem-
free preschool in Stockholm, Sweden for a 3-year period. In this study
160 compounds were detected by gas chromatography of the indoor air of
the preschool. The concentrations of the pollutants decayed over time
and it was concluded that new buildings needed an off-gassing period
with no recirculation of indoor air. A time period of at least 6
months was estimated for this process by a theoretical calculation.
Miksch, Hollowell and Schmidt (1982) analyzed the air at four
office sites from which complaints had been received. At each site,
synthetic materials and furnishings were extensively used and there
were no photocopying machines present at the sites from which air
7
samples were taken. Comparison of air samples analysed by gas chroma
tography of indoor air at one site and outdoor air indicated that the
numbers and concentrations of organic contaminants were greater indoors
than outdoors (Miksch et al. 1982). Most of the organic contaminants
can be classified in three categories: aliphatic hydrocarbons,
alkylated aromatic hydrocarbons, and chlorinated hydrocarbons.
Miscellaneous other chemicals observed were ketones, aldehydes, and
benzene.
Sources of Indoor Air Pollution
Each building has various sources of indoor air pollution.
Normal living processes account for some of the pollutants present in
occupied buildings. In addition there are various other sources of
indoor air pollution; such as combustion appliances (gas stoves,
unvented space heaters), construction materials, insulation, the
soil under and around the buildings, and the furnishings present in
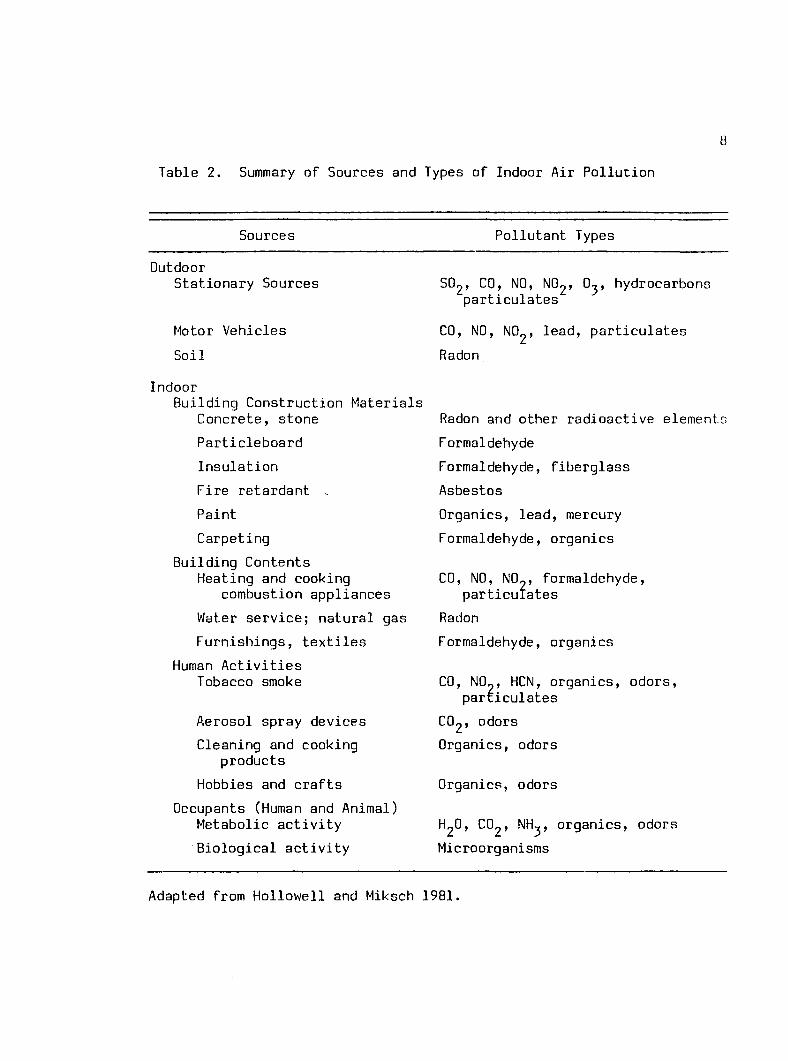
the building. Table 2 (adapted from Hollowell and Miksch 1981) is a
partial list of the sources and respective types of pollutants found
indoors.
Two contaminants of recent concern are formaldehyde and radon.
Since radon is present in the soil and rocks, it may be incorporated in
building materials which emit the radon into the enclosed building
space. Another source of radon is water which has passed through radon
bearing soil and which then emits the gas into the building. The main
concern about radon is the exposure to radioactive radon daughters.
Radon has been found in the soil around homes in Florida, Montana, and
8
Table 2. Summary of Sources and Types of Indoor Air Pollution
Sources
Outdoor Stationary Sources
Motor Vehicles
Soil
Indoor Building Construction Materials
Concrete, stone
Particleboard
Insulation
Fire retardant
Paint
Carpeting
Building Contents Heating and cooking
combustion appliances
Water service; natural gas
Furnishings, textiles
Human Activities Tobacco smoke
Aerosol spray devices
Cleaning and cooking products
Hobbies and crafts
Occupants (Human and Animal) Metabolic activity
Biological activity
Pollutant Types
SO2, CO, NO, N02> 03, hydrocarbons particulates
CO, NO, NO^j lead, particulates
Radon
Radon and other radioactive elements
Formaldehyde
Formaldehyde, fiberglass
Asbestos
Organics, lead, mercury
Formaldehyde, organics
CO, NO, N0», formaldehyde, particulates
Radon
Formaldehyde, organics
CO, N0«, HCN, organics, odors, particulates
CO2, odors
Organics, odors
Organics, odors
H2O, CO2, NH-j, organics, odors
Microorganisms
Adapted from Hollowell and Miksch 1981.
9
some parts of New England which has resulted in high indoor radon
levels; levels which are above health guideline range (Hollowell et al.
1980). The recent decrease in the amount of fresh outside air intro
duced into new buildings serves to concentrate or entrap the radon gas
inside the enclosed building space.
Another contaminant of recent concern is formaldehyde, which is
used in a variety of building materials such as "foam" insulation,
particle board, synthetic paneling, textiles, plywood and adhesives.
Particle board and urea formaldehyde foam insulation have received the
most attention, but the other materials have been shown to also release
formaldehyde. The predominant symptoms experienced by those in indoor
environments containing such contaminants are eye and upper respiratory
tract irritation, headache, and gastrointestinal disturbance, as well
as lethargy, sleeplessness and even memory loss.
Miksch, Hollowell and Schmidt (1982) analyzed the headspace air
around 17 representative new building materials. Qualitative gas chro-
matography/mass spectroscopy (GC-MS) analysis of the vapors yielded
several categories of compounds: alkyl benzenes, aliphatic hydrocarbons,
toluene, ketonic solvents, naphthalene, and specialty compounds such as
butylated hydroxytoluene (BHT). Chlorinated hydrocarbons were not com
monly detected. An estimation of the half-life for "gassing out" of a
theoretical piece of wall-to-wall carpeting was 300 days under typical
room conditions.
Malhave (1982) measured by GC-MS the headspace air around 42
building materials commonly used in Denmark for solvent vapors. He
detected 52 different compounds. Little toxicological information was
10
available on the potential health effects of most of the 52 compounds
identified in the study. Molhave classified 82% (43) of the compounds
as known or suspected irritants and 25?o (13) as suspected carcinogens.
The compounds identified in the study are listed in Appendix I.
The Problem of Ventilation
The problem of indoor air pollution has inadvertantly been
exacerbated by energy conservation measures. By reducing the ventila
tion (air exchange rate) in buildings, indoor pollutants tend to
concentrate. An illustration of this problem is the house built by the
National Association of Home Builders Research Foundation in Mount Airy,
Maryland. As a result of restricted ventilation, investigators found
high levels of formaldehyde and radioactivity levels approximately 100
times the outdoor background level (Gold 1980).
The World Health Organization (1979) is also concerned with the
problem of reduced ventilation. In its report, (United Nations 1979)
a conclusion was reached that "Current efforts in many countries to
restrict rates of intake of outdoor air, while clearly offering advan
tages for energy conservation, must also be seen as potentially dis
advantageous to health and well-being. The trend toward restriction of
air intake will inevitably increase the concentration of all pollutants
released indoors, . . . , unless the restriction is accompanied by
effective measures to reduce emissions at the source."
The term "Tight Building Syndrome" has been coined to describe
the health effects increasingly encountered among occupants of tight,
energy-efficient buildings with outside air provided through
11
recirculating air conditioning systems. Hicks (1984) lists the most
common symptoms as "eye, nose and throat irritation, headache, fatigue,
sneezing, and difficulty in wearing contact lenses." Tight building
syndrome occurred more frequently in buildings where the ventilation
was maintained near the minimum limits of the American Society of
Heating, Refrigerating and Air Conditioning Engineers (A5HRAE)
ventilation standards. The standards set in 1973 recommended that a
minimum of 2.5 1/s of fresh outside air be provided per person for a
typical open office setting with adequate air filtration and tempera
ture controls over the course of a normal shift. The standards were
updated in 1981 to provide a minimum ventilation rate of 10 1/s of
fresh outside air per person in a typical office building where tobacco
smoking is permitted. Increasing the influx of outside air did not
provide significant relief from symptoms in all buildings (Hicks 1984);
the author did not provide details regarding the reduction in pollutant
concentrations with the increase in the influx of outside air.
The Issue of Public Policy
Thi3 degree to which indoor air pollution represents a public
health hazard has not been established. Indoor air pollutant concen
trations may be low, but due to the long exposure time, they may make
a substantial contribution to time-weighted exposures. Concerns about
health effects have prompted intervention by certain local, state, and
federal governmental levels to recommend limitations on indoor
exposures to tobacco smoke, formaldehyde, radon and asbestos.
12
The response of the government(s) to the issue of indoor air
pollution to date has been piecemeal and complaint-oriented. Many
different federal agencies have responsibilities over portions of a
problem, such as asbestos. Five agencies which have some jurisdiction
over indoor air pollution include: the Environmental Protection Agency,
the Occupational Safety and Health Administration, the Department of
Energy, the Consumer Product Safety Commission, and the Department of
Housing and Urban Development.
As Sexton and Repetto (1982) indicated, there is a fundamental
difference between indoor and outdoor air. Outdoor air is a "public
good" in the sense that individual members of a community breathe
essentially the same outdoor air. The rationale for government regula
tion of outdoor air is concerned with the realization that those who
suffer the effects of outdoor air pollution are not compensated, nor is
their need for cleaner air able to alter the actions of polluters with
out difficulty. On the other hand, the situation is quite different
for private residences. Both the costs and the benefits of the control
of pollution come from within the household. Setting strict indoor air
quality standards would certainly be expensive because of the costs
involved in monitoring and regulating the approximately 100 million
buildings in the United States.
Spengler and Sexton (1983) point out that if regulation of
indoor air is attempted, it is necessary to know whether individuals
are to be protected from long-term exposures to low concentrations,
or short-term peak exposures. If it is long-term exposures which are
important, then the goal is reduction of total human exposures to air
13
pollution. If, on the other hand, it is short-term exposures which are
important, then it is necessary to identify peak concentrations and
protect the population at risk. Controlling pollutant emission at the
source by eliminating certain materials from the indoor environment may
be a viable method to reduce exposures,
The development of standards for indoor pollutants is needed,
according to Ferrand and Moriates (1981). They state that "Standards
should correspond to exposures above which adverse health effects are
produced in the most susceptible group that represents a significant
number of individuals." Repace (1982) agrees with this opinion. He
states that the Threshold Limit Values (TLV's) used by the Occupational
Safety and Health Administration are "not designed to protect the
general public to 'within an adequate margin of safety,' but rather to
protect 'nearly all1 workers without adverse effect." It is therefore
recognized that due to the wide variation in individual susceptibility,
some workers will be adversely affected at levels below the TLV. The
general public, due in part to the greater number of individuals in this
population than in the industrial workforce, will have many more indi
viduals who are susceptible to adverse health effects at levels below
the TLV, and therefore a lower standard is necessary for the larger
population.
Carpet Emissions
Complaints of ill-health have often coincided with the installa
tion of new carpeting. Although these complaints have sometimes been
attributed to adhesives used to bind carpeting to the floor, often no
such material has been employed in the installation of the carpet, or
if used, was employed in such a small volume as to preclude its role in
the causation of health problems. Often the offensive yet characteris
tic odor is directly due to emissions from the new carpeting itself,
the degree of odor varying with batch/type of carpet employed. For
this reason, it was of interest to investigate the nature of these
emissions.
The type of carpet of interest in this study is constructed of
a nylon pile woven into a polypropylene backing, and a secondary back
ing of jute or polypropylene is bonded to the carpet face with styrene-
butadiene latex. It is this type of carpet which has been primarily
involved in the complaints received by various public health agencies
as well as the Arizona Center for Occupational Safety and Health. It
is also the most common type of carpet on the market today.
According to Monsanto (pamphlet) 95% of carpeting on the market
today is manufactured by a method called "tufting." More than 70?o of
all carpets at present are constructed of nylon (Armstrong 1977). The
tufts in the carpet must be locked in to prevent raveling and fraying.
This is accomplished by the use of a latex coating and over 75?o of all
tufted carpets also employ the latex as an adhesive for a secondary
backing (Porter 1982).
Figure 1 illustrates the method most commonly used in the
construction of tufted carpets (derived from Shoshkes 1974). The nylon
is first spun into filament of staple yarns. These are then twisted
15
Monofilament yarn & fib^r
Staple yarn & fibers
Fig. 1.1 Spinning- Staple fibers and monofilaments are spun to provide yarns for the carpet face.
Fig. 1.2 Plying- 1 to 6 strands of the spun yarn are twisted together to form one carpet yarn.
Fig. 1.3 Tufting- Yarn is inserted into a backing by rows of needles to form the carpet face.
1.4 Carpet Backing- A latex coating is applied to lock tufts in place, a secondary backing is added for stability.
Figure 1. Construction of Carpets: Spinning, Plying, Tufting, Carpet Backing.
16
together to form from one- to six-ply carpet yarns. These yarns are
then used to construct tufted carpets.
The tufting process is a simple one. A bank of needles inserts
loops of carpet yarn into a prewoven polypropylene backing to form the
pile as the backing is fed through the machine. The tension of the
yarn can be varied so that the yarn will lock into different lengths
into the backing, forming a pattern of "tufts" in the finished carpet.
To achieve a cut-pile construction, the loops are cut by a knife
attached to the tufting machine (Armstrong 1977).
Fibers can be dyed at three different stages in carpet manu
facture; before spinning, after spinning, and after weaving. Nylon
may be solution-dyed before spinning by adding dye stuffs to the
liquid polyamide that will be spun into fibers, becoming an integral
part of the fiber. Nylon dyed after spinning is done by exposing the
yarn to the dye in dye baths, or the dye is directly applied to sections
of yarn. The yarn is then washed and dried and used in the construction
of carpets. Carpets dyed after weaving are treated with the dye via
one of several different methods before they are washed and dried and
the backings are applied.
A latex coating is then applied to the underside of the tufted
carpet. It serves three functions: (a) to binu the pile tufts securely
in position, (b) to give dimensional stability, and (c) to produce non-
fray properties (Robinson 1972). A styrene-butadiene latex is used to
coat the back of the carpet, and then acts as an adhesive for the
secondary jute or polypropylene backing. The secondary backing serves
17
to increase the structural stability of the carpet. The carpet then
proceeds to a drying oven set at 140° C for 4-6 minutes where the
temperature of the carpet approaches 100° C (Robinson 1972). Excessive
heat causes scorching and distortion. The application of the secondary
backing retards the rate of drying of the latex.
In response to complaints of ill-health from occupants of
several office buildings and homes in which new carpets were installed,
samples of these carpets were obtained for chemical evaluation. These
complaints are listed in Appendix II. All samples exhibited similar
odorous emissions. The actual source of these emissions was not known,
possibilities included the fibers making up the carpet tuft or the
styrene-butadiene latex used to bind the carpet together.
During the preliminary stages of this investigation the dye
carriers used to dye the carpet tufts were evaluated as potential
causal agents, since such carriers are known as ootential respiratory
irritants. These include o-phenyl phenol, p-pheriyl phenol, 1-methyl
napthalene, 2-methyl naphthalene, biphenyl, and 2-(2,4-dichlorophenoxy)
ethanol. Investigations were carried out to determine if these agents
were present in our carpet samples; however, they were not observed in
any of our samples.
The latex binder employed to bind tufts to the polypropylene/
jute backing was also evaluated as a source of contaminants. Excess
monomers or dimers would be volatile enough to escape following carpet
installation and therefore, are suspect agents. In this regard, an
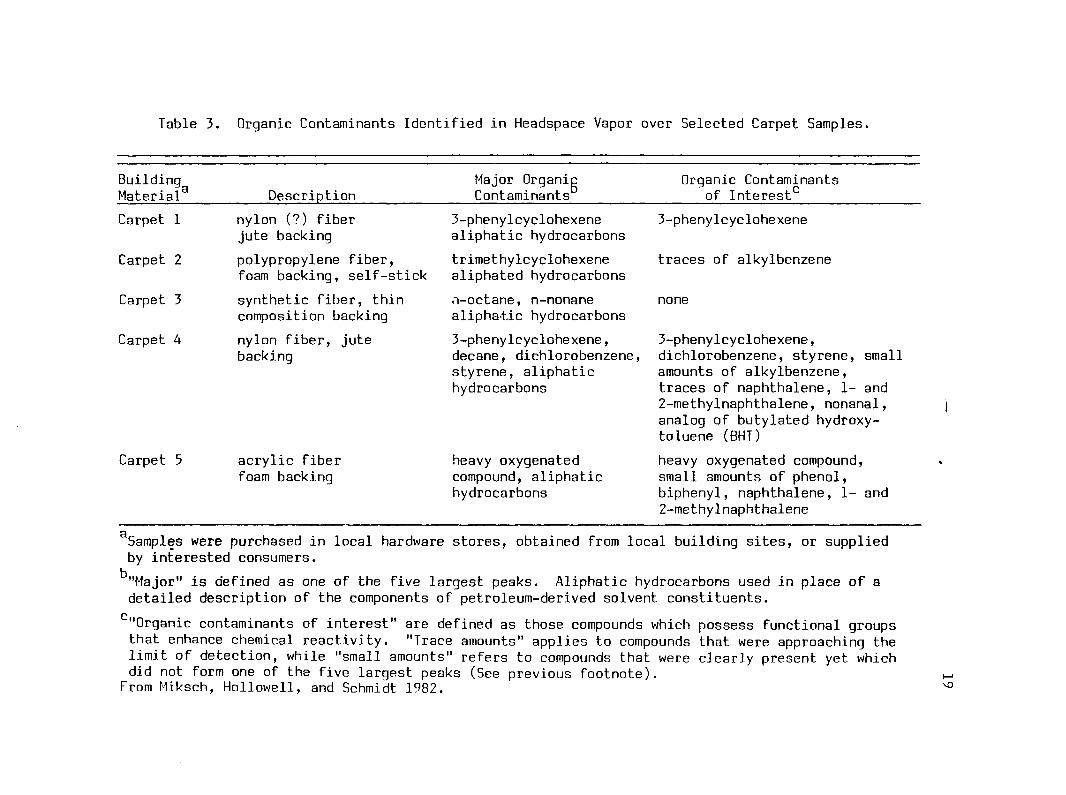
investigation by Miksch, Hollowell and Schmidt (1982) on five carpet
samples demonstrated that two nylon carpets with jute backing released
one compound, 3-phenyl cyclohexene (Table 3) at ambient temperatures,
although no association was made to potential health effects resulting
from exposure to this agent. In a search of the current literature,
this compound was not used directly during the manufacturing process
of carpets. Dye carriers were observed to be emitted from two of the
carpet samples in the above study, but in both cases were not among
the five largest peaks determined by their analysis.
Table 3. Organic Contaminants Identified in Headspace Vapor over Selected Carpet Samples.
Buildingg Major Organip Organic Contaminants Material Description Contaminants of Interest0
3-phenylcyclohexene, dichlorobenzene, styrene, small amounts of alkylbenzene, traces of naphthalene, 1- and 2-methylnaphthalene, nonanal, analog of butylated hydroxy-toluene (BHT)
Carpet 5 acrylic fiber foam backing
heavy oxygenated compound, aliphatic hydrocarbons
heavy oxygenated compound, small amounts of phenol, biphenyl, naphthalene, 1- and 2-methylnaphthalene
g Samples were purchased in local hardware stores, obtained from local building sites, or supplied by interested consumers.
k"Major" is defined as one of the five largest peaks. Aliphatic hydrocarbons used in place of a detailed description of the components of petroleum-derived solvent constituents.
c "Organic contaminants of interest" are defined as those compounds which possess functional groups that enhance chemical reactivity. "Trace amounts" applies to compounds that were approaching the limit of detection, while "small amounts" refers to compounds that were clearly present yet which did not form one of the five largest peaks (See previous footnote).
From Miksch, Hollowell, and Schmidt 1982.
MATERIALS AND METHODS
Preliminary GC-MS Analysis of Carpet Emissions
Combined gas chromatography-mass spectroscopy analyses were
performed on carpet samples obtained from environments where new nylon
carpet had recently been installed and reported to cause ill-health
effects (see Appendix II). In each case, the characteristic new carpet
odor was evident.
2 Two carpet samples (2 ft ) were placed in 20 liter glass
containers. One carpet sample was a blue medium-length cut loop type
with a polypropylene secondary backing. The other carpet sample was
a brown medium-length cut loop type of Antron nylon with a jute second
ary backing. The headspace air above each sample was collected by
drawing approximately 100 liters of air through a charcoal tube using
a Mine Safety Appliance environmental sampling pump, Model G. The glass
sorbent tubes measured 0.8 x 11.0 cm and were divided into two sections;
the forward and rear sections containing 400 mg and 200 mg of coconut
charcoal, respectively. The rear section of a tube is employed to test
for breakthrough of gases/vapors. Samples were capped and stored in a
freezer until they were prepared for analysis.
The front section of each tube was transferred to a 5 ml boro-
silicate glass vial for desorption in 2 ml of reagent grade carbon
disulfide. Perforated screw caps with teflon-lined rubber liners were
20
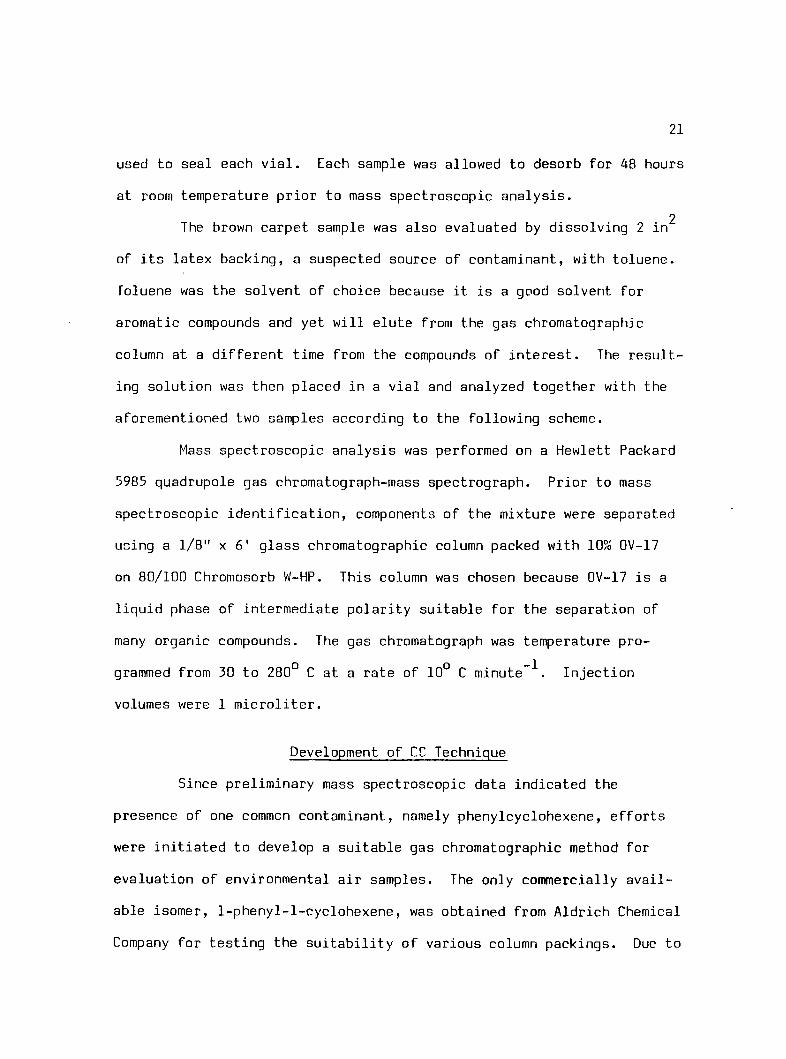
used to seal each vial. Each sample was allowed to desorb for 48 hours
at room temperature prior to mass spectroscopic analysis.
2 The brown carpet sample was also evaluated by dissolving 2 in
of its latex backing, a suspected source of contaminant, with toluene.
Toluene was the solvent of choice because it is a good solvent for
aromatic compounds and yet will elute from the gas chromatographic
column at a different time from the compounds of interest. The result
ing solution was then placed in a vial and analyzed together with the
aforementioned two samples according to the following scheme.
Mass spectroscopic analysis was performed on a Hewlett Packard
5985 quadrupole gas chromatograph-mass spectrograph. Prior to mass
spectroscopic identification, components of the mixture were separated
using a 1/8" x 6' glass chromatographic column packed with 10?o OV-17
on 80/100 Chromosorb W-HP. This column was chosen because OV-17 is a
liquid phase of intermediate polarity suitable for the separation of
many organic compounds. The gas chromatograph was temperature pro
grammed from 30 to 280° C at a rate of 10° C minute Injection
volumes were 1 microliter.
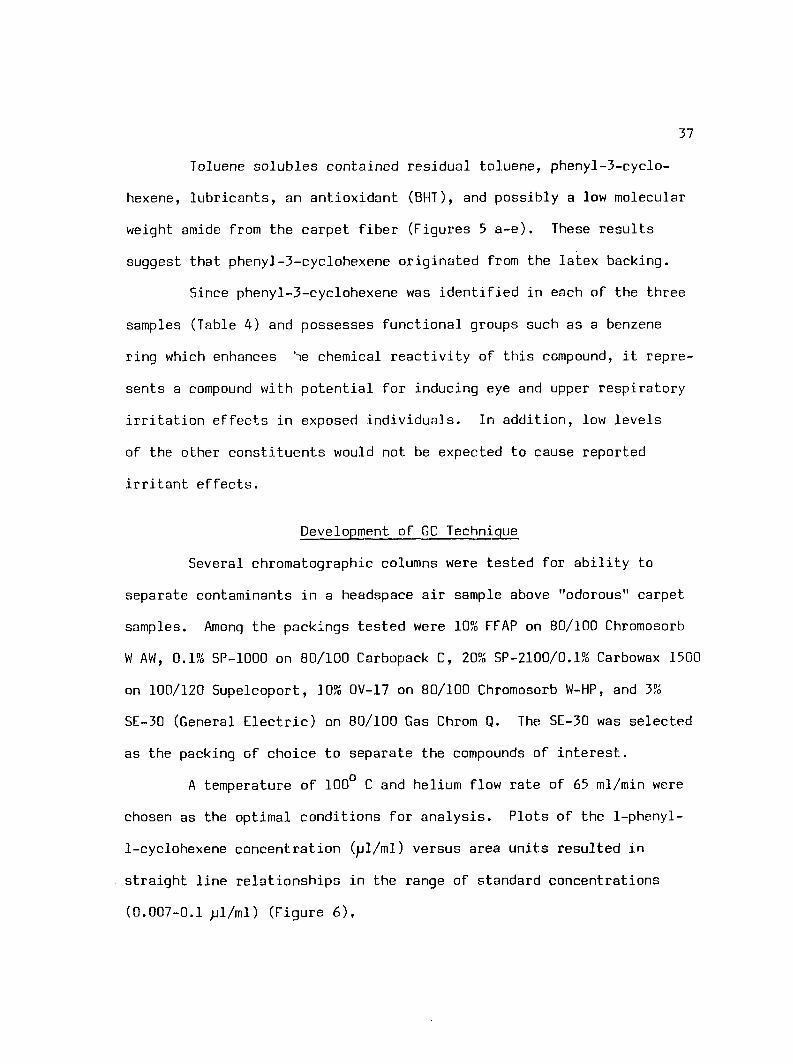
Development of CC Technique
Since preliminary mass spectroscopic data indicated the
presence of one common contaminant, namely phenylcyclohexene, efforts
were initiated to develop a suitable gas chromatographic method for
evaluation of environmental air samples. The only commercially avail
able isomer, 1-phenyl-l-cyclohexene, was obtained from Aldrich Chemical
Company for testing the suitability of various column packings. Due to
22
the fact that l-phenyl-3-cyclohexene and 1-phenyl-l-cyclohexene have
identical molecular weights and similar molecular structures, the quan
titative response of the flame ionization detector to the two isomers
was expected to be identical.
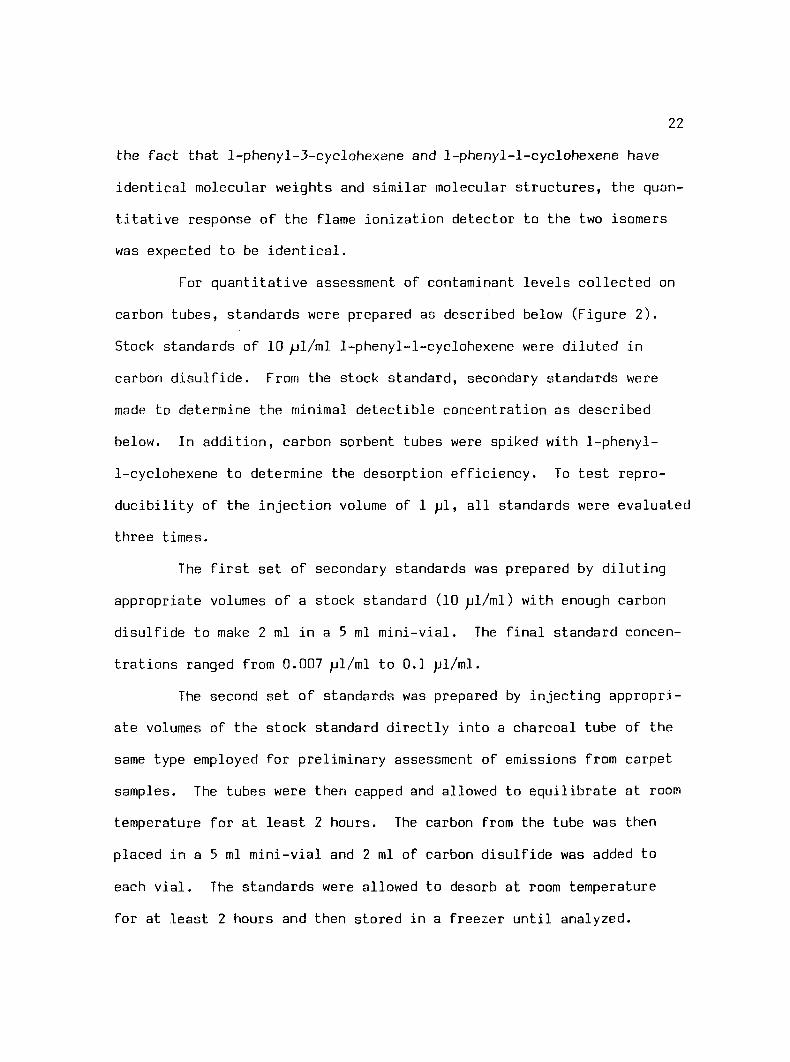
For quantitative assessment of contaminant levels collected on
carbon tubes, standards were prepared as described below (Figure 2).
Stock standards of 10 jjl/ml 1-phenyl-l-cyclohexene were diluted in
carbon disulfide. From the stock standard, secondary standards were
made to determine the minimal detectible concentration as described
below. In addition, carbon sorbent tubes were spiked with 1-phenyl-
l-cyclohexene to determine the desorption efficiency. To test repro
ducibility of the injection volume of 1 jjI, all standards were evaluated
three times.
The first set of secondary standards was prepared by diluting
appropriate volumes of a stock standard (10 il/ml) with enough carbon
disulfide to make 2 ml in a 5 ml mini-vial. The final standard concen
trations ranged from 0.007 il/ml to 0.1 jjl/ml.
The second set of standards was prepared by injecting appropri
ate volumes of the stock standard directly into a charcoal tube of the
same type employed for preliminary assessment of emissions from carpet
samples. The tubes were then capped and allowed to equilibrate at room
temperature for at least 2 hours. The carbon from the tube was then
placed in a 5 ml mini-vial and 2 ml of carbon disulfide was added to
each vial. The standards were allowed to desorb at room temperature
for at least 2 hours and then stored in a freezer until analyzed.
23
+ 10 pi 1-phenyl-l-cyciohexene
10 ml CS
Carbon removed from tubes and place in 5 ml vials
Carbon Sorbent tubes + increments of Stock Solution
large, 193750 187767- 0.047 ;ul 5,36.5 0.013 open 190960 8069
0.047 ;ul
room #1 178590
large, 168720 166530± 0.042 pi 455.3 0.014 open 173790 8568
0.042 pi room #2 157080
* obtained by comparison with standard curve (Figure 6)
** ^1 PC x 10"3 ml 0.98 q 24.45 1/mole j. , 6 )jl X ml X 158 g/mole X air collected (1) X
Retention Times: 1-phenyl-l-cyclohexene 12.0 min. l-phenyl-3-cyclohexene 8.5 min.
sample the peak of interest was identified between scan numbers 23 and
30. The reconstructed chromatograms and relevant mass spectra are
shown in Figures 7-11.
Phenyl-3-cyclohexene was identified as the largest of the
contaminant peaks in each of the four samples, and was the only contam
inant (above trace amounts) identified in two of the samples. The
other two samples did not have similar compositions, as indicated by
retention time comparisons. This confirms that the peaks quantified
in the two previous sections are indeed phenyl-3-cyclohexene. The
presence of this substance in sample 1 (Figures 7 a & b, 8 a & b)
indicates that l-phenyl-3-cyclohexene originated from the latex used
to adhere the secondary backing to the carpet face.
(1= 143.0
so 100 JU.
HP RECONSTRUCTED CHROMRTOGRRfl
S A M P L E N O . N O I SAMPLE NAME S JUL O P E R A T O R Q V - 1 0 1 D A T E . T I M E D E L A Y E D S T A R T C O N D I T I O N S 1 9 0 I S O T H E R M A L
S T A R T M A S S 3 5
U P P E R M A S S L I M I T 2 5 0 - 0
L O W E R M A S S L I M I T 3 5 - 0
Figure 7 a. Chromatogram of Sample No. 1, the Latex Removed from One of
50 100
« = i 5 8 - 0
i/
the Carpets. VJ1 K3
53
lin|iHi 1111[11
SO
11111ll 111•I (III) l l l l p n
100 |llll • 1111 • 111 llll|llll
4 6
rTrrr ISO
159
Figure 7 b. Mass Spectrum of Scan 25 from Sample No. 1, l-Phenyl-3-Cyclohexene.
11= 104 -2
100 nliin I I I I UI I I
HP RECONSTRUCTED CHROMRTOGRRM
S A M P L E N O . « 1 . C 0 N C SAMPLE NAME 2 JUL O P E R A T O R D A T E . T I M E C O N D I T I O N S
0 V - 1 0 1 I P = 2 0 0 1 9 0 I S O T H E R N A L
S T A R T M A S S
U P P E R M A S S L I M I T 2 5 0 . 0
L O W E R M A S S 4 0 - 0
ML nn|im mrj imjmi nii|im im|wn uiq
100
M= 158.2
Figure 8 a. Chromatogram from Sample No. 1, the Carbon Disulfide Solution was Concentrated to 0.50 ml Before Analysis.
\ri
55
I H I I 1 1 1 1 I I I I I I m i l llll|llll 11II11111 »111| 1111 1111)1111 nil
43
I" 5 0 100 1 5 0 159
Figure 8 b. Mass Spectrum of Scan 23 from Sample No. 1, (Concentrated) l-Phenyl-3-Cyclohexene.
tt= 1G4 .2
60 100 ....I.... ....I,. .t.,.. ....t ...I I
HP RECONSTRUCTED CHROMRTOGRAM
S A M P L E . J J O . - 2 SAMPLE—NAME 2 JUL O P E R A T O R 0 V - 1 0 1 D A T E . _ T I M E D E L A Y E D S T A R T C O N D I T I O N S 1 9 0 I S O T H E R M A L
Figure 9 a. Chromatogram of Sample No. 2, a Large Piece of Tan Carpet Obtained from a Carpet Retailer.
S T A R T M A S S 4 0
U P P E R M A S S L I M I T 2 5 0 - 0
L O W E R M A S S L I M I T 4 0 - 0
V
100
57
"IH'W +Upt4 t n f1 nt t|
S 4 100
TTTTpTTT 1111)1111 11H11111 11111 > 111 lll|[|l|| ISO
rss
Figure 9 b. Mass Spectrum of Scan 30 from Sample No. 2 , 1-Phenyl-3-Cyclohexene.
M- 104 .2
HP RECONSTRUCTED CHROMRTQGRRN
S A M P L E N O . 3 S A M P L E N A M E A F T E R B L A N K O P E R A T O R 2 J U L D A T E . T I M E D E L A Y E D S T A R T C O N D I T I O N S 1 9 0 I S O T H E R M A L
S T A R T M A S S
U P P E R M A S S
L O W E R M A S S
4 0
L I M I T 2 5 0 - 0
L I M I T 4 0 . 0
n ~ 158 .3
Figure 10 a. Chromatogram of Sample No.
50 100 "*•'» "-1" •
u. •* *VV •
I I"" SO 100
v /
a Piece of Blue-Gray Carpet.
Ui CO
59
| V L F I V M ' I | L 1 1 1 H ' M J M I I t t I
Figure 10 b. Mass Sppctrum of Scan 29 from Sample No. 3, l-Phenyl-3-Cyclohexene.
M = 1 0 4 - 2
HP RECONSTRUCTED CHRGMRTOGRRM
S A M P L E N O . « 4 S A M P L E N A M E O V - l O l O P E R A T O R 5 J J L D A T E . T I M E I P = 2 0 0 C O N D I T I O N S 1 9 0 I S O T H E R M A L
S T A R T M A S S 3 5
U P P E R M A S S L I M I T 2 5 9 . 0
L O W E R M A S S L I M I T 3 5 - 0
M = 1 5 8 . 2
A/
Figure 11 a. Chromatogram of Sample No. 4, a Piece of Golden-Brown Carpet.
CTs O
35
Figure 11 b. Mass Spectrum of Scan 23 from Sample No. 4, l-Phenyl-3-Cyclohexene.
DISCUSSION
This research was initiated in response to requests for assis
tance in identifying the indoor air pollutants causing eye and upper
respiratory irritation (see Appendix II). Since these episodes were
associated with the recent installation of new carpeting, it was of
interest to identify the specific agent(s) responsible for irritation
in affected individuals. A multiple program was undertaken to
1) identify the chemical component(s) causing the discomfort, and to
2) develop a gas chromatographic technique for measuring contaminant
levels in the workplace.
Initial studies to l-efine the gas chromatographic methods
focused on collecting headspace air from around offending jute or poly
propylene backed carpets. Activated carbon sorbent tubes were employed
to collect the contaminant(s). Air from workplace environments was
later collected to elucidate actual room levels.
As noted in the results, in the initial effort to identify the
major contaminants, gas chromatography-mass spectroscopy (GC-MS) was a
necessity. The separation of the constituents was accomplished using
gas chromatography, incorporating a 6' glass column packed with 10?o
OV-17 on 80/100 Chromosorb W-HP. The identification was performed on a
Hewlett-Packard 5985 mass spectrograph. These preliminary analyses
identified the volatiles emitted from the gas chromatographic column
as aliphatic and aromatic hydrocarbons, in particular l-phenyl-3-
cyclohexene which was the only compound in common in the first three
62
63
samples analyzed. The l-phenyl-3-cyclohexene was suspected as the
cause of mucous membrane irritation because a benzene ring allied with
the aliphatic portion enhances the chemical reactivity of the compound.
Subsequent to the preliminary GC-MS results, a gas chromato
graphic method was developed for 1-phenyl-l-cyclohexene, the only
available isomer of l-phenyl-3-cyclohexene, using a SE-30 (General
Electric) column. Later, vapors from the headspace of various carpet
samples were collected and analyzed using the same analytical param
eters. Interestingly, GC analysis of all carpet samples revealed the
same compound, later verified as l-phenyl-3-cyclohexene using GC-MS.
The presence of l-phenyl-3-cyclohexene was, therefore a general occur
rence associated with the presence of SBR latex backing on these carpets.
A search of the chemical literature showed that an odor attrib
utable to SBR latex, namely l-phenyl-3-cyclohexene, had been isolated
in a food stuff wrapping paper in Germany (Koszinowski, Miiller and
Piringer 1982). Additionally, Miksch, Hollowell and Schmidt (1982)
detected l-phenyl-3-cyclohexene emitted from SBR latex backed carpets,
although the compound was not specifically associated with the latex
binding itself nor with adverse health effects.
Further review of the literature, revealed that l-phenyl-3-
cyclohexene is produced as a side product during the polymerization of
styrene and butadiene (Alder and Rickert 1928). Koningsberger and
Salomon (1946) determined that l-phenyl-3-cyclohexene can be formed
from 1,3-butadiene and styrene via a Diels-Alder reaction. The
formation of l-phenyl-3-cyc.lohexene is illustrated on the following
page:
64
-t-
STYRENE 1,3-BUTADIENE
On$- OnD l-PHENYL-3-C»CLOHEXtNE
Thus, it is possible that varying amounts of this co-polymer may be
formed during the production of the styrene-butadiene latex. The
residual amount in a carpet may be a function of the curing process
used in the construction of carpets. The remainder then outgasses once
the carpet is unrolled and installed. It may be worthwhile for carpet
manufacturers to investigate the reasons why some carpets are more
odorous than others. This research indicates that phenyl-3-cyclohexene
in the latex may be responsible.
There are no reports in the literature on the toxicological
effects of l-phenyl-3-cyclohexene, however there are some data on an
isomer, 1-phenyl-l-cyclohexene. Martin et al. (1980) reported that
pyrolysis of phencyclidine (PCP) produced 1-phenyl-l-cyclohexene (PC)
and that both PC and PCP are found in smoke condensate from parsley
cigarettes containing PCP. Holsapple et al. (1982) examined the
toxicity of PCP and PC in mice. The acute lethality (LD^g) of PC by
intraperitoneal administration was 1575 pmoles/kg (24? mg/kg); whereas
the acute lethality (LD^g) of PC by intravenous injection was
436 /jmoles/kg (60 mg/kg). Holsapple et al. also determined that the
subchronic (14 day) exposure of mice to PC (634 jjg/kg) produced
measurable toxicity (decreased body and thymus weight) with an apparent
65
slight selectivity for the lymphoreticular system via intraperitoneal
administration as determined by decreased numbers of antibody forming
cells.
Cook et al. (1982) exposed 5 healthy human volunteers to PC in
PCP laced parsley cigarettes. Plasma and urine samples were obtained
from each subject and analyzed. The average maximum concentration of
PC in the plasma was 0.35 - 0.06 pmol/ml. Three nonpolar metabolites
were also detected. They speculated that fecal excretion eliminated
PC and its metabolites since only small amounts were detected in the
urine.
Martin et al. (1982) reported that mouse liver microsomes
metabolize PC to l-phenyl-l-cyclohexene-3-one and several hydroxylated
derivatives of PC, including 1-phenylcyclohexane-l,2-diol. Chakrabarti,
Song and Law (1983) investigated PC metabolism in rats and determined
that it is rapidly taken up and metabolized following intravenous or
intraperitoneal administration. PC also undergoes extensive entero-
hepatic recycling. They also speculate that at least two types of
epoxides may be involved in the formation of the reactive metabolites %
of PC, namely phenylcyclohexene oxide and cyclohexene aryl oxide. To
date there is no inhalation toxicity data for PC in the literature.
Air monitoring conducted during this investigation demonstrated
10-15 ppb of l-phenyl-3-cyclohexene in office spaces with newly
installed carpeting. Emissions from all samples collected to date
demonstrate the presence of a predominant substance, namely l-phenyl-3-
cyclohexene, common to all carpet samples tested to date. Although
simpler aliphatic and/or aromatic compounds were found to be emitted
from certain carpet samples (i.e. dimethyl benzene, propyl benzene,
and low molecular weight hydrocarbons) they were not common to all
samples. In fact, in two carpet samples, only l-phenyl-3-cyclohexene
was measurable; traces of other substances were observed. Certainly,
there is no toxicological evidence in animals or humans to suggest that
minute airborne levels of these other substances would result in the
C. Mutagenic 1. 5almonella Reverse Mutation Test (Ames Test)
D. Chronic 1. Oncogenicity
a. Mouse b. Rat
E. Test for Potential Reproductive Effects 1. Fertility and Reproductive Capability - Rats 2. Teratology Testing - Rats 3. Multigeneration Reproduction Test - Rats
II. Human Studies
A. Acute 1. Single Contact Patch Test 2. Repeat Patch Test 3. Skin Sensitization (Allergy Testing)
69
SELECTED BIBLIOGRAPHY
1984, Air Pollution Inside Homes May Be Greater Than Outside. Morris (111.) Daily Herald, March 29, p. 11.
Alder, K. and H. F. Rickert. 1936. Zur Kenntnis der Dien-Synthese, IV. Mitteil: Uber den Aufbau von Diphenyl- und Fluoren-Ringsystemen; arylierte Athylene als Olefinkomponenten fur Dien-synthesen. Ber. Deut. Chem. Ges. 71B; 379-386.
Andersen, I., L. Seedorff and A. Skov. 1982. A Strategy for Reduction of Toxic Indoor Emissions. Environ. Int. 8^: 11-16.
Armstrong. 1977. How to Shop for Carpet: Your Basic Guide to Fiber, Construction, and Performance, (pamphlet) Lancaster, Pa.: Armstrong Cork Company.
Armstrong, A. A., R. D. Borie and W. W. Lanier. 1978. Residual Solvent and its Diffusion in Acrylic Fibers. Org. Coat. Plast. Chem. 39: 306-308.
Berglund, B., U. Berglund, T. Lindvall and H. Nicander-Bredberg. 1982. Olfactory and Chemical Characterization of Indoor Air. Towards a Psychophysical Model for Air Quality. Environ. Int. 8_: 327-332.
Berglund, B., I. "Johansson and T. Lindvall. 1982a. A Longitudinal Study of Air Contaminants in a Newly Built Preschool. Environ. Int. 8: 111-115.
. 1982b. The Influence of Ventilation on Indoor/Outdoor Air Contaminants in an Office Building. Environ. Int. j3: 395-399.
Breysse, P.A. 1981. The Health Cost of 'Tight' Homes. JAMA 245: 267-268.
Chakrabarti, S., Y. Y. Song and F. C. P. Law. 1983. Metabolic Disposition and Irreversible Binding of 1-Phenylcyclohexene in Rats. Tox. Appl. Pharm. 69; 179-184.
Chapin, F. S. 1974. Human Activity Patterns in the City. New York: Wiley-Interscience.
70
74
Cocheo, V., M, L. Bellomo, G. G. Bombi. 1983. Rubber Manufacture: Sampling and Identification of Volatile Pollutants. Am. Ind. Hyg. Assoc. J. 44: 521-527.
Cook, C. E., D. R. Brine, G. D. Quin, M. Perez-Reyes, and S. R. Di Guiseppi. 19B2. Phencyclidine and Phenylcyclohexene Disposition after Smoking Pehncyclidine. Clin. Pharmacol. Ther. 31: 635-641.
Ferrand, E. F. and S. Moriates. 1981. Health Aspects of Indoor Air Pollution: Social, Legislative, and Economic Considerations. Bull. NY Acad. Med. 57: 1061-1066.
Gold, M. 1980. Indoor Air Pollution. Science 80, March/April: 30-33.
Gregory, J. 1981. Office Air Quality, 'Tight Buildings,' and Job Stresses—The Impact on Women Office Workers' Occupational Health. Paper presented at the American Industrial Hygiene Association — American Conference of Governmental Hygienists Conference, Portland, May 25.
Gupta, K. C., A. G. Ulsamer and P. W. Preuss. 1982. Formaldehyde in Indoor Air: Sources and Toxicity. Environ. Int. 349-358.
Hicks, J. B. 1984. Tight Building Syndrome; When Work Makes You Sick. Occup. Health Saf. 84: 51-57.
Hollowell, C. D., J. V. Berk, M. L. Boegel, J. G. Ingersoll, D. L. Krinkel and W. W. Nazaroff. 1980. Radon in Energy-Efficient Residences. LBL Report 9560 EEB-vent 79-16.
Hollowell, C. D. and R. R. Miksch. 1981. Sources and Concentrations of Organic Compounds in Indoor Environments. Bull. NY Acad. Med. 57s 962-977.
Holsapple, M. P., A. E. Munson, A. S. Freeman and B. R. Martin. 1982. Pharmacological Activity and Toxicity of Phencyclidine (PCP) and Phenylcyclohexene (PC), a Pyrolysis Product. Life Sci. 31: 803-813.
International Union of Pure and Applied Chemistry. 1960. Definitive Rules for Nomenclature of Organic Chemistry. J. Amer. Chem. Soc. 82: 5545-5574.
Johansson, I. 1978. Determination of Organic Compounds in Indoor Air with Potential Reference to Air Quality. Atmos. Environ. 12: 1371-1377.
Juppe, G., S. Sandroni and C. Beaudet. 1969. Vergleichende Spektrosko-pische Untersuchungen an Substituierten Cycloolefin und Cyclo-hexadienen. Z. Naturforsch. B. 24: 524-529.
7.2
Koningsberger, C. and G. Salomon. 1946. Preparation and Properties of Rubberlike High Polymers. II. Polymerization of Mixtures in Bulk. J. Polym. Sci. 1_: 353-363.
Koszinowski, J., H. Muller, and 0. Piringer. 1980. Identifizierung und Qualitative Analyse von Geruchsstaffen in Latex-gestrichenen Papieren. Coating 13 s 310-314.
Martin, B. R., B. B. Gailey, H. Awaya, E. L. May and N. Narasimhachari. 1982. In vitro Metabolism of ]-Phenyl-l-Cyclohexene, A Pyrolysis Product of Phencyclidine in Smoke. Fed. Proc. Fed. Am. Soc. Exp. Bio. 41: 1639 (no. 8005).
Martin. B. R., A. S. Freeman, K. L. Kelly, V. M. Clayton, W. C. Vincek and L. S. Harris. 1980. Fate of Phencyclidine in a Burning Cigarette. Fed. Proc. Fed. Am. Soc. Exp. Bio. 39: 302 (no. 189).
Meyer, B. 1983. Indoor Air Quality. Reading, Mass.: Addison-Wesley Publishing Company, Inc.
Miksch, R. R., C. D. Hollowell and H. E. Schmidt. 1982. Trace Organic Chemical Contaminants in Office Spaces. Environ. Int. 8^: 129-137.
Molhave, L. 1982. Indoor Air Pollution Due to Organic Gases and Vapours of Solvents in Building Materials. Environ. Int. j3: 117-127.
Moschandreas, D. J. 1981. Exposure to Pollutants and Daily Time Budgets of People. Bull. NY Acad. Med. 57: 845-859.
Myler, K. 1984. Office Designers Grappling with 'Indoor Pollution.' Chicago Tribune, January 8, sect. 6, p. 1.
National Research Council. 1981. Indoor Pollutants. Washington, D.C.: National Academy Press.
Pestemer, M. and L. Wiligut. 1935. Die Ultraviolettabsorption einiger Aromatischer Kohlenwasserstoffe (3. Milleilung) Zur Konstitution des Tetrahydrodiphenyls. Monatsh. Chem. 66: 119-128.
Porter, D. 1982. Latex Applications in Carpets, in Polymer Latices and Their Applications, ed. K. 0. Calvert. New York: McMillan Publishing Co., Inc.
Prince, D. C. and J. V. Karabinos. 1940. The Dehydration of cis- and trans-2-Phenylcyclohexanols. J. Am. Chem. Soc. 62: 115—1161.
71
Repace, J. L. 1982. Indoor Air Pollution. Environ. Int. 8/. 21-36.
Robinson, G. 1972. Carpets and Other Textile Floorcoverings. Great Britain: Textile Book Service.
Sexton, K. and R. Repetto. 1982. Indoor Air Pollution and Public Policy. Environ. Int. B: 5-10.
Shoskes, L. 1974. Contract Carpeting. New York: Watson-Guptill Publications.
Spengler, J. D. and K. Sexton. 1983. Indoor Air Pollution: A Public Health Perspective. Science 221 (4605): 9-17.
Staples, B. 1984. Is the Air You're Breathing Hurting You? Chicago Sun-Times, February 26, "Trends", p. 20.
Sterling, T. D. and D. M. Kobayashi. 1977. Exposure to Pollutants in Enclosed 'Living Spaces.' Environ. Res. 13: 1-35.
Sundell, J. 1982. Guidelines for Nordic Building Regulations Regarding Indoor Air Quality. Environ. Int. IB: 17-20.
United Nations. World Health Organization. 1979. Health Aspects Related to Indoor Air Quality. EURO Reports and Studies. Copenhagen: World Health Organization, April 3-6.
U. S. Department of Commerce. National Bureau of Standards. 1978. EPA/NIH Mass Spectral Data Base, vol. 1: Molecular Weights 30-186. Washington, D.C.: GP0.
U. S. Environmental Protection Agency. 1977. The Status of Indoor Air Pollution Research 1976: Final Report. Washington, D.C.: GP0.
U. S. General Accounting Office. 1980. Indoor Air Pollution: An Emerqinq Health Problem. Report to the Congress. Washington,
D.C.: GP0.
Van Der Lende, R. 1980. Health Aspects Related to Indoor Air Pollution. Int. J. Epidemiol. 9: 195-197.
Wadden, R. A. and P. A. Scheff. 1983. Indoor Air Pollution: Characterization, Prediction and Control. New York: John Wiley & Sons.
Woods, J. E. 1979. Ventilation, Health & Energy Consumption: A Status Report. ASHRAE J. 21 (July): 21-27.