INFORMATION TO USERS This reproduction was made from a copy of a document sent to us for microfilming. While the most advanced technology has been used to photograph and reproduce this document, the quality of the reproduction is heavily dependent upon the quality of the material submitted. The following explanation of techniques is provided to help clarify markings or notations which may appear on this reproduction. I. The sign or "target" for pages apparently lacking from the document photographed is "Missing Page(s)". If it was possible to obtain the missing page(s) or section, they are spliced into the film along with adjacent pages. This may have necessitated cutting through an image and duplicating adjacent pages to assure complete continuity. 2. When an image on the film is obliterated with a round black mark, it is an indication of either blurred copy because of movement during exposure, duplicate copy, or copyrighted materials that should not have been filmed. For blurred pages, a good image of the page can be found in the adjacent frame. If copyrighted materials were deleted, a target note will appear listing the pages in the adjacent frame. 3. When a map, drawing or chart, etc., is part of the material being photographed, a definite method of "sectioning" the material has been followed. It is customary to begin filming at the upper left hand corner of a large sheet and to continue from left to right in equal sections with small overlaps. If necessary, sectioning is continued again-beginning below the first row and continuing on until complete. 4. For illustrations that cannot be satisfactorily reproduced by xerographic means, photographic prints can be purchased at additional cost and inserted into your xerographic copy. These prints are available upon request from the Dissertations Customer Services Department. 5. Some pages in any document may have indistinct print. In all cases the best available copy has been filmed. University MicrOfilms International 300 N. Zeeb Road Ann Arbor, MI48106
Transcript
INFORMATION TO USERS
This reproduction was made from a copy of a document sent to us for microfilming.While the most advanced technology has been used to photograph and reproducethis document, the quality of the reproduction is heavily dependent upon thequality of the material submitted.
The following explanation of techniques is provided to help clarify markings ornotations which may appear on this reproduction.
I. The sign or "target" for pages apparently lacking from the documentphotographed is "Missing Page(s)". If it was possible to obtain the missingpage(s) or section, they are spliced into the film along with adjacent pages. Thismay have necessitated cutting through an image and duplicating adjacent pagesto assure complete continuity.
2. When an image on the film is obliterated with a round black mark, it is anindication of either blurred copy because of movement during exposure,duplicate copy, or copyrighted materials that should not have been filmed. Forblurred pages, a good image of the page can be found in the adjacent frame. Ifcopyrighted materials were deleted, a target note will appear listing the pages inthe adjacent frame.
3. When a map, drawing or chart, etc., is part of the material being photographed,a definite method of "sectioning" the material has been followed. It iscustomary to begin filming at the upper left hand corner of a large sheet and tocontinue from left to right in equal sections with small overlaps. If necessary,sectioning is continued again-beginning below the first row and continuing onuntil complete.
4. For illustrations that cannot be satisfactorily reproduced by xerographicmeans, photographic prints can be purchased at additional cost and insertedinto your xerographic copy. These prints are available upon request from theDissertations Customer Services Department.
5. Some pages in any document may have indistinct print. In all cases the bestavailable copy has been filmed.
UniversityMicrOfilms
International300 N. Zeeb RoadAnn Arbor, MI48106
8319829
Chun, Michael Ah Sang
THE RELATIONSHIP OF PERSONALITY, ROLE EXPECTATION, SELECTIONCRITERIA SCORES, AND SELECTED DEMOGRAPHIC VARIABLES UPONSELECTION INTO THE EDUCATIONAL MANAGEMENT TRAINING PROGRAMIN HAWAII
University of Hawaii
UniversityMicrofilms
International 300N. Zeeb Road,Ann Arbor, M148106
Eo.D. 1983
Copyright 1983
by
Chun, Michael Ah Sang
All Rights Reserved
THE RELATIONSHIP OF PERSONALITY, ROLE EXPECTATION,SELECTION CRITERIA SCORES, AND SELECTED
DEMOGRAPHIC VARIABLES UPON SELECTIONINTO THE EDUCATIONAL I~NAGEMENT
TRAINING PROGRAM IN HAWAII
A DISSERTATION SUBMITTED TO THE GRADUATE DIVISIONOF THE UNIVERSITY OF HAWAII IN P~.~TIAL
FULFILLMENT OF THE REQUIRE' ..loJ"rSFOR THE DEGREE OF
DOCTOR OF EDUCATION
IN EDUCATIONAL ADMINISTRATION
May 1983
By
Michael A. S. Chun
Dissertation Committee:
John A. Thompson, ChairmanCharles Araki
Sheldon VarneyMitsuo Adachi
Fred Braun
~ Copyright by Michael Ah Sang Chun 1983
All Rights Reserved
iii
iv
ACKNOWLEDGMENTS
Throughout the months since this study began, I
have had the guidance or encouragement from people who have
been close to me, either in a professional capacity or as
friends. I wish to acknowledge their contribution to the
completion of this study.
I would like to acknowledge the help rendered to me
by my committee chairman John Thompson throughout the con
ceptualization and writing of this dissertation. His
encouragement and advice reflected the same professional
help given me since he first spoke to me on becoming a
doctoral candidate and during the period when coursework
were being pursued. His queries helped strengthen many of
the concepts I have often taken for granted. He kept me
going when it was necessary and was always there when needed.
Without his help this study would not have been completed.
I am grateful as well to other committee members,
Mitsuo Adachi, Charles Araki, Fred Braun, and Sheldon Varney
for their patience and guidance given me on the many features
of the dissertation. I am thankful to the secretary Susan
Omori for her patience in always finding the time when I
needed to meet with any of the committee members.
Finally, a special thanks to my wife Audrey who never
doubted that this study could be done.
v
ABSTRACT
The purpose of this study was to test series of
hypotheses and answer ancillary questions on: one, the
accuracy of the Hawaii State Department of Education (D.O.E.)
Educational Management Training Program (EMTP) selection
criteria (Academics, Interview, Observation, and Peer
Evaluation) in the selection of candidates to become
educational administrators. Two, the degree to which groups
of selectees, non-selectees, and a sample of practicing
educational administrators differed on theirrespon3~ to a
set of inventories which represented their perception of
role expectations and need dispositions. Three, a comparison
of selected personal characteristics (age, years of service
in the department, and sex) to determine whether there were
systematic differences between those who were selected to be
potential administrators and those who were not.
The population of the study were all the people who
have volunteered for the EMTP from 1976 through 1982. The
subjects in the sample were the candidates who participated
in the EMTP, Phase I selection process during 1976, 1977,
1978, and a purposive sample of educational administrators
who served as observers and raters during the process. The
methodology employed was a comparison for differences be
tween the selectees and non-selectees on their scores on
vi
the EMTP selection criteria, the sub-scale scores on the
personality and role expectation inventories (the Managerial
Philosophies Scale, Management of Motive Index, and Funda
mental Interpersonal Relations Orientation-Behavior), and
scores on the EMTP, Phase I selection criteria. The
educational officers were also compared to the selectees and
non-selectees on personal characteristics and the persona
lity and role expectation inventories. The three groups,
the selectees, the non-selectees, and the educational
officers, were designated as the independent variables and
the four EMTP, Phase I selection criteria, sub-scales on
the personality and role expectation inventories, and the
data on the personal characteristics were the dependent
variables.
The data were analyzed using the following statis
tical procedures: t-test to identify the differences between
the groups on age, years of service, EMTP selection criteria,
and personality and role expectation sub-scale measures; a
chi-square to determine whether differences existed between
the groups on the sex trait; and, discriminant analysis to
determine which traits made a significant contribution to a
candidate either being selected or not into the leadership
group.
The major findings from the hypotheses and ancillary
questions which were posed to test the purposes listed above
vii
were:
The selectees scored higher than the non-selectees on each
EMTP, Phase I selection criteria. The significance of the
t-test on the difference between the groups for each cri
terion was at the p=.OOO level. However, after performing
a discriminant analysis on the four variables, only three
(Academics, Interview, and Peer Observation) were found to
discriminate between candidates being selected or not
selected into the educational officer's group. Using the
three criteria, 80.8 per cent of the cases were correctly
classified. The EMTP, Phase I criterion Observation failed
to reach the required level of significance to be included
as an effective contributor to the selection or non
selection process.
The Managerial Philosophies Scale and the Management of
Motive Index inventories indicated that the non-selectees
were more Theory X, or traditionally, oriented in their
managerial philosophy, and showed a greater need for Basic
Creature Comforts than the selectees.
On the FIRO-B sub-scale measures, the selectees tended to
be more similar to the sample of administrators who served
as observer/raters than the non-selectees. Of the ten sub
scales measures, there were no significant differences
between the selectees and observer/raters on eight measures,
while the non-selectees differed from the observer/raters on
viii
six measures.
A discriminant analysis was run on the personality and role
expectation inventories (MPS and MMI) for the selectees and
non-selectees; three sub-scale measures were factored out
which could contribute to the candidates either being
selected or not selected into the educational officer's
group. The sub-scales were Theory X, Theory Y, and Basic
Creature Comfort. Using only the scores on these three
variable measures, it was possible to properly classify
64.2 per cent of the candidates.
The findings relative to the differences in certain personal
characteristics revealed that the selectees were younger
(p=.009) and had more years of service in the D.O.E. (p=.Ol).
However, there was no significant difference between the
selectees and non-selectees on the basis of their sex.
Based on the findings, the following conclusions
are indicated:
1. Only three EMTP, Phase I selection criteria (Academics,
Interview, and Peer Evaluation) were identified as effective
contributors to the selection process. The discriminant
analysis did not factor out the criterion Observation as an
effective selection technique. Its continued use in the
EMTP, Phase I Program should be questioned.
2. The fact that the cut-off score on the EMTP selection
criteria which was used to select the successful candidates
ix
(twenty per cent of each group each year) varied from year
to year would appear to indicate a lack of consistency in
the standards used for selecting candidates into the edu
cational leadership group. A score which would have
qualified one for selection in one year might not have
sufficed in another. The lack of continuity in scoring
from one year to the next may have deprived the D.O.E. of
additional candidates.
3. When the discriminant analysis was run on EMTP, Phase I
selection criteria, the results indicated the possibility
that forty-four or more non-selectees may have been quali
fied since their qualifications were similar to those of
the selectees.
4. The D.O.E. has scores on the personality and role
expectation inventories (MPS, 11MI) for each of the candi
dates who have participated in the EMTP, Phase I sessions,
but they have not been used systematically in the selection
process. The discriminant analysis has shown that three of
the sub-scales (Theory X, Theory Y, and Basic Creature
Comfort) can be used to contribute to the selection process.
5. Using the results from the FIRO-B measures, there are
indications that the department may be selecting a new
group of administrators who have personality and institu
tional attributes which are very similar to those of the
current group of administrators.
x
6. Based on the results of the study, the conclusion that
the D.O.E. has been successful in selecting candidates who
meet the institutional role expectations for its educational
officers is warranted. Also, one may conclude that the
needs disposition of the selectees are congruent with those
expectations. Finally, the scores on the inventories in
dicate the selectees were more prone to be "risk takers"
(a quality which is generally associated with successful
leadership) than those not selected.
xi
TABLE OF CONTENTS
Page
ACKNOWLEDGMENTS.
ABSTRACT ..•
LIST OF TABLES
LIST OF FIGURES.
iv
v
. xvi
. . xviii
CHAPTER I. INTRODUCTION AND STATEMENT OF THE PROBLEM •
Introduction
1
1
Overview of the Hawaii State EducationalSystem. . . . . . . . . . . . . . 2
Previous Efforts to Select and TrainEducational Administrators. • • • 4
Current Efforts to Select and TrainEducational Administrators. • . 9
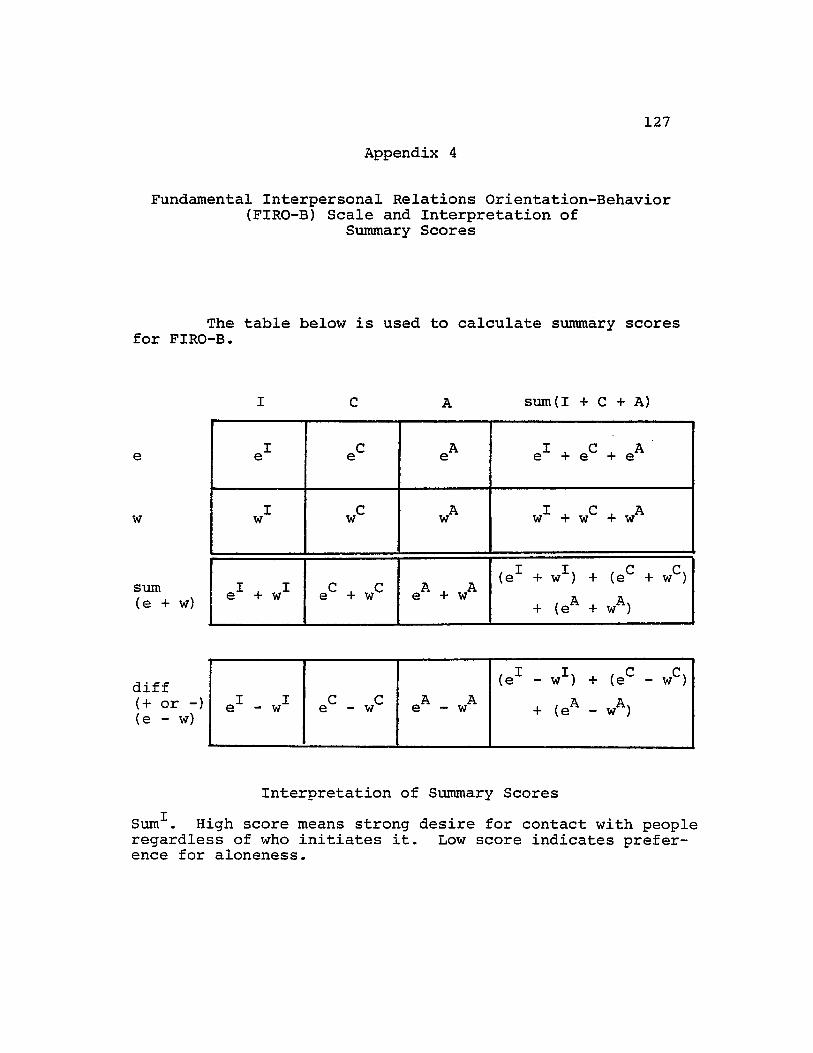
FIRO-B Scale and Interpretation ofSummary Scores . • • •
xv
Page
124
. 125
126
• • 127
• 129
Tables
1
2
3
4
5
6
7
8
LIST OF TABLES
Dependent Variables Used in the Study •
Numbers, Ranges, and Means of Years inService. • • • •••••.
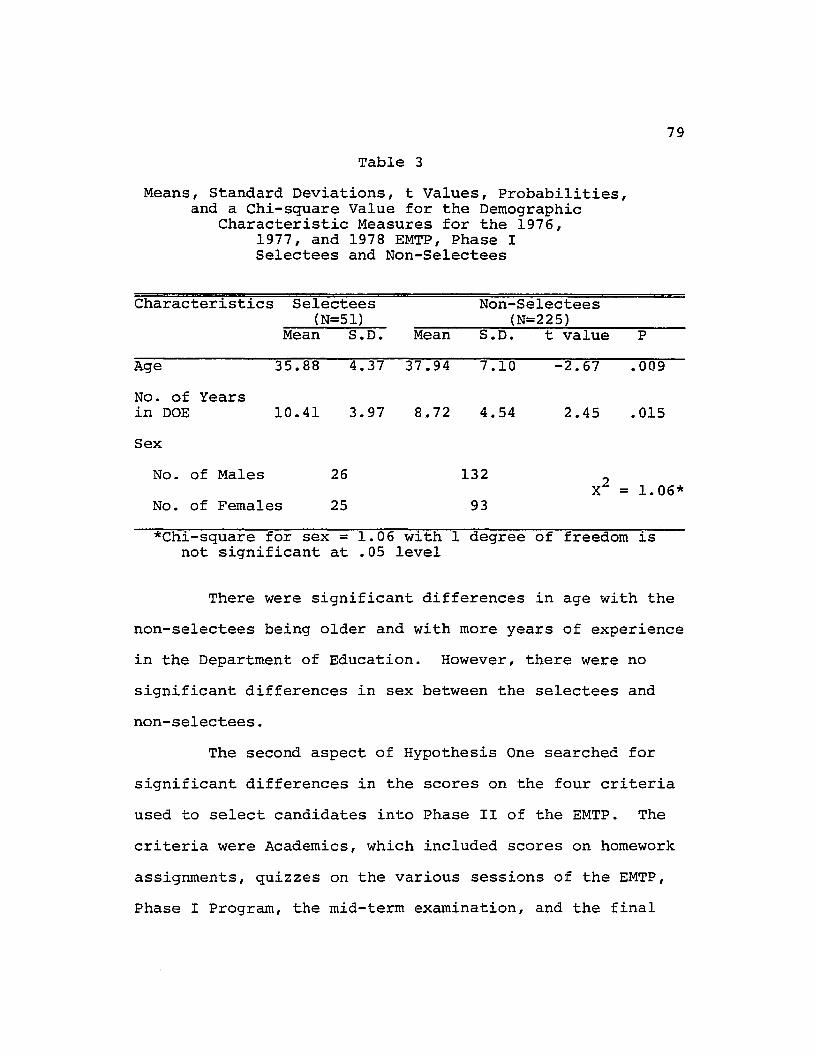
Means, Standard Deviations, t Values,Probabilities, and a Chi-square Valuefor the Demographic CharacteristicMeasures for the 1976, 1977, and 1978EMTP, Phase I Selectees and Non-Selectees••••••••••••
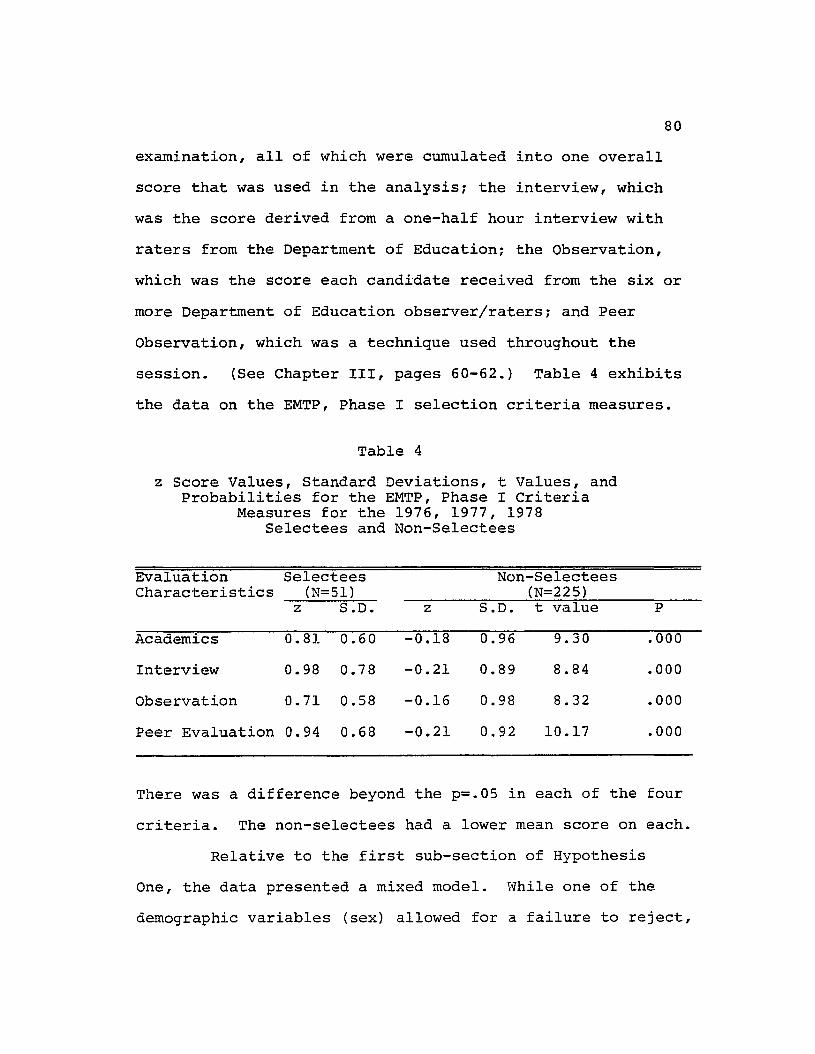
Z Score Values, Standard Deviations,t Values, and Probabilities for theEMTP, Phase I Criteria Measures forthe 1976, 1977, 1978 Selectees andNon-Selectees••••••••.•••.
Means, Standard Deviations, t Values andProbabilities for Personality and RoleExpectation Measures (MPS, MMI) for the1977 and 1978 EMTP, Phase I Selecteesand Non-Selectees•••••••••
Means, Standard Deviations, t Values, andProbabilities for the Sub-Scales ofFIRO-B for the 1976, 1977 and 1978EMTP, Phase I Selectees and theTwenty-Four Non-Selectees. • • . • ••.•
Means, Standard Deviations, t Values,Probabilities, and a Chi-square Valuefor the Demographic CharacteristicMeasures for the 1977 and 1978 EMTP,Phase I Selectees and the Observer!Raters . . . . . . . . . . . . . . .
Means, Standard Deviations, t Values,Probabilities for Personality and RoleExpectation Measures for the 1977 and1978 EMTP, Phase I Selectees and theObserver/Raters. • • • . • • . . . .•
xvi
Page
65
77
79
80
82
84
86
88
Tables
xvii
Page
9 Means, Standard Deviations, t Values,Probabilities, and Chi-square Valuefor the Demographic CharacteristicMeasures for the 1977 and 1978 EMTP,Phase I Non-Selectees and the Observer/Raters • • • • • • • • • • • 90
10 Means, Standard Deviations, t Values andProbabilities for the Sub-Scales of theMPS and MMI for the 1977 and 1978 EMTP,Phase I Non-Selectees and the Observer/Raters . . . . . . . . . . . . . . . . 91
11 Means, Standard Deviations, t Values, andProbabilities for the Sub-Scales ofFIRO-B for the 1977 and 1978 EMTP,Phase I Selectees and the Observer/Raters . . . . . . . . . . . . . . . . .. 93
12 Means, Standard Deviations, t Values,Probabilities and a Chi-square Valuefor the Demographic CharacteristicMeasures for the Twenty-Four Non-Selectees and the Observer/Raters • • 95
13 Means, Standard Deviations, t Values andProbabilities for the FIRO-B LeadershipCharacteristic Measures for the Observer/Raters and the Group of Twenty-Four Non-Selectees • • . • . . . • • • . • • • 96
14 Analysis of the Discriminant Function onEMTP, Phase I Criteria Measures for the1976, 1977 and 1978 EMTP, Phase ISelectees and Non-Selectees • • • • • . • • 100
15 Analysis of the Discriminant Function onSub-Scale Measures of MMI and MPS forthe 1977 and 1978 EMTP, Phase ISelectees and Non-Selectees • • • . 102
Figure
1
2
3
4
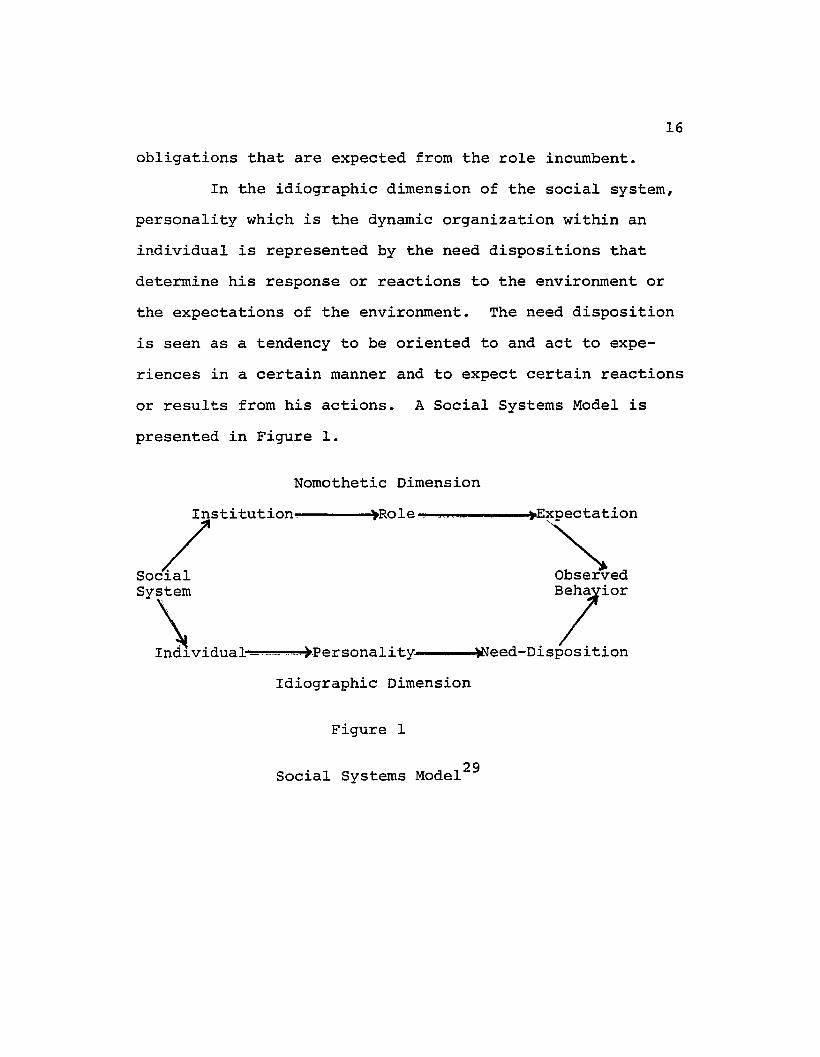
LIST OF FIGURES
Social Systems Model
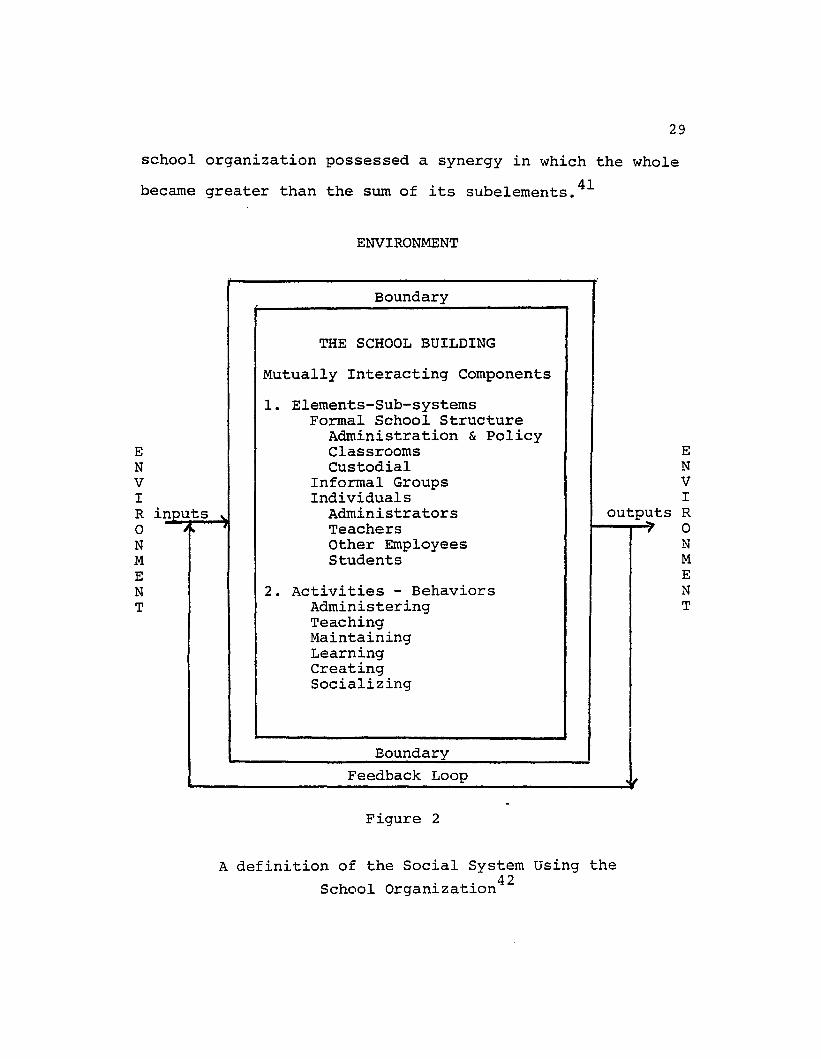
A Definition of the Social System Usingthe School Organization • • •
An Abbott Adaptation of the Getzels-GubaSocial Systems Model
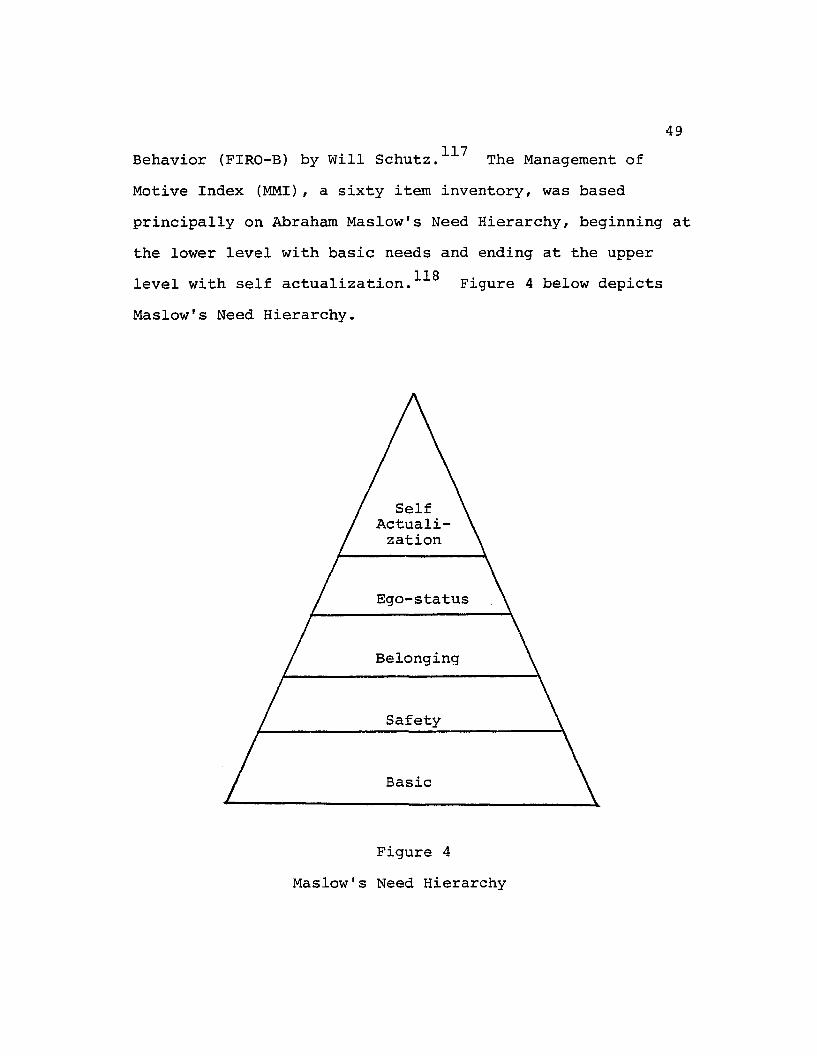
Maslow's Need Hierarchy.
xviii
Page
• 16
29
• 32
• 49
CHAPTER I
INTRODUCTION AND STATEMENT OF THE PROBLEM
Chapter I contains an introduction to the study
and statement of the problem. The introduction includes a
section on the history of the selection procedures and an
indication of the mix of leadership qualities that the
Hawaii State Department of Education desires in its
educational officers. A discussion of the conceptual
framework and its purpose in the study are also presented.
The statement of the problem includes purpose and the
hypotheses and research questions to be studied. Chapter I
also includes a discussion of the limitations of the study.
Introduction
The study of the concept of leadership and the
relationship it may have to the personality traits of
incumbent educational officers, as well as those who may
aspire to such posts, has and continuffito provide a major
theme for research in the field of educational administra
tion. The interrelationship of the two factors has meant
many things to many people, and when members of the
educational community, parents, students, and the community
at large express concern about an educational officer or
administrator they may be, in one way or another, reacting
2
to aspects of either his or her leadership style or
personality characteristics. Since many interactive
factors make up personality and leadership styles,
agreement about the mix of characteristics which may
contribute to the creation of successful administrators has
seldom been achieved. However, it does appear that the
expectations for leadership are not the same today as they
have been in the past, and future expectations undoubtedly
will differ markedly from either the past or the present.
As the agency directly involved with the selection
and placement of educational officers (i.e., principals and
vice principals), the Hawaii State Department of Education
(DOE) has had particular interest in attempting to deter-
mine what factors constitute an optimal mix of personal and
organizational qualities desirable in its educational ad
ministrators. The past efforts of the DOE to address this
problem in the selection, training, and placement of educa
tional officers are reviewed in the next section of this
study.
Overview of the Hawaii State Educational System
Hawaii, the 50th State of the Union, is made up of
and Niihau. The public schools on these islands are all
operated as a single school system, the Hawaii State
Department of Education (DOE). The members of the Board of
3
Education for the district are elected by the populace and
are charged with the overall management of the system. The
development of policies and directions in the management of
the school system have been the responsibility of the board,
as is true in most school districts, but the taxing and re
source allocation function are under the direct control of
the state legislature rather than the Board of Education.
To assist the board in its deliberations there are seven
School Advisory Councils whose members are appointed by the
Governor of the State of Hawaii.
The Department of Education is divided into seven
districts, four on the island of Oahu, one on the island of
Hawaii, one on Maui, and one on Kauai. There are over two
hundred and twenty public schools which service one hundred
and sixty thousand plus students. The department employs
some five thousand teachers and counselors. The adminis
trators for the system number over six hundred.
Issues and concerns of the Department of Education
are similar to those commonly found in school districts
throughout the states of the union. They include problems
related to: curriculum development, servicing of regular
and special student populations~ student evaluation,
inservicing of teachers, and the identification and develop
ment of new educational officers for the department.
4
Previous Efforts to Select and Train EducationalAdministrators
An overview of the role of the Hawaii scat;e Depart
ment of Education in the development of programs for the
selection and training of school level administrators from
the 1950's to the present is presented. Verbal descrip-
tions by retired and very senior educational administra
tors l,2,3,4 of the Hawaii State Department of Education,
plus the rather meager number of departmental records5
written during the last twenty years, seem to indicate that
the process of seeking principals from within the ranks of
the Department of Education personnel was essentially highly
unorganized and tended to be somewhat informal.
Prior to the 1950's~ written records of the tech-
niques or programs for the selection and training of
principals and other educational officers were limited6 and
occasionally inaccurate in detail. It would appear that
the selection and appointment of administrators, or as they
are termed in Hawaii, educational officers, to positions
prior to 1950 were primarily predicated upon recommendations
from both the lay and educational leadership of the various
communities in which the schools were located. 7,8,9,10 A typi-
cal case might have been one where the district superintendent
received a recommendation about a likely candidate for an
administrative position. After a perusal of the candidate's
personnel records and a series of interviews, the person
5
was appointed into the first available educational leader
ship position. For local candidates, there did not appear
a requirement that they undertake formal academic training
in administration. The selectees were left on their own
to administer the school. l l,12,13 It should be noted,
however, that since a number of the superintendents were
hired from the continental United States, they brought a
number of experienced and trained principals with them to
administer the schools. 14,15 These individuals had been
subjected to the certification standards then in effect in
the states from which they came. Consequently, there was a
gap in terms of the formal training between the local
incumbents and those from the continent.
In 1957 the Department of Education instituted a
more structured program for the recruitment, academic pre
paration, and placement of educational officers which was
called the Leadership Training Program (LTP) .16 The program
was open to all applicants who possessed a professional
teaching certificate plus three years of successful teach
ing experience. The candidates for the program were
required to take examinations for selection into the LTP
Program. Data on the specific examinations or inventories
used for this period are not available in the department's
written records. It can be surmised, however, that the
Department of Education used selection processes already on
hand. They included the use of the candidates' personnel
6
records, interviews, their experience, and ratings from the
field.
After selection into the LTP, candidates had to
complete a program which consisted of twenty-four semester
hours of course work at the University of Hawaii. Training
of the selected candidates included weekly seminars at the
university and a limited form of internship at one of the
public schools. 17 Appointments to educational officer
. t' 11" . 1 18 Wh' 1 hpos~ ~ons were genera y as v~ce-pr~nc~pa • ~ e t e
Leadership Training Program was initially a two-year pro-
gram, it was scaled down to a one year period in the early
1960's.19 Currently, there are no analytic studies of the
effect of the Leadership Training Program (LTP) on either
the quality of leadership or the personality characteris-
tics of the candidates selected. The Department of Educa-
tion's only claim to validity for any of its selection
processes or program was based on empiricism.
During the early 1960's the Office of Personnel
Services within the Department of Education leaned toward
instituting certain changes in the Leadership Training
20Program (LTP). Refinements were made in the assessment of
the potential candidates and the training program was made
more intensive. The Leadership Training Program was re
21named the Administrative Internship Program. The first
group of selected candidates began their training in 1961.
Like the LTP, all candidates who possessed a
7
professional teaching certificate and three years of
teaching experience were eligible to apply. Each candi
date underwent an eight hour battery of tests known as
the Professional School Administrator's Examination. 22,23
They include the Miller Analogies Test, the Administration
and Supervision Examination, the Minnesota Teacher Attitude
Inventory, the Strong Vocational Interest Inventory, and the
California Psychological Inventory. Additionally, a
written autobiography was required of each candidate. The
educational background and experiences and the ratings from
five references of each candidate were then scrutinized
against the tests and inventory results.
An interview of each of the candidates followed. It
should be noted that while personality structure and adjust-
ment in the evaluation process were factors in the recruit-
ment of candidates, the scores on the instruments cited'
above were also used by evaluators to arrive at an assessed
judgment of each of the candidates. While there were no
passing scores on the series of exams, the pattern of the
scores achieved on the various instruments was important in
the selection of candidates to be a part of the Administra-
t" 24~ve Intern Program.
The candidates who were selected were relieved of
their teaching assignments for one semester when they were
selected to be part of the program. During the semester
the candidates served three days a week in a school as an
8
intern under an experienced principal. A professor from
the Department of Education Administration, University of
Hawaii, supervised each intern. The intern was expected to
maintain a record of his experiences as an on-the-job
assistant to the principal, or in a few ca2es, an adminis
trative officer at a different level in the Department of
Education hierarchy.
During the other two days of the week, the interns
gathered at a central training site and worked under the
tutelage of the professors from the Department of Educa
tional Administration. They deliberated on a variety of
case studies, did course work, went on field trips and
visitations to various educational institutions, partici
pated in group or individual projects, and held conferences
with the professors.
In the course of the semester, the intern attended
two evening counseling sessions per week with a professional
psychologist. The purpose of the sessions was twofold:
(1) they aided members to better understand and handle their
personal lives" and (2) they helped to identify those in
terns who may have possessed major personality problems.
After the interns successfully completed the one
semester program, they were officially eligible to compete
for vacant a~~inistrative positions. However, before they
could receive a Hawaii State Department of Education Admin
istrator's Certiciate, they had to complete twenty-one
9
semester hours of course work in the Department of Educa-
tional Administration at the University of Hawaii.
The AlP Program continued until 1974, when funding
constraints brought it to a halt. From 1973 to 1976, there
were no recruiting or training programs, and as a result no
new administrators were trained. Vacancies were filled with
members who had completed the AlP Program and were waiting
for a position as vice principal.
Current Efforts to Select and Train EducationalAdministrators
During the year 1976, a new program called the
Education Management Training Program (EMTP) was developed. 25
Its purpose was to recruit, train, and select from a pool of
candidates a cadre of people to fill the ranks of school-
level administrators. Those chosen were primarily members
who exhibited strong management and leadership potential.
Quoted below is the EMTP Selection Process Philosophy:
The selection process is a vital key tothe success of this project.
The importance of the selection processdictates that the identification and selectionof candidates shall be accomplished by recognizedand strongest managerial and leadership personnelwithin the department.
The success of this project depends heavilyupon the ability of the selectors to recognizeand appraise qualitatively or comparatively, thesignificantly sought characteristics of candidates.
Potential leadership characteristics soughtare general intelligence, individuality, motivation, creativity, independence, and innovativeness.
10
The potential individual should be actionoriented and willing to take the risk ofexpediting matters quickly at the expense ofpossible mistakes and failures. He must be a"doer" as well as a "thinker".
It is acknowledged that many of the qualitiessought cannot be measured with any scientific orreasonable validity and reliability. Much willdepend upon the selector's skill in identifyingpotential leaders.
A strong educational background shall playa secondary role to strong leadership and successful management potential ••••••• 26
It should be noted from the above philosophy that indivi-
duality, motivation, creativity, independence, and innova-
tiveness were perceived to be important characteristics of
the potential leader.
Most of the policy, procedures, and activities for
the conduct of EMTP were explained to the researcher by a
senior Personnel Specialist in the Personnel Certification
and Development Section, Department of Personnel, Hawaii
State Department of Education. 27 This specialist had been
significantly involved in the day-to-day and long-range
operation of the EMTP Program for over six years. His
explanation of rules and procedures were taken as depart-
mental policy since the written policies and procedures
were non-existent (although they are expected to be forth-
coming at a future date). It should be noted that a more
definitive description or treatment of the program is being
described herewith as the researcher had spent two summers
as an observer and/or assistant to the aforementioned
11
Department of Education Personnel Specialist, Personnel
Certification and Development Section.
Like the LTP and AlP, application to the EMTP has
been open to all persons who possess a State of Hawaii
Professional Teaching Certificate and the requisite number
of years of teaching experience. However, the teaching
experience requirement was raised from three to five years.
Individual educational experience and background
data were collected from each candidate and were evaluated
by a committee. It should be noted that no academic
training was required prior to entry into the program.
The Education Management Training Program has been
divided into three phases: EMTP, Phase I, Phase II, and III.
Candidates who were successful in meeting the entry require
ments stated above were invited to participate in a volun
tarytwo~eek EMTP, Phase I session. A maximum of 60 mem
bers were invited to participate in each two-week session.
Two sessions were held in the summers of 1976, 1977 and 1978.
The personnel who participated in one of the sessions under
went the following:
1. A battery of personality and role expectation inventories
was administered:
(a) The Managerial Philosophies Scale
(b) The Management of Motives Index
2. The participants were exposed through classwork or
lecture format to the DOE structure, policies and procedures,
12
as well as its problems and issues.
3. They were exposed through classwork or lecture format to
the skills and knowledge of administration, curriculum, in
dustrial relations, and personnel services and procedures.
4. The participants were exposed to group work in-basket
case study exercises. They had to utilize their skills in
human relations, problem resolution, and decision-making.
5. During the case study sessions each member was scheduled
to be observed in different group settings. Observers, all
of whom were Department of Education educational officers,
were in-serviced in observation techniques. During the
two-week period each applicant member underwent observation
by at least six different observers.
6. Homework assignments were given and graded; quizzes and
examinations on sub-sections of the materials presented
were administered; and, a mid-term and final examination
were held.
7. During the evenings of the two-week session, individual
members were interviewed by a committee of three or more
State Department of Education educational officers. Each
participant was rated on the manner with which he or she
responded to the questions of the interview committee. The
committee members would judge the participant being inter
viewed as to his or her display of knowledge, attitude,
type of response to questions, self-control during the
interview, and leadership potential.
13
8. During the entire two-week session, the participants
made peer evaluations of other members. The evaluations
purportedly reflected on the leadership qualities of each
member.
After the close of each session the scores and
ratings listed below on all the members were compared:
1. Homework grades
2. Grades from quizzes
3. Mid-term examination grade
4. Final examination grade
5. Observation ratings
6. Interview ratings
7. Peer observation ratings
It should be noted that the measures on the battery
of tests in leadership traits and personality factors, (see
page 11) though considered, did not form a part of the
selection criteria. The scores on the seven tests and
ratings were categorized into four sections:
1. Academic Coursework
2. Interview Rating
3. Observation Rating
4. Peer Observation Rating
Members who scored highest on all four scores and ratings
were selected into EMTP, Phase II, a one-semester on-the
job training as an educational administrator.
During the year 1976, 18 members were selected into
14
the second phase, 17 in 1977 and 13 in 1978. The Phase II
members were expected to undergo a mandatory inservice
program held at various times of the week. Upon comple
tion of EMTP, Phase II, members awaited for a probation
district superintendent, district superintendent, and state
assistant superintendent. Most from this group came from
the various major islands of Hawaii, Oahu, Maui, and Kauai
and were considered to be a typical cross-section of the
educational officers of the Hawaii State Department of
Education. Members from this group possessed academic de
grees which ranged from a Bachelor's degree to a doctorate.
Most, if not all, of this group have had experience in the
classroom, or like the selectees or non-selectees, have held
positions as counselors, resource members, or as educational
specialists. All have had more than five years in the
Department of Education, and additionally, each possessed the
Hawaii State Department of Education Administrator's Certifi
cate. The majority of observer/raters observed several times.
Demographic Data
In addition to data described above which were
gathered for this study, three pieces of demographic infor
mation were collected for all the individuals in the sample;
they were:
1. Age
2. Sex
3. Number of years service in the Department of
Education.
60
Educational Management Training ProgramPhase I, Selection Criteria
Candidates who volunteered for the two-week EMTP,
Phase I Program underwent numerous classwork and evaluation
sessions. They were graded on homework, quizzes, a mid-
term examination, a final examination, were observed and
rated by educational officers, and were given daily peer
evaluation on their conduct and performance by other
members. From these sessions, scores were collated and
categorized into four categories:
1. Academic Coursework: This included all the homework
assignments, quizzes, and examinations. Grades on the assign-
ments and scores on quizzes and examinations were totalled
and a composite score was given to each participant.
2. Interview Rating: Each candidate was required to meet with
a group of educational administrators for a formal interview.
During the interview session the candidate responded to
questions such as: (1) why he/she wished to become an educa-
tional officer, (2) how he/she would handle specific educa-
tional concerns or problems, and (3) how he/she expected to
contribute to the educational system. Each candidate was
rated by each rater as he/she was being interviewed. The
individual ratings were discussed by the group after the
candidate had completed the interview and a composite score
was assigned to the person. The interviews were scheduled
61
for a one-half hour block of time, and all interviews were
held during the early evening hours during the two-week
EMTP, Phase I Program.
3. Observation Rating: A rating was given to each partici
pant as he or she participated in the two-week session.
The procedures for rating were discussed with the observer/
raters, each of whom was a practicing educational adminis
trator, in an attempt to obtain consistency among the raters.
The observer/raters then observed each candidate during the
various activities in which he or she participated in during
the two-week session. Each participant was observed on
several process variables such as how he/she fielded or
handled questions and concerns during the problem-solving
activities or sessions, how he/she made reports to large or
small groups, and how he/she led or participated in group
sessions. Ratings were made on personal variables, inclu
ding the behavior the participant exhibited, how he/she
thought through the situations, and how he/she handled
himself/herself throughout the activites. Generally, each
participant was observed for an entire day by several
different observer/raters. The ratings for each participant
were collected and collated; an average score was computed
and given to each participant.
4. Peer Observation Rating: A rating was made on each
candidate by others in his/her group as he or she participa
ted in the two-week session. The procedures for rating one
62
another were discussed with the participants prior to the
rating periods or at the beginning of the EMTP, Phase I
Program. Each candidate observed and was observed by the
people in his/her group during the various activities of
the program. Peers were observed as to how they fielded
or handled questions and concerns during the problem-solving
activities or sessions, how . t~ey made reports to small or
large groups, and how they' led or participated in group
sessions. Like the observer/raters, the ratings given to
each peer were given for the behavior the participant
exhibited, how he thought through the situations, and how
he handled himself throughout the activities. Each partici
pant, by the end of the two-week period, was observed or
given a peer rating by most of the candidates. The ratings
were collected, collated, and an average peer evaluation
rating was given to each participant.
At the conclusion of the EMTP, Phase I, the raw
scores which the candidates received in each of the four
areas, i.e., academic coursework, interview, observation, and
peer evaluation, were transformed into a quintile scale (from
I to 5) and the scores were summed. The candidates whose
composite score was in the top quintile were eligible to be
selected into the EMTP, Phase II Program. Members in this
quintile were normally made a part of the educational leader
ship group.
63
Personality and Role Expectation Measures
A number of personality and role expectation
measures were used either as part of the Educational Manage
ment Training Program or specifically for this study. Two,
the Managerial Philosophies Scale and the Management of
Motive Index, were administered at the beginning of each
session of the EMTP, Phase I Program. The Fundamental Inter
personal Relations Orientation-Behavior (FIRO-B) measure was
administered by the researcher to the members who participa
ted in the EMTP, Phase I Program and to the observer/raters
of this study. The completion of the FIRO-B inventory it
self was carried out in the privacy of the home or office of
each EMTP participant and observer/rater of this study. The
FIRO-B provided ten sub-scales on personality traits while
the other two inventories added seven personality and role
expectation measures.
While the Managerial Philosophies Scale and the
Management of Motive Index instruments were administered as
a part of the EMTP, Phase I Program, its use as an evalua
tive or selection tool by the Department of Education has
not been fully explored. The researcher included these two
inventories in the study, as the Management of Motive Index
revealed measures on the personality make-up of the members
and the Managerial Philosophies Scale provided measures
which indicated the philosophic leanings of the members,
especially whether there were indicators of their being in
64
the nomothetic dimension. The FIRO-B, an instrument intro
duced by the researcher, was used as a method to determine
the interpersonal traits of the candidates. The use of the
three instruments was expected to reveal potential differ
ences in personality and role expectation dimensions among
the three groups in the study.
Design of the Study
The study employed a co-relational design. Each
subject in the groups titled selected and non-selected
completed the three inventories, i.e., Managerial Philoso
phies Scale, Management of Motive Index, and the FIRO-B,
as did the sample of observer/raters. Demographic data were
either provided by the subjects or the Office of Personnel
Services, Department of Education. For all the selectees
and non-selectees, the Department of Education provided the
composite scores on each of the EMTP, Phase I Criterion; they
include the academic, interview, observation, and peer eva
luation scores.
The three independent variables examined were selec
tee, non-selectee, and observer/raters. To test various
aspects of leadership potential among the groups, a total of
twenty-four dependent variables were used. They are listed
in Table 1. The first three are demographic data, the next
four are scores on performance in EMTP, Phase I, and the
final seventeen constitute sub-scales of the management in
ventory instruments used in the study.
Table 1
Dependent Variables Used in the Study
1. Age
2. Sex
3. Number of years the member has served in the HawaiiState Department of Education
4. EMTP, Phase I Academic Coursework
5. EMTP, Phase I Interview
6. EMTP, Phase I Observation/Rating
7. EMTP, Phase I Peer Evaluation
Managerial Philosophies Scale:
8. Theory X Philosophy
9. Theory Y Philosophy
Management of Motive Index:
10. Basic Creature Comfort
11. Safety and Order
12. Belonging and Affiliation
13. Ego Status
14. Actualization and Self-Expression
FIRO-B:
15. The desire one has for contact with others,regardless who initiates it (SUMI).
65
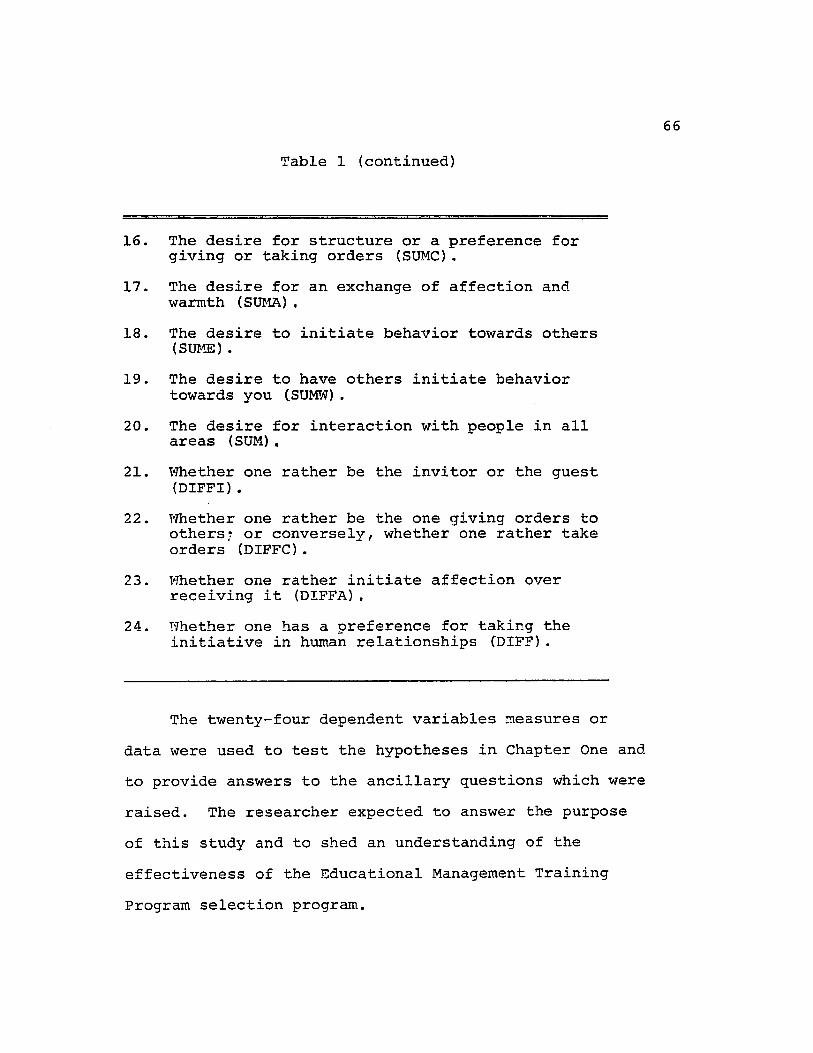
Table 1 (continued)
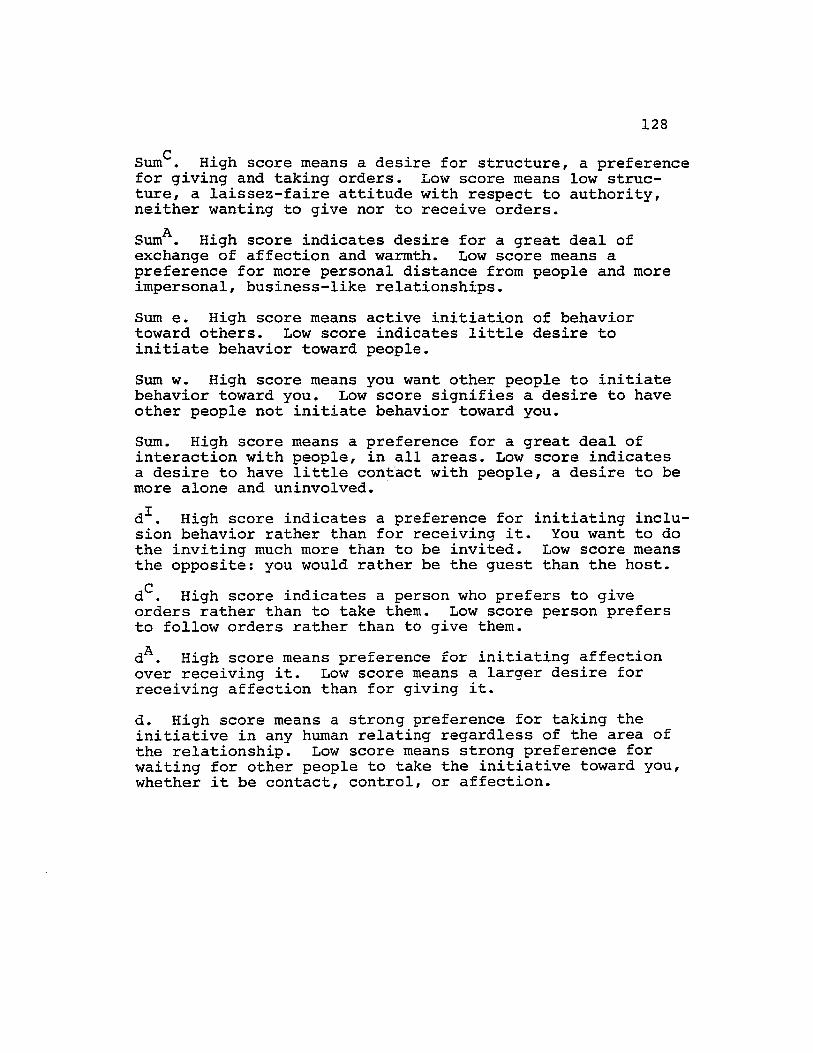
16. The desire for structure or a preference forgiving or taking orders (SUMC).
17. The desire for an exchange of affection andwazmtih (Sllr-iA).
18. The desire to initiate behavior towards others(SUI-1E) •
19. The desire to have others initiate behaviortowards you (SUWN).
20. The desire for interaction with people in allareas (SUM).
21. ~fuether one rather be the invitor or the guest(DIFFI) •
22. Whether one rather be the one giving orders toothers; or conversely, whether one rather takeorders (DIFFC).
23. ~fuether one rather initiate affection overreceiving it (DIFFA).
24. Nhether one has a preference for taking theinitiative in human relationships (DIFF).
The twenty-four dependent variables measures or
data were used to test the hypotheses in Chapter One and
to provide answers to the ancillary questions which were
raised. The researcher expected to answer the purpose
of this study and to shed an understanding of the
effectiveness of the Educational Management Training
Program selection program.
66
67
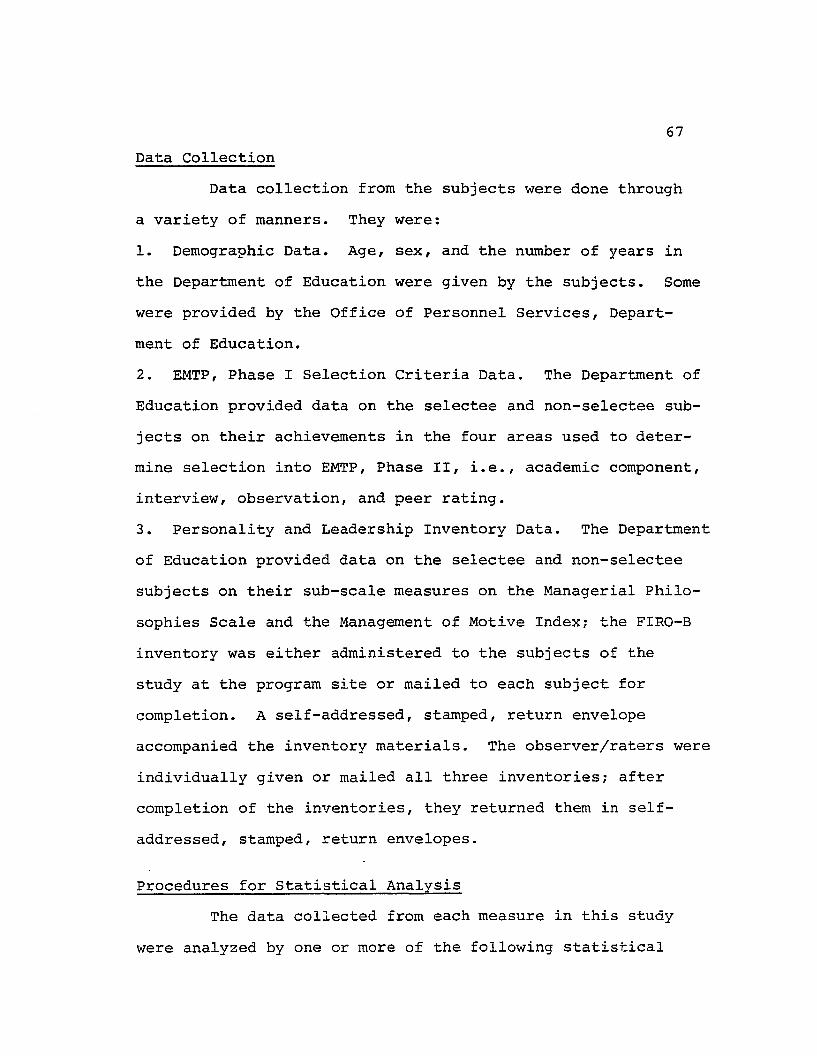
Data Collection
Data collection from the subjects were done through
a variety of manners. They were:
1. Demographic Data. Age, sex, and the number of years in
the Department of Education were given by the subjects. Some
were provided by the Office of Personnel Services, Depart
ment of Education.
2. EMTP, Phase I Selection Criteria Data. The Department of
Education provided data on the selectee and non-selectee sub
jects on their achievements in the four areas used to deter
mine selection into EMTP, Phase II, i.e., academic component,
interview, observation, and peer rating.
3. Personality and Leadership Inventory Data. The Department
of Education provided data on the selectee and non-selectee
subjects on their sub-scale measures on the Managerial Philo
sophies Scale and the Management of Motive Indexi the FIRO-B
inventory was either administered to the subjects of the
study at the program site or mailed to each subject for
completion. A self-addressed, stamped, return envelope
accompanied the inventory materials. The observer/raters were
individually given or mailed all three inventoriesi after
completion of the inventories, they returned them in self
addressed, stamped, return envelopes.
Procedures for Statistical Analysis
The data collected from each measure in this study
were analyzed by one or more of the following statistical
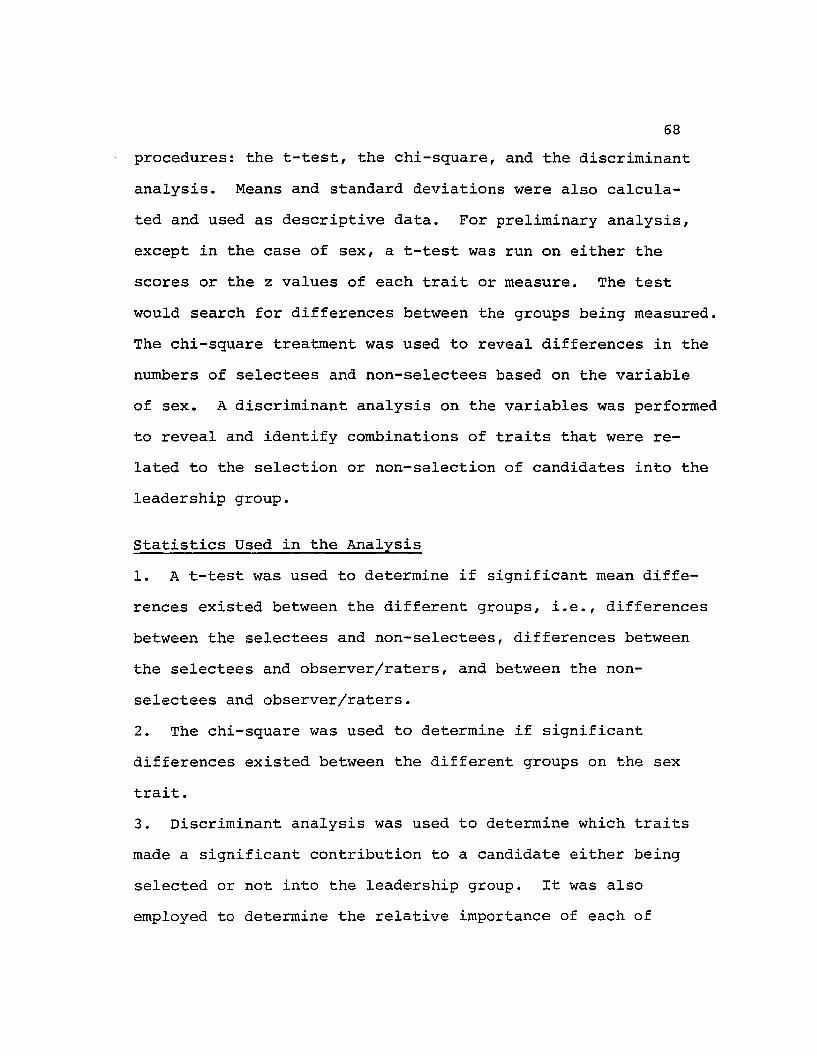
68
procedures: the t-test, the chi-square, and the discriminant
analysis. Means and standard deviations were also calcula
ted and used as descriptive data. For preliminary analysis,
except in the case of sex, a t-test was run on either the
scores or the z values of each trait or measure. The test
would search for differences between the groups being measured.
The chi-square treatment was used to reveal differences in the
numbers of selectees and non-selectees based on the variable
of sex. A discriminant analysis on the variables was performed
to reveal and identify combinations of traits that were re
lated to the selection or non-selection of candidates into the
leadership group.
Statistics Used in the Analysis
1. A t-test was used to determine if significant mean diffe
rences existed between the different groups, i.e., differences
between the selectees and non-selectees, differences between
the selectees and observer/raters, and between the non
selectees and observer/raters.
2. The chi-square was used to determine if significant
differences existed between the different groups on the sex
trait.
3. Discriminant analysis was used to determine which traits
made a significant contribution to a candidate either being
selected or not into the leadership group. It was also
employed to determine the relative importance of each of
69
these traits. The Discriminant analysis was expected to
factor out those traits that contributed significantly to
the selection processes.
Statistical Procedures for the Hypotheses Testing
Statistical procedures for the hypotheses testing
rested primarily on the following procedures:
1. t-testing: Computational procedures for this test were:
S2 (Nl l)sl2 + (N2 1)s2
2= - -Nl + N2 - 2
where Ni = sample size of sample i
S~ = variance of sample i1
t = (Xl - " ) - £'(Ul - U2).t~2
est diff
where xi = mean sample or group i
expected differencebetween the two means(according to the nullhypotheses)
ZJUl - U2 ) = 0)
70
2. Chi-square: the procedures for chi-square were:
(c. r . )~ ~
N
where f o = obtained frequency
f e = expected frequency
c = sum of column i
r = sum of row i
3. Discriminant Analysis: Computational analysis using this
statistical procedure was:
(a) Discriminant Function:
where D.a,
d's
Z's
= the score on the discriminantfunction i
= the weighing coefficients
= the standardized values of pdiscriminating variables thatare used in the analysis
(b) Classification Procedures: Using the resultingvalues from the procedures above, a Discalculated for each group in the analysis. Toclassify a candidate, the foilowing procedureswere used:
71
or
where D. = the resultant score from thea discriminant function for acandidate
Dl = D mean value for one group
D2 = D mean value for the other group
calculations performed depended upon the valueof D.a,
In dealing with the significance level of the
computations, the probability level of p = .05 was estab-
lished as an acceptable evidence of significant difference
between the groups in this study.
Hypotheses Testing
For the individual hypothesis testing, the following
was done:
1. For Hypothesis One: Hypothesis I, which has two sub
hypotheses, dealt with the following: whether a significant
difference at the .05 level existed between the selectees and
non-selectees on the (1) demographic and (2) EMTP, Phase I
Selection Criteria measures. A series of t-test on the means
of the demographic and EMTP, Phase I selection criteria were
made for the purpose of preliminary analysis of any diffe-
rences between the groups. A chi-square analysis was done on
the sex measures to reveal if any significant differences
occurred.
72
2. For Hypothesis Two: Hypothesis II dealt with the follow-
ing: whether a significant difference at the .05 level
existed between the selectees and the non-selectees on the
scores of inventories used to measure personality and role
expectations. T-test on the scores of the sub-scales of
the MPS and MMI were performed.
3. For Hypothesis Three: Hypothesis III dealt with the follow
ing: whether a significant difference at the .05 level existed
between the selectees and the group of twenty-four non
selectees on the sub-scales of FIRO-B. A series of t-tests on
the means of the sub-scale measures were done.
4. For Hypothesis Four: Hypothesis IV, which has two sub
hypothesis, dealt with the following: whether a significant
difference at the .05 level existed between the selectees and
observer/raters on the (1) demographic measures and (2) the
sub-scales of the Managerial Philosophies Scale (MPS) and
Management of Motive Index (MMI). A t-test on the means of
the dE\mographic and MPS and MMI sub-scale measures was made
for the purpose of revealing any differences between the
groups. A chi-square analysis was performed on the sex
measures to reveal if any significant differences occurred.
5. For Hypothesis Five: Hypothesis V, which has two sub
hypotheses, dealt with the following: whether there was a
significant difference at the .05 level between the non
selectees and observer/~aters on the (1) demographic
measures and (2) sub-scales of the Managerial Philosophies
73
(MPS) and Management of Motive Index (MMI). T-tests on the
means of the demographic and MPS and MMI sub-scale measures
were made for the purpose of revealing any differences be
tween the groups. A chi-square analysis was done on the sex
measures to reveal any significant differences.
6. For Hypothesis Six: Hypothesis VI dealt with the follow
ing: whether a significant difference at the .05 level
existed between the selectees and the observer/raters on the
sub-scales of FIRO-B. A series of t-tests on the means of
each FIRO-B sub-scale measures.were made for the purpose of
finding any differences between the groups. For this hypo
thesis, the need to examine whether any demographic diffe
rences existed between the group was precluded by data
already found in Hypothesis Four.
7. For Hypothesis Seven: Hypothesis VII, which has two sub
hypotheses, dealt with the following: whether a significant
difference at the .05 level existed between the group of
twenty-four non-selectees and the observer/raters on the
(1) demographic and (2) FIRO-B sub-scale measures. T-test
on the means of the demographic and FIRO-B sub-scale measures
were made for the purpose of revealing any differences be
tween the groups. A chi-square analysis was done on the sex
measures to reveal if any significant differences occurred.
Ancillary Questions
To seek answers to the ancillary question number 1,
74
whether there were one or more criteria in the EMTP,
Phase I selection criteria which might not effectively
predict those who should or should not be selectees, a
discriminant analysis was performed. The purpose was to
factor out those traits that did contribute to the selection
and non-selection process. Those that did not factor out
were analyzed in the light of this question.
Ancillary question number 2 sought to find how well
EMTP, Phase I scores properly classified the candidates as
selectees or non-selectees. To find an answer, an analysis
of the classification results from the discriminant analysis
procedures was done.
For ancillary question number 3, whether the know
ledge of scores on selected inventories of personality and
role expectation would materially increase the accuracy of
the classification of candidates as selectees or non
selectees, a discriminant analysis was performed. This was
done to factor out sub-scale traits which might be used to
contribute to the selection or non-selection process. Addi
tionally, an analysis of the classification results from the
discriminant analysis was performed. The purpose was to
reveal how well selected scores from the discriminant analy
sis might help in the classification process.
75
Summary
Following the description of the study population
and sample, the Hawaii State Department of Education EMTP,
Phase I evaluation measures were described. The evaluation
There was a difference beyond the p=.05 in each of the four
criteria. The non-selectees had a lower mean score on each.
Relative to the first sub-section of Hypothesis
One, the data presented a mixed model. While one of the
demographic variables (sex) allowed for a failure to reject,
81
two led to a rejection of the null hypothesis. The tests
for all four of the EMTP, Phase I criteria led to a finding
which allowed the researcher to reject the null hypothesis.
Findings Related to Hypothesis Two
Hypothesis Two was designed to determine if there
were significant differences between the EMTP, Phase I
selectees and non-selectees on the personality and leader
ship traits. Stating the hypothesis in the null form:
There is no significant difference betweenthe mean scores on the sub-scales of theManagerial Philosophies Scale and theManagement Motive Index for those selectedinto the leadership ranks (EMTP, Phase II)and those not selected into the leadership'ranks.
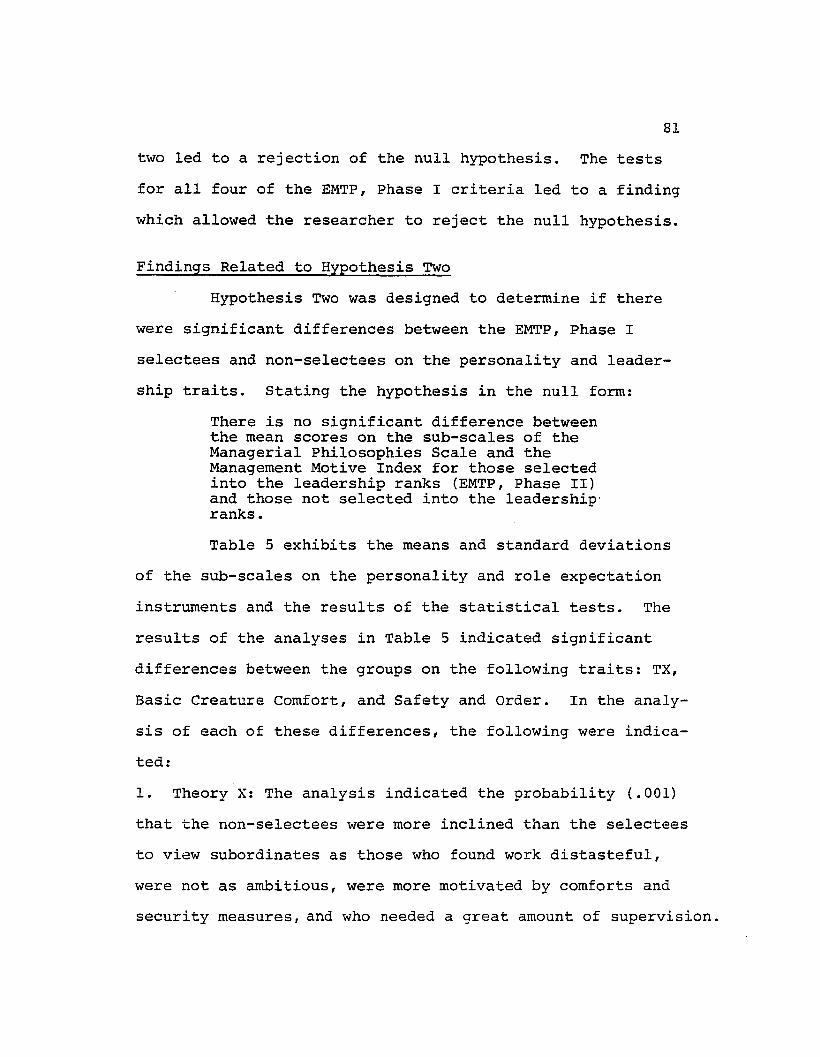
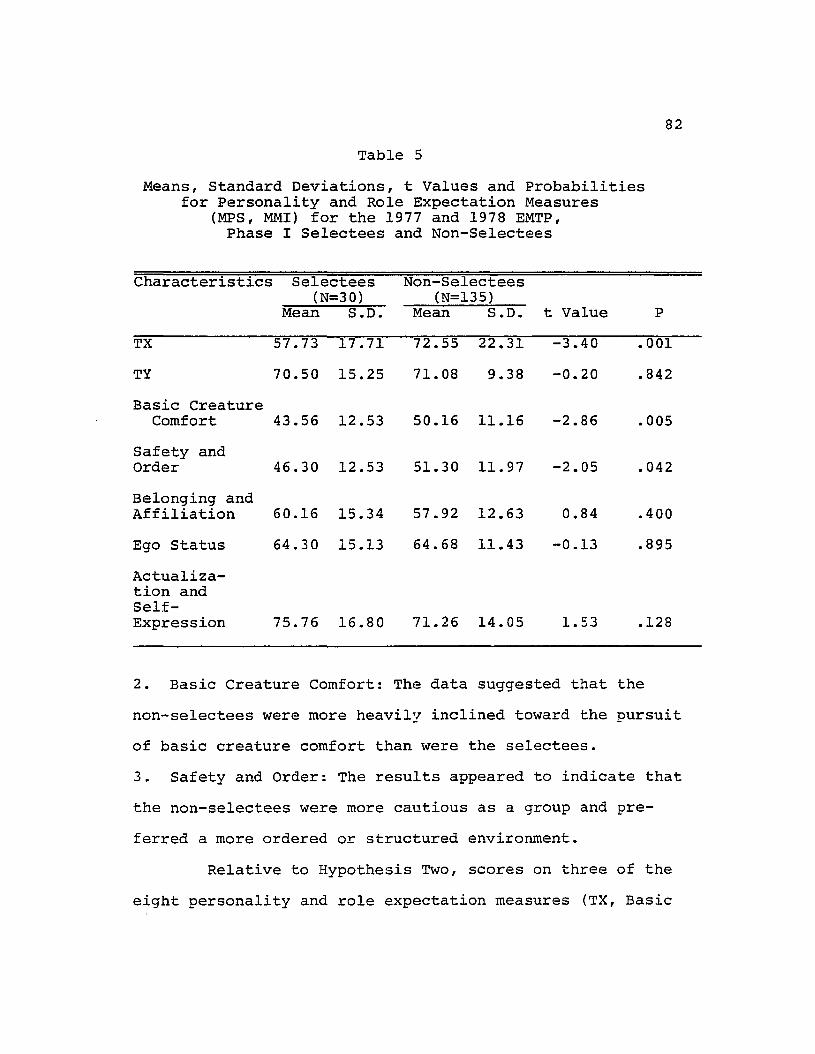
Table 5 exhibits the means and standard deviations
of the sub-scales on the personality and role expectation
instruments and the results of the statistical tests. The
results of the analyses in Table 5 indicated significant
differences between the groups on the following traits: TX,
Basic Creature Comfort, and Safety and Order. In the analy-
sis of each of these differences, the following were indica-
ted:
1. Theory X: The analysis indicated the probability (.001)
that the non-selectees were more inclined than the selectees
to view subordinates as those who found work distasteful,
were not as ambitious, were more motivated by comforts and
security measures, and who needed a great amount of supervision.
82
Table 5
Means, Standard Deviations, t Values and Probabilitiesfor Personality and Role Expectation Measures
(MPS, MMI) for the 1977 and 1978 EMTP,Phase I Selectees and Non-Selectees
that the non-selectee group wanted many kinds of contacts
or interactions with others, but were not as discriminating
85
with whom they made interactions. The differences also
appeared to indicate that when the selectees wanted contacts,
they took the initiative to reach out for the contacts. The
non-selectee group, on the other hand, had a tendency to
wait for others to make the initial contact with them.
The statistical analysis produced a significant
difference between selectees and non-selectees on two of the
sub-scales of the FIRO-B, but not on the other eight. Thus,
with the exception of the two sub-scales noted above, there
is evidence to fail to reject the null hypothesis of signi-
ficant difference between the two groups on the results of
the FIRO-B.
Findings Related to Hypothesis Four
Hypothesis Four was designed to test whether there
were significant differences between the EMTP, Phase I
selectees and the observer/raters on the demographic
measures and the scores on the sub-scales of the Managerial
Philosophies Scale and the Management of Motive Index.
Stating the hypothesis in null form:
There is no significant difference betweenthe demographic variables and the meanscores on the sub-scales of the ManagerialPhilosophies Scale and the Management MotiveIndex for those selected into the leadershipranks (EMTP, Phase II) and the educationalofficers who participated in the EMTP, PhaseI as observer/raters.
Hypothesis Four was divided into two sub-sections, the first
86
included the findings relative to the demographic data and
the second the various sub-sections of the Managerial
Philosophies Scale and Management of Motive Index. On
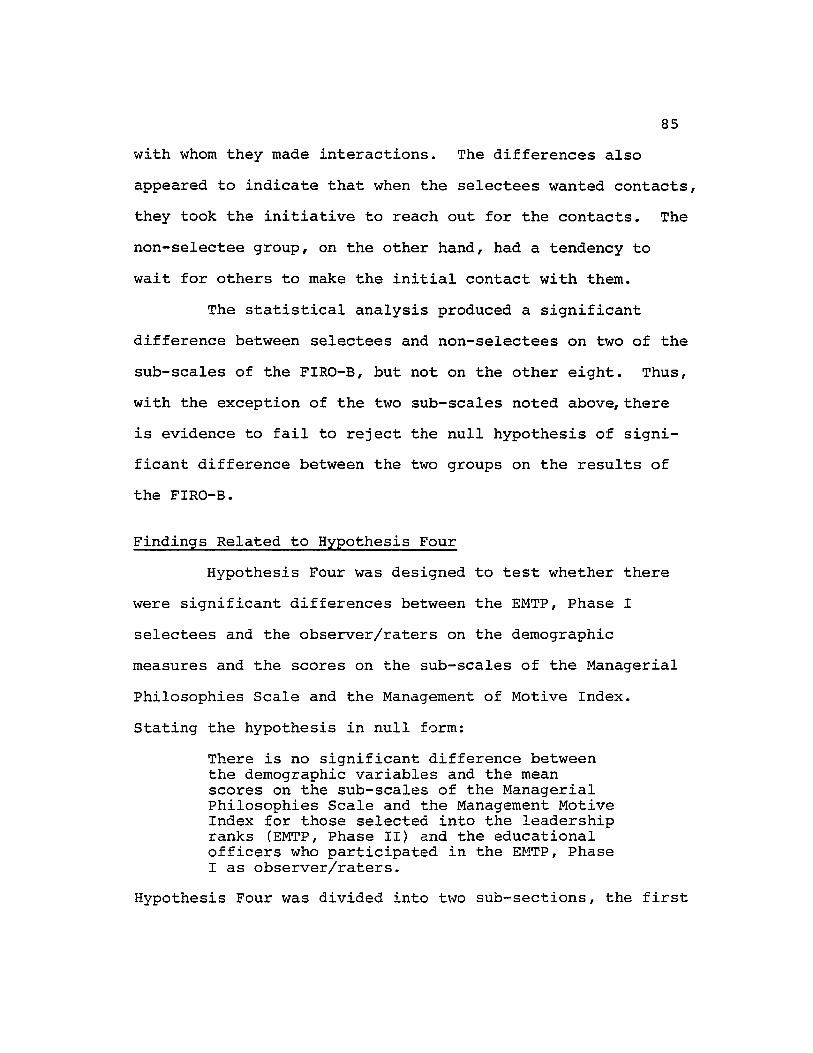
Table 7 is the data on demographic characteristics and the
results of the statistical tests.
Table 7
Means, Standard Deviations, t Values, Probabilities,and a Chi-square Value for the Demographic
Characteristic Measures for the 1977and 1978 EMTP, Phase I Selectees
and the Observer/Raters
Characteristics Selectees(N=30)
Mean S.D.
Observer/Rater(N=44)
Mean S.D. t Value P
Age 35.73
No. Years DOE 11.01
Sex
3.94
3.74
47.29
19.75
3.90
6.19
-12.44
- 7.55
.000
.000
Males
Females
12
18
28
16x2 = 3.99*
*Chi-square for sex = 3.99 with 1 degree for freedomis significant at the .05 level
There were significant differences between the
groups on each of the demographic variables. The observer/
raters were older and with more years of experience in the
Department of Education. A significant difference in the
distribution of males and females existed between the 1977
and 1978 selectees and the observer/raters.
87
The distribution was almost inversely proportionate between
the 1977 and 1978 selectees and the observer/raters. The
distribution was almost inversely proportionate between the
two groups. While the observer/raters had 63.6 per cent
males and 36.4per cent females, the selectees had 60 per cent
females and 40per cent males. It appeared that although
there were more males in the observer/raters group, more
females were chosen for the selectee group.
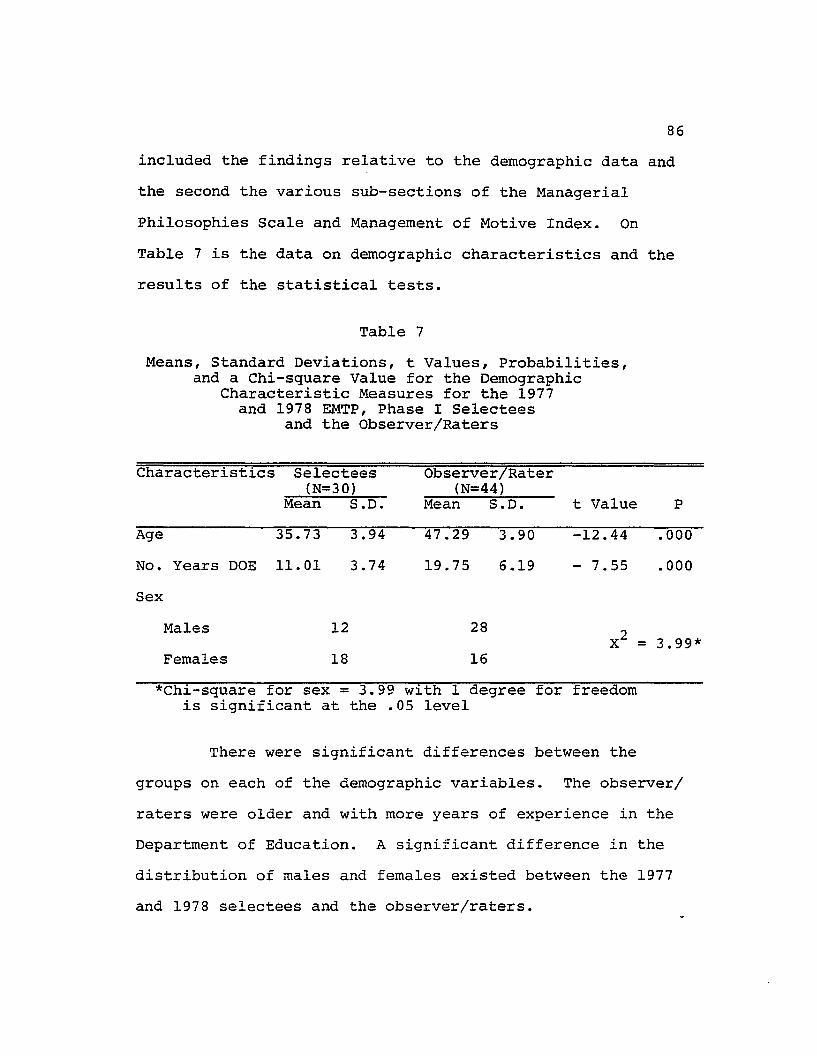
The second part of Hypothesis Four searched for
significant differences on the sub-scales of the Managerial
Philosophies Scale and the Management of Motive Index.
Table 8 exhibits the data on these personality and leader
ship inventories.
The results of the analysis of the table show
significant differences on two of the seven sub-scales:
Basic Creature Comfort and Safety and Order. In the
analysis of each of these differences, the following inter
pretations are warranted:
1. Basic Creature Comfort: The analysis indicated the
observer/raters were more heavily inclined toward the
pursuit of basic creature comfort than the selectees.
2. Safety and Order: The results appeared to indicate that
the observer/raters were more cautious as a group and pre
ferred a more ordered or structured environment.
Relative to the first sub-section of Hypothesis
88
Four, all of the demographic data allowed for a rejection
of the null hypothesis. For the second part of the Hypo-
thesis Four, two (Basic Creature Comfort and Safety and
Order) of the seven personality and role expectation
measures supported a rejection of the null hypothesis,
while five of the seven measures allowed for a failure to
reject.
Table 8
Means, Standard Deviations, t Values, Probabilitiesfor Personality and Role Expectation Measures
for the 1977 and 1978 EMTP, Phase ISelection and the Observer/Raters
Hypothesis Five was designed to test whether there
were significant differences between the EMTP, Phase I non-
selectees and the observer/raters on the demographic
measures and the scores on the sub-scales of the Managerial
Philosophies Scale and the Management of Motive Index.
The hypothesis stated in null form is as follows:
There is no significant difference betweenthe demographic variables and the meanscores on the sub-scales of the ManagerialPhilosophies Scale and the Management MotiveIndex of leadership and personality traitsfor those not selected into the leadershipranks (EMTP, Phase II) and the educationalofficers who participated as observer/raters.
Hypothesis Five was divided into two sub-sections. The
first included the findings relative to the demographic data
and the second dealt with the various sub-sections of the
Managerial Philosophies Scale and the Management of Motive
Index. The data on demographic characteristics and the
results of the statistical tests are presented in Table 9.
There were significant differences between the
groups on two of the demographic variables (age and years
of service) with the observer/raters being older and with
more years of experience in the Department of Education.
However, there was no significant difference in sex.
The second aspect of Hypothesis Five searched for
significant differences on the sub-scales of the Managerial
90
Philosophies Scale and the Management of Motive Index.
Table 10 exhibits the data on these personality and role
expectation inventories.
Table 9
Means, Standard Deviations, t Values, Probabilities,and Chi-square Value for the DemographicCharacteristic Measures for the 1977and 1978 EMTP, Phase I Non-Selectees
and the Observer/Raters
Characteristics Non-Selectees(N=135)
I"1ean S.D.
Observer/Raters(N=44)
Mean S.D. t Value P
Age
Years ofService
Sex
No. of Males
No. ofFemales
37.17
9.08
78
57
7.34
4.17
47.29
19.75
3.90
6.19
28
16
-11.72 .000
-10.66 .000
X2 = .44*
*Chi-square for sex - .44 with 1 degree of freedom isnot significant at the .05 level
Results of the analysis on Table 10 were that signi-
ficant differences on two of the seven sub-scales (TX and
Actualization and Self-Expression) existed. In the analysis
of each of these differences, the following were indicated:
1. Theory X. The analysis revealed that the non-selectees
were more inclined than the observer/raters to view sub-
ordinates as those who found work distasteful, were not as
91
ambitious, were more motivated by comforts and security
measures, and who needed a great amount of supervision.
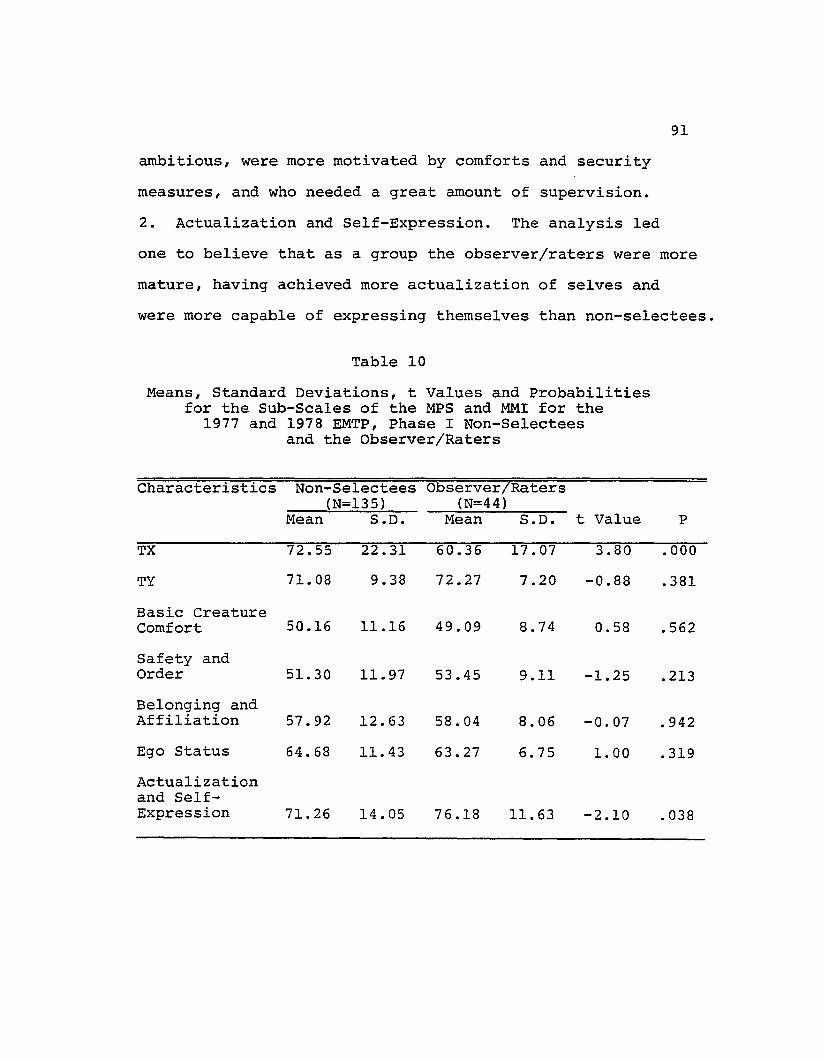
2. Actualization and Self-Expression. The analysis led
one to believe that as a group the observer/raters were more
mature, having achieved more actualization of selves and
were more capable of expressing themselves than non-selectees.
Table 10
Means, Standard Deviations, t Values and Probabilitiesfor the Sub-Scales of the MPS and MMI for the
1977 and 1978 EMTP, Phase I Non-Selecteesand the Observer/Raters
Relative to the first sub-section of Hypothesis Five,
the data presented a mix model. Two of the three demogra
phic data (age and years of service) allowed for a rejection
of the null hypothesis; one (sex) led to a failure to reject
the null hypothesis. For the second part of the Hypothesis
Five, two (TX and Actualization and Self-Expression) of the
seven personality and role dimension measures led to a re-
jection of the null hypothesis while five allowed for a
failure to reject.
Findings Related to Hypothesis Six
Hypothesis Six was designed to determine if there
were significant differences between the EMTP, Phase I
selectees and the observer/raters on the scores on the
sub-scales of FIRO-B. Stating the hypothesis in null form:
There is no significant difference betweenthe mean scores on the sub-scales ofFIRO-B for those selected into the leadership ranks (EMTP, Phase II) and the observer/raters.
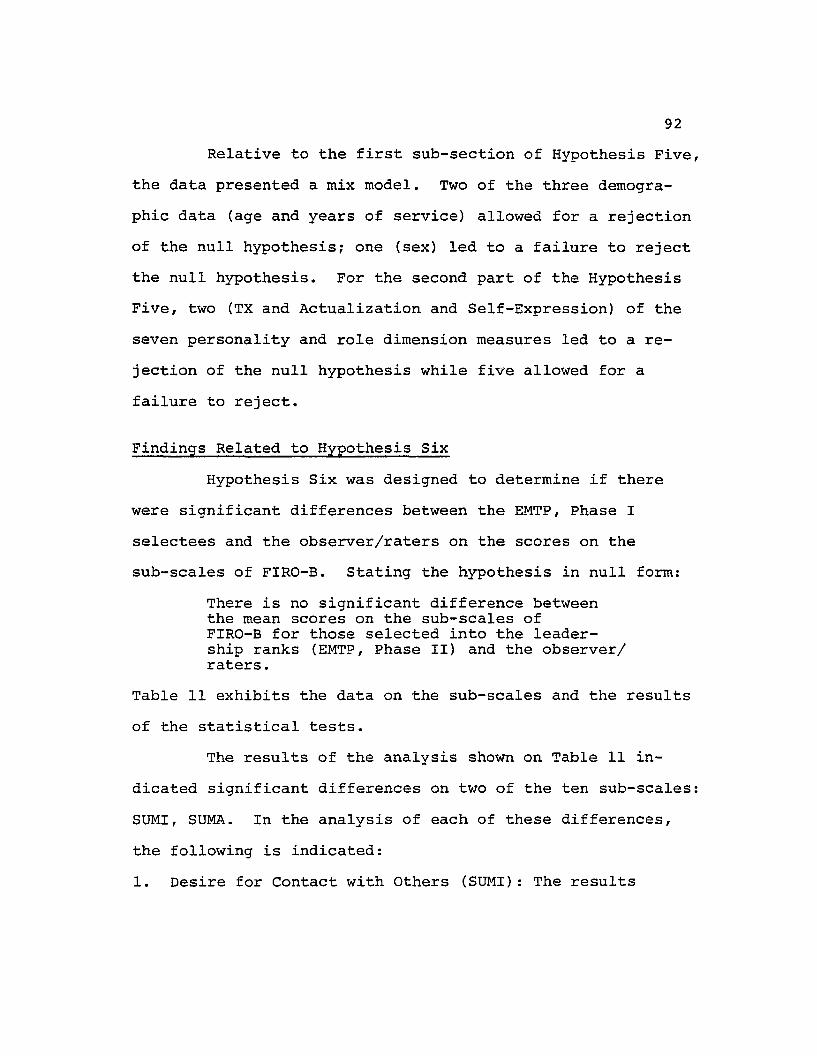
Table 11 exhibits the data on the sub-scales and the results
of the statistical tests.
The results of the analysis shown on Table 11 in-
dicated significant differences on two of the ten sub-scales:
SUMI, SUMA. In the analysis of each of these differences,
the following is indicated:
1. Desire for Contact with Others (SUMI): The results
93
indicated that the selectees were more prone to make
contact or interaction with others than the observer/raters.
It may be reasonable to state that, perhaps, the observer/
raters were less inclined to make interactions, as they
might be more selective with whom they came in contact.
Table 11
Means, Standard Deviations, t Values, and Probabilitiesfor the Sub-Scales of FIRO-B for the 1977 and
1978 EMTP, Phase I Selectees and theObserver/Raters
2. Desire for Interaction with People in All Areas (SUMA):
Like the above, the selectees appeared more willing to make
contacts with others; additionally, they appeared ready to
make many more kinds of interactions with others than the
observer/raters, be it for social, personal, or business
relationships.
Relative to Hypothesis Six, two (SUMI AND SUMA)
measures led to a rejection of the null hypothesis, while
eight of the ten measures allowed for a failure to reject.
Findings Related to Hypothesis Seven
Hypothesis Seven was designed to test whether there
were significant differences between the sample of twenty-
four non-selectees and the observer/raters on the demogra-
phic measures and the FIRO-B sub-scale measures. The
hypothesis stated in tne null form is as follows:
There is no significant difference betweenthe demographic variables and the meanscores on the sub-scales of FIRO-B forsample of non-selectees and the observer/raters.
Hypothesis Seven was divided into two sub-sections: the
first included the findings relative to the demographic
data and the second the various sub-sections of FIRO-B.
While demographic measures were previously exhibited for
the observer/raters, they are included in the following
table to reveal whether any significant differences existed
between them and the sample of twenty-four non-selectees.
95
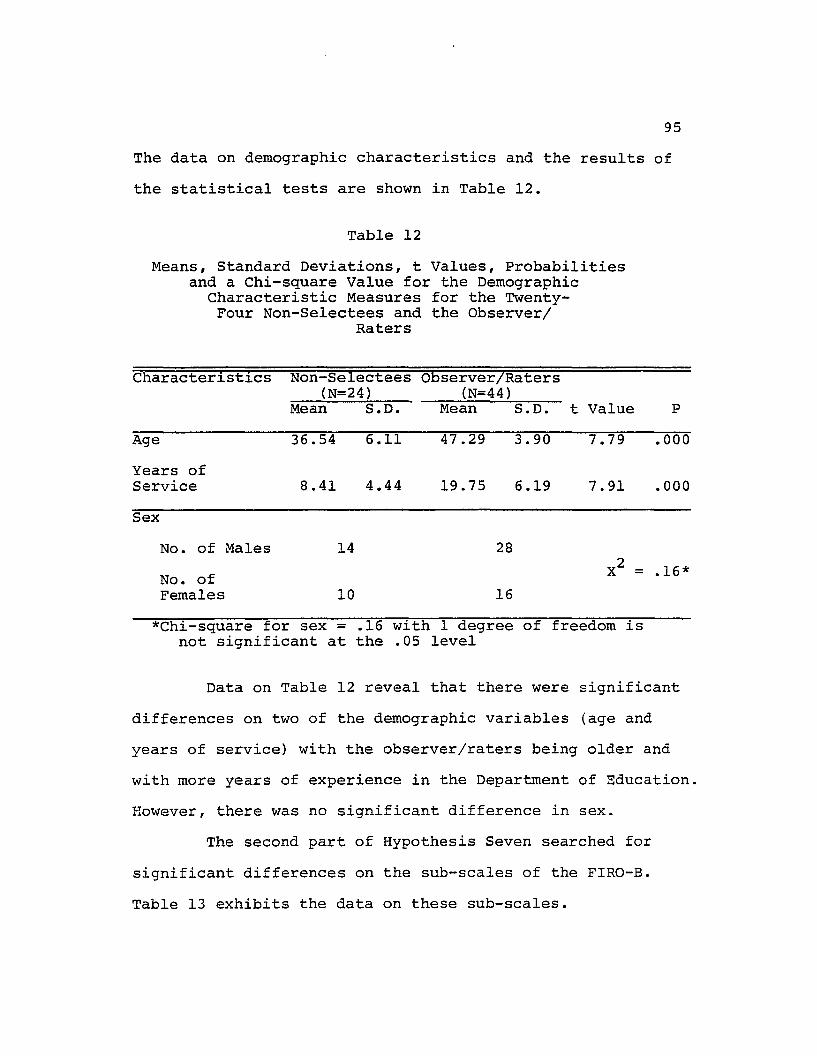
The data on demographic characteristics and the results of
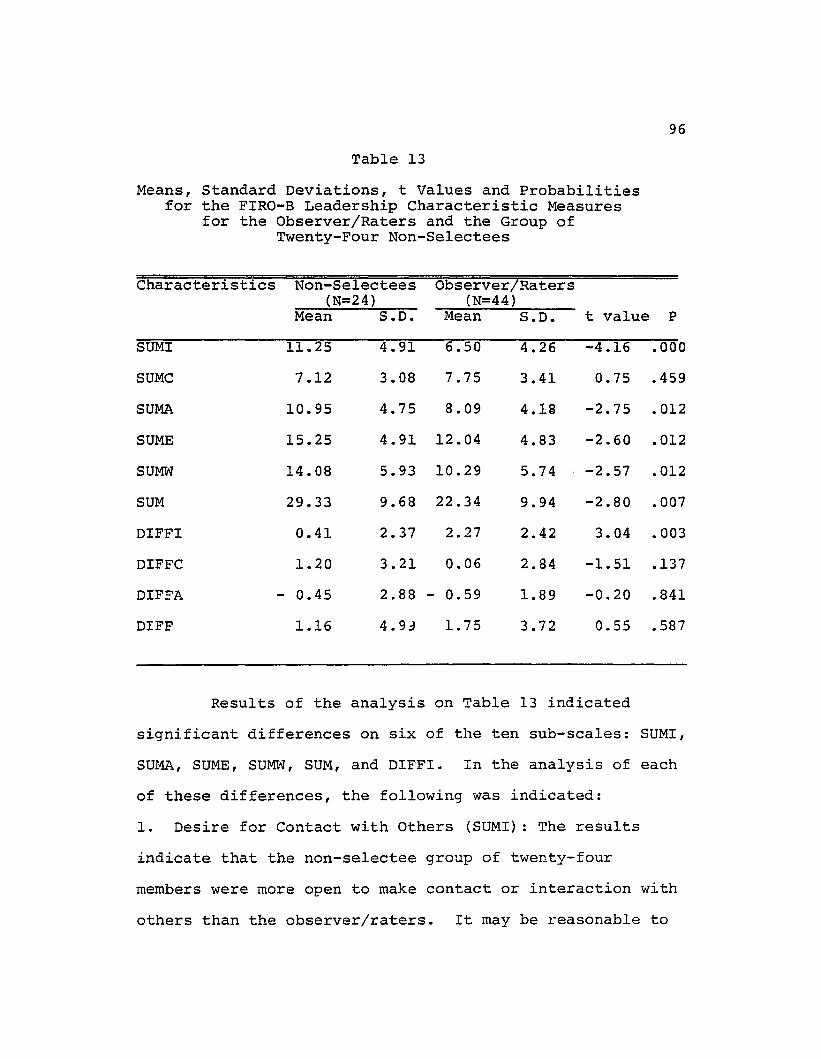
the statistical tests are shown in Table 12.
Table 12
Means, Standard Deviations, t Values, Probabilitiesand a Chi-square Value for the Demographic
Characteristic Measures for the Twenty-Four Non-Selectees and the Observer/
significant differences on six of the ten sub-scales: SUMI,
SUI~, SUME, SU~~, SUM, and DIFFI. In the analysis of each
of these differences, the following was indicated:
1. Desire for Contact with Others (SUMI): The results
indicate that the non-selectee group of twenty-four
members were more open to make contact or interaction with
others than the observer/raters. It may be reasonable to
97
state that perhaps the observer/raters were less prone to
make interactions, as they may be more selective with whom
they carne in contact.
2. Desire for an Exchange of Affection and Warmth (SUMA):
The results appeared to indicate that the non-selectee
group were more prone to be warm and affectionate than the
observer/raters.
3. Desire to Initiate Behavior Towards Others (SUME): The
results indicated that the 24 non-selectees were more likely
to open communication and interaction with others than the
observer/raters.
4. Desire to have Others Initiate Behavior Towards You
(SUMW): As SUME indicated that the non-selectee group were
more prone to initiate behavior towards others, the result
of SUMW indicated that this same group were also receptive
to have others make the move towards or take the step in
making interactions with them. They appeared to be more
receptive to others making interaction towards them than
the observer/raters.
5. Desire for Interaction with People in All Areas (SUM):
Like (1) and (3) above, the non-selectee group appeared
more likely to make contact with others; additionally, they
appeared ready to make many more kinds of interactions with
others than the observer/raters, be it for social, personal,
or business interactions.
98
6. Desire to be the Invitor of Others to Make Interaction
(DIFFI): The results indicated that the observer/raters
were more apt than the members of the non-selectee group to
reach out to others for interactions; this appeared to
indicate that members of the non-selectee group were more
apt to be guests than invitors for interactions.
In general the differences appeared to indicate
that the members of the non-selectee group were more inclined
to interact with people and were more warm and affectionate;
it appeared, too, that the observer/raters were more selec
tive with whom they interacted, as they would rather do the
inviting of others.
Relative to the first sub-section of Hypothesis
Seven, the data presented a mixed model. Two of the three
demographic data allowed for a rejection of the null hypo
thesis; one (sex) led to a failure to reject the null
hypothesis. For the second part of the hypothesis, four of
the ten FIRO-B sub-scale measures allowed for a failure to
reject while six (SUMI, SUMA, SUME, SUMW, SUM, and DIFFI)
led to a rejection of the null hypothesis.
Findings Relative to the Ancillary Questions
The following section of the chapter is devoted
to answering the three ancillary questions. (See Chapter I,
pages 24-25.) Each ancillary question is presented in a
99
separate sub-section.
Findings Related to Ancillary Question One
Ancillary Question One posed the following:
Among the four EMTP, Phase I criteria usedto admit candidates into Phase II, wasthere one or more criteria that did noteffectively predict between the selecteesor non-selectees?
To answer this question, a discriminant analysis
was performed. Analysis of the data revealed three
criteria (Academics, Interview, and Peer Evaluation) which
did significantly contribute to the selection or non-
selection process. The criterion Observation did not
effectively predict between selectees and non-selectees.
Table 14 exhibits the discriminant analysis findings on the
EMTP, Phase I criteria. In the table the variables are
listed in the order of inclusion. The F value for each of
the coefficients exceeded the .05 level of significance.
Findings on Table 14 revealed three selection crite-
ria variables reached the required level of significance.
These variables included the Academic criterion, the Inter-
view criterion, and the Peer Evaluation criterion. The
failure of the Observation criterion to be included indica-
ted that it was not an effective evaluation measure.
100
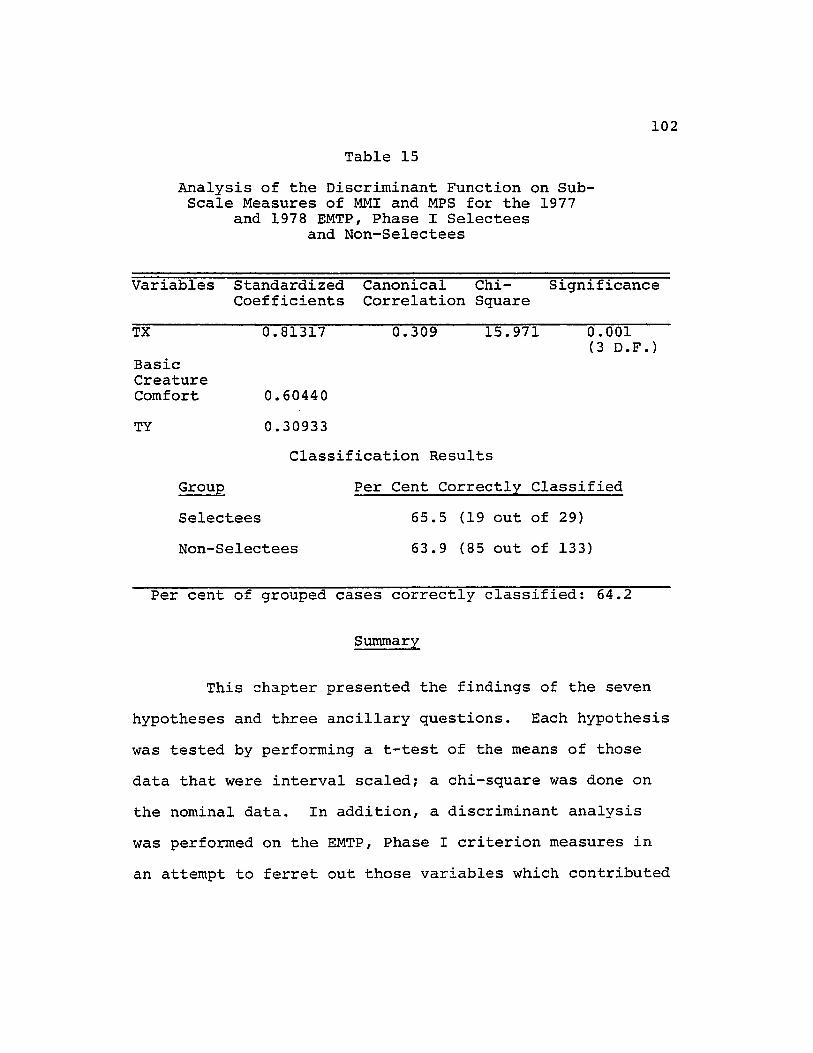
Table 14
Analysis of the Discriminant Function on EMTP,Phase I Criteria Measures for the 1976,
1977 and 1978 EMTP, Phase I Selecteesand Non-Selectees
variables
interview
PeerEvaluation
Academic
StandardizedCoefficients
0.600-98
0.47584
0.40165
CanonicalCorrelation
0.591
ChiSquare
.117.38
Significance
0.000(3 D.F.)
Group
Classification Results
Per Cent Correctly Classified
Selectees
Non-Selectees
84.3 (43 out of 51)
80.0 (180 out of 225)
Per cent of grouped cases correctly classified: 80.8
Findings Related to Ancillary Question Two
Ancillary Question Two is:
How well did the scores of the candidates on the EMTP, Phase I criteriaproperly classify them as selecteesand non-selectees?
Classification results are found in Table 14 above.
Using the Academic, Interview, and Peer Observation
variable measures, it was possible to properly classify the
candidates 80.8 per cent of the time.
101
Findings Related to Ancillary Question Three
Ancillary Question Three posed the following:
will knowledge of scores on selectedinventories of personality and roleexpectation materially increase theaccuracy of classification of candidatesas selectees or non-selectees?
Ancillary Question Three, like Ancillary Question
One, was divided into two sub-sections. The first was to
identify which of the Managerial Philosophies Scales and
Management of Motive Index sub-scale measures might
contribute significantly to the selection process. A
discriminant analysis was used to perform this analysis.
The second was to analyze the effectiveness of the
classification results. Table 15 exhibits the discriminant
analysis on the selected inventory scores of personality
and role expectation. In the table the variables are listed
in the order of inclusion and the F value for each of the
coefficients exceeded the .05 level of significance.
Findings on Table 15 showed three personality and
role dimension sub-scales which reached the required level
of significance and therefore might be used in the EMTP,
Phase I selection process. These measures are TX, TY, and
Basic Creature Comfort. Using these variable measures, it
would be possible to correctly classify 64.2 per cent of
the time.
102
Table 15
Analysis of the Discriminant Function on SubScale Measures of MMI and MPS for the 1977
and 1978 EMTP, Phase I Selecteesand Non-Selectees
Variables StandardizedCoefficients
Canonical ChiCorrelation Square
Significance
TX
BasicCreatureComfort
TY
0.81317
0.60440
0.30933
0.309 15.971 0.001(3 D.F.)
Group
Classification Results
Per Cent Correctly Classified
Selectees
Non-Selectees
65.5 (19 out of 29)
63.9 (85 out of 133)
Per cent of grouped cases correctly classified: 64.2
Summary
This chapter presented the findings of the seven
hypotheses and three ancillary questions. Each hypothesis
was tested by performing a t-test of the means of those
data that were interval scaled; a chi-square was done on
the nominal data. In addition, a discriminant analysis
was performed on the EMTP, Phase I criterion measures in
an attempt to ferret out those variables which contributed
103
significantly to the selection process. An analysis of
the classification function revealed the effectiveness of
the select discriminant function variables. Finally, a
discriminant analysis was performed on the sub-scales of
MPS and MMI to factor out variables which might contribute
to the selection or non-selection of candidates into Phase
II. A classification analysis followed to reveal the
effectiveness of the discriminant function variables.
Findings from the hypotheses testing revealed the
selectees to be significantly different from the non
selectees on all of the EMTP, Phase I criteria. The non
selectees were more Theory X oriented than the selectees
and leaned more heavily toward basic creature comfort: and
safety and order.
When the analysis included the observer/raters,
they were found to be older and with more years of service
than the selectees and non-selectees. On measures relating
to interrelationships, observer/raters were more select
with whom they related. An interesting finding was revealed
when observer/raters were compared to the selectees and the
twenty-four non-selectees on the FIRO-B sub-scale measures.
These selectees differed from the observer/raters on twenty
per cent of the FIRO-B sub-scales; ~hile the group of
twenty-four non-selectees differed from the observer/
raters on sixty per cent of the sub-scale measures.
104
Findings for the ancillary questions revealed the
EMTP, Phase I criterion, Observation, not to be an
effective evaluation measure. Three EMTP, Phase I
variables (Academics, Interview, and Peer Observation)
properly classified the candidates eighty per cent of the
time. The findings further included three personality and
role dimension variables which properly classified the
candidates as selectees or non-selectees sixty-four per
cent of the time.
Of the seven hypotheses posed, none were completely
rejected since in no case did all the sub-scales point to
such a conclusion. Based on the relative numbers of signi
ficant differences, the following appears warranted: in the
portions of Hypotheses One, Four, Five, and Seven that
dealt with demographic data, the non-selectees were signi
ficantly different on two of the measures (age and years of
service) but not on sex. The hypotheses that tested the
scales of the Managerial Philosophies Scale and the Manage
ment of Motive Index (Two, Four, and Five) produced more
failures to reject than to reject. The results of the
hypotheses that involved FIRO-B (Three, Six, and Seven)
would warrant a failure to reject the null on two (Hypothe
ses Three and Six) and the rejection of the null in the
Seventh Hypothesis.
CHAPTER V
SUMMARY, CONCLUSIONS, AND IMPLICATIONS
Introduction
Chapter V includes a summary of the problems that
were investigated, the methodology and statistical analysis
used, and the major findings of this study. Conclusions
were proferred as they related to the major hypotheses and
ancillary research questions. Finally, implications for
the selection process of future educational leaders in
Hawaii were offered.
Summary
The study focused on differences and relationships
among personality, role expectations, selection criteria,
and individual characteristics in a sample of candidates
in the Educational Management and Training Program (EMTP).
A short historical background of the efforts the Department
of Education has used to select and train administrative
officers during the last three decades portrayed a process
which had changed from an unorganized non-system in the
1950's to the relatively well-planned program by the mid
seventies.
The theoretic underpinning of the study was the
Getzels-Guba Social Systems Model, which provides a
106
conceptual view of the super-ordinate-subordinate relation
ships or social processes in administration. The model
advances the construct that the interaction of two classes
of phenomena, i.e., the institutional or nomothetic and
the personal or idiographic dimensions, results in observed
behavior. The nomothetic dimension is comprised of the
descriptors, institution-role-expectation and the idiogra
phic dimension is comprised of the individual-personality
need disposition. The aspects of the model which were
particularly pertinent to the study were needs disposition
and role expectations, since they described potential
interrelationships which became the focus for some of the
hypotheses that were subsequently tested.
Problems That Were Investigated
The three problems that were investigated were:
(1) the accuracy of the EMTP selection criteria as a tool
for classification of candidates; (2) the determination of
whether there were differences between the groups of
selectees, non-selectees, and practicing administrators in
their perceptions of role expectations and need-disposition;
and (3) the determination of whether differences existed
between the groups of selectees, non-selectees, and
practicing administrators on selected demographic traits.
Seven hypotheses and three ancillary questions were
posed in the study. They were:
107
1. Hypothesis One: Whether a significant difference
existed between the selectees and non-selectees on the
demographic variables and the mean scores on measures of
the EMTP, Phase I selection criteria.
2. Hypothesis Two: Whether a significant difference
existed between the selectees and the non-selectees on two
personality and role expectation inventory measures (the
Managerial Philosophies Scale (MPS) and the Management of
Motive Index (MMI).
3. Hypothesis Three: Whether a significant difference
existed between the selectees and the group of twenty-four
non-selectees on the sub-scales of FIRO-B, a third person
ality measure.
4. Hypothesis Four: Whether a significant difference
existed between :the selectees and the observer/raters on
demographic variables and the measures of the personality
and role expectation inventories (MPS, MMI).
5. Hypothesis Five: Whether a significant difference
existed between the non-selectees and observer/raters on
demographic variables and the personality and role expecta
tion inventories (MPS, MMI).
6. Hypothesis Six: Whether a significant difference
existed between the selectees and observer/raters on the
sub-scales of FIRO-B.
7. Hypothesis Seven: Whether a significant difference
108
existed between the group of twenty-four non-selectees
and observer/raters on the sub-scales of FIRO-B.
Three ancillary questions were also posed. They
were:
1. Ancillary Question One: Whether there were one or
more EMTP, Phase I criteria that did not effectively pre
dict between the selectees and non-selectees.
2. Ancillary Question Two: How well did the EMTP, Phase I
scores properly classify the candidates as selectees or
non-selectees?
3. Ancillary Question Three: Whether the knowledge of the
scores on selected inventories of personality and role
expectation materially increased the accuracy of classifi
cation of candidates as selectees or non-selectees.
The Methodology of the Study
To test the hypotheses of the study, a population
to which the findings could be generalized was determined.
A non-random sample was selected. A methodology was
developed and implemented. Finally, appropriate statisti
cal methods were applied to the data to generate the
findings which were reported.
Population and Sample: The population to which the
study generalized were all the candidates who have parti
cipated in the EMTP, Phase I from 1976 through 1982. The
109
sample included the selectees and non-selectees who
participated in the 1976, 1977, and 1978 EMTP, Phase I. A
sample of educational officers who served as observer/
raters in the EMTP, Phase I Program was a subsidiary
population of the study.
The Variables and Data Collection: There were three
independent variables, the groups of selectees, non-selec
tees, and observer/raters. Twenty-four dependent variables
were used to test various aspects of leadership potential
among the groups. These variables are listed in Chapter 3,
pages 65-66.
Data from the sample was collected either from the
files of the Hawaii State Department of Education Personnel
Services Division or by the researcher. Personality and
role expectation measures (MPS, MMI) for the candidates
were provided by the Department of Education Personnel
Services Division and the Department of Educational Adminis
tration of the College of Education, University of Hawaii;
measures from the observer/raters were sent to the re
searcher. Scores on written work and tests, an observation
schedule, an intensive interview, and peer observation were
described in detail in Chapter I. The EMTP, Phase I
criteria scores were provided for by the Department of
Education Personnel Services Division. The data for study
included demographic, personality and role expectation,
110
and EMTP, Phase I selection criteria.
Statistical Methods Used
To test the hypotheses, t-tests were used to
determine whether there were significant differences be
tween the selectees, non-selectees, and observer/raters on
age and number of years in service; a chi-square was used
to test for differences by sex (see Hypotheses One, Four,
Five, and Seven). A t-test was run to find differences
between the groups on the EMTP, Phase I selection criteria
(Hypothesis One). Differences between the groups on per
sonality and role expectation measures (MPS, MMI, and
FIRO-B) were also tested, using the t-tests (Hypotheses Two,
Three, Four, Five, Six, and Seven).
In examining Ancillary Questions One and TWo, a
discriminant analysis was run on the EMTP, Phase I selection
criteria to factor out those functions that effectively pre
dicted which candidates would be classified as selectees or
non-selectees. Finally, for Ancillary Question Three, a
discriminant analysis was performed on the personality and
role expectation measures (MPS, MMI) to identify which
might effectively contribute to the selection process.
Limitations of the Study
Because the first two groups of the 1976 EMTP,
Phase I sessions were not administered the Managerial
111
Philosophies Scale and Management Motive Index inventories,
they were compared mainly on the demographic variable
measures and the EMTP, Phase I selection criteria scores.
The 1976 selectees, however, were inventoried on the
FIRO-B. The study accepted the tendency for those who
were surveyed or inventoried on personality and role dimen
sion to make themselves look better than they felt or
thought they were.
Findings
The findings from the seven hypotheses and the three
ancillary questions are reported on this section.
Hypothesis One: Did a significant difference exist between
the selectees and non-selectees on demographic and EMTP,
Phase I selection criteria measures? The findings were as
follows: The non-selectees were significantly older than
the selectees and with less years of service in the Depart
ment of Education. There were no significant differences
in sex distribution between them.
The selectees scored higher and were significantly different
than the non-selectees on each of the four EMTP, Phase I
Hypothesis Two: Was there a significant difference between
the selectees and non-selectees on their responses on the
scales of MPS and MMI? Findings of the analysis showed:
112
The non-selectees differed significantly from the selectees
on the following measures: Theory X, Basic Creature Com
fort, and Safety and Order. Of particular interest is the
non-selectees' heavier orientation toward the Theory X
dimension.
Hypothesis Three: Whether a significant difference occurred
on the FIRO-B measures between the selectees and the group
of twenty-four non-selectees. The analysis of the data
revealed the following:
The non-selectees were significantly different than the
selectees on two sub-scales: the SUMI (the desire for con
tact with others) and DIFFI (whether one would rather be
the invitor or the guest). The higher score by the non
selectees on SUMI indicated their greater desire to make
contact or interactions with others; however, their lower
score on DIFFI indicated that they would rather be invited
to make interactions. The selectees were more cautious
than the non-selectees in making interactions, but they
were more apt to reach out to others.
Hypothesis Four: Did a significant difference exist be
tween the selectees and observer/raters on the demographic
variables and the personality and role expection invento
ries (MPS, MMI)? On the demographic variables and the
seven sub-scale measures in the inventories, the following
was found:
The observer/raters were significantly older than the
113
selectees with more years of service in the Department of
Education. Significant differences in the distribution of
males and females between the groups were found. While the
observer/raters group had 36.4 per cent females and 63.6
per cent males, the selectees were comprised of 60 per cent
females and 40 per cent males, an inversely proportionate
distribution.
While there were no significant differences in the sub
scale measures of the Managerial Philosophies Scale, the
selectees differed significantly from the observer/raters
on two of the Management Motive Index sub-scale measures:
Basic Creature Comfort and Safety and Order. The findings
indicated that the observer/raters group placed a heavier
emphasis on these two needs.
Hypothesis Five: Was there a significant difference between
the observer/raters and the non-selectees on demographic
variables and personality and role expectation inventories
(MPS, MMI)? The analysis of the data revealed the follow-
ing: The observer/raters were significantly older than the
non-selectees and with more years of service in the depart
ment. On the MPS and MMI inventories, significant differen
ces between the two groups were found in two areas: Theory X
and Actualization and Self-Expression. Responses of the
non-selectees were significantly higher on the Theory X
Sub-sca~e measure than the observer/raters. On the other
114
hand, the observer/raters exhibited a significantly higher
score on the actualization and self-expression measure.
This finding led to an indication that on the need hier
archy scale, the observer/raters were more actualized than
the non-selectees.
Hypothesis Six: Whether there was a significant difference
between the selectees and observer/raters on the FIRO-B
inventory. From the analysis, the following was indicated:
Significant differences between the two groups occurred in
two sub-scales: SUMI (the desire for contact with others)
and SUMA (the desire for an exchange of affection and
warmth). The selectees were significantly higher on both
sub-scale measures, as they were more prone to have contacts
with others and exchange affection and warmth. Sub-scale
measures on the other eight were not significantly different.
Hypothesis Seven: Were there significant differences be
tween the group of twenty-four non-selectees and observer/
raters on the demographic variables and the sub-scale
measures of FIRO-B? Findings relative to this hypothesis
were: The observer/raters were significantly older than the
twenty-four non-selectees and with more years of service in
the department.
Of the ten sub-scale measures in FIRO-B, there were
significant differences between the two groups on six of
them. They were: SUMI (desire for contact with others) ,
115
SUMA (desire for exchange of affection and warmth), SUME
(desire to initiate behavior towards others), SUMW (desire
to have others initiate behavior towards you), SUM (desire
for interaction with people in all areas) and DIFFI
(whe~~eT one rather be the invitor or the guest). The
observer/raters' higher scores on DIFFI indicated that they
were more likely than the non-selectees to be the persons
who made the invitation for interactions or reached out to
others for the interactions. The non-selectees, on the
other hand, had a greater desire for interactions with
others, a greater desire for an exchange of affection and
warmth, and a greater desire to initiate behavior toward
others. Further, when the desire for interaction with
others in all areas, i.e., in personal, social, or business
transaction, and the desire to have others initiate beha
vior or interactions toward them were compared between the
groups, the non-selectees were significantly higher on both
measures.
The findings for each of the ancillary questions are presen
ted below:
Ancillary Question One: Were there one or more EMTP, Phase I
selection criteria that did not effectively predict between
the selectees and non-selectees? Findings from the first
hypothesis showed that the selectees and non-selectees
differed significantly when they were measured on the EMTP,
116
Phase I selection criteria. The selectees surpassed the
the non-selectees in each area. However, when the dis
criminant analysis was run on the criteria, only three of
the four measures discriminated between one being a
selectee or a non-selectee. The omission of the Observa
tion measure from the discriminant function suggested that
as a selection instrument, it lacked predictive discrimi
natory power due to shortcomings in validity or reliability
or to some other factor not yet revealed.
Ancillary Question Two: How well were the candidates class
ified as selectees or non-selectees, using the EMTP, Phase
I selection criteria scores? From the analysis of the
data, the following were indicated: Relative to Ancillary
Question One above, three EMTP, Phase I variables were
factored out by the discriminant analysis and were used as
a predictive measure on the candidates. Using these
variables, it was found that 80.8 per cent of the candidates
were properly classified as selectees or non-selectees. The
other 19.2 per cent of the candidates were not properly
classified, using the three variables which were factored
into the equation.
Ancillary Question Three: Will knowing the scores on the
personality and role expectation inventories materially
increase the classification accuracy of the candidates as
selectees or non-selectees? From the test analysis the
117
following was revealed: When the discriminant analysis was
run on the inventory measures (MPS, MMI), three of seven
sub-scale measures were factored out which could be used to
predict candidates as selectees or non-selectees. They were
TX, TY, and Basic Creature Comfort. Using them in a class
ification analysis resulted in 64.2 per cent of the candi
dates properly classified as selectees or non-selectees.
This suggested that use of the personality and role expecta
tion inventory scores as a classification instrument would
offer a classification effectiveness which would be 14.2
per cent better than chance correct classification.
Conclusions
Based upon the findings and analysis of this study
of the Educational Management Training Program, the follow
ing conclusions are warranted:
1. The selectees and non-selectees were significantly
different on each of the EMTP, Phase I criterion. The
selectees scored higher on each criterion. However, when
the criteria measures were used to evaluate and classify
the candidates as selectees or non-selectees, only three
(Academics, Interview, and Peer Evaluation) were statis
tically significant to be used as selection measures.
The EMTP, Phase I criterion Observation failed to meet the
118
significance level for use as a predictive measure. This
suggested that its use as an instrument for the EMTP,
Phase I Program needed to be further analyzed and vali
dated. In the study it was not an effective predictive
criterion.
2. The non-selectees were older than the selectees, but
had fewer years of service than the selectees. This meant
that between the non-selectees and selectees, the selectees
were more experienced in the department when they were
chosen to enter the EMTP, Phase II.
3. Members from the non-selectee group were generally more
traditional in their managerial philosophy. They were
higher in the Theory X orientation when compared to both
the selectees and observer/raters.
4. Analysis of the personality and role dimension invento
ries revealed selectees were more willing to be risk-takers
than non-selectees. The selectees were less traditional in
their managerial philosophy and less concerned about basic
creature comforts and safety and order than the non-selec
tees.
5. There were different cut-off scores on the four
selection criteria from year to year. The lack of continu
ity in scoring produced the effect, perhaps unwittingly, of
changing the standards from one year to the next. Thus, it
119
may have been possible that the selectee group from one
year would have had to have higher scores than those of
another year; conversely, it might have meant that an in
dividual who was not selected in a year when the cut-off
scores were relatively high would have been selected had
he or she been fortunate enough to have chosen a different
year to volunteer for EMTP, Phase I.
6. While the two personality and role dimension invento
ries (Managerial Philosophies Scale and Management of
Motive Index) were administered to all the candidates,
their use in the selection process has not been fully
explored by the department. When a discriminant analysis
was run on these seven sub-scale measures of the inventory,
three of the traits (TX, TY, and Basic Creature Comfort)
were factored out for use as a predictive tool. Using the
scores of the candidates on the three traits, it was
possible to correctly classify 64.2 per cent of them as
selectees or non-selectees.
7. When the FIRO-B inventory was used in the analysis, it
gave indications that the selectees were closer in inter
personal relations make-up to the observer/raters than the
non-selectees. The selectees differed from the observer/
raters on 20 per cent of the traits. These were indicators
that the selectees mirrored more the observer/raters than
the non-selectees. Additionally, the FIRO-B measures gave
120
indications that when one entered the educational officer
tanks, he might experience a somewhat different set of
interpersonal relationships, since the observer/raters
were more selective with whom they desired interactions.
8. When the selection criteria were used as variables in
a discriminant analysis procedure, eighty per cent of the
participants were correctly classified. By multiplying
the number of candidates in the first three years by the
per cent of classification, it would appear that the Depart
ment of Education had at least forty-four' individuals who
could have been made selectees, but were misclassified.
Further, these forty-four candidates may have qualified as
selectees had the department set established standards of
qualifications, rather than basing their decisions on year
by year norms. These forty-four non-selectees had EMTP,
Phase I trait measures similar to the fifty-one selectees.
Implications
The Hawaii State Department of Education professes
to seek the best personnel from its ranks to become admin
istrative leaders. This study analyzed much of the data
that pertained to the selection procedures of the Educa
tional Management Training Program (EMTP), Phase I. The
results of the study suggest a number of implications for
further research and possibly decision-making relating to
121
the area of selection of educational officers.
Implications for EMTP, Phase I Selection Criterion
The study tested application of the current
selection criteria for the EMTP. However, the relative
value of each criterion in the selection process is in
doubt since there have been no studies to empirically
validate their predictive power. The study particularly
shows that EMTP, Phase I Observation criterion bears
further investigation, since its use as a discriminating
tool is questionable.
Implications for Standards in EMTP, Phase I CriteriaMeasures
The study has shown that when the classification of
EMTP, Phase I participants were made according to the
discriminant analysis procedures, several individuals may
have been misclassified and therefore were not selected.
This suggests that the Department of Education needs to
explore in depth the type of criteria standards it is using
from year to year. Specifically, this suggests that the
department should explore the need for establishing a
standard rather than a cut-off score which fluctuates from ..
year to year in the EMTP, Phase I measures. Continuing the
current system of establishing yearly norms for the
selection process may deprive the department of finding more
122
individuals who may be qualified to become educational
officers.
Implications for Personality and Leadership Traits
This data appear to indicate that the selectees
are more similar to the observer/raters than the non
selectees. Whether this means that the selection process
has a bias which favors persons who present an image
similar to the current administrators may be a fruitful
area of further study. The effect of such a tendency, if
it exists, would be to perpetuate a particular management
style which may, in essence, dampen creativity and the
emergence of different ideas.
Implications for Validation Studies
Members selected into the educational ranks were
successful in that they scored the highest in all four EMTP,
Phase I ~riteria measures. However, the selection process
has only assured us that they were successful participants
according to these measures. There are no assurances that
they will become successful administrators, as these
selectees were not measured against a group of successful
educational officers. This indicates, then, that the
department needs to seek or conduct studies on who are
successful educational officers, and when such studies are
completed, to seek applicants who measure up to the
123
abilities and characteristics of these successful
administrators.
Implications for Curriculum and Training
While the use of the current EMTP, Phase I curri
culum and training standards have been used since the
inception of the EMTP, Phase I, with periodic modifica
tions, there have been no studies nor assurances that its
curriculum and training standards best help to train the
potential educational officers. Until the Department of
Education initiates studies on characteristics of
successful educational administrators and then match the
curriculum and training of potential administrators to
those qualities, the training portion of the EMTP,
Phase I Program is questionable.
124
Appendix 1
Data Collection Sheet
I.D. #Circle I.D. Code numberif candidate was selectedfor EMTP, Phase II
I. Age Sex Years in the Hawaii State DOE
II. From EMTP, Phase I: Scores used for selection purposes
(a) Academic Score Quintile Score
(b) Interview Score Quintile Score
(c) Observation/Rating Score Quintile Score
(d) Peer Observation/Rating Score Quintile Score
(e) Other major score (s)or rating(s) usedfor selection purposes
(Please notate what criteria and score memberreceived)
125
Appendix 2
Profile Summary Graph
Material in this appendix indicates scaling forthe Management of Motive Index (MMI). The shaded arearepresents the average range.
MAINTENANCEFACTORS
MOTIVATORFACTORS
120115
110
105
100
95
90
85
80
75::z:: 70E-tt.!lz 65filp::
60E-t(J)
Cl55
fil 50filz45
40
3530
2520
15
1050
/.... .-..~<&-• ..- ..:
/ -."-I -- - ,. -- ",'
~ _ ... -""".~ /':.11 ••
~~",i':!""'~ ,
~ . / ">/; • I'. • • .,
- ... ~ ..;. .- '. / I
V z.~
~o e ;:x:z ...,
~ ~~ H
C) t J-=!
~ ~ 0 I~J-=! 0
t:Q tr.l a:; ~C).::r:
90
85
80
75
70
l:J)Q)l-l 6500UlI
8 60~
:>il-l 550Q)
..c:8
50
45
40
35
30
Appendix 3
PHILOSOPHY BAR GRAPH
The graph below is used to plot the .scores from the Managerial PhilosophiesS~ale. The shaded area represents theaverage range.
160 84
156 83
151 82
136 78
125 --//
-
112./
71,//
,-..'
- ;7U, 66"
.-a'5iJ>G~86 62
,!?,~~'.;)y
77 -- ..)1
~~/.~
~.
.66 »: 49
//--, 1.-,,,-
40oJ
46 28
24 12
126
80
75
70
65
60
enQ)
55 l-l00UlI
50 8
>l
:>i45 l-l
0Q)
..c:8
40
35
30
25
20
Theory X Theory Y
127
Appendix 4
Fundamental Interpersonal Relations Orientation-Behavior(FIRO-B) Scale and Interpretation of
Summary Scores
The table below is used to calculate summary scoresfor FIRO-B.
I C A sum(I + C + A)
e
w
sum(e + w)
diff(+ or -)(e - w)
I e C A I + eC + eAe e e
I wC A I+ C + wAw w w w
(e I + wI) + (eC + wC)I I C + wC A + wAe + w e e
(eA + wA)+
(eI I (eC C- w ) + -w)
e I I e C C e A A(eA wA)- w - w - w + -
Interpretation of Summary Scores
SumI• High score means strong desire for contact with peopleregardless of who initiates it. Low score indicates preference for aloneness.
128
sumC• High score means a desire for structure, a preferencefor giving and taking orders. Low score means low structure, a laissez-faire attitude with respect to authority,neither wanting to give nor to receive orders.
SumA• High score indicates desire for a great deal ofexchange of affection and warmth. Low score means apreference for more personal distance from people and moreimpersonal, business-like relationships.
Sum e. High score means active initiation of behaviortoward others. Low score indicates little desire toinitiate behavior toward people.
Sum w. High score means you want other people to initiatebehavior toward you. Low score signifies a desire to haveother people not initiate behavior toward you.
Sum. High score means a preference for a great deal ofinteraction with people, in all areas. Low score indicatesa desire to have little cont·act with people, a desire to bemore alone and uninvolved.
dIe High score indicates a preference for initiating inclusion behavior rather than for receiving it. You want to dothe inviting much more than to be invited. Low score meansthe opposite: you would rather be the guest than the host.
dC• High score indicates a person who prefers to giveorders rather than to take them. Low score person prefersto follow orders rather than to give them.
dA. High score means preference for initiating affectionover receiving it. Low score means a larger desire forreceiving affection than for giving it.
d. High score means a strong preference for taking theinitiative in any human relating regardless of the area ofthe relationship. Low score means strong preference forwaiting for other people to take the initiative toward you,whether it be contact, control, or affection.
129
REFERENCES
lStatement by Nakama, Henry, retired educational officer,personal interview, Honolulu, Hawaii, September 10, 1981.
2Statement by Ikeda, Kazuo, retired educational officer,personal interview, Honolulu, Hawaii, February 2, 1983.
3Statement by Ohashi, Edward, educational officer,personal interview, Honolulu, Hawaii, March 10, 1983.
4Statement by Otoshi, Morris, educational officer, personalinterview, Honolulu, Hawaii, March 10, 1983.
5savard, William G., "The Leadership Selection and TfainingProgram of the Hawaii Department of Education ll (Honolulu,Hawaii, November 1,1962). (Mimeographed).
6Statement by Nishimoto, Joseph, retired educational officerof the Department of Personnel, Hawaii State Departmentof Education, personal interview, Honolulu, Hawaii,September 1978.
7Statement by Oliviera, Francis, retired educational officer,personal interview, Honolulu, Hawaii, March 9, 1983.
8Statement by Ito, Takao, educational officer, personalinterview, Honolulu, Hawaii, March 10, 1983.
9Statement by Nakama, Henry, retired educational officer,personal interview, Honolulu, Hawaii, September 10, 1981.
10Statement by Ikeda, Kazuo, retired educational officer,personal interview, Honolulu, Hawaii, February 2, 1983.
12Statement by Pang, Morris, university professor, personalinterview, Honolulu, Hawaii, March 9, 1983.
l3Statement by Nakama, Henry, retired educational officer,personal interview, Honolulu, Hawaii, September 10, 1981.
130
14Statement by Ohashi, Edward, educational officer, personalinterview, Honolulu, Hawaii, March 10, 1983.
15Statement by Ikeda, Kazuo, retired educational officer,personal interview, Honolulu, Hawaii, February 2, 1983.
16savard, "t 9~~, p ••
17savard, ~ cit., p. 9.
18Ezaki, Minoru, "The Need for Trained Administrators",Hawaii State Department of Education, Honolulu, Hawaii,October 1, 1965). (Mimeographed).
19paper on Leadership Training Program (Hawaii StateDepartment of Education), report on old LeadershipTraining Program, December 22, 1964. (Mimeographed) •
20savard, ~ cit., pp. 7-9.
21Ezaki, Minoru, "Administrative Intern Program" (HawaiiState Department of Education, Honolulu, Hawaii, August 1,1966) • (Mimeographed).
22Statement by Chang, Thomas, university professor, personalinterview, Honolulu, Hawaii, March 10, 1983.
23savard, 't 2 3~ ~, pp. -.24Savard, ~ cit., p. 3.
25paper on Staff Development: Administrators in the Departmentof Education (Hawaii State Department of Education), reporton Educational Management Training Program, 40 pages.(Mimeographed) .
26 I b i d., 40 pages.
27Statement by Nishimoto, Joseph, retired educational officerof the Department of Personnel, Hawaii State Department ofEducation, personal interview, Honolulu, Hawaii, July 1978.
28Halpin, Andrew W., ed., Administrative Theory in Education(London: MacMillan Company, 1958), pp. 40-72; 150-165.
131
29 I b i d., p. 156.
30I b i d., pp. 40-72; 150-165.
31I b i d., pp. 101-111.
32owens, Robert G., Organizational Behavior in Schools(New Jersey: Prentice Hall, Inc., 1970), pp. 120-125.
33 I b i d., pp. 123-124.
34 Hoy, Wayne K., and Cecil G. Miske1, EducationalAdministration: Theory, Research, and Practice (NewYork: Random House, 1978) pp. 18-23.
35Hoy, ~ cit., p. 25.
36 Hoy, ~ cit., pp. 18-27.
37 Hoy, ~ cit., p. 28.
38Ha1pin, ~ cit., pp. 40-72; 150-165.
39Hoy, ~ cit., p. 25.
40 Hoy, ~ cit., p. 37.
41Hoy, ~ cit., pp. 36-37.
42Hoy, ~ cit., p. 38.
43 . 40Hoy, ~ C1t., p. •
44Getzels, Jacob W., James M. Lipham and Ronald F.Campbell, Educational Administration As A SocialProcess: Theory, Research, and Practice (New York:Harper and Row, 1968), pp. 52-78.
45. Hoy, ~ cit., pp. 36-46.
46 Hoy, ~ cit., p. 41.
47 Hoy, ~ cit., p. 41.
48 Hoy, ~ cit., pp. 36-37.
49Hoy, ~ cit., p. 41.
132
50Abbott, Max G., "Intervening Variables in OrganizationalBehavior," Educational Administration Quarterly 1, (1965)pp. 1-13.
51Hoy, ~ cit., pp. 44-45.
52Hoy, ~ cit., p. 44.53Hoy, ~ cit., p. 45.
54Owens, ~ cit., pp. 7-8; 56-60.
550wens, ~ cit., p. 57.
56presthus, Robert, The Organizational Society (New York:Alfred A. Knopf, Inc., 1962), p. 5.
57Hoy, Wayne K., and Cecil G. Miskel, EducationalAdministration: Theory, Research, and Practice (New York:Random House, 1978), pp. 48-66.
58 b'd 62 65I ~ ., pp. - .
59Stryker, Perrin, The Character of the Executive (New York:Harper and Brothers, 1960) pp. IX-XII.
60Lashbrook, Velma, and William Lashbrook, A Theoretical andMethodical Evaluation of Leadership Research, ERICDocument Ed 071-107, 1970, pp. 1-5.
61HOY, ~ cit., pp. 120-123; 176-184.
62Getzels, Jacob W., James M. Lipham, and Ronald F. Campbell,Educational Administration As A Social Process: Theory,Research, and Practice (New York: Harper and Row, 1968)pp. 1-5.
63MeyerS, Jr., John A., ed., Predicting Managerial Success,(Ann Arbor, Michigan: Foundation for Research on HumanBehavior, 1968) p. v.
64RogerS, John B, et al., Executive Selection: HowPsychologists Can Help (Cambridge, Massachusetts:Graduate School of Business Administration, 1955) p. 76.
133
65Lucio, William H. and John D. McNeil, Supervision:A Synthesis of Thought and Action, U. S. Departmentof Health, Education, and Welfare, ERIC Document Ed030-207, 1969, pp. 72-73.
66 R . d . . d .Deever, • Merw~n, an James E. Jurs, Cr~ter~a Use ~n
Selection of District Office Administrative Personnel,Bureau of Educational Research, College of Education,Arizona State University, ERIC Document Ed 123-781,October 1975, p. 3.
67sikula, Andrew F., and John P. Sikula, The Values andValue System of Educational Administrators, ERICDocument Ed 061-583, April 1972. p. 2.
68Mitchell, Donald P., Leadership in Public Education Study:A Look at the Overlooked, Academy for EducationalDevelopment, Inc., Washington, D.C., ERIC Document Ed075-896, 1972.
69National Association of Independent Schools, TheSelection and Appointment of School Heads: A~nual ofSuggestions to Boards of Trustees and Candidates, Boston,Mass., ERIC Document Ed 083-752, Nov. 71, p. 2.
70Myers, Jr., John A., ed., Predicting Managerial Success(Ann Arbor, Michigan: Foundation for Research on HumanBehavior, 1968) p. 2.
71 I b i d., p , 23.
72I b i d., p , 14.
73 I b i d., p , 25.
74Cleeton, Glen U., and Charles W. Mason, Executive Ability,Its Discovery and Development (Ohio: Antioch Press, 1946).pp. 71-98; 130-191.
75Owens, Robert G., Organizational Behavior in Schools (NewJersey: Prentice Hall, Inc., 1970), p. 119.
76Cattell, R. B. and G. F. Stice, "Four Formulas forSelecting Leaders on the Basis of Personality," HumanRelations 7, (1954), pp. 493-508.
134
77Dooher, M. Joseph, and Elizabeth Marting, editors,Selection of Managerial Personnel (New York: AmericanManagement Association, Inc., 1957) Volume II.
78Rogers, John B., et aI, Executive Selection: HowPsychologists Can Help (Cambridge, Mass.: GraduateSchool of Business Administration, 1955) pp. 5-7.
79sands, Edith, How to Select Executive Personnel (London:Reinhold Publishing Corp., 1960) p. 37.
80R 't 39ogers, ~ ~, p. •
8lHigginson, Margaret V., and Thomas L. Quick, The AmbitiousWomen's Guide to a Successful Career (AMACON, 1975)pp. 9-23.
82I b';d. t. 24 29 --oJ. pp. - .
83woods, Marion M., "What Does It Take for a Woman to MakeIt in Management," Personnel Journal, Jan 75, pp. 38-41.
84Hawaii State Department of Education, Education ManagementTraining Program, an undated document, (mimeographed).
85poteet, Ralph Harris, Criteria for the Selection of PublicElementary School Principalships in the State of Texas,East Texas, School Study Council, ERIC Document Ed 035963, Aug 68.
86Stout, Robert T., New Approaches to Recruitment andSelection of Educational Administrators, University ofOregon, ERIC Document Ed 075-888, 1973, pp. 6-7.
87 . 27Myers, ~ c~t., p. .
88Silverman, Samuel, The Search for Leadership Talent, ERICDocument Ed 071-184, 1972, pp. 1-5.
89Stryker, Perrin, The Character of the Executive (New York:Harper and Brothers, 1960), p. Xi.
135
90England, George W., Personal Value Systems of Managersand Administrators, Center for the Study of OrganizationalPerformance and Human, University of Minnesota,Minneapolis, ERIC Document Ed 080-826, July 1973,pp. 1-14.
91owens, ~ cit., pp. 118-119.
92 ... t d h d' .Ta1g1ur1, Rena 0, e ., Researc Nee s 1n Execut1veSelection (Boston: Harvard University, 1961) pp. 10-11.
93Myers, ~ cit., pp. 27-28.
94Miller, John Perry, "Outputs of Higher Education: GraduateEducation," Outputs of Higher Education: Their Identification,Measurements, and Education, ed. Lawrence, Ben, GeorgeWeatherby, and virginia W. Patterson, Boulder, Colorado,July 1970, pp. 105-106.
95Drucker, Peter F., Management, Task, Responsibilities,Practices (New York: Harper and Row Publishers, 1974)pp. 158-159.
96wochner, Raymond E., and Steven B. Lynch, The Identificationand Development of Administrative Competencies, Bureau ofEducational Research and Services, Arizona State university,ERIC Document Ed 083-723, July 1973, pp. 1-4.
97Morphet, Edgar L., and William Schutz, Procedures forIdentifying Persons with Potential for Public SchoolAdministrative Positions, (Berkeley, California: Universityof California, 1961) pp. 7-8; 64-70.
98 I b i d., pp. 7-8.
990wens, ~ cit., pp. 174-184.
100Owens, ~ cit., pp. 184-187.
101owens, ~ cit., pp. 121-124.
102Rogers, ~ cit., pp. 37-69.
103Report of Seminar, "Assessing Managerial Potential",Foundation for Research on Human Behavior, Ann Arbor,Michigan, 1958, p. 35.
136
104I bi d., pp. 14-16.
105Bruno, James E., and James N. Fox, Quantitative Analysisin Educational Administrator preparation Program,University of Oregon ERIC Document Ed 082-270, 1973,pp. 61-65.
106Bieber, Fred, and Raymond E. Peterson, The Identificationand Development of Administrative Competencies, Proceedingsfrom a Seminar, College of Education, Arizona StateUniversity, ERIC Document Ed 083-684, pp. 3-5.
107Ri ce, Berkeley, "Measuring Executive Muscle," PsychologyToday, Vol. 12, 7, December 1978, pp. 95-110.
108I b i d., pp. 100-105.
109Moses, Joseph L., "Development on Assessment CenterProgram for School Administrators," National Associationof Secondary School Principals, Vol. 61, No. 410,September 1977, pp. 76-79.
110Tesolowski, Dennis G., and Thomas E. Morgan, "SelectingEtiucationalAdministrators: The Assessment Center Technique,"National Association of Secondary School Principals, Vol.64, No. 433, February 1980, pp. 107-113.
IllJeswald, Thomas A., "A New Approach to IdentifyingAdministrative Talent, National Association of SecondarySchool Principals, Vol. 61, No. 410, September 1977,pp. 79-83.
112R, 't 109~ce, ~ ~' p. •
113Brandewie, Donald, Thomas Johnson, and J. Lloyd Trump,"The Preparation and Development of Secondary SchoolAdministrators," National Association of SecondarySchool Principals, Mar 1972, pp. 24-25.
114Bennett, Willard E., Manager Selection, Education, andTraining, (New York: McGraw-Hill, 1959) pp. 49-59.
137
115Ha l l, Jay, and Martha Williams, Management of MotiveIndex, (Conroe, Texas: Teleometr1cs Internat1onal, 1973),seven pages, sixty item inventory.
116Jacoby, Jacob, and James R. Terborg, ManagerialPhilosophies Scale (Conroe, Texas: TeleometricsInternational, 1975), two pages, thirty-six iteminventory.
118Hall, Jay, "To Achieve or Not: The Manager's Choice,"California Management Review, Vol. XVIII, No.4, pp. 5-15.
l19Buros, Oscar K., ed., The Eight Mental MeasurementYearbook, Vol. II (New Jersey: Gryphon Press, 1978) p. 1180.
l20Ha l l, Ope cit., pp. 7-10.
l21Ha l l, Ope cit., pp. 11-13.
I22Ha l l, Jay, r-1anagement of ~1otive Index, a sixty iteminventory, (Woodlands, Texas: Teleometrics International,1973), p , 9.
123Ha l l, Jay, Teleometrics: Products for Achievement a manualon tests and inventories, Woodlands, Texas, p. 4.
124Buros, Ope cit., p. 1180.
125Jones, Howard L., Jan Sasek, and James A. Wakefield, Jr.,"Maslow Need Hierarchy and Cattell's l6PF, "Journal ofClinical Psychology, Vol. 32 No.1, January 1976,pp. 74-76.
126cunningham, Claude H., James A. Wakefield, Jr., and G.Robert Ward, "An Emoirical Comparison of Maslow's andMurray's Needs System," Journal of Personality Assessment,Vol. 39, No.6, 1975, pp. 594-596.
138
127Buros, ~ cit., p. 1180.
128I bi d., p. 1180.
129Ha l l, Jay, Teleometrics; Products for Achievement, amanual on tests and inventories, Woodlands, Texas, p. 8.
130owens, ~ cit., pp. 24-25.
131Buros, . t 1180~~, p , •
132Jacoby, Jacob, and James R. Terborg, How to Interpret YourScores on the Managerial Philosophies Scale-an inventorymanual, (Conroe, Texas, Teleometrics International, 1975).
133Buros, ~ cit., p. 1180.
134Jacoby, Jacob, and James R. Terborg, Managerial PhilosophiesScale, a thirty-six item inventory, (Conroe, Texas:Teleometrics International, 1975), p. 2.
135Ha l l, ~ cit., p. 8.
136Jacoby, Jacob, and James R. Terborg, Development of TheoryX and Y Scales for Assessing McGregor's ManagerialPhilosophies, a manuscript on the Managerial PhilosophiesScale, (Conroe, Texas: Teleometrics International,Spring 1975).
137Buros, Oscar K., ed., The Seventh Mental MeasurementYearbook, (New Jersey: Gryphon Press, 1972) p. 78.
138Schutz, Will, FIRO-B, a questionnaire, (Palo Alto:Consulting Psychologists Press, 1977) p. 1.
139schutz, William C., Here Comes Everybody: Bodymind andEncounter Culture (New York~ na~per and Row, 1971) p. 17.
140schutz, . +- 17 28Ope ~, pp. - •
139
l4lMorphet, Edgar L. and William Schutz, Procedures forIdentifying Persons with Potential for Public SchoolAdministrative Positions, (Berkeley, California: Universityof California, 1961) pp. 7-8.
l42Morphet, Edgar L. and William C. Schutz, Procedures forIdentifying Persons With Potential for Public SchoolAdministrative Positions, (Berkeley, California:University of California, 1961), pp. 4-7.