32
Information Transfer 1 Introduction to Line graphs
| Date post: | 13-Dec-2015 |
| Category: |
Documents |
| Upload: | barbara-carr |
| View: | 227 times |
| Download: | 1 times |

Information Transfer 1 Introduction to Line graphs

Parts of a line graph
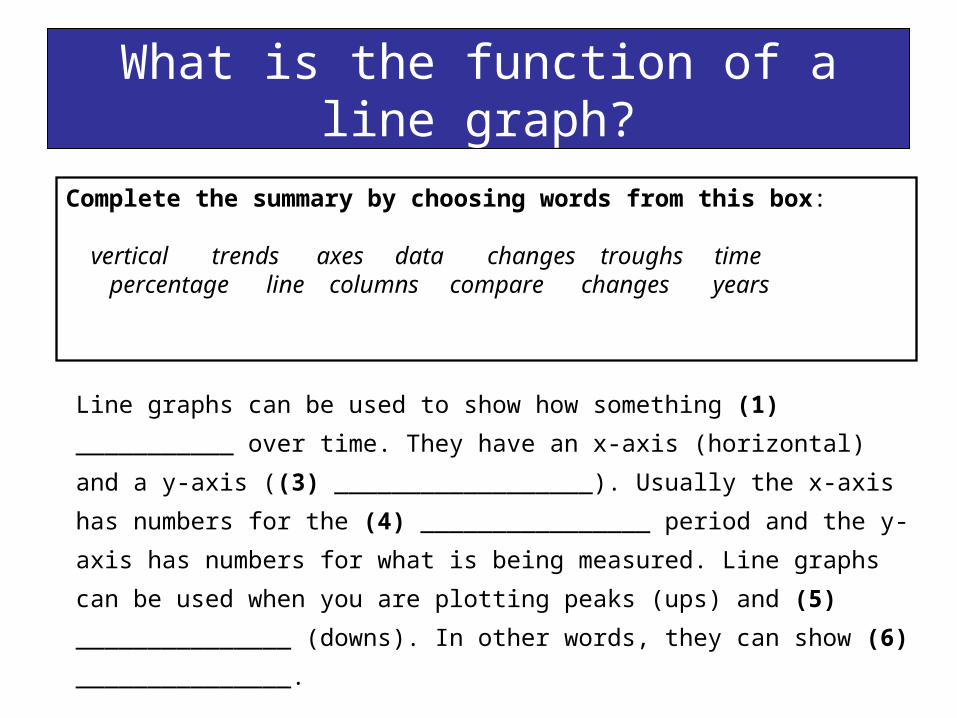
What is the function of a line graph?
Line graphs can be used to show how something (1) ___________
over time. They have an x-axis (horizontal) and a y-axis ((3)
__________________). Usually the x-axis has numbers for the (4)
________________ period and the y-axis has numbers for what is
being measured. Line graphs can be used when you are plotting peaks
(ups) and (5) _______________ (downs). In other words, they can
show (6) _______________.
Complete the summary by choosing words from this box:
vertical trends axes data changes troughs time percentage line columns compare changes years
Answers
• Line graphs can be used to show how something (1) changes over time. They have an x-axis (horizontal) and a y-axis (3) ( vertical) Usually the x-axis has numbers for the (4) time period and the y-axis has numbers for what is being measured. Line graphs can be used when you are plotting peaks (ups) and (5) troughs (downs). In other words, they can show (6) trends.

Bar graphs are similar to line graphs
The line graph and the bar chart below show the same information laid out in a different graphic format.

Examine the axes carefully
• What does this mean?
In 1000’s

What is the function of a bar graph?
Bar graphs are similar to (7) _______ graphs in that they have two (8) ____________ and are useful when you want to show how something has changed over the (9) _________ (or days or weeks), especially where there are very big changes. They are also very useful if you want to (10) __________ things by showing their differences or similarities.
Complete the summary by choosing words from this box:
vertical trends axes data changes troughs time percentage line columns compare changes years

Bar graphs are similar to (7) line graphs in that they have two (8) axes and are useful when you want to show how something has changed over the (9) years (or days or weeks), especially where there are very big changes. They are also very useful if you want to (10) compare things by showing their differences or similarities.
(the exercises above are from Action Plan for IELTS)
Answers
Trends
Trends are changes or movements over time.
These changes are normally expressed in numeric items, for example, percentage, weight, or number.
There are three basic trends:

3 Basic Trends
Rising Falling Staying the same

Trends: Focus on FormDirection Verb Noun
Rose (to)
Increased (to)
Soared (to)
A rise
An increase
A soar
• There was an increase in fuel consumption in 1989.
• Fuel consumption increased in 1989

Trends: Focus on Form
Direction Verbs Nouns
Fell (to)
Decreased (to)
Dropped (to)
Declined (to)
A fall (in)
A decrease (in)
A drop (in)
A decline (in)
• There was a decrease in fuel consumption in 2006.
• Fuel consumption decreased in 2006.

Trends: Focus on Form
Direction Verb Noun
Remained stable (at)
No change
• Throughout the 1970s the population of Al Ain remained stable at 300,000.
• There was no change in population of Al Ain in the 1970s.

More words to describe key features in graphs
plateau peak fluctuation
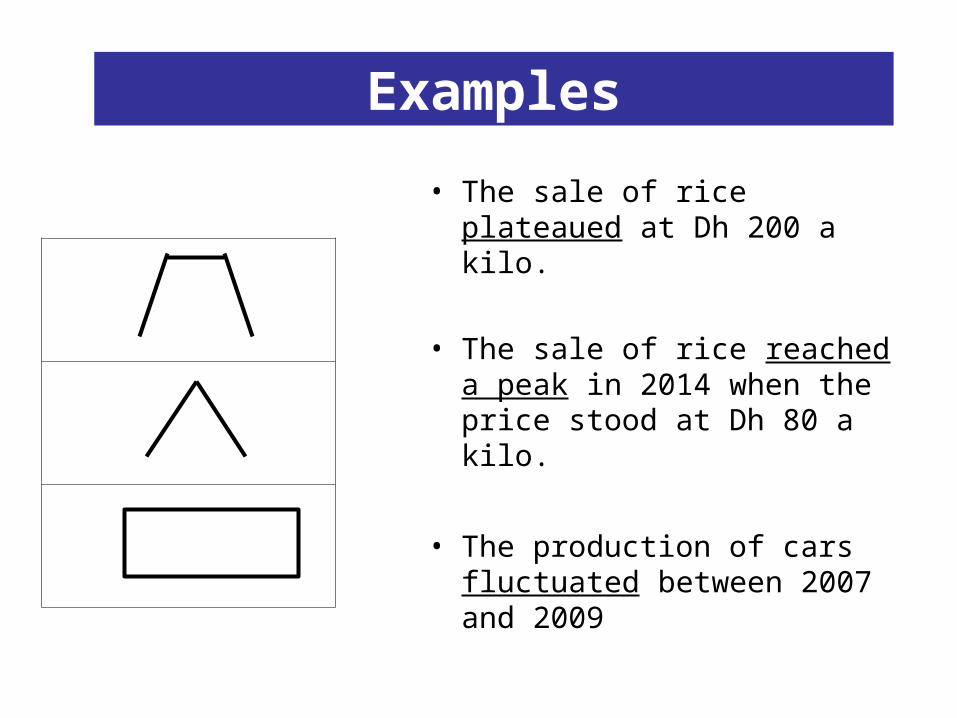
• The sale of rice plateaued at Dh 200 a kilo.
• The sale of rice reached a peak in 2014 when the price stood at Dh 80 a kilo.
• The production of cars fluctuated between 2007 and 2009
Examples
Most graphs are described in the past tense
• What is the past tense of the following words?
»rise rose» increase
increased»soar soared»climb climbed
e.g. Sales increased in the 1990s

• What is the past tense of the following words?
»decrease decreased»drop dropped»decline declined»fall fell»
Sales decreased in the 1990’s
Most graphs are described in the past tense

It helps to divide up a graph into sections

What verbs would you use to describe these trends?
Write words to describe what trends you see on the graph.

Did you use these words?
decreased
stayed steady
fellincreased
declined
droppeddecreased
stayed steady
felldecreased
stayed steady
increasedfell
decreased
stayed steady
declined
increasedfell
decreased
stayed steady
dropped
declined
increasedfell
decreased
stayed steady
dropped
declined
increasedfell
decreased
stayed steady

Describing the degree of change
Adjectives Adverbs
sharp sharply
slight slightly
significant significantly
• There was a sharp increase of sales in the past 5 months.
• Sales increased sharply in the past 5 months.

What adverbs would you use to describe these increases?
Verb Past
Tense
Adverb
rise
rapidly
dramatically
sharply
significantly
increase
climb

What adverbs would you use to describe these increases?
Verb Past
Tense
Adverb
rise
steadily
slightly
gradually
moderately
increase
climb

Describing the degree of change
decreased
stayed steady
fell
increasedsignificantly
declined
sharply
droppedslightly

Describing the speed of change
Adjectives Adverbs
rapid rapidly
quick quickly
slow slowly
• There was a rapid increase of sales in the past 5 months.
• Sales increased rapidly in the past 5 months.

Describing the speed of change(adjective + verb)
A quickincrease
A rapid decline
A slow drop
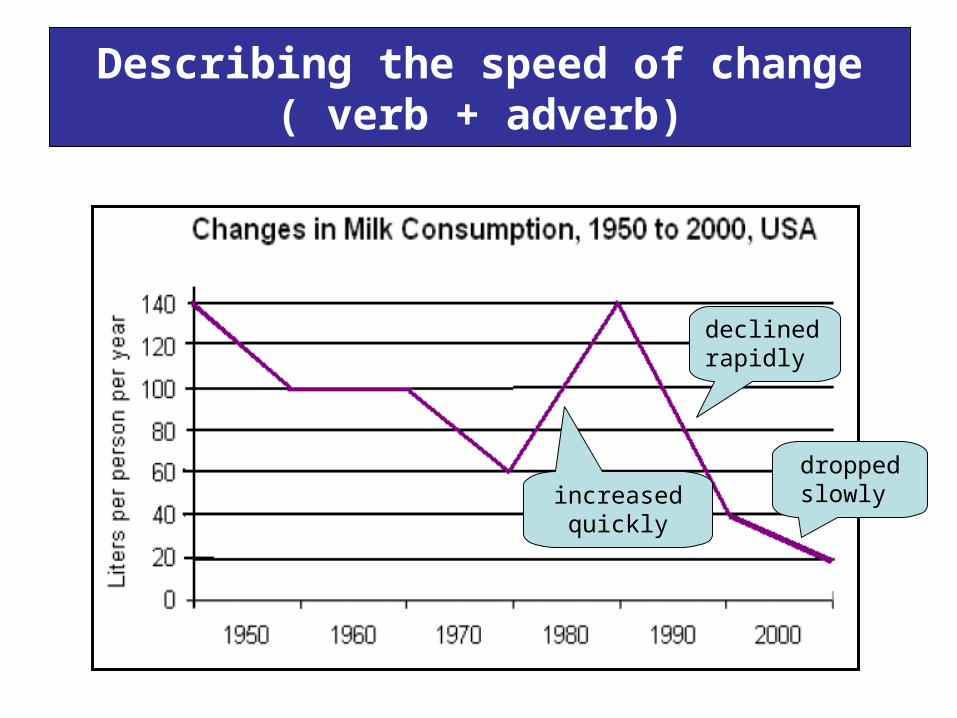
Describing the speed of change( verb + adverb)
increased quickly
declined rapidly
dropped slowly

In the IELTS exam:

Use a variety of sentence structures
• Simple past tense:
Subject + Verb (in the past) + Object
Milk consumption increased in the 1980’s.
Milk consumption increased slightly in the 1980’s.
A slight increase in milk consumption was found in the 1980’s.

Remember to use a varied vocabulary:
Going Up• rose • increased • went up • grew
Going Down- decreased - fell - dropped - declined
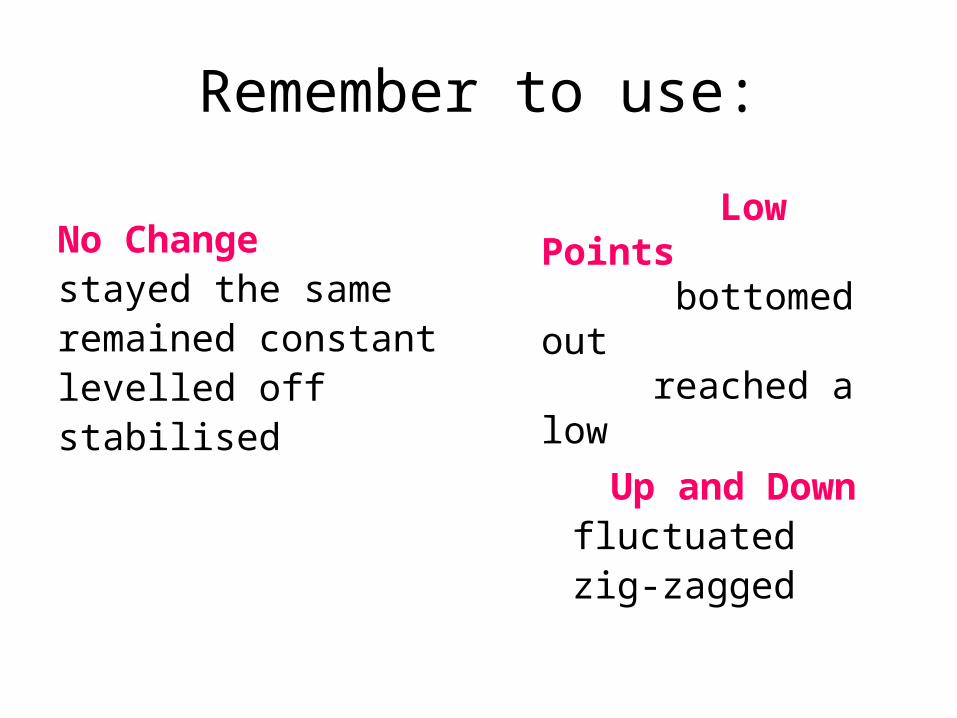
Remember to use:
No Changestayed the same remained constant levelled off stabilised Up and Down
fluctuated zig-zagged
Low Points bottomed out reached a low

Remember to use:
Small Changes - Adjectives / Adverbs• gently • gradually • slightly • steadily
Big Changes - Adverbs / Adjectivessuddenly sharply dramatically steeply a lot


