56
2017 Half Year Financial Report Group

2017 Half Year Financial Report
Group

TOD’S Group 2017 Half Year Financial Report
06.30.2017
Table of contents
TABLE OF CONTENTS
Company’s data . . . . . . . . . . . . . . . . . . . . . . . . . . . . . . . . . . . . . . . . . . . . . . . . . . . . . . . . . . . . . . . . . . . . . . . . . . . . . . . . . . . . . . . . . . . . . . . . . . . 1 Corporate Governance bodies . . . . . . . . . . . . . . . . . . . . . . . . . . . . . . . . . . . . . . . . . . . . . . . . . . . . . . . . . . . . . . . . . . . . . . . . . . . . . . . . . . 2 TOD’S Group . . . . . . . . . . . . . . . . . . . . . . . . . . . . . . . . . . . . . . . . . . . . . . . . . . . . . . . . . . . . . . . . . . . . . . . . . . . . . . . . . . . . . . . . . . . . . . . . . . . . . . . 3 Group’s organizational chart . . . . . . . . . . . . . . . . . . . . . . . . . . . . . . . . . . . . . . . . . . . . . . . . . . . . . . . . . . . . . . . . . . . . . . . . . . . . . . . . . . . . 4 Distribution network as of June 30
t h, 2017 . . . . . . . . . . . . . . . . . . . . . . . . . . . . . . . . . . . . . . . . . . . . . . . . . . . . . . . . . . . . . . . . . . . 5
Key consolidated financial f igures . . . . . . . . . . . . . . . . . . . . . . . . . . . . . . . . . . . . . . . . . . . . . . . . . . . . . . . . . . . . . . . . . . . . . . . . . . . . . 6 Highlights of results . . . . . . . . . . . . . . . . . . . . . . . . . . . . . . . . . . . . . . . . . . . . . . . . . . . . . . . . . . . . . . . . . . . . . . . . . . . . . . . . . . . . . . . . . . . . . . 8
Interim Report ................................ ................................ ................................ ........ 9 Group’s activity ......................................................................................................... 10 Group’s brands .......................................................................................................... 11 Foreign currency markets .......................................................................................... 12 Main events and operations during the period .......................................................... 12 Group’s results in HY 2017 ......................................................................................... 14 Items or transactions resulting from unusual and/or exceptional transactions ............... 21 Significant events occurred after the reporting period .................................................. 21 Business Outlook ....................................................................................................... 21
Half-Year Condensed Financial Statements ................................ ................................22 Consolidated Income Statement ................................................................................ 23 Consolidated Statement of Comprehensive Income ................................................... 24 Consolidated Statement of Financial Position ............................................................ 25 Consolidated Statement of Cash Flows ...................................................................... 27 Consolidated Statement of Changes in Equity ............................................................ 28
Supplementary notes ................................................................ ..............................29 1. General notes . . . . . . . . . . . . . . . . . . . . . . . . . . . . . . . . . . . . . . . . . . . . . . . . . . . . . . . . . . . . . . . . . . . . . . . . . . . . . . . . . . . . . . . . . . . . . 30 2. Basis of preparation .. . . . . . . . . . . . . . . . . . . . . . . . . . . . . . . . . . . . . . . . . . . . . . . . . . . . . . . . . . . . . . . . . . . . . . . . . . . . . . . . . . . 30 3. Accounting standards .. . . . . . . . . . . . . . . . . . . . . . . . . . . . . . . . . . . . . . . . . . . . . . . . . . . . . . . . . . . . . . . . . . . . . . . . . . . . . . . . . 31 4. Seasonal or cyclical nature of interim transactions .. . . . . . . . . . . . . . . . . . . . . . . . . . . . . . . . . . . . . . . . 36 5. Alternative indicators of performances .. . . . . . . . . . . . . . . . . . . . . . . . . . . . . . . . . . . . . . . . . . . . . . . . . . . . . . . . 36 6. Scope of consolidation .. . . . . . . . . . . . . . . . . . . . . . . . . . . . . . . . . . . . . . . . . . . . . . . . . . . . . . . . . . . . . . . . . . . . . . . . . . . . . . . 37 7. Segment reporting .. . . . . . . . . . . . . . . . . . . . . . . . . . . . . . . . . . . . . . . . . . . . . . . . . . . . . . . . . . . . . . . . . . . . . . . . . . . . . . . . . . . . . 39 8. Management of f inancial risks . . . . . . . . . . . . . . . . . . . . . . . . . . . . . . . . . . . . . . . . . . . . . . . . . . . . . . . . . . . . . . . . . . . . . . 41 9. Intangible and Tangible fixed assets .. . . . . . . . . . . . . . . . . . . . . . . . . . . . . . . . . . . . . . . . . . . . . . . . . . . . . . . . . . . . . 44 10. Derivative financial instruments . . . . . . . . . . . . . . . . . . . . . . . . . . . . . . . . . . . . . . . . . . . . . . . . . . . . . . . . . . . . . . . . . . . 45 11. Share Capital . . . . . . . . . . . . . . . . . . . . . . . . . . . . . . . . . . . . . . . . . . . . . . . . . . . . . . . . . . . . . . . . . . . . . . . . . . . . . . . . . . . . . . . . . . . . . . 46 12. Earnings per share .. . . . . . . . . . . . . . . . . . . . . . . . . . . . . . . . . . . . . . . . . . . . . . . . . . . . . . . . . . . . . . . . . . . . . . . . . . . . . . . . . . . . . 47 13. Dividends .. . . . . . . . . . . . . . . . . . . . . . . . . . . . . . . . . . . . . . . . . . . . . . . . . . . . . . . . . . . . . . . . . . . . . . . . . . . . . . . . . . . . . . . . . . . . . . . . . . 47 14. Provisions . . . . . . . . . . . . . . . . . . . . . . . . . . . . . . . . . . . . . . . . . . . . . . . . . . . . . . . . . . . . . . . . . . . . . . . . . . . . . . . . . . . . . . . . . . . . . . . . . . 47 15. Employee benefits . . . . . . . . . . . . . . . . . . . . . . . . . . . . . . . . . . . . . . . . . . . . . . . . . . . . . . . . . . . . . . . . . . . . . . . . . . . . . . . . . . . . . . . 48 16. Net Financial Position .. . . . . . . . . . . . . . . . . . . . . . . . . . . . . . . . . . . . . . . . . . . . . . . . . . . . . . . . . . . . . . . . . . . . . . . . . . . . . . . . . 48 17. Transactions with related parties . . . . . . . . . . . . . . . . . . . . . . . . . . . . . . . . . . . . . . . . . . . . . . . . . . . . . . . . . . . . . . . . . 50 18. Significant non-recurring transactions and events . . . . . . . . . . . . . . . . . . . . . . . . . . . . . . . . . . . . . . . . . . 53 19. Significant events occurred after the reporting period .. . . . . . . . . . . . . . . . . . . . . . . . . . . . . . . . . . . 53
Attestation of the Half -Year condensed financial statements of TOD’S Group pursua nt article 154 bis of D.LGS. 58/98 and of article 81 -ter of Consob Regulation n. 11971 of May 14
th 1999 and further modifications and integrations. ................................................54

TOD’S Group 2017 Half Year Financial Report
06.30.2017
1 Company’s data
Company’s data
Registered office Parent company
TOD’S S.p.A.
Via Fil ippo Della Valle, 1
63811 Sant'Elpidio a Mare (Fermo) - Italy
Tel. +39 0734 8661
Legal data Parent company
Share capital resolved euro 66,187,078
Share capital subscribed and paid euro 66,187,078
Fiscal Code and registration number on Company Register of Court of Fermo: 01113570442
Registered with the Chamber of Commerce of Fermo under n. 114030 R.E.A.
Offices and Showrooms Munich – Domagkstrasse, 1/b, 2
Hong Kong – 35/F Lee Garden One, 33 Hysan Avenue, Causeway Bay
London – Wilder Walk, 1
Milan - Corso Venezia, 30
Milan - Via Savona, 56
Milan - Via Serbelloni, 1-4
New York - 450, West 15t h
Street
Paris – Rue de Faubourg Saint-Honore, 29
Paris – Rue du Général FOY, 22
Paris – Rue de L’Elysée, 22
Seoul – 11/F Pax Tower 609, Eonju-ro, Gangnam-gu
Shanghai - 1717 Nanjing West Road, Wheelock Square 45/F
Tokyo – Omotesando Building, 5-1-5 Jingumae
Production facilities Comunanza (AP) - Via Merloni, 7
Comunanza (AP) - Via S.Maria, 2-4-6
Sant'Elpidio a Mare (FM) - Via Fil ippo Della Valle, 1
Bagno a Ripoli, Loc. Vallina (FI) - Via del Roseto, 60
Bagno a Ripoli, Loc. Vallina (FI) - Via del Roseto, 50
Tolentino (MC) - Via Sacharov 41/43

TOD’S Group 2017 Half Year Financial Report
06.30.2017
2 Corporate Governance bodies
Corporate Governance bodies
Board of directors ( 1)
Diego Della Valle Chairman
Andrea Della Valle Vice - Chairman
Luigi Abete
Maurizio Boscarato
Luigi Cambri
Sveva Dalmasso
Emanuele Della Valle
Romina Guglielmetti
Emilio Macellari
Vincenzo Manes
Cinzia Oglio
Pierfrancesco Saviotti
Michele Scannavini
Stefano Sincini
Executive Committee Diego Della Valle Chairman
Andrea Della Valle
Emilio Macellari
Stefano Sincini
Compensation Luigi Abete Chairman
Committee Sveva Dalmasso
Vincenzo Manes
Control and Risk Luigi Cambri Chairman
Committee Maurizio Boscarato
Romina Guglielmetti
Independent Directors Vincenzo Manes Chairman
Committee Romina Guglielmetti
Pierfrancesco Saviotti
Board of statutory ( 2 )
Giulia Pusterla Chairman
Auditors Enrico Colombo Acting stat. auditor
Fabrizio Redaelli Acting stat. auditor
Gilfredo Gaetani Substitute auditor
Myriam Amato Substitute auditor
Independent Auditors ( 3)
PricewaterhouseCoopers S.p.A.
Manager charged with preparing Rodolfo Ubaldi
Company’s financial report
( 1 ) Term of the off ice: 2015-2017 (resolut ion of the Shareholders ’ meeti ng as of Apri l 22n d , 2015)
( 2 ) Term of the off ice: 2016-2018 (resolut ion of the Shareholders ’ meeting as of Apri l 20 t h , 2016) ( 3 ) Term of the off ice: 2012 -2020 (resolut ion of the Shareholders ’ meeting as of Apri l 19 t h , 2012)

TOD’S Group 2017 Half Year Financial Report
06.30.2017
3 TOD’S Group
TOD’S Group
TOD’S S.p.A. Parent Company, owner of TOD’S, HOGAN and FAY brands and l icensee of ROGER VIVIER brand Del.Com. S.r . l. Sub-holding for operation of national subsidiaries and DOS in Italy TOD’S International B.V. Sub-holding for operation of international subsidiaries and DOS in The Netherlands An.Del. Usa Inc. Sub-holding for operation of subsidiaries in the United States Del.Pav S.r. l. Company that operates DOS in Italy F ilangieri 29 S.r. l. Company that operates DOS in Italy Gen.del. SA Company that operates DOS in Switzerland TOD’S Belgique S.p.r. l. Company that operates DOS in Belgium TOD’S Deutschland Gmbh Company that distributes and promotes products in Germany and manages DOS in Germany TOD’S Espana SL Company that manages DOS in Spain TOD’S France Sas Company that operates DOS in France TOD’S Japan KK Company that operates DOS in Japan TOD’S Macao Ltd Company that operates DOS in Macao TOD’S Hong Kong Ltd Company that distributes and promotes products in Far East and South Pacific and manages DOS in Hong Kong. Sub-holding for operation of international subsidiaries in Asia TOD’S Korea Inc. Company that distributes and promotes products in Korea and operates DOS in Korea
TOD’S Retail India Private Ltd Company that operates DOS in India TOD’S (Shanghai) Trading Co. Ltd Company that distributes and promotes products in China and operates DOS in China TOD’S Singapore Pte Ltd Company that operates DOS in Singapore TOD’S UK Ltd Company that operates DOS in Great Britain Webcover Ltd Company that operates DOS in Great Britain Cal.Del. Usa Inc. Company that operates DOS in California (USA) Deva Inc. Company that distributes and promotes products in North America, and manag es DOS in the State of NY (USA) F lor. Del. Usa Inc. Company that operates DOS in Florida (USA) Hono. Del. Inc. Company that operates DOS in Hawaii (USA) I l . Del. Usa Inc. Company that operates DOS in I l l inois (USA) Neva. Del. Inc. Company that operates DOS in Nevada (USA) Or. Del. Usa Inc. Company that operates DOS in California (USA) TOD’S Tex. Del. Usa Inc. Company that operates DOS in Texas (USA) Holpaf B.V. Real estate company that operates one DOS in Japan Alban.Del Sh.p.k. Production company Sandel SA Not operating company Un.Del. Kft Production company Re.Se.Del. S.r . l. Company for services Roger Vivier S.p.A. Company, owner of ROGER VIVIER brand and sub-holding for operation of internationa l subsidiaries and DOS in Italy
Roger Vivier Hong Kong Ltd Company that distributes and promotes products in Far East a nd South Pacific and manages DOS in Hong Kong. Sub-holding for operation of subsidiaries in Asia Roger Vivier Singapore Pte Ltd Company that operates DOS in S ingapore Roger Vivier (Shanghai) Trading Co. Ltd Company that operates DOS in China Roger Vivier UK Ltd Company that operates DOS in Gr eat Britain TOD’S Georgia Inc. Company that operates DOS in Georgia (USA) Roger Vivier France Sas Company that operates DOS in France Roger Vivier Korea Inc. Company that operates DOS in Korea and that distributes and promotes products in Korea Roger Vivier Switzerland S.A. Company that operates DOS in Switzerland Roger Vivier Macau Ltd. Company that operates DOS in Macao Roger Vivier Japan KK Company that operates DOS in Japan TOD’S Danmark APS Company that operates DOS in Denmark TOD’S Austria GMBH Company that operates DOS in Austria TOD’S Washington Inc. Company that operates DOS in Washington (USA) Ala. Del. Inc. Company that operates DOS in Delaware (USA) TOD’S Massachussets Inc. Company that operates DOS in Massachussets (USA) Roger Vivier Paris Sas Company that operates DOS in France Buena Ltd Company for services

TOD’S Group 2017 Half Year Financial Report
06.30.2017
4 Composition of the Group
Group’s organizational chart
TOD’S Group 2017 Half Year Financial Report
06.30.2017
5 Distr ibution network
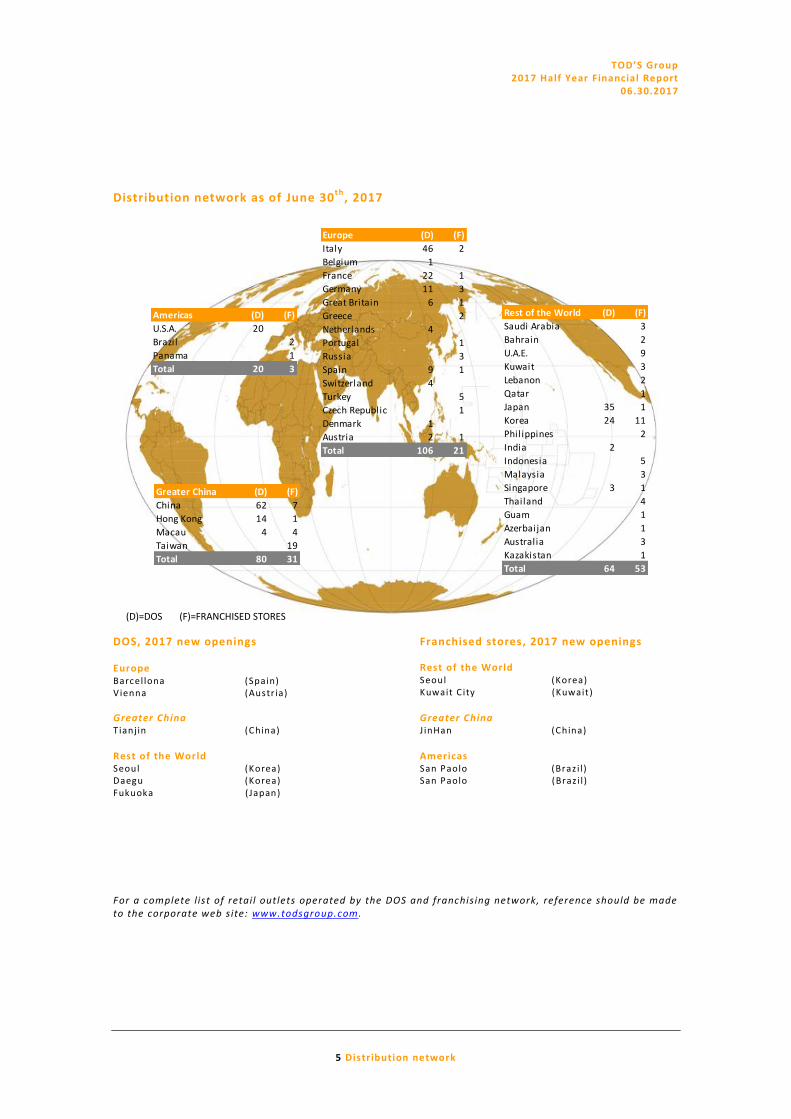
Distribution network as of June 30t h
, 2017
Denmark
Austria
Total
Greater China
China
Hong Kong
Macau
Taiwan
Total
Rest of the World
Saudi Arabia
Bahrain
U.A.E.
Kuwait
(D)=DOS (F)=FRANCHISED STORES
Europe (D) (F)
Italy 46 2
Belgium 1
France 22 1
Germany 11 3
Great Britain 6 1
Greece 2
Netherlands 4
Portugal 1
Russia 3
Spain 9 1
Switzerland 4
Turkey 5
Czech Republic 1
Denmark 1
Austria 2 1
Total 106 21
Greater China (D) (F)
China 62 7
Hong Kong 14 1
Macau 4 4
Taiwan 19
Total 80 31
Rest of the World (D) (F)
Saudi Arabia 3
Bahrain 2
U.A.E. 9
Kuwait 3
Lebanon 2
Qatar 1
Japan 35 1
Korea 24 11
Philippines 2
India 2
Indonesia 5
Malaysia 3
Singapore 3 1
Thailand 4
Guam 1
Azerbaijan 1
Australia 3
Kazakistan 1
Total 64 53
Americas (D) (F)
U.S.A. 20
Brazil 2
Panama 1
Total 20 3
DOS, 2017 new openings Europe Barcellona (Spain) Vienna (Austr ia)
Greater China Tianj in (China)
Rest of the World Seoul (Korea) Daegu (Korea) Fukuoka (Japan)
Franchised stores, 2017 new openings
Rest of the World Seoul (Korea) Kuwait C ity (Kuwait)
Greater China J inHan (China) Americas San Paolo (Braz i l ) San Paolo (Braz i l )
For a complete l ist of retail outlets operated by the DOS and franchising network, reference should be made to the corporate web site: www.todsgroup.com.

TOD’S Group 2017 Half Year Financial Report
06.30.2017
6 Key financial f igures
Key consolidated financial figures
P&L Key figures (euro millions)
H1 17 H1 16 H1 15 H1 14
Sales revenue 483.0 497.6 515.3 477.7
EBITDA 75.7 15.7% 86.3 17.3% 103.0 20.0% 103.0 21.6%
EBIT 52.3 10.8% 62.0 12.5% 77.5 15.0% 81.1 17.0%
Profi t before tax 46.4 9.6% 54.2 10.9% 74.0 14.4% 78.8 16.5%
Profi t for the period 34.4 7.1% 37.1 7.5% 49.9 9.7% 55.9 11.7%
Main Balance Sheet indicators (euro millions)
06.30.17 12.31.16 06.30.16
Net Working Capita l (*) 265.7 279.2 302.6
Intangible and tangible assets 811.1 822.5 837.8
Shareholders ' equity 1,061.0 1,090.5 1,042.1
Net financia l pos i tion (35.5) (35.4) (112.7)
Capita l expenditures 16.4 449.9 433.6
(*) Trade receivable + inventories - trade payable
Financial key indicators (euro millions)
H1 2017 FY 2016 H1 2016
Operating cash flow 83.0 212.6 96.7
Net operating cash flow 79.6 149.7 65.0
Cash flows generated/(used) (25.6) 7.9 50.1
Revenue 2017 - % by Brand
Revenue 2017 - % by Region
Revenue 2017 - % by Product
TOD'S54.9%
HOGAN20.4%
FAY5.4%
ROGER VIVIER19.2% Altro
0.1%
Italy30.1%
Europe24.7%
Americ8.4% Gr.
China22.5%
RoW14.3%
Shoes80.0%
Leather goods14.1%
Appar.5.8%
Other0.1%

TOD’S Group 2017 Half Year Financial Report
06.30.2017
7 Key financial f igures
The Group's employees
06.30.17 12.31.16 06.30.16 06.30.15
Year to date 4,606 4,485 4,531 4,504
Key:
EX = executives
WHC = white collar employees
BLC = blue collar employees
Employees 2017: composition
EX
1%
WHC71%
BLC
28%
Main stock Market indicators (euro)
Share's price
Officia l price at 01.02.2017 62.52
Officia l price at 06.30.2017 54.91
Minimum price (January - June) 54.15
Maximum price (January - June) 73.80
Market Capitalisation
Market capita l i zation at 01.02.2017 2,069,107,339
Market capita l i zation at 06.30.2017 1,817,217,191
Dividend per share
Dividend per share 2016 1.70
Dividend per share 2015 2.00
Ordinary shares
Number of outstanding shares at 06.30.2017 33,093,539
Stock performanceEarning per share (euro)
1.051.14
1.65
1.83
H1 17 H1 16 H1 15 H1 14
45.0
50.0
55.0
60.0
65.0
70.0
75.0
eu
ro
January - June 2017

TOD’S Group 2017 Half Year Financial Report
06.30.2017
8 Highlights of results
Highlights of results
Revenues: revenues totalled 483 mill ion euros
during the period (the average change in foreign
exchange rates had a positive impact of 1.3
mill ion euros). Sales by the DOS network
totalled 310.6 mill ion euros.
EBITDA: gross operating profit amounted to
7 5 . 7 mill ion euros, (86.3 mill ion euros at June
30t h
, 2016) and it was equivalent to 15.7% of
sales. It amounted to 75.5 mill ion euros on a
comparable exchange rate basis .
EBIT: net operating profit totalled 5 2 . 3 mill ion
euros, (62 mill ion euros at June 30t h
, 2016).
When measured on a comparable exchange rate
basis, EBIT totalled 5 2 . 2 mill ion euros.
Net financial position (NFP): the Group had
203.3 mill ion euros in l iquid assets at June 30t h
,
2017. Its net f inancial position was negative for
35.5 mill ion euros at the same date.
Capital expenditures: 16.4 mill ion euros in
capital expenditures were made in H1 2017,
while in H1 2016 they amounted to 433.6
mill ion euros ( including 415 mill ion euros for
the acquisition of ROGER VIVIER brand) .
Distribution network: at June 30
t h, 2017 the
mono brand distribution network comprised 270
DOS and 108 Franchised stores.
Net financial position (euro mn)
Revenue (euro mn)
EBITDA (euro mn)
EBIT (euro mn)
481.7 483.0 497.6515.3
477.7
H1 17 comp.ex. rate basis
H1 17 H1 16 H1 15 H1 14
75.5 75.7
86.3
103.0 103.0
H1 17 comp.ex. rate basis
H1 17 H1 16 H1 15 H1 14
52.2 52.3
62.0
77.581.1
H1 17 comp.ex. rate basis
H1 17 H1 16 H1 15 H1 14
(35.5)
(112.7)
73.1
113.9
06.30.17 06.30.16 06.30.15 06.30.14
Interim Report
Group

TOD’S Group 2017 Half Year Financial Report
06.30.2017
10 Interim report
Group’s activity
TOD’S Group operates in the luxury sector with its brands TOD’S, HOGAN, FAY and ROGER VIVIER.
The Group actively creates, produces and distribu tes shoes, leather goods and accessories, and
apparel. The mission is to offer global customers top -quality products that satisfy their functional
requirements and aspirations.
O r g a n iz a t i on a l s t r u c t u r e o f t h e G r o u p . Group’s organisational configuration rotates around
its parent company TOD’S S.p.A. , which is at the heart of Group’s organisation, managing Group’s
production and distribution, owning TOD’S, HOGAN and FAY brands and holding the license of the
ROGER VIVIER brand, the latter owned by the fully controlled subsidiary ROGER VIVIER S.p.A..
Through a series of sub-holdings, the organisation is rounded out by a series of commercial
companies that are delegated complete responsibility for retail distribution through the DOS
network. Certain of them, st rategically located on international markets, are assigned major roles
in product distribution, marketing and promotion, and public relations processes along the “value
chain”, while simultaneously guaranteeing the uniform image that Group brands must have
worldwide.
Development of production. Group’s production structure is based on complete control of the
production process, from creation of the collections to production and then distribution of the
products. This approach is considered key to assuring the prestige of its brands.
Shoes and leather goods are produced in Group -owned plants, with partial outsourcing to
specialized workshops. All of these outsourcers are located in areas with a strong tradition of
shoe and leather good production. This pref erence reflects the fact that an extremely high
standard of professional quality is required to make these items, with a significantly high level of
added value contributed to the final product by manual work.
The Group relies exclusively on selected speci alized outsourcers, which enables it to exploit their
respective specializations in crafting the individual products sold as part of the apparel l ine.
Distribution structure. The prestige of Group’s brands and the high degree of specialization
necessary to offer the respective products to customers entails distribution through a network of
similarly specialized stores. Accordingly, the Gr oup relies principally on three channels: DOS
(directly operated stores), franchised retail outlets, and a series of sel ected, independent
multibrand stores. E-commerce channel, which was started some years ago, is getting more
relevant.
Group’s strategy is focused on development of the DOS and franchising networks, given that
these channels offer greater control and more faithful transmission of the individual brands. It is

TOD’S Group 2017 Half Year Financial Report
06.30.2017
11 Interim report
also clear that, in particular market situations, distribution through independent multibrand
stores is more efficient. This channel is also of key importance to the Group.
Group’s brands
The TOD’S brand is known for shoes and luxury leather goods, with styles that have bec ome icons
of modern living; TOD’S is known in the luxury goods sector as a symbol of the perfect
combination of tradition, quality and modernity. Each product is hand-crafted with highly-skil led
techniques, intended, after laborious reworking, to become an exclusive, recognisable, modern
and practical object. Some styles, l ike the Driving Shoe and the D bag, are cherished by
celebrit ies and ordinary people worldwide, and have become icons and forerunners of a new
concept of elegance, for both women and men.
Begun in the 80s with shoe collections for women, men a nd children, the HOGAN brand now also
crafts various leather goods items. The HOGAN brand is distinctive for high quality, functionality
and design. Every product stems from a highly skil led design technique and is created using
quality materials with a particular passion for details and a search for perfection. HOGAN
products are the highest expression of a “new luxury” lifestyle. HOGAN is meant for someone
who cherishes the type of luxury associated with product excellence, innovative original design
and consummate practicality. The Traditional and the Interactive shoe styl es endure as
continuing “best sellers”.
FAY is a brand created in the mid-80s with a product range of high quality casual wear. The brand
is known for its quality craftsmanship, for the excellence of its mat erials, a meticulous attention
to craft details and its high functionality without sacrif icing style and quality. FAY products are
wearable everywhere: from the stadium to the office, in urban areas and in the countryside. The
l ine, which has seasonal men’ s, women’s and junior’s collections, focuses on classic evergreen
TOD’S Group 2017 Half Year Financial Report
06.30.2017
12 Interim report
styles, continuously modified and refreshed with innovative and recognisably eye -catching
design.
The Fabergé of shoes, and creator of the first st iletto heel in the 1950's, ROGER VIVIER designed
extravagant and luxuriously decorated shoes that he described as being “sculptures.” The artistic
heritage and excellent traditional roots of the VIVIER fashion house have been revived. Under the
management of Creative Director Bruno Frisoni, VIVI ER’s work and vision endure and n ew
chapters are added to this unique life story every year, which goes beyond expertise in the craft
of shoe making to include handbags, small leather goods, jewellery and sunglasses .
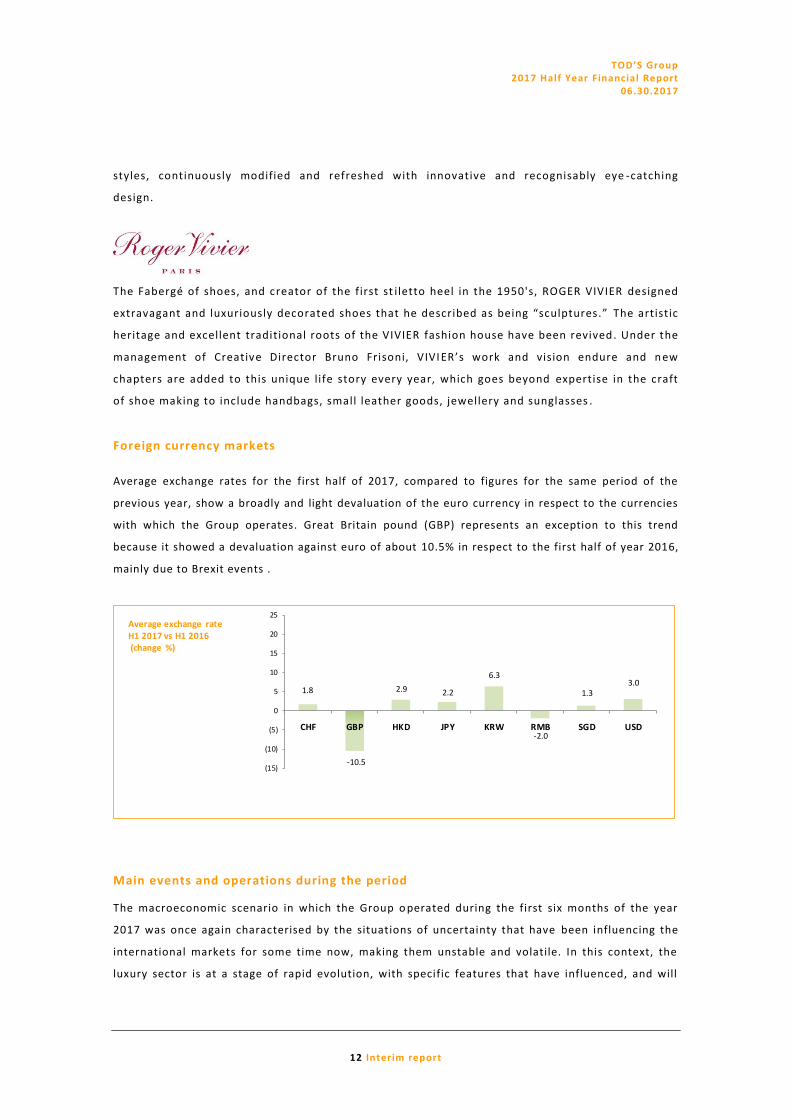
Foreign currency markets
Average exchange rates for the first half of 2017, compared to figures for the same period of the
previous year, show a broadly and light devaluation of the euro currency in respect to the currencies
with which the Group operates. Great Britain pound (GBP) represents an exception to this trend
because it showed a devaluation against euro of about 10.5% in respect to the first half of year 2016,
mainly due to Brexit events .
1.8
-10.5
2.9 2.2
6.3
-2.0
1.33.0
(15)
(10)
(5)
0
5
10
15
20
25
CHF GBP HKD JPY KRW RMB SGD USD
Average exchange rateH1 2017 vs H1 2016(change %)
Main events and operations during the period
The macroeconomic scenario in which the Group o perated during the first six months of the year
2017 was once again characterised by the situations of uncertainty that have been influencing the
international markets for some time now, making them unstable and volatile. In this context, the
luxury sector is at a stage of rapid evolution, with specific features that have influenced, and will
TOD’S Group 2017 Half Year Financial Report
06.30.2017
13 Interim report
continue to influence, consumption in the different geographic areas of the global market. In
greater detail, the overview of the general international context highlig hts juxtaposing trends: on
the one hand, the weakness of consumption in the USA, negatively influenced by both the uncertain
political context and the strong currency, with greater impacts on sales in the department stores
channel and, on the other, the recovery of the market of mainland China, which has returned to
growth after years of decline, mainly thanks to the recovery of local consumption. Chinese
customers, moreover, continue to be a considerable portion of the luxury market linked to tourist
flows. Even consumption on the European market is back to showing positive signs, both thanks to
the partial recovery of domestic consumption and to the increase of said tourist flows, despite the
social tensions and uncertainties linked to the risk of terrorism. The effect of the devaluation of the
British pound post the Brexit referendum has been positive on consumption in the English market.
In this complex scenario, Group performance in the first six months of 201 7 partially suffered from
the mentioned macro-economic factors, recording a decrease of 2.9% in revenues as compared with
the first six months of 2016, with performance on the international markets basically in line with
those general trends.
Another important phenomenon that is characterising the s ector’s reference context regards the
greater polarisation, with respect to the past , of consumption on high end luxury brands. Under this
context, the results recorded by ROGER VIVIER brand, which increasingly confirms its status as a
point of reference for the most exclusive segment of the luxury market, were extremely positive:
brand sales showed a double digits growth in all geographic areas in which it is distributed, with
the only exception of the USA.
As regards business development, the Group conti nues to invest decisively in digital, an important
commercial and communication channel, which is properly revolutionising the business model of all
sector players, significantly extending the situations and ways of direct contact with global
consumers. It is in this context that the Group decided to renew for a further five-year period, the
strategic partnership with the company Italiantouch S.r.l. for the development of the Group’s e -
commerce channel, in order to achieve important objectives through digit al innovation, the
development of markets that are already launched and the implementation of the channel in new
geographic areas.
As regards investments for the period, which were mainly dedicated to the development of the
direct distribution network and renovations of existing stores, please note that during the first half
of the year, works began on developing the new Arquata del Tronto plant, which should be
completed by the end of the year and which will bring jobs to young people in the area, a clear
indication of the Group's commitment to support the Marche town population and the
neighbouring areas, devastated by the August 2016 earthquake.

TOD’S Group 2017 Half Year Financial Report
06.30.2017
14 Interim report
Group’s results in HY 2017
Consolidated sales were 483 million euros in the first half of 2017, down 2.9% from H1 2016. The
effect deriving from variation in exchange rates was not so significant: by using H1 2016 average
exchange rates, sales would have been 481.7 million euros, -3.2% down compared with H1 2016
when sales were 497.6 million euros.
EBITDA and EBIT amounted to 75.7 and 52.3 mill ion euros respectively, and represent 15.7% and
10.8% of consolidated revenues. Substantially not significant exchange rates effects: by using H1
2016 average exchange rates, they would have been 75.5 and 52.2 million euros respectively,
confirming 15.7% and 10.8% of consolidated revenues.
euro 000's
FY 16 Main economic indicators H1 2017 H1 2016 Change %
1,004,021 Sales revenue 483,043 497,628 (14,584) (2.9)
180,908 EBITDA 75,686 86,311 (10,625) (12.3)
(52,547) Amortiz., deprec. and write-downs (23,369) (24,340) 972 (4.0)
128,361 EBIT 52,317 61,970 (9,653) (15.6)
114,967 Profit before taxes 46,436 54,238 (7,802) (14.4)
85,768 Profit for the period 34,450 37,130 (2,681) (7.2)
Foreign exchange impact on revenues (1,353)
Adjusted Sales revenues 481,690 497,628 (15,937) (3.2)
Foreign exchange impact on operating costs 1,146
Adjusted EBITDA 75,479 86,311 (10,832) (12.6)
Foreign exchange impact on deprec.&amort. 77
Adjusted EBIT 52,187 61,970 (9,783) (15.8)
EBITDA % 15.7 17.3
EBIT % 10.8 12.5
Adjusted EBITDA % 15.7 17.3
Adjusted EBIT % 10.8 12.5
Tax Rate % 25.8 31.5
In order to represent fully comparable figures of the first half 2017 with the same period of
previous year, EBITDA and EBIT at June 30th
, 2016, net of non-recurring transactions amounted to
0.8 mill ion euros, were 85.5 and 61.2 mill ion euros respectively for a ratio on sales revenue of
17.2% and 12.3%. During the first half 2017 the Group did not carry out any non -recurring
transactions.

TOD’S Group 2017 Half Year Financial Report
06.30.2017
15 Interim report
euro 000's
06.30.16 Main Balance Sheet indicators 06.30.17 12.31.16 Change
302,564 Net Working Capital (*) 265,732 279,230 (13,498)
837,780 Non-current assets 811,096 822,523 (11,427)
14,441 Other current assets/liabilities 19,680 24,109 (4,429)
1,154,786 Invested capital 1,096,508 1,125,862 (29,354)
(112,674) Net financial position (35,538) (35,381) (157)
1,042,112 Shareholders' equity 1,060,971 1,090,481 (29,510)
433,619 Capital expenditures 16,402 449,908 (433,506)
65,044 Net operating cash flow 79,640 149,684 (70,044)
50,114 Cash flows generated/(used) (25,555) 7,929 (33,484)
(*) Trade receivable + inventories - trade payable
Revenue Consolidated sales were 483 mill ion euros in the first half of 2017, down 2.9% from H1
2016. In the second quarter, revenues were 244.5 mill ion euros, down 1.4% from Q2 2016. At
constant exchange rates, meaning by using the average exchange rates of H1 2016, including the
related effects of hedging contracts, sales would have been 481.7 mill ion euros, down 3.2% from
the same period of last year.
TOD’S sales totalled 265.3 mill ion euros in the first half of 2017; the 6.1% decrease, compared to
the first half of 2016, is mainly due to the performance of shoes, which is the category with the
highest exposure to the wholesale channel. The Spring Summer collection of handbags achieved
good results. HOGAN
revenues were 98.7
mill ion euros; the
6.9% decrease,
compared to the
first half of 2016, is
mainly due to the
weakness of the
Italian market.
Revenues of the FAY
brand were 25.9
mill ion euros, up
4.1% from the first
(euro mn) H1 2017 % H1 2016 % % current
exch. rates
% constant
exch. rates
TOD'S 265.3 54.9 282.5 56.8 (6.1) (6.5)
HOGAN 98.7 20.4 106.1 21.3 (6.9) (6.8)
FAY 25.9 5.4 24.9 5.0 4.1 4.1
ROGER VIVIER 92.6 19.2 83.4 16.8 11.0 10.6
Other 0.5 0.1 0.7 0.1 n.s. n.s.
Total 483.0 100.0 497.6 100.0 (2.9) (3.2)
TOD'S54.9%
HOGAN20.4%
FAY5.4%
ROGER VIVIER19.2%
Other0.1%
TOD'S TOD'S
HOGANHOGAN
FAYFAY
RVRV
0
50
100
150
200
250
300
350
400
450
500
550
H1 2017 H1 2016
half of 2016; good results in all the regions where the brand is distributed. Finally , ROGER VIVIER
confirmed the double-digit growth rate of the first quarter. Its sales totalled 92.6 mill ion euros;

TOD’S Group
2017 Half Year Financial Report 06.30.2017
16 Interim report
strong results in all markets, excepted for the US one, which continued to be penalized by the
sharp drop of traffic in the stores.
Revenues from shoes were 386.3 mill ion euros. The performance of this category, which has the
highest exposure to the wholesale channel, has been affected by the prudent attitude taken
toward this channel, in order to preserve the brands’ prestige and the outstanding quality of
credit receivables.
Sales of leather
goods and
accessories totalled
68.1 mill ion euros,
with a small
decrease compared
to the first half of
2016, partially due
to a different timing
of deliveries. Finally,
sales of apparel
(euro mn) H1 2017 % H1 2016 % % current
exch. rates
% constant
exch. rates
Shoes 386.3 80.0 400.3 80.5 (3.5) (3.7)
Leather goods 68.1 14.1 69.3 13.9 (1.7) (2.6)
Apparel 28.1 5.8 27.3 5.5 2.8 2.7
Other 0.5 0.1 0.7 0.1 n.s. n.s.
Total 483.0 100.0 497.6 100.0 (2.9) (3.2)
Shoes80.0%
Leather goods14.1%
Appar.5.8%
Other0.1%
Shoes Shoes
Leather goods
Leather goods
ApparelApparel
0
50
100
150
200
250
300
350
400
450
500
550
H1 2017 H1 2016
were 28.1 mill ion euros, up 2.8% from the first half of 2016. The performance broadly reflects
the FAY ’s one.
In the first half of 2017, domestic sales were 145.4 mill ion euros, slightly lower than in the same
period of 2016. The growth registered in the second quarter is mainly due to the different timing
of deliveries; the Italian market confirms its weakness, mainly in secondary cities.
In the rest of
Europe, the Group’s
revenues totalled
119.3 mill ion euros,
broadly in l ine with
the first half of
2016. The retail
network posted
positive results; on
the contrary, the
wholesale
performance was
(euro mn) H1 2017 % H1 2016 % % current
exch. rates
% constant
exch. rates
Italy 145.4 30.1 148.8 29.9 (2.2) (2.2)
Europe 119.3 24.7 120.1 24.1 (0.6) 1.2
Americas 40.5 8.4 48.7 9.8 (16.9) (19.7)
Greater China 108.5 22.5 107.0 21.5 1.4 1.3
Rest of World 69.3 14.3 73.0 14.7 (5.1) (8.1)
Total 483.0 100.0 497.6 100.0 (2.9) (3.2)
Italy30.1%
Europe24.7%
Americas8.4%
Gr. China22.5%
RoW14.3%
Italy Italy
Europe Europe
Americas Americas
Greater China
Greater China
Rest of World
Rest of World
0
50
100
150
200
250
300
350
400
450
500
550
H1 2017 H1 2016
TOD’S Group 2017 Half Year Financial Report
06.30.2017
17 Interim report
affected by the already commented cautious approach taken by the Group toward some
independent clients.
In the Americas sales amounted to 40.5 mill ion euros, down 16.9% from the first half of 2016.
The trend commented in the first quarter was confirmed; the market remains weak: the retail is
stil l suffering from lower traffic in the stores and the wholesale is affected by the difficulties
faced by major department stores.
The Group’s revenues in Greater Chin a totalled 108.5 mill ion euros, up 1.4% from the first half of
2016. Mainland China registered positive results; Hong Kong is showing timid signs of
improvement.
Finally, in the area “Rest of the World” the Group’s sales were 69.3 mill ion euros, down 5.1%
from the first half of 2016. Japan posted positive results, while the sales performance in Korea
was negatively affected by international political tensions.
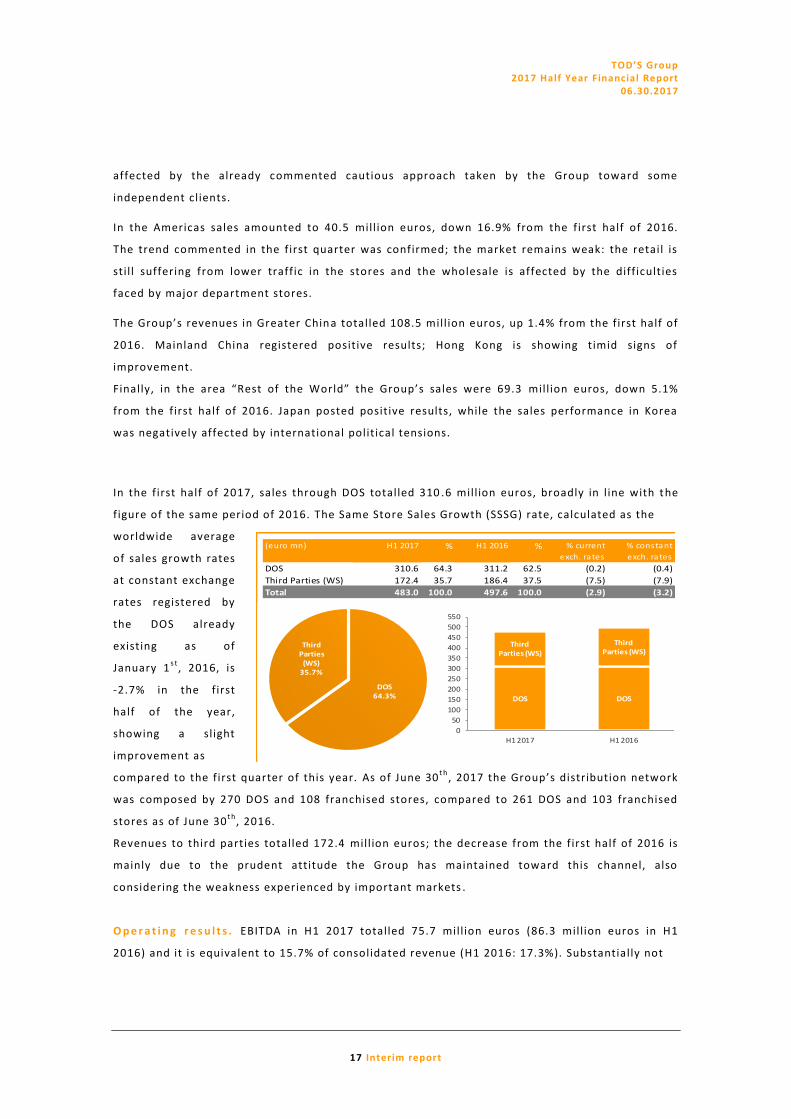
In the first half of 2017, sales through DOS totalled 310 .6 mill ion euros, broadly in l ine with the
figure of the same period of 2016. The Same Store Sales Growth (SSSG) rate, calculated as the
worldwide average
of sales growth rates
at constant exchange
rates registered by
the DOS already
existing as of
January 1s t
, 2016, is
-2.7% in the first
half of the year,
showing a slight
improvement as
(euro mn) H1 2017 % H1 2016 % % current
exch. rates
% constant
exch. rates
DOS 310.6 64.3 311.2 62.5 (0.2) (0.4)
Third Parties (WS) 172.4 35.7 186.4 37.5 (7.5) (7.9)
Total 483.0 100.0 497.6 100.0 (2.9) (3.2)
DOS64.3%
Third Parties
(WS)35.7%
DOS DOS
Third Parties (WS)
Third Parties (WS)
0
50
100
150
200
250
300
350
400
450
500
550
H1 2017 H1 2016
compared to the first quarter of this year. As of June 30t h
, 2017 the Group’s distribution network
was composed by 270 DOS and 108 franchised stores, compared to 261 DOS and 103 franchised
stores as of June 30t h
, 2016.
Revenues to third parties totalled 172.4 mill ion euros; the decrease from the first half of 2016 is
mainly due to the prudent attitude the Group has maintained toward this channel, also
considering the weakness experienced by important markets .
O p e r a t i n g r e s u l t s . EBITDA in H1 2017 totalled 75.7 mill ion euros (86.3 mill ion euros in H1
2016) and it is equivalent to 15.7% of consolidated revenue (H1 2016: 17.3%). Substantially not

TOD’S Group 2017 Half Year Financial Report
06.30.2017
18 Interim report
significant the effect of exchange rates:
EBITDA at constant exchange rate amounted to
75.5 mill ion euros, representing 15.7% of
consolidated revenues. Strengthened the
profitability at a gross margin level, thus
confirming the excellent position of the Group
brands in the highest end of the luxury
markets and the abi lity of generating revenue
in such product segments and geographical
areas where margins are higher. This result,
combined with the positive effects of the plan
to rationalise structural costs and improve
EBITDA (euro mn)
75.5 75.7
86.3
H1 17 comp. ex.rate basis
H1 17 H1 16
processes, has successfully l imited the impacts on the EBITDA of the physiological increase of
operating costs in support of the Group’s growth strategies. Lease and rental expenses ( leases for
locations and royalties for use of l icensed brands) totalled 60.4 mill ion euros at June 30t h
, 2017
(59.8 mill ion euros at June 30t h
, 2016) with a ratio on sales revenue changing from 12% in H1 201 6
to 12.5% in H1 2017 (the increase in the number of DOS recorded in the period from July 201 6 to
June 2017 was equal to 9). The personnel costs increased and totalled 96.9 mill ion euros in the
first half of year 2017, compared with 94.9 mill ion euros in the first six months of the previous
year. The change is mainly connected with the increase in headcount , mainly due to the expansion
of the direct distribution network and the strengthening of corporate operating functions. At June
30t h
, 2017 Group employees were 4 ,606, 121 and 75 more in respect to December 31s t
, 2016 and
June 30t h
, 2016 respectively. At June 30t h
, 2017, employee costs equalled 20.1% of Group revenue,
as compared with 19.1% in the first six months of 2016.
The costs for depreciation, amortization and
impairment amounted to 22.5 in H1 2017 (23.4
mill ion euros in H1 2016); the ratio on revenue
is 4.7% (unchanged in respect to the first half of
2016 when it was 4.7%). Net of additional
operating provisions of 0.8 mill ion euros, EBIT in
H1 2017 totalled 52.3 mil l ion euros (62 mill ion
euros at June 30t h
, 2016), representing 10.8% of
consolidated revenues (12.5% at June 30t h
,
2016). The balance of f inancial income and
expenses, which posted a negative value of 5.3
mill ion euros, was affected by the performance
EBIT (euro mn)
52.2 52.3
62.0
H1 17 comp. ex.rate basis
H1 17 H1 16

TOD’S Group
2017 Half Year Financial Report 06.30.2017
19 Interim report
of cross rates of some currencies with which the Group operates. The balance include also
financial interests on long term loans for 0.9 mill ion euro s. At June 30t h
, 2017, consolidated net
profit was equal to 34.4 mill ion euros, against 37.1 mill ion euros at June 30t h
of the previous
year. At June 30t h
2017 net profit represents the 7.1% of sales revenues (7.5% for the first six
months of 2016). Income taxes for the period (including the effects of deferred taxes) totall ed
12 mill ion euros, for a tax rate of 25.8%, lower than in the first half 2016 when it was 31.5%,
mainly due to the reduction of the tax rate of the parent company, further to the “Pate nt box”
contribution accrued for the period .
Capital expenditures. Capital expenditure in H1 2017 totalled 16.4 mill ion euros, while they were
18.6 mill ion euros at June 30t h
, 2016, net of the price paid for the ROGER VIVIER brand
acquisition for 415 mi ll ion euros.
(*) The data do not include the investment related to the acquisition of ROGER VIVIER brand
16.4 18.6
34.9
47.9
64.5
HY 2017 HY 2016 FY 2016 FY 2015 FY 2014
Property Plant and Equipment & Intangible assetsCapital Expenditures(euro mln)
(*)
(*)
Capital expenditures during the period for the DOS
network totalled about 9.8 mill ion euro (10.2
mill ion euros in the first half 201 6), primarily used
for both new DOS openings , among which the
most relevant is the first boutique TOD’S in
Vienna, and for renovation activities of the
existing stores. The remaining investment quota
in the period regarded not only the normal
processes of modernising the structures and
industrial equipment (mainly lasts and moulds)
and the further development of the company
management software, but also the beginning of
the works for the construction of the new plant in
Arquata del Tronto.
INVESTMENTS BY ALLOCATION
DOS60%
Prod.11%
Other29%
DOS60%
Prod.11%
Other29%

TOD’S Group 2017 Half Year Financial Report
06.30.2017
20 Interim report
Net financial position (NFP). At June 30t h
, 2017, net f inancial position was negative for 35.5
mill ion euros (substantially unchanged in respect to December 31s t
, 2016 when it was negative
for 35.4 mill ion euros, while at June 30t h
, 2016 it was negative for 112.7 mill ion euros), including
liquid assets (cash and bank deposits) for 203.3 mill ion euros, and liabilities for 238.9 mill ion
euros, of which 172.4 mill ion euros for long-term exposures.
06.30.16 06.30.17 12.31.16 Change
Current financial assets
271,373 Cash and cash equivalents 203,343 227,706 (24,364)
271,373 Cash 203,343 227,706 (24,364)
Current financial liabilities
(17,195) Current account overdrafts (16,905) (15,714) (1,191)
(55,968) Current share of medium-long term financing (49,539) (50,234) 695
(73,163) Current financial liabilities (66,444) (65,948) (496)
198,210 Current net financial position 136,898 161,758 (24,860)
Non-current financial liabilities
(310,884) Medium-long term financing (172,436) (197,139) 24,703
(310,884) Non-current financial liabilities (172,436) (197,139) 24,703
(112,674) Net financial position (35,538) (35,381) (157)
Net financial position (euro 000's)
Gross of dividends paid during the half year, net f inancial position would have been positive for
20.7 mill ion euros (+56.1 mill ion euros in respect to the beginning of the year).
euro 000's
Statement of cash flows H1 2017 H1 2016
Net Cash and cash equivalents at the beginning of the period 211,993 204,063
Cash flows from operating activities 83,034 96,657
Interests and taxes collected/(paid) (3,394) (31,613)
Net cash flows from operating activities 79,640 65,044
Cash flow generated (used) in investing activities (16,196) (450,716)
Cash flow generated (used) in financing activities (81,165) 435,909
Translation differences (7,834) (123)
Net Cash and cash equivalents at the end of the period 186,438 254,178
The operating activities for the period generated cash for 83 mill ion euros (71.7 mill ion euros in
H1 2016, net of non-recurring transactions), thanks also to a careful management of the
operating working capital . Net of payments for corporate taxes and interests , net operating cash
flow amounted to 79.6 mill ion euros (65 mill ion euros in H1 2016). Cash flows from financing
activities of the first half 2017, mainly include dividend distribution occurred during the period
and the refund of long term loans.

TOD’S Group 2017 Half Year Financial Report
06.30.2017
21 Interim report
Items or transactions resulting from unusual and/or exceptional transactions
There were no items or transactions resulting from unusual and/or exceptional transactions
during the first half.
Significant events occurred after the reporting period
No significant event occurred after the end of the period.
Business Outlook
The results of the first half are in l ine with expectations and they confirm the appreciation of the
market for the Group ’s product, which are characterized by the high cr aftsmanship quality,
intrinsic in the brands’ DNA, and which express the Italian lifestyle in the world . Concerning the
business outlook, through the development of business strategies, as well as the continuation of
cost efficiency measures, it is reasona ble to expect an improvement of the Group’s results,
starting from the second half, in terms of both revenues and margins.
Milan, August 3rd
, 2017
The Chairman of the Board of Directors
Diego Della Valle

2017 Half Year Condensed Financial Statements
Group

TOD’S Group 2017 Half Year Financial Report
06.30.2017
2 3 Financial Statements
Consolidated Income Statement
euro 000's
H1 17 H1 16 FY 16
Revenue
Sales revenue 483,043 497,628 1,004,021
Other income (1) 4,998 30,030 36,026
Total revenue and income 488,041 527,658 1,040,047
Operating Costs
Change in inventories of work in progress and finished goods (2) (5,195) (23,071) (55,346)
Cost of raw materials, supplies and materials for consumption (2) (118,491) (129,274) (238,625)
Costs for services (114,501) (117,191) (228,894)
Costs of use of third party assets (60,432) (59,827) (117,370)
Personnel costs (96,913) (94,906) (186,208)
Other operating charges (16,823) (17,080) (32,698)
Total operating costs (412,355) (441,347) (859,140)
EBITDA 75,686 86,311 180,908
Amortisation, depreciation and write-downs
Amortisation of intangible assets (4,318) (4,491) (9,209)
Depreciation of tangible assets (18,213) (18,934) (36,956)
Other adjustment (4,431)
Total amortisation, depreciation and write-downs (22,531) (23,425) (50,596)
Provisions (838) (916) (1,951)
EBIT 52,317 61,970 128,361
Financial income and expenses
Financial income 10,513 10,700 20,184
Financial expenses (15,770) (18,432) (33,579)
Total financial income (expenses) (5,257) (7,732) (13,395)
Income (losses) from equity investments (625)
Profit before taxes 46,436 54,238 114,967
Income taxes (3) (11,986) (17,108) (29,198)
Profit/(loss) for the period 34,450 37,130 85,768
Non-controlling interests 262 305 524
Profit/(loss) of the Group 34,711 37,435 86,292
EPS in (euro) 1.05 1.14 2.62
EPS diluted in (euro) 1.05 1.14 2.62
( 1 ) O f w h i c h n o n - r e c u r r i n g f o r 2 5 m i l l i o n e u r o s i n t h e f i r s t h a l f 2 0 1 6 a n d i n t h e y e a r 2 0 1 6 .
( 2 ) O f w h i c h n o n - r e c u r r i n g f o r - 2 4 . 2 m i l l i o n e u r o s i n t h e f i r s t h a l f 2 0 1 6 a n d i n t h e y e a r 2 0 1 6 .
( 3 ) O f w h i c h n o n - r e c u r r i n g f o r - 0 . 3 m i l l i o n e u r o s i n t h e f i r s t h a l f 2 0 1 6 a n d i n t h e y e a r 2 0 1 6 .
TOD’S Group 2017 Half Year Financial Report
06.30.2017
2 4 Financial Statements
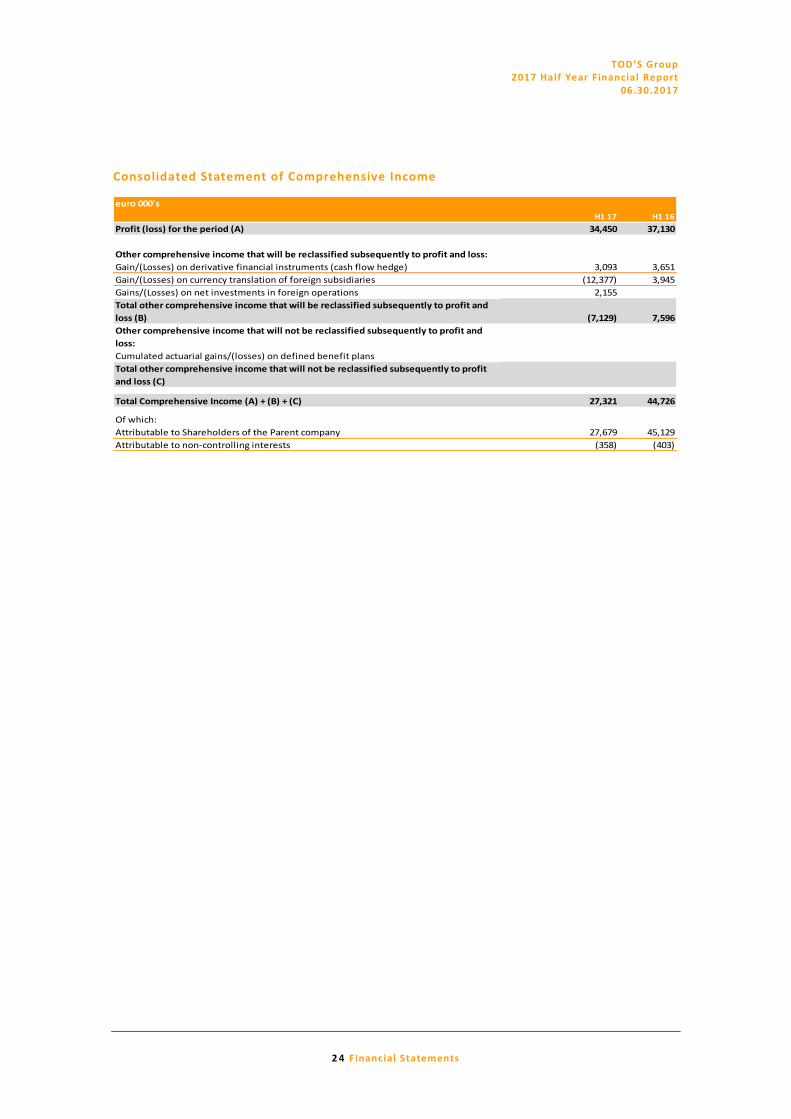
Consolidated Statement of Comprehensive Income
euro 000's
H1 17 H1 16
Profit (loss) for the period (A) 34,450 37,130
Other comprehensive income that will be reclassified subsequently to profit and loss:
Gain/(Losses) on derivative financial instruments (cash flow hedge) 3,093 3,651
Gain/(Losses) on currency translation of foreign subsidiaries (12,377) 3,945
Gains/(Losses) on net investments in foreign operations 2,155
Total other comprehensive income that will be reclassified subsequently to profit and
loss (B) (7,129) 7,596
Other comprehensive income that will not be reclassified subsequently to profit and
loss:
Cumulated actuarial gains/(losses) on defined benefit plans
Total other comprehensive income that will not be reclassified subsequently to profit
and loss (C)
Total Comprehensive Income (A) + (B) + (C) 27,321 44,726
Of which:
Attributable to Shareholders of the Parent company 27,679 45,129
Attributable to non-controlling interests (358) (403)

TOD’S Group 2017 Half Year Financial Report
06.30.2017
2 5 Financial Statements
Consolidated Statement of Financial Position
euro 000's
Notes 06.30.17 12.31.16 06.30.16
Non current assets
Intangible fixed assets
Assets with indefinite useful l ife (1) 9 565,881 565,881 565,352
Key money 9 16,597 15,847 16,872
Other intangible assets 9 22,432 23,907 26,568
Total Intangible fixed assets 604,910 605,635 608,793
Tangible fixed assets
Buildings and land 9 111,572 114,467 119,349
Plant and machinery 9 12,241 12,452 12,986
Equipment 9 11,060 12,180 12,937
Leasehold improvement 9 36,882 40,454 43,413
Others 9 34,431 37,336 40,303
Total Tangible fixed assets 206,186 216,888 228,988
Other assets
Investment properties 23 25 27
Equity investments 20 20
Deferred tax assets 60,275 58,885 58,623
Others 20,037 21,367 21,014
Total other assets 80,335 80,298 79,683
Total non current assets 891,431 902,821 917,463
Current assets
Inventories 299,172 291,892 330,148
Trade receivables 104,685 118,142 106,554
Tax receivables 22,553 28,646 15,258
Derivative financial instruments 10 5,635 2,857 5,747
Others 39,651 36,635 33,797
Cash and cash equivalents 16 203,343 227,706 271,373
Total current assets 675,040 705,879 762,877
Total assets 1,566,471 1,608,700 1,680,340
To be continued
( 1 ) T h i s f i g u r e i n c l u d e s , f o r 4 1 5 m i l l i o n e u r o s , t h e a m o u n t o f R O G E R V I V I E R b r a n d a c q u i r e d
t h r o u g h a r e l a t e d p a r t y t r a n s a c t i o n o c c u r r e d o n J a n u a r y 2 0 1 6 .

TOD’S Group 2017 Half Year Financial Report
06.30.2017
2 6 Financial Statements
euro 000's
(continuing) Notes 06.30.17 12.31.16 06.30.16
Equity
Share capital 11 66,187 66,187 66,187
Capital reserves 416,588 416,588 416,588
Hedging and translation reserves 16,318 25,505 20,324
Retained earnings 524,907 492,640 498,056
Profit/(loss) attributable to the Group 34,711 86,292 37,435
Total Equity attributable to the Group 1,058,711 1,087,212 1,038,589
Non-controlling interest
Share capital and reserves 2,521 3,793 3,827
Profit/(loss) attributable to non-controlling interests (262) (524) (305)
Total Equity attributable to non-controlling interests 2,260 3,269 3,522
Total Equity 1,060,971 1,090,481 1,042,112
Non-current liabilities
Provisions for risks 14 5,879 6,059 5,745
Deferred tax liabilities 39,035 32,739 24,353
Employee benefits 15 15,040 14,787 12,664
Derivative financial instruments 10 1,767 2,687 6,255
Bank borrowings 16 172,436 197,139 310,884
Others 15,075 15,910 17,124
Total non-current liabilities 249,232 269,321 377,025
Current liabilities
Trade payables 138,126 130,804 134,138
Tax payables 5,529 8,241 5,923
Derivative financial instruments 10 3,677 8,046 6,049
Others 42,492 35,859 41,930
Banks 16 66,444 65,948 73,163
Total current liabilities 256,268 248,898 261,203
Total Equity and liabilities 1,566,471 1,608,700 1,680,340

TOD’S Group 2017 Half Year Financial Report
06.30.2017
2 7 Financial Statements
Consolidated Statement of Cash Flows
euro 000's
Notes Jan. - Jun. 17 Jan. - Jun. 16
Profit/(Loss) for the period 34,450 37,130
Amortizat., deprec., revaluat., and write-downs 23,146 50,573
Other non monetary expenses/(income) (2,682) 1,392
Income taxes for the period 11,986 17,108
Changes in operating assets and liabilities:
Trade receivables 12,959 4,861
Inventories (7,398) (5,885)
Tax receivables and tax payables (1,190) (298)
Trade payables 7,322 (11,721)
Other assets and liabilities 4,188 3,147
Change in reserve for employee 253 349
Cash flows from operating activities 83,034 96,657
Interests (paid)/collected (886) (959)
Income taxes (paid)/refunded (2,508) (30,654)
Net cash flows from operating activities (A) 79,640 65,044
Net investments in intangible and tangible assets 9 (16,216) (18,419)
Acquisition of Roger Vivier brand 9 (415,000)
Acquisition of Roger Vivier Paris Sas legal entity net of cash and cash equivalents 6 (17,297)
Other changes in fixed assets 20
Cash flows generated (used) in investing activities (B) (16,196) (450,716)
Dividends paid 13 (56,259) (66,187)
Capital increase 11 207,500
Others change in Equity (247)
Repayments of financial l iabilities 16 (24,906) (5,157)
Proceeds from financial l iabilities 16 300,000
Cash flows generated (used) in financing (C) (81,165) 435,909
Translation differences (D) (7,834) (123)
Cash flows from continuing operations (E)=(A)+(B)+(C)+(D) (25,555) 50,114
Cash flow from assets held for sale (F)
Cash flows generated (used) (G)=(E)+(F) (25,555) 50,114
Net cash and cash equivalents at the beginning of the period 211,993 204,063
Net cash and cash equivalents at the end of the period 186,438 254,178
Change in net cash and cash equivalents (25,555) 50,114
Adjustments to reconcile net profit (loss) to net cash provided by
(used in) operating activities:
TOD’S Group 2017 Half Year Financial Report
06.30.2017
2 8 Financial Statements
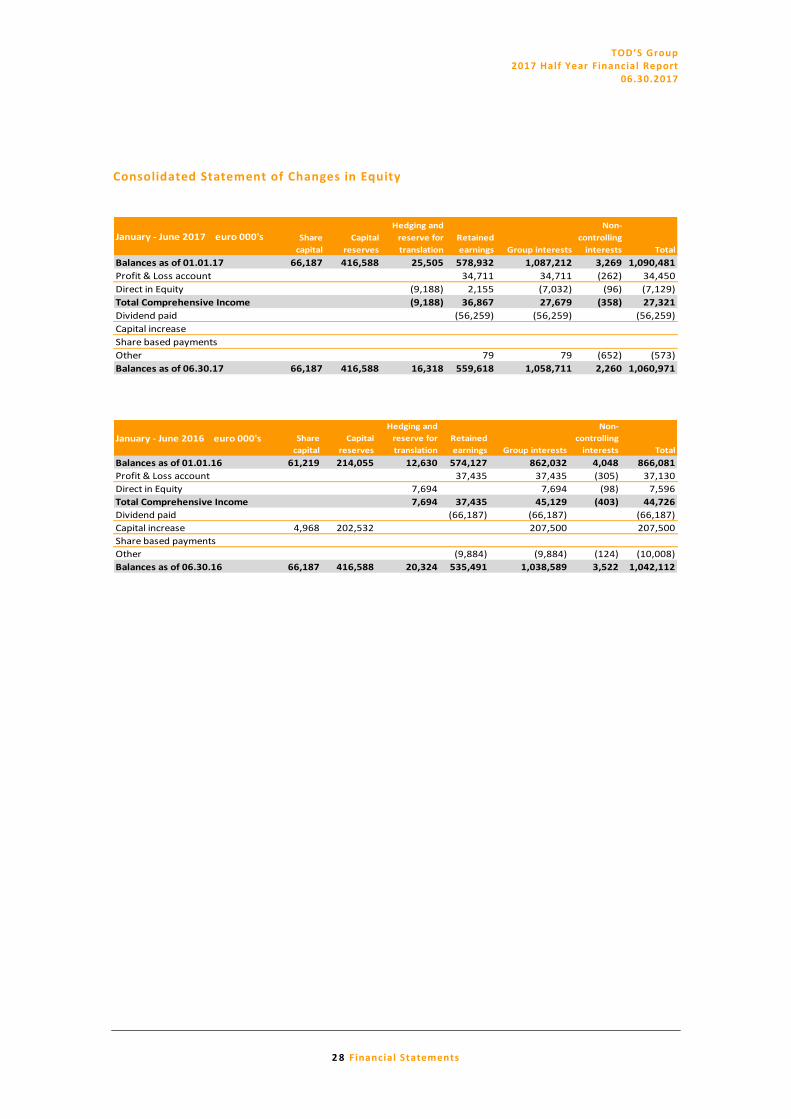
Consolidated Statement of Changes in Equity
January - June 2017 euro 000's Share
capital
Capital
reserves
Hedging and
reserve for
translation
Retained
earnings Group interests
Non-
controlling
interests Total
Balances as of 01.01.17 66,187 416,588 25,505 578,932 1,087,212 3,269 1,090,481
Profit & Loss account 34,711 34,711 (262) 34,450
Direct in Equity (9,188) 2,155 (7,032) (96) (7,129)
Total Comprehensive Income (9,188) 36,867 27,679 (358) 27,321
Dividend paid (56,259) (56,259) (56,259)
Capital increase
Share based payments
Other 79 79 (652) (573)
Balances as of 06.30.17 66,187 416,588 16,318 559,618 1,058,711 2,260 1,060,971
January - June 2016 euro 000's Share
capital
Capital
reserves
Hedging and
reserve for
translation
Retained
earnings Group interests
Non-
controlling
interests Total
Balances as of 01.01.16 61,219 214,055 12,630 574,127 862,032 4,048 866,081
Profit & Loss account 37,435 37,435 (305) 37,130
Direct in Equity 7,694 7,694 (98) 7,596
Total Comprehensive Income 7,694 37,435 45,129 (403) 44,726
Dividend paid (66,187) (66,187) (66,187)
Capital increase 4,968 202,532 207,500 207,500
Share based payments
Other (9,884) (9,884) (124) (10,008)
Balances as of 06.30.16 66,187 416,588 20,324 535,491 1,038,589 3,522 1,042,112

2017 Half Year Condensed Financial Statements Supplementary notes
Group

TOD’S Group 2017 Half Year Financial Report
06.30.2017
30 Supplementary notes
1. General notes
TOD’S Group operates in the luxury sector under its proprietary brands (TOD’S, HOGAN , FAY and
ROGER VIVIER). It actively creates, produces and distributes shoes, leather goods and
accessories, and apparel. The mission is to offer global customers top -quality products that
satisfy their functional requirements and aspirations.
The parent company TOD’S S.p.A., with legal residence in Sant’Elpidio a Mare (Fermo) in via
Filippo Della Valle 1, is l i sted in the Mercato telematico Azionario (MTA market) of Borsa Italiana
S.p.A..
At June 30t h
, 2017 the 50.291% of share capital of TOD’S S.p.A. is owned by DI.VI. FINANZIARIA DI
DIEGO DELLA VALLE & C. S.r. l. .
The half-year condensed financial statements a t June 30t h
, 2017 was approved by the Board of
Directors of TOD’S S.p.A. on August 3rd
, 2017. It was audited (limited review) by the independent
auditor PricewaterhouseCoopers S.p.A..
2. Basis of preparation
The half-year Financial Report, which includes th e half-year condensed financial statements of
TOD’S Group at June 30t h
, 2017, has been prepared in accordance with Article 154 ter (2, 3 and 4)
of the Consolidated Law on Financial Intermediation (“TUF”), introduced by Legislative Decree
195/2007 in implementation of Directive 2004/109/EC (the “Transparency” directive) as amended
by Legislative Decree 25/2016 in implementation of Directive 2013/50/UE . The half -year
condensed financial statements complies with IAS 34 – Interim Financial Reporting, adopted
according to the procedure envisaged in Article 6 of EC Regulation no. 1606/2002. Consequently,
it does not include all the information required for the annual report and must be read together
with the annual report prepared for the financial year at Decembe r 31s t
, 2016.
The half-year condensed financial statements include the half -year condensed financial
statements of TOD’S S.p.A. and its Italian and foreign subsidiaries, together identified as TOD’S
Group, drafted with the reference date of June 30t h
, 2017 (January 1s t
– June 30t h
).
The half-year condensed financial statements (profit and loss account, comprehensive income,
Consolidated Statement of Financial position, Consolidated Statement of Cash Flows, and
Consolidated statement of changes in equity) were drafted in the long form and are the same as
those used for the consolidated financial statements at December 31s t
, 2016
As envisaged in IAS 34, the notes to the financial statements were drafted in summary form and
refer only to the components of t he profit and loss account, Statement of Financial position, and
Statement of Cash Flows, whose composition or change in amount or nature was significant.
Thus, they il lustrate additional information for accurate comprehension of Group’s f inancial
position at June 30t h
, 2017.

TOD’S Group 2017 Half Year Financial Report
06.30.2017
31 Supplementary notes
Following art. 3 of Consob resolution n.18079 dated January 20t h
, 2012 we inform you that the
Company adopt the waiver provided by art. 70 (8) and art. 71 (1 -bis) of Consob regulation n.
11971/99 (and following modifications and integrations) in regard to the documents made
available to the public at the registered office and concerning mergers, demergers, capital
increases, acquisitions and disposals . If it proves necessary or appropriate to amend items in the
half-year Financial Report as a result of the application of a new accounting standard, a change in
the nature of a transaction or an accounts review, in order to provide reliable and more relevant
information for the users of the half-year Financial Report , the comparative data will be
reclassif ied accordingly in order to improve the comparability of the information between one
financial year and another. In this case, if the changes are significant, they will be suitably
disclosed in the notes to the half-year Financial Report.
3. Accounting standards
The accounting standards and principles of consolidation applied to the preparation of these
Condensed Consolidated Half -year Financial Statements are consistent with those applied to the
preparation of the Consolidated Financial State ments at 31 December 2016, except for the new
standards or interpretations endorsed by the European Union and applicable from 1 January
2017.
Accounting standards, amendments and interpretations endorsed by the European Union, which
are applicable from January 1s t
, 2017 and which were first adopted in the TOD’S Group’s
Condensed Consolidated Half -Year Financial Statements at June 30th
, 2017.
“Annual improvements to IFRS Standards: IFRS 12: “Disclosure of Interests in Other Entities”,
which were issued by the IASB on December 18t h
, 2014. This amendment provides for an
investment entity, which prepares the financial statements in which all of its subsidiaries are
measured at fair value through profit or loss, to provide the disclosure required for investment
entities according to IFRS 12. The application of this standard had no impact on the Group.
Accounting standards, amendments and interpretations endorsed by the European Union,
applicable from January 1s t
, 2018, but not early adopted by the TOD’S Group.
IFRS 15 – Revenue from Contracts with Customers . On May 28t h
, 2014 the IASB published a
document which requires an entity to recognise revenue at the time the control of goods or
services is transferred to the customer in an amount that reflects the consi deration to which the
entity expects to be entitled in exchange for these goods or services. The new revenue
recognition model sets out a process in f ive steps
1) Identifying the contract with a customer;

TOD’S Group 2017 Half Year Financial Report
06.30.2017
32 Supplementary notes
2) Identifying the performance obligations;
3) Determining the transaction price;
4) Allocating the transaction price to the performance obligations;
5) Recognising revenue when the entity satisfy a performance obligation.
The new standard also requires additional disclosures regarding the nature, amount, timing and
uncertainty of the revenue and cash flows arising from these contracts with customers. The IASB
expects to adopt it from 2018, while the European Union endorsed it on September 22n d
, 2016.
Furthermore, on April 12t h
, 2016 the IASB published amendments to the standard: Clarif ications
to IFRS 15 Revenue from Contracts with Customers, which are also applicable as from January 1s t
,
2018. These amendments are aimed at clarifying the procedures to identify an entity as a
“Principal” or as an “Agent” and to establish whether revenues from licences must be deferred
throughout the term thereof.
Based on a preliminary analysis, the future adoption of this standard should not have any
significant impact on the Group’s f inancial statements.
IFRS 9 – Financial Instruments. On July 24t h
, 2014, the IASB published the final document
constituting the conclusion of the process, divided into three phases: Classif ication and
Measurement, Impairment and General Hedge Accounting , entirely revising IAS 39. The documen t
introduces new requirements for classifying and measuring financial assets and liabilities.
Specifically, as regards financial assets, the new standard adopts a single approach based on how
the financial instruments are managed and on the contractual cas h flow characteristics of the
financial assets themselves in order to determine the related valuation method, aiming at
eventually replacing the various rules laid down under IAS 39. As regards financial l iabilities, the
main amendment concerns the method of accounting for fair value changes in a f inancial l iability
designated as at fair value through profit or loss, which are due to change in the creditworthiness
of the financial l iability itself. According to the new standard, these changes must be recogn ised
in other comprehensive income, without affecting profit or loss. The main developments relating
to hedge accounting are:
- Changes in the type of transactions that qualify for hedge accounting; specifically, a more
extensive range of risks has been i ntroduced for non-financial assets/liabilities that qualify for
hedge accounting;
- A change in the method of accounting for forward contracts and options included in a hedge
accounting relationship, in order to reduce profit or loss volatil ity;
- Changes in the effectiveness test by replacing the current methods based on the 80 -125% range
with the principle of the “economic relationship” between the hedged item and the hedging
instrument; furthermore, entities are no longer required to perform an assessm ent of the
retrospective effectiveness of the hedging relationship;

TOD’S Group 2017 Half Year Financial Report
06.30.2017
33 Supplementary notes
A greater f lexibility of the accounting methods is offset by improved disclosures on the risk
management activities carried out by entities.
The new document includes a single model for th e impairment of f inancial assets based on
expected losses.
The IASB expects to adopt it from 2018, while the European Union endorsed it on November 22n d
,
2016. Based on a preliminary analysis, the future adoption of this standard should not have any
signif icant impact on the Group’s f inancial statements.
Accounting standards, amendments and interpretations published by the IASB but not yet
endorsed by the European Union and not adopted in the preparation of these financial
statements.
Amendments to IAS 12: Income taxes. These amendments, which were published by the IASB
on January 19t h
, 2016, clarify how to account for deferred tax assets relating to debt instrume nts
measured at fair value. The application of this standard had no significant impact on the Group.
Amendments to IAS 7: Statement of Cash Flows. These amendments, which were issued by the
IASB on January 29t h
, 2016, require information to be provided in the financial statements about
changes in f inancial l iabilities, aimed at improving the disclo sures provided to investors in order
to help them to better understand the changes recorded in said payables. The application of this
standard had no significant impact on the Group.
IFRS 16: Leases: In January 2016 the IASB published a document for the in itial recognition,
measurement, presentation and disclosure of lease agreements for both the parties to a contract,
aimed at replacing IAS 17 Leasing. The document is not applicable to service contracts but only to
lease agreements or to the leasing compon ents of other contracts. The standard defines the lease
as an agreement that transfers the right of use of an asset to the customer ( lessee) for a certain
period of time and in exchange for a consideration . The new standard eliminates the
classif ication based on finance and operating leases and introduces a single accounting method
that provides for the recognition of assets and liabilities for all the leases with a term of more
than 12 months and the separate recognition of amortisation, depreciation and i nterest expense
through profit or loss. As regards the lessor, no significant changes were made to the accounting
method with respect to the provisions that are currently set out under IAS 17. The IASB expects
to adopt it from 2019. An internal assessment was started in relation to the major contracts in
place, which was aimed at gathering information required to outline their foreseeable effects in
f inancial and economic terms. It is expected a significant impact on Non -current assets and on
Financial l iabilities of the Group.
Amendments to IFRS 2: Clarif ications of Classif ication and Measurement of Share -based
Payment Transactions. These amendments, which were published by the IASB on June 20t h
, 2016,
provide some clarif ications relating to the method of accounting for the effects of vesting
TOD’S Group 2017 Half Year Financial Report
06.30.2017
34 Supplementary notes
conditions in the case of cash-settled share-based payments, the classif ication of share -based
payments on a net settlement basis and the accounting of any change in the terms and conditions
of a share-based payment implying its reclassif ication from cash-settled to equity-settled items.
The amendments will become applicable from January 1s t
,2018. Based on a preliminary analysis,
the possible future adoption of this standard should not have any significant impact on the
Group’s f inancial statements.
Amendments to IFRS 4: Applying IFRS 9 Financial Instruments with IFRS 4 Insurance Contracts.
These amendments were issued by the IASB on September 12t h
, 2016, with the effective date
being expected on January 1s t
, 2018. The amendments were intended to address concerns about
the application of IFRS 9 on financial instruments before the introduction of the new insurance
contract standards. Furthermore, the amendments provide two options for entities that enter
into insurance contracts within the scope of IFRS 4: i) an option that would permit entities to
reclassify, from profit or loss to other comprehensive income, some of the income or expenses
arising from designated financial assets; and (ii) an temporary exemption from app lying IFRS 9 for
entities whose predominant activity is issuing contracts within the scope of IFRS 4. Based on a
preliminary analysis, the possible future adoption of this standard should not have any significant
impact on the Group’s f inancial statements.
Amendments to IAS 40: regarding transfers of investment property. These amendments were
issued by the IASB on December 8t h
, 2016, with the effective date being expected on January 1s t
,
2018.The amendment provides as follows: i) paragraph 57 of IAS 40 has been amended to state
that an entity shall transfer a property to, or from, investment property when, and only when,
there is evidence of a change in use; i i) the list of evidence in paragraph 57(a) – (d) is designated
as non-exhaustive list of examples. Based on a preliminary analysis, the possible future adoption
of this standard should not have any significant impact on the Group’s f inancial statements.
Amendment to IFRIC 22: Foreign Currency Transactions and Advance Consideration. This
interpretation, which was issued by the IASB on December 8t h
, 2016, covers foreign currency
transactions when an entity recognises a non -monetary asset or non-monetary liability arising
from the payment or receipt of advance consideration before the entity recognises th e related
asset, expense or income. The interpretation shall not be applied to income taxes, insurance
contracts or reinsurance contracts. The IASB expects to adopt it from January 1s t
, 2018. Based on
a preliminary analysis, the possible future adoption o f this interpretation should not have any
significant impact on the Group’s f inancial statements.
Annual improvements to IFRS Standards: 2014 -2016 Cycle. This document was issued by the
IASB on December 8t h
, 2016, the effective date being expected on Jan uary 1s t
, 2018. This session
concerned the following topics: i) IFRS 1: short -term exemptions provided for in paragraphs E3 -E7
are eliminated, since the reasons for their provision have ceased to exist; i i) IFRS 12: has been
clarif ied that standard disclosure requirements, with the exception of paragraphs B10 -B16, shall
TOD’S Group 2017 Half Year Financial Report
06.30.2017
35 Supplementary notes
apply to the entities l isted in paragraph 5 classif ied as held for sale, held for distribution or
discontinued operations in accordance with IFRS 5 ; i i i) IAS 28: it is clarif ied that it is p ossible to
make the decision to measure, at fair value through profit or loss, any investment in a subsidiary
or a joint venture held by a venture capital company, in relation to each investment in
subsidiaries or joint ventures since their initial recognition. Based on a preliminary analysis, the
possible future adoption of this standard should not have any significant impact on the Group’s
f inancial statements.
The standards listed in this paragraph are not applicable as they have not been endorsed by the
European Union, which, during the process of endorsement, could adopt these standards only
partially or could not adopt them at all. On the other hand, from a first preliminary review it
results that a future adoption of the new standards should have no significant impact on the
Group’s consolidated financial statements.
Estimates and assumptions. Preparation of the financial f igures reported on the half-year
condensed financial statements entails making estimates and assumptions based on the
management’s best valuation. Estimates and assumptions are reviewed regularly. If these
estimates and assumptions should change in future from the actual circumstances, they will
obviously be modified for the period in which those circumstances changed.
Specifically with regard to determination of eventual impairment losses affecting fixed assets,
complete tests are performed only when the annual report is prepared, when all information as
might be necessary are available, unless there are indications that require immediate valuation
of eventual impairment losses or the occurrence of events that required reiteration of the
procedure. The analyses carried out at this reporting date have not revealed any impairment
indicators.
Presentation of financial statements dr afted in foreign currency. The rates applied for
translation of the financial statements of subsidiaries using a functional currency other than the
currency used for consolidation, are il lustrated in the following table and compared with those
used in the previous period:

TOD’S Group 2017 Half Year Financial Report
06.30.2017
36 Supplementary notes
Jun. 2017 Jan. - Jun. 2017 Jun. 2016 Jan. - Jun. 2016
Exch. rates as of
end of period
Average exch.
rate
Exch. rates as of
end of period
Average exch.
rate
U.S. dollar 1.141 1.082 1.054 1.115
British pound 0.879 0.860 0.856 0.778
Swiss franc 1.093 1.076 1.074 1.096
Hong Kong dollar 8.907 8.411 8.175 8.663
Japanese yen 127.750 121.607 123.400 124.383
Hungarian forint 308.970 309.461 309.830 312.687
Singapor dollar 1.571 1.520 1.523 1.540
Korean won 1,304.560 1,235.059 1,269.360 1,318.485
Macao pataca 9.174 8.663 8.420 8.926
Chinese renminbi 7.739 7.439 7.320 7.292
Indian rupee 73.745 71.100 71.594 74.960
Albanian lek 132.521 135.020 135.631 138.181
Brazilian real 3.760 3.433 3.431 4.124
4. Seasonal or cyclical nature of interim transactions
TOD’S Group engages in a business that, despite the fact that it is not perfectly homogeneous in
the various months of the year in the flow of revenues and costs arising from industrial activity,
it does not show any profound seasonal or cyclical variations in overall annual sales .
5. Alternative indicators of performances
In order to purify the results of the first six months of 2017 from the effects of exchange rates
fluctuations, compared to the average values for the six months of 2016, the typical economic
indicators (Revenues, EBITDA, EBIT) have been restated by applying the average exchange rates
for the six months of 2016, thus making them fully comparable with those of the previous
comparison period.
These criteria for measuring business performance must not be considered alternative to those
established by IFRS.
Furthermore – as it has already been mentioned in the preceding paragraph, the Group’s
revenues and costs f lows is uneven from quarter to quarter, largely on account of its industrial
activity. Consequently, the analysis of interim results and financial statement indicators (EBITDA,
EBIT, f inancial position and w orking capital) cannot be considered fully representative, and it
would thus be improper to consider the indicators for the reference period to be in proportion to
the results for the entire financial year.

TOD’S Group 2017 Half Year Financial Report
06.30.2017
37 Supplementary notes
6. Scope of consolidation
The scope of consolidation at June 30t h
, 2017 changed in respect to June 30t h
, 2016 as explained
below:
- On May 4t h
, 2017 it has been closed the transfer of 100% of shares representing the share
capital of TOD’S Brazil Ltda, for a consideration of 2,682 thousand euros. Expenses and
income of the transferred entity have been included in the consolidated income statement
at June 30t h
, 2017 up to March 31s t
, 2017 instead of up to the date of which the loss of
control occurred. That did not caused any significant effects on the result for the period ;
- On May 11t h
, 2017, the company TOD’S UK Ltd. acquired the additional 50% of company
shares representing the share capital of the company Webcover Ltd. (already consolidated
with the integral global method) , for a consideration paid amounting to 469 thousand GBP.
The difference between the considerati on paid and the carrying amount of minority
interests has been represented as an increase of consolidated equity in accordance with IFRS
3. In connection with the above mentioned acquisition, on May 11t h
, 2017, TOD’S UK Ltd., in
addition, acquired 100% of company shares representing the share capital of Buena Ltd., for
a consideration paid amounting to 1,600 thousand GBP, referred to the key money related to
the store managed by Webcover Ltd.
- During the second half of 2016 the liquidation phase of TOD’S Luxembourg has been
completed;
The transactions quoted above are the only changes in the consolidation scope in respect of
December 31s t
, 2016, with the only exception of the l iquidation of TOD’S Luxembourg, already
occurred as of December 31s t
, 2016.
In order to provide a complete set of information, here below are summarized the economic,
f inancial and patrimonial effects on condensed consolidated half -year financial statements at
June 30t h
, 2017 related to the transfer of TOD’S Brasil Ltda:
- The consolidated net result from the transfer, represented in the income statement at June
30t h
, 2017, computed as a difference between the sale price and the consolidated carrying
amount of transferred equity investment, was negative for about 625 thousand euros;
- The effect on consolidated cash flow at June 30t h
, 2017 was positive for 945 thousand euros,
computed as the difference between the net cash and cash equivalents of the transferred
entity and the consideration received.
With respect to companies in which the Group does not hold more than 50% of the capital and
consequently has the same percentage of the voting rights exercisable at the Shareholders'
Meeting, control is assumed to reflect the fact that the Group has i) power, that is the ability to
direct significant activities that have a significant impact on the returns; i i) it is exposed to the

TOD’S Group 2017 Half Year Financial Report
06.30.2017
38 Supplementary notes
variability of the benefits deriving from the involvement with it and, therefore, i i i) exercises the
power to gain benefits from its business, as defined by IFRS 10 - Consolidated Financial
Statements.
The following list i l lustrates the entire consolidation scope at June 30
t h, 2017:
Parent Company TOD’S S.p.A. S .E lp id io a Mare - I ta ly Share Capita l (S .C. ) - euro 66,187,078 Direct Subsidiaries TOD’S Deutsch. Gmbh TOD’S France Sas An.Del. USA Inc. TOD’S International BV Dusseldorf - Germany Par is - F rance New York - U.S .A Amsterdam – Nether lands S .C . - euro 153,387.56 S .C . - euro 780,000 S .C . - Usd 3,700,000 S .C . - euro 2 ,600,200 % held: 100% % held: 100% % held: 100% % held: 100% Del.Com S.r. l. Holpaf B.V. Roger Vivier S.p.A. S .E lp id io a Mare - I ta ly Amsterdam – Nether lands S .E lp id io a Mare – I ta ly S .C . - euro 31,200 S .C . - euro 5,000,000 S .C . – euro 10,000,000 % held: 100% % held: 100% % held: 100% TOD’S Danmark APS TOD’S Austr ia Gmbh Copenhagen - Denmark V ienna - Austr ia S .C . – Dkk 500,000 S .C . – euro 50,000 % held: 100% % held: 100%
Indirect subsidiaries Cal.Del. USA Inc. TOD’S Tex Del USA Inc. Deva Inc. F lor.Del. USA Inc. Bever ly H i l ls, Ca - U.S .A . Dal las, Tx - U.S .A Wilmington, De – U .S .A. Ta l lahassee, F l - U.S.A. S .C . - Usd 10,000 S .C . - Usd 10,000 S .C . - Usd 500,000 S .C . - Usd 10,000 % held: 100% % held: 100% % held: 100% % held: 100%
Hono.Del. Inc. I l .Del. USA Inc. Neva.Del. Inc. Or.Del. USA Inc. Honolulu, H i - U.S.A. Spr ingf ie ld, I l - U.S .A . Carson C ity, Nv - U.S .A. Sacramento, Ca - U.S .A. S .C . - Usd 10,000 S .C . - Usd 10,000 S .C . - Usd 10,000 S .C . - Usd 10,000 % held: 100% % held: 100% % held: 100% % held: 100%
Gen.Del SA Sandel SA TOD’S Belgique S.p.r. l. TOD’S Espana SL Zur ich - Switzer land San Marino Bruxel les - Belg ium Madrid – Spain S .C . - Chf 200,000 S .C . - euro 258,000 S .C . - euro 300,000 S .C . - euro 500,000 % held: 100% % held: 100% % held: 100% % held: 100%
TOD’S Hong Kong Ltd TOD’S Japan KK Alban.Del Sh.p.k. TOD’S India Retail Pte Ltd Hong Kong Tokyo - Japan T irana - A lbania Mumbai - India S .C . - Usd 16,550,000 S .C . - Jpy 100,000,000 S .C . - euro 720,000 S .C . - Inr 193,900,000 % held: 100% % held: 100% % held: 100% % held: 51%
TOD’S Singapore Pte Ltd Un.Del Kft TOD’S UK Ltd Webcover Ltd S ingapore Tata - Hungary London - Great Br i ta in London - Great Br i ta in S .C . - Sgd 300,000 S .C . - Huf 42,900,000 S .C . - Gbp 350,000.00 S .C .- Gbp 2 % held: 100% % held: 100% % held: 100% % held: 100%
TOD’S Korea Inc. TOD’S Macao Ltd TOD’S (Shanghai) Tr.Co.Ltd Buena Ltd. Seoul - Korea Macau Shanghai - China London – Great Br i ta in S .C . - Won 2,600,000,000 S .C . - Mop 20,000,000 S .C . - Usd 32,000,000 S .C . - Gbp 1 % held: 100% % held: 100% % held: 100% % held: 100%
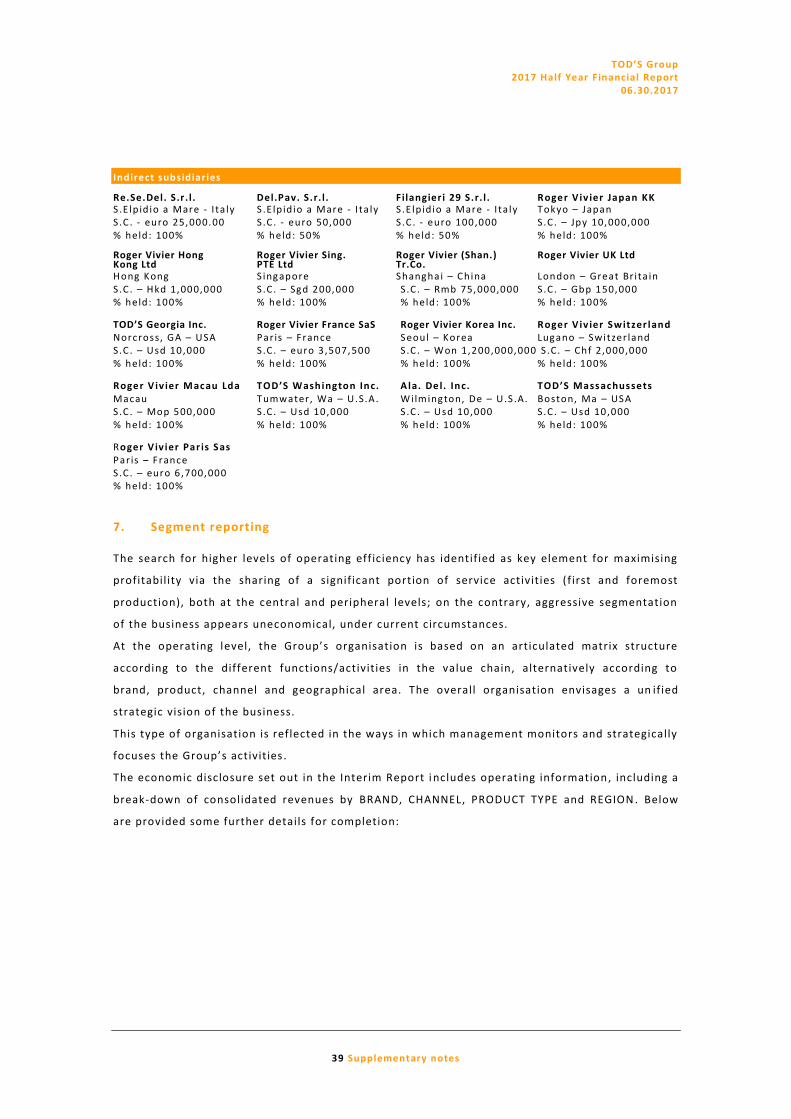
TOD’S Group 2017 Half Year Financial Report
06.30.2017
39 Supplementary notes
Indirect subsidiaries Re.Se.Del. S.r . l. Del.Pav. S.r. l. F ilangieri 29 S.r. l. Roger V iv ier Japan KK S .E lp id io a Mare - I ta ly S .E lp id io a Mare - I ta ly S .E lp id io a Mare - I ta ly Tokyo – Japan S .C . - euro 25,000.00 S .C . - euro 50,000 S .C . - euro 100,000 S .C . – Jpy 10,000,000 % held: 100% % held: 50% % held: 50% % held: 100% Roger Vivier Hong Roger Vivier Sing. Roger Vivier (Shan.) Roger Vivier UK Ltd Kong Ltd PTE Ltd Tr.Co. Hong Kong S ingapore Shanghai – China London – Great Br i ta in S .C . – Hkd 1,000,000 S .C . – Sgd 200,000 S .C . – Rmb 75,000,000 S .C . – Gbp 150,000 % held: 100% % held: 100% % held: 100% % held: 100% TOD’S Georgia Inc. Roger Vivier France SaS Roger Vivier Korea Inc. Roger V iv ier Switzer land Norcross, GA – USA Par is – F rance Seoul – Korea Lugano – Switzer land S .C . – Usd 10,000 S .C . – euro 3 ,507,500 S .C . – Won 1,200,000,000 S .C. – Chf 2,000,000 % held: 100% % held: 100% % held: 100% % held: 100% Roger V iv ier Macau Lda TOD’S Washington Inc. A la. Del. Inc. TOD’S Massachussets Macau Tumwater, Wa – U.S.A . Wi lmington, De – U .S .A. Boston, Ma – USA S .C . – Mop 500,000 S .C . – Usd 10,000 S .C . – Usd 10,000 S .C . – Usd 10,000 % held: 100% % held: 100% % held : 100% % held: 100% Roger V iv ier Par is Sas Paris – F rance S .C . – euro 6 ,700,000 % held: 100%
7. Segment reporting
The search for higher levels of operating efficiency has identified as key element for maximising
profitability via the sharing of a significant portion of service activities (f irst and foremost
production), both at the central and peripheral levels; on the contrary, aggressive segmentation
of the business appears uneconomical, under current circumstances.
At the operating level, the Group’s organisation is based on an articulated matrix structure
according to the different functions/activities in the value chain, alternatively according to
brand, product, channel and geographical area. The overall organisation envisages a un ified
strategic vision of the business.
This type of organisation is reflected in the ways in which management monitors and strategically
focuses the Group’s activities .
The economic disclosure set out in the Interim Report i ncludes operating information, including a
break-down of consolidated revenues by BRAND, CHANNEL, PRODUCT TYPE and REGION . Below
are provided some further details for completion:

TOD’S Group 2017 Half Year Financial Report
06.30.2017
40 Supplementary notes
Capital expenditures at June 30th
,2017
By Region (euro mn)By investment allocation (euro mn)
1.8
8.0
1.8
4.8
0.0
10.2
3.5
4.9
Key money DOS Prod. Other
H1 17
H1 16
6.4
4.5
0.4
2.6 2.5
9.8
4.1
0.4
3.1
1.2
Italy Europe Americas Gr. China Rest of World
H1 17
H1 16
Concerning the comparative data of June 30t h
, 2016, the tables i l lustrated above do not include
both the amount of the acquired brand ROGER VIVIER (415 mill ion euros) and the tangible and
intangible assets of the company Roger Vivier Paris sas (about 3.6 mill ion euros).
Distribution network
TOD'S GROUP - Distribution channel
06.30.17 06.30.16Italy DOS 46 48
FRANCHISED STORES 2 2
Europe DOS 60 55
FRANCHISED STORES 19 21
Americas DOS 20 21
FRANCHISED STORES 3 3
Greater China DOS 80 80
FRANCHISED STORES 31 28
RoW DOS 64 57
FRANCHISED STORES 53 49
Total DOS 270 261
Totale Franchised stores 108 103
TOD'S HOGAN
144
84
142
83
DOS Franchising
H1 17 H1 16
25
15
28
14
DOS Franchising
H1 17 H1 16

TOD’S Group 2017 Half Year Financial Report
06.30.2017
41 Supplementary notes
FAYROGER
VIVIER
11
1
10
1
DOS Franchising
H1 17 H1 16
39
8
34
5
DOS Franchising
H1 17 H1 16
8. Management of financial risks
The TOD’S Group has implemented a system for monitoring its f inancial risks in accordance with
the guidelines set out in the Corporate Governance Code of Listed Companies. As part of this
policy, the Group constantly monitors the financial risks connected with its operations, in order
to assess their potential negative impact and undertake appropriate action to mitigate them.
The following analysis of risks faced by the TOD’S Group highlights the Group’s level of exposure :
i. Credit risk. Th is represents the exposure of TOD’S Group to potential losses stemming from
default on the obligations assumed by commercial counterparties. For sales to third party
customers, the Group adopts a policy aimed at optimizing credit management and reducing
associated risk. In particular, it is the policy of the Group, in granting credit l imits to
customers, to periodically analyse the creditworthiness of all customers, both consolidated
and potential, in order to monitor and prevent potential solvency crises .
i i. Liquidity risk. The liquidity risk represents the risk stemming from the unavailability of
f inancial resources as necessary to meet the short -term commitments assumed by the Group and
its own financial requirements.
The main factors that determine the Gr oup’s degree of l iquidity are the resources generated or
used by operating and investment activities and, on the other hand, the due dates or renewal
dates of its payables or the liquidity of its f inancial investments and market conditions.
This risk is l imited by taking actions aimed at ensuring a balanced structure of the Group’s capital
and by maintaining such a level of cash and cash equivalents as is required to meet its f inancial
debt requirements at the relevant maturity dates in an adequate manner. Particular attention is
paid to the definition of the credit counterparty that is considered to be suitable for cash
operations and that is identified according to increasingly selective liquidity, security and yield
criteria and in l ine with the Managemen t’s instructions.
In connection with the outstanding loans at June 30t h
, 2017 it’s highlighted the following ( Note
16):

TOD’S Group 2017 Half Year Financial Report
06.30.2017
42 Supplementary notes
- syndicated medium/long term loan signed with Mediobanca and Crédit Agricole on 2014,
expiring on 2021, shows an outstanding nominal amou nt for 170 mill ion euros at June 30t h
,
2017;
- Medium and long term loan signed with Banca Nazionale del Lavoro S.p.A. on 2015, expiring
on 2019, shows an outstanding nominal amount for 12 .5 mill ion euros at June 30t h
, 2017;
- Medium and long term loan signed with Intesa San Paolo S.p.A. on 2015, expiring on 2019,
shows an outstanding nominal amount for 25 mill ion euros at June 30t h
, 2017.
Furthermore, it should be noted that, the Company, in order to borrow the liquid funds needed
to meet any possible requirement connected with ordinary sales and general corporate
operation, entered into three loan agreements, by which have been granted three medium/long -
term revolving credit facil ities respectively by: i) Crédit Agricole Corporate and Investment Bank
and Cassa di Risparmio di Parma e Piacenza S.p.A. (Crédit Agricole Group), signed on January 27t h
2016, for a maximum amount of 100 mill ion euros, i i) Unicredit S.p.A., signed on November 9t h
2016, for a maximum amount of 100 mill ion euros and ii i) B.N.L. S.p.A., s igned on November 28t h
2016, for a maximum amount of 100 mill ion euros. These credit facil ities will be available for a
period of 3 years. At June 30t h
, 2017 no amount has been used in connection with the above
mentioned credit facil ities.
Considering the Group profitability and its capacity to generate cash, it is reasonable to believe
that l iquidity risk is not significant.
Moreover, it should be noted that such capacity of generating cash may allow Group to meet
these commitments in a period of time that is potentially shorter than that in which the loans
and credit facil ities are expected to be available .
Finally, as regards financial operations, the Group’s policy is to continue to invest all of its
available l iquid funds in sight bank deposits or in short-term liquidity, without making use of
f inancial instruments, including those of the money market, and dividing its deposits among an
adequate number of banks, which are carefully selected by taking account the level of
remuneration offered, in addition to the financial soundness and reliability.
i i i.Market risk. IFRS 7 includes in this category all risks that are directly or indirectly connected
with the fluctuation in prices on physical and financial markets to which the company is exposed:
– exchange rate risk;
– interest rate risk;
– commodity risk, which is tied to the volatil ity of prices for the raw materials used in the
production process.
Concerning the above mentioned risks, TOD’S Group is exposed to exchange rate and interest
rate risk, since there is no physical market subject to actual f luctuations in the purchase prices
for raw materials used in the production process.

TOD’S Group 2017 Half Year Financial Report
06.30.2017
43 Supplementary notes
Exchange rate risk. Due to its commercial operations, the Group is exposed to fluctuations in the
exchange rates for currencies in which some of its commercial transactions are denominated
(particularly USD, GBP, CHF and Far East countries), against a cost structure that is concentrated
principally in the eurozone. The TOD’S Group realises greater revenues than costs in all these
currencies; therefore, changes in the exchange rate between the euro and the aforementioned
currencies can impact the Group’s results.
Moreover, due to the geographical composition of the Group structure, which is formed by
subsidiaries with different currencies, the Group is exposed to exchange rate risk related to
intercompany financial f lows (mainly dividends, loans, transactions on share capital).
Finally, the Group is exposed to “translation risk”. This risk stems from the fact that the as sets
and liabilities of consolidated companies whose functional currency is different from the euro
can have different countervalues in euros according to changes in foreign exchange rates. The
measured amount of this risk is recognised in the “translation reserve” in equity.
The Group monitors the changes of such exposure. No hedges of this risk existed at the reporting
date. Governance of individual foreign currency operations by the Group’s subsidiaries is highly
simplif ied by the fact that they are whol ly owned by the parent company.
The Group’s risk management policy, in connection to the exchange rate risk on commercial
transactions, aims to ensure that the countervalue in euros of receipts on transactions
denominated in foreign currencies for each col lection (Spring/Summer and Fall/Winter) is on
average equal to or greater than what would be obtained by applying the pre -set target exchange
rates. The Group pursues these aims by entering into forward contracts for each individual
currency to hedge a specific percentage of the expected revenue (and cost) volumes in the
individual currencies other than the functional currency. These positions are not hedged for
speculative or trading purposes, consistently with the strategic policies adopted for prudent
management of cash flows. Consequently, the Group might forego opportunities to realise certain
gains, but it avoids running the risks of speculation.
The Group defines its exchange risk a priori according to the budget for the reference period and
then gradually hedges this r isk upon acquisition of orders, in the amount according to which they
correspond to budget forecasts.
The process of hedging exchange rate risk inside the Group is broken down into a series of
activities that can be grouped into the following distinct phases:
• definition of operating limits;
• identification and quantification of exposure;
• implementation of hedges;
• monitoring of positions and alert procedures.
In connection with the exchange rate risk on financial intercompany transa ctions, the Group
monitors the risk underlying outstanding transactions ( loans) and forecast transactions

TOD’S Group 2017 Half Year Financial Report
06.30.2017
44 Supplementary notes
(dividends and capital increases), in view of guaranteeing that no material operating and
financial impact for the entities involved results from thes e transactions in relation to
fluctuations in exchange rates. These goals are pursued by the Group through monitoring the
foreign exchange rate trends related to outstanding or expected capital transactions and entering
into forward contracts if they will have material contingent effects. These forward contracts are
made to hedge the individual transactions, and not for speculation or trading. This is consistent
with the strategic policies focused on prudent management of cash flows .
Interest rate risk. TOD ’S Group is exposed to interest rate fluctuations, l imited to its variable -
rate debt instruments. Interest rate risk is managed in conformity to long -established practice
with the aim of cutting down the risk of interest rate volatil ity, at the same time p ursuing the
goal of reducing the financial costs involved to a minimum.
The parent company TOD’S S.p.A. has a syndicated loan signed with Mediobanca and Crédite
Agricole with variable interest rate equal to EURIBOR 3M + 80 basis points.
To hedge the risk of possible changes in the interest rates on the fin ancing transaction that has
already been mentioned, two derivative contracts ( interest rate swaps - IRSs), have been signed
for a notional amount equal to the amount drawn for the loan (Note 10 ). These derivatives
protect the Group from the risk of a generalised rise in interest rates, swapping the variable rate
on the loan (3M EURIBOR + 80 basis points) for a contractually f ixed rate (a quarterly rate of
0.748%). Such transactions have been recognised i n accordance with cash flow hedge
methodology provided by IAS39.
In addition to the above mentioned syndicated loan, TOD’S S.p.A. entered into two loan
agreements with BNL S.p.A. (BNP Paribas Group) and Intesa San Paolo S.p.A. respectively, for an
amount of 25 mill ion euros each; the reimbursements will be respectively in four years with a
payment of 16 instalments at the end of every quarter and one-shot with a single payment at the
expiry date. Interests rates are variables and equal to the EURIBOR 3m + 0.42% and EURIBOR 3m
+0.5% respectively (Note 16). Considered the current financial markets situation and the current
EURIBOR reference rate, the Group doesn’t believe necessary to put in place hedging derivatives
for such loans. The financial market trend and the related benchmark interests rates are
constantly monitored by the Group, and, in case there could be an increase of risks in connection
with the above mentioned loans, the Group will put in place appropriate hedging instruments in
accordance with the strengthened Group practice .
Finally, the financial l iabilit ies (Notes A1 and A2) issued by the subsidiary Holpaf B.V. (Note 16)
are subject to a f ixed rate of 2.94% and 3.239%, r espectively.
9. Intangible and Tangible fixed assets
Intangible assets with undefined useful l ife include the values of the Group own brands, for
about 553.6 mill ion euros (unchanged in respect to December 31s t
, 2016) and value of goodwill,

TOD’S Group 2017 Half Year Financial Report
06.30.2017
45 Supplementary notes
for about 12.2 mill ion euros (unchanged in respect to December 31s t
, 2016), related to
acquisitions of controlled companies and they have been determined in accordance with the
acquisition method (IFRS 3).
Key money include the amounts paid for this purpose by the Group to take over certain leases of
commercial spaces where some DOS o perate.
Other intangible assets with definite useful l ife include long -term amounts to protect the brands
owned by the Group, software and other intangible assets. This item include the net book value
related to the agreement signed by the holding TOD’S S .p.A. for f inancing the restoration work on
the Coliseum, amounting to 7.6 mill ion euros.
Capital expenditure in H1 2017 totalled 16.4 mill ion euros, of which 3.6 mill ion euros of
intangible assets and 12.8 mill ion euros of tangible assets . The capital expenditures of the DOS
network totalled about 9.8 mill ion euros. This amount was used primarily for both new DOS
openings and for renovation activities of the existing stores. The remaining investment quota in
the period regarded not only the normal process es of modernising the structures and industrial
equipment (mainly lasts and moulds) but also the beginning of the works for the construction of
the new plant in Arquata del Tronto, further to the development of the company management
software.
10. Derivative financial instruments
At the closing date of the half -year condensed financial statements, the notional amount of the
derivative financial instruments for the hedging of exchange rate risk (sale and purchase) entered
into by the Group are summarized as follows:
Currency 000's
Notional
in currency
Notional
in euro
Notional
in currency
Notional
in euro
US dol lar 30,430 26,665
HK dol lar 434,200 48,749
Japanese yen 1,307,000 10,231 3,980,000 31,155
Bri tish pound 23,500 26,725
Swiss franc 9,400 8,600
Chinese renmimbi 370,000 47,813
Singapore dol lar 2,060 1,311
Euro 2,500 2,500 6,269 6,269
Canadian dol lar 5,960 4,031
Austra l ian dol lar 2,600 1,751
Total 178,376 37,423
Sales Purchases
At each reporting date, the hedge accounting method is applied. This requires recognition of the
derivatives in the statement of f inancial position at their fair value and recognition of the

TOD’S Group 2017 Half Year Financial Report
06.30.2017
46 Supplementary notes
changes in fair value, which varies according to the type of hedge at the valuation date. The fair
value of derivative financial instruments existing at June 30t h
, 2017 is classif ied as Level 2 and
has been determined using exchange rate that are quoted in active markets.
At June 30t h
, 2017 the net fair value of derivatives used to hedge exchange risks reported is
positive, on the whole, for 3,630 thousand euros, i.e. the balance of assets of 5,635 thousand
euros (compared to 2,857 thousand euros at December 31s t
, 2016) and liabilities of 2,005
thousand euros (compared to 6,140 thousand euros at December 31s t
, 2016).
At June 30t h
, 2017 the reserve for derivatives used to hedge forecast transactions on currencies
( i.e. cash flow hedge) was positive for 6,511 thousand euros, net of related tax effect, and it
concerns, for 3,387 thousand euros, hedging of business transactions and, for 3,124 thousand
euros, hedging of intercompany financial transactions . Such reserve include also a portion
accrued for hedging derivatives on intercompany transactions, on contracts already closed at
June 30t h
, 2017, which will be reversed when hedged items will be realized.
As regards derivatives for the hedging of business transactions , which were closed in the period
from January to June 2017, the transfer of the effect of the hedging transactions to the income
statement was positive for 637 thousand euros, of which 763 thousand euros were entered as a n
increase in revenues and 126 thousand euros as an increase of costs.
At June 30t h
, 2017 two derivative contracts ( interest rate swaps - IRSs) were in place, which were
entered into on July 23rd
, 2014 to hedge the risk associated with fluctuations in the interest rates
on the already commented variable rate loan transaction signed with Mediobanca and Crédit
Agricole (Note 16). These derivative contracts, having an overall notional amount equal to the
underlying loan, protect the Group from the risk of a generalised rise in interest rates, swapping
the variable rate on the loan (EURIBOR 3M + 80 basis points) for a contractually f ixed rate
(0.748% paid quarterly) . At June 30t h
, 2017 the fair value of such derivatives, negative for 3,439
thousand euros, has been represented for 1,767 thousand euros in the non-current l iabilities in
accordance with the period on which the effects wil l be generated. The amount recognised in the
financial expenses at June 30t h
, 2017 was 630 thousand euros, while the related cash flow hedge
reserve, net of tax effect, was negative for 2,354 thousand euros.
11. Share Capital
At June 30t h
, 2017, the parent company share capital totalled 66,187,078 euros, and was divided
into 33,093,539 shares having a par value of 2 euros each, fully subscribed and paid in.
The Group did not own treasury shares in the parent TOD’S S.p.A., and it did not execute any
transactions on those shares during the period.
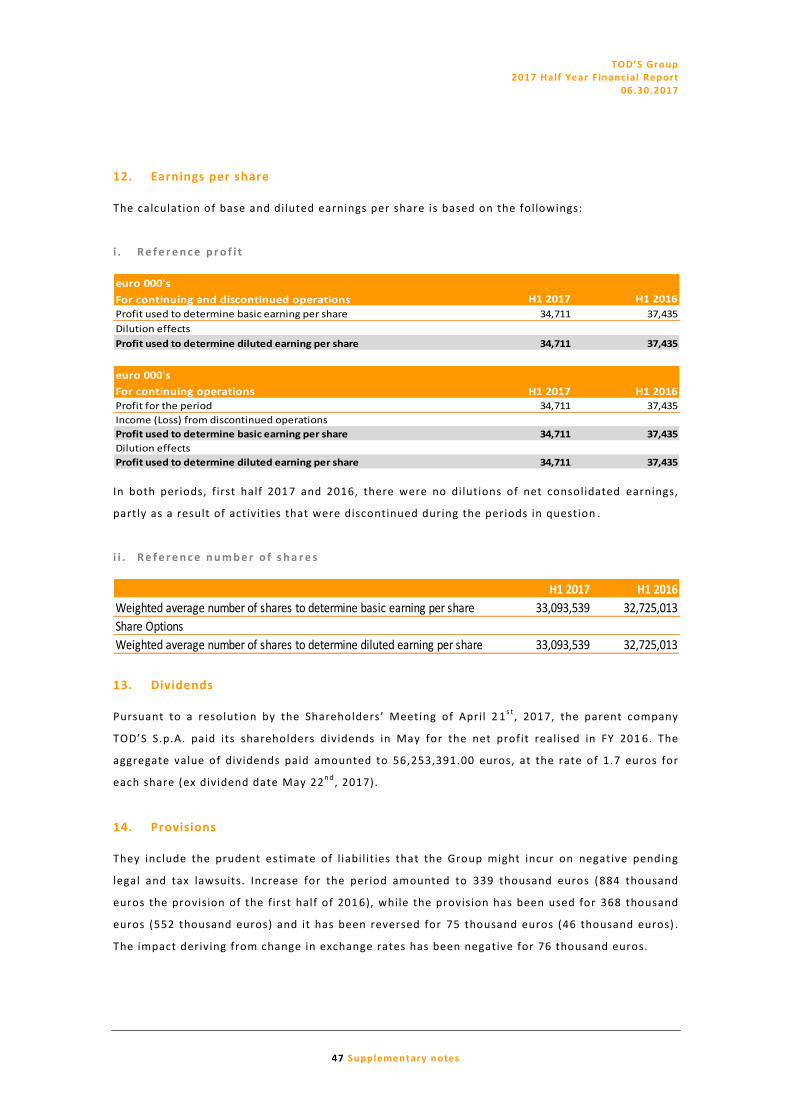
TOD’S Group 2017 Half Year Financial Report
06.30.2017
47 Supplementary notes
12. Earnings per share
The calculation of base and diluted earnings per share is based on the followings:
i . R e f e r e n c e p r o f i t
euro 000's
For continuing and discontinued operations H1 2017 H1 2016
Profit used to determine basic earning per share 34,711 37,435
Dilution effects
Profit used to determine diluted earning per share 34,711 37,435
euro 000's
For continuing operations H1 2017 H1 2016Profit for the period 34,711 37,435
Income (Loss) from discontinued operations
Profit used to determine basic earning per share 34,711 37,435
Dilution effects
Profit used to determine diluted earning per share 34,711 37,435 In both periods, f irst half 2017 and 2016, there were no dilutions of net consolidated earnings,
partly as a result of activities that were discontinued during the periods in question .
i i . R e f e r e n c e n u m b e r o f s h a r e s
H1 2017 H1 2016
Weighted average number of shares to determine basic earning per share 33,093,539 32,725,013
Share Options
Weighted average number of shares to determine diluted earning per share 33,093,539 32,725,013
13. Dividends
Pursuant to a resolution by the Shareholders’ Meeting of April 2 1s t
, 2017, the parent company
TOD’S S.p.A. paid its shareholders dividends in May for the net profit realised in FY 201 6. The
aggregate value of dividends paid amounted to 56,253,391.00 euros, at the rate of 1.7 euros for
each share (ex dividend date May 22n d
, 2017).
14. Provisions
They include the prudent estimate of l iabilities that the Group might incur on negative pending
legal and tax lawsuits. Increase for the period amounted to 339 thousand euros (884 thousand
euros the provision of the first half of 201 6), while the provision has been used for 368 thousand
euros (552 thousand euros) and it has been reversed for 75 thousand euros (46 thousand euros) .
The impact deriving from change in exchange rates has been negative for 76 thousand euros.
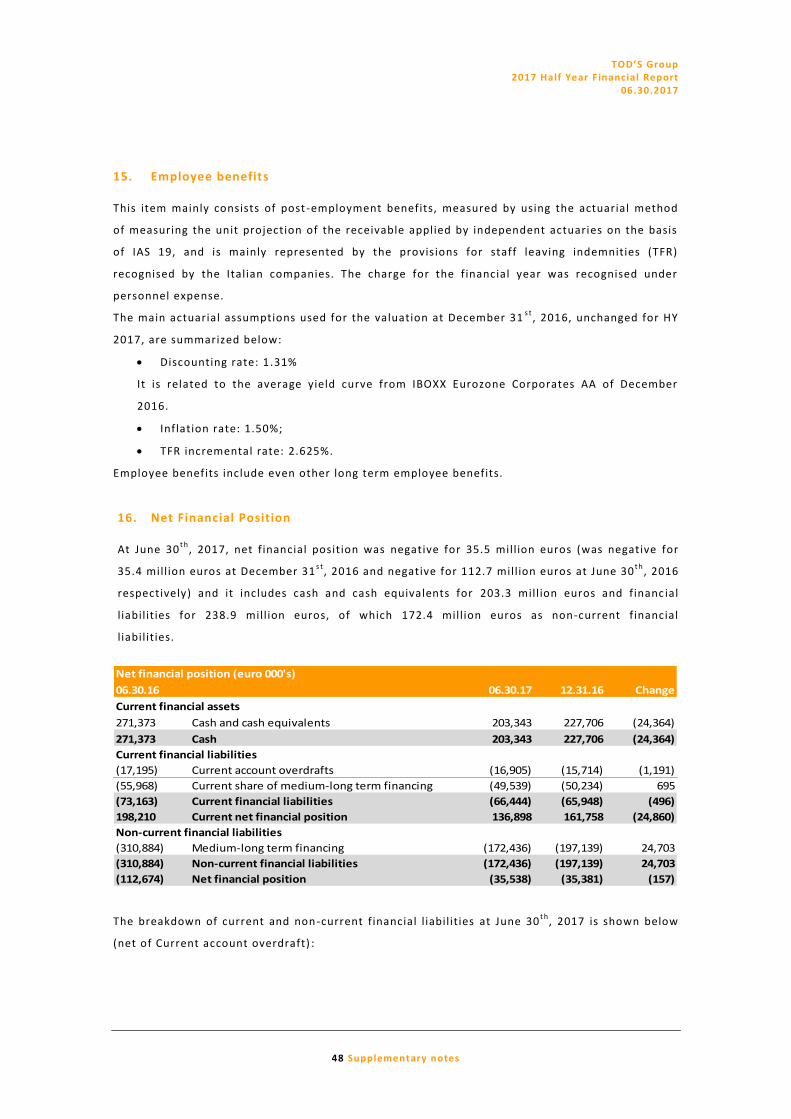
TOD’S Group 2017 Half Year Financial Report
06.30.2017
48 Supplementary notes
15. Employee benefits
This item mainly consists of post -employment benefits, measured by using the actuarial method
of measuring the unit projection of the receivable applied by independent actuaries on the basis
of IAS 19, and is mainly represented by the provisions for staff leaving indemnities (TFR)
recognised by the Italian companies. The charge for the financial year was recognised under
personnel expense.
The main actuarial assumptions used for the valuation at December 31s t
, 2016, unchanged for HY
2017, are summarized below:
Discounting rate: 1 .31%
It is related to the average yield curve from IBOXX Eurozone Corporates AA of December
2016.
Inflation rate: 1.50%;
TFR incremental rate: 2.625%.
Employee benefits include even other long term employee benefits.
16. Net Financial Position
At June 30t h
, 2017, net f inancial position was negative for 35.5 mill ion euros (was negative for
35.4 mill ion euros at December 31s t
, 2016 and negative for 112.7 mill ion euros at June 30t h
, 2016
respectively) and it includes cash and cash equivalents for 203.3 mill ion euros and financ ial
l iabilities for 238.9 mill ion euros, of which 172.4 mill ion euros as non-current financial
l iabilities.
06.30.16 06.30.17 12.31.16 Change
Current financial assets
271,373 Cash and cash equivalents 203,343 227,706 (24,364)
271,373 Cash 203,343 227,706 (24,364)
Current financial liabilities
(17,195) Current account overdrafts (16,905) (15,714) (1,191)
(55,968) Current share of medium-long term financing (49,539) (50,234) 695
(73,163) Current financial liabilities (66,444) (65,948) (496)
198,210 Current net financial position 136,898 161,758 (24,860)
Non-current financial liabilities
(310,884) Medium-long term financing (172,436) (197,139) 24,703
(310,884) Non-current financial liabilities (172,436) (197,139) 24,703
(112,674) Net financial position (35,538) (35,381) (157)
Net financial position (euro 000's)
The breakdown of current and non-current financial l iabilities at June 30
t h, 2017 is shown below
(net of Current account overdraft) :

TOD’S Group 2017 Half Year Financial Report
06.30.2017
49 Supplementary notes
Currency 000's
Type Counterpart Currency Maturity
Medium and long term bank pool loan Mediobanca - Crédit Agricole Eur 2021 169,337 169,337
Medium and long term loan B.N.L. S.p.A. Eur 2019 12,508 12,508
Medium and long term loan Intesa SanPaolo S.p.A. Eur 2019 24,985 24,985
Notes A-1 Intesa SanPaolo S.p.A. Jpy 2017 77,955 610
Notes A-2 Sociètè Europèenne de Banque Jpy 2021 1,764,270 13,810
Total financing 221,250
Other financial liabilities Inr n.a. 53,500 725
Total financing and other financial liabilities 221,975
Res. debt in
currency
Res. debt in
euro
The medium and long term bank pool loan is related to the financing agreement signed by TOD’S
S.p.A. and Mediobanca/Crédit Agricole which has a variable interest rate equal to EURIBOR 3 m +
80 basis points. Such loan was hedged with two derivative contracts ( interest rate swaps - IRSs)
for the same notional amount and duration (Note 10). The duration of such loan is 7 years from
the signing date (July 2014) and it is refunded quarterly.
The medium and long term loans are related to two loan agreements signed in 2 015 between the
parent company TOD’S S.p.A. and BNL S.p.A. (BNP Paribas Group) and Intesa San Paolo S.p.A.
respectively, for an amount of 25 mill ion euros each; the reimbursements will be respectively in
four years with a payment of 16 instalments at the e nd of every quarter and one-shot with a
single payment at the expiry date. Interests rates are variables and equal to the EURIBOR 3m
+0.42% and EURIBOR 3m +0.5% respectively.
The above mentioned loans contain, among others obligations, specific f inancial covenants; in
particular, it is requested to respect the following parameters computed at a Group level:
Bank Financial covenants
Banca Nazionale del lavoro S.p.A. Net financial liabilities/EBITDA ≤ 3.5
Intesa SanPaolo S.p.A. Net financial liabilities/EBITDA ≤ 3
Mediobanca/Crédit Agricole Net financial liabilities/EBITDA ≤ 3.5
Parameters
The parameters indicated above are constantly monitored by the Group and all f inancial
covenants are fulfi l led at June 30t h
, 2017.
The financial l iabilities indicated as Notes A-1 and A-2 represent two amortised, non-convertible
fixed-rate (respectively 2.94% and 3.239%) bonds denominated in JPY, issued in 2006 by the
subsidiary Holpaf B.V. to refinance the debt assumed for purchase of the land and c onstruction of
the building in Omotesando. The two bonds were fully subscribed by banks, and specifically by
Intesa San Paolo (Notes A-1) and Société Européenne de Banque (Notes A -2).
The debt referred to at Notes A-1 and A-2 includes the residual debt fo r principal (Note A-1: 603
thousand euros, and Note A -2: 13,442 thousand euros) and the interest accrued for the period, 7
thousand euros and 162 thousand euros, respectively, and the effect of fair value measurement
upon initial recognition, for 1 thousand euros and 206 thousand euros, respectively, which are
measured at amortized cost.

TOD’S Group 2017 Half Year Financial Report
06.30.2017
50 Supplementary notes
Finally, to be thorough, it is highlighted that TOD’S S.p.A. entered in three loan agreements
during 2016 of which details will be provided as follows:
- Crédit Agricole Corporate and Investment Bank and Cassa di Risparmio di Parma e Piacenza
S.p.A. (Crédit Agricole Group), signed on January 27th
, 2016, for a long term revolving
credit facil ity (commitment period 3 years) for a maximum amount of 100 mill ion euros.
Interest rate is variable and equal to EURIBOR (1m, 3m or 6m depending on the period
chosen once the facil ity will be used) + a variable margin, depending on the net f inancial
indebtedness/EBITDA ratio, which goes from 60 basis points to a maximum of 80 basis
points;
- i i) Unicredit S.p.A., signed on November 9t h
, 2016, for a long term revolving credit facil ity
(commitment period 3 years) for a maximum amount of 100 mill ion euros. Interest rate is
variable and equal to EURIBOR (1m, 3m or 6m depending on the period ch osen once the
facil ity will be used) + 30 basis points;
- i i i) B.N.L. S.p.A., signed on November 28t h
, 2016, for a long term revolving credit facil ity
(commitment period 3 years) for a maximum amount of 100 mill ion euros. Interest rate is
variable and equal to EURIBOR (1m, 3m or 6m depending on the period chosen once the
facil ity will be used) + 60 basis points.
At June 30t h
, 2017 no amount has been used in connection with the above mentioned credit
facil ities.
17. Transactions with related parties
The Group's related parties transactions were executed in compliance with the procedural
sequence and implementing procedures set out in the Related Parties Transactions Procedure
approved by the TOD'S S.p.A. Board of Directors in implementation of the Related Partie s
Regulation adopted by CONSOB with Resolution no. 17221 of March 12t h
, 2010, as subsequently
amended. In accordance with market best practices, significant related party transactions are
subject to an in-depth review involving, inter alia:
( i) complete, prompt transmission of material information to the delegated Board of Directors
committees (the Control and Risk Committee and the Independent Directors Committee, each
within the ambit of their delegated responsibilities, where the majority or all members of these
committees are independent directors), who in the performance of their functions also avail
themselves of the assistance of independent experts;
( i i) the issuance of an opinion (either binding or non -binding, as applicable) before approval of
the transaction by the Board of Directors (or, if appropriate, by the body delegated to resolve on
the transaction). All transactions – which are connected with the normal operations of TOD’S
Group companies – were executed solely on behalf of the Group by a pplying contractual
conditions consistent with those that can theoretically be obtained on an arm’s length basis.

TOD’S Group 2017 Half Year Financial Report
06.30.2017
51 Supplementary notes
Transactions concluded during the period.
On June 29t h
, 2017, the strategic partnership in place with the company Italiantouch S.r. l. , a
company headed by Directors Diego Della Valle and Andrea Della Valle and controlled by the first,
was renewed for another five years, with the aim of developing the Group’s e -commerce channel.
The agreement relates to the sale of products relating to all four Group trademarks through the
partner's e-commerce platform and envisages the development of markets already launched
under the scope of the previous agreement and the implementation of the channel in new
geographic areas.
Moreover, in continuation of contractual relationship already existing in 2016, d uring the first
half of 2017, TOD’S Group continued to maintain a series of contractual relationship with related
parties (directors/controlling or significant shareholders) . The main objects of the transactions
were the sale of products, lease of sales spaces, show rooms and offices and the provision of
advertising services.
i Commercial transactions with related parties – Revenue euro 000's
June 30th, 2017
Parent Company (*) 6,209 5
Directors
Other related parties
Total 6,209 - - 5 -
June 30th, 2016
Parent Company (*) 4,989 5
Directors
Other related parties
Total 4,989 - - 5 -
Sales of
Product
Rendering
of services Royalties
Operating
lease
Other
operations
i i Commercial transactions with related parties – Costs
euro 000's
June 30th, 2017
Parent Company (*) 196 94 2,246 11
Directors
Other related parties
Total 196 94 - 2,246 11
June 30th, 2016
Parent Company (*) 86 277 2,260 185
Directors
Other related parties
Total 86 277 - 2,260 185
Other
operations
Purchases of
product
Rendering
of services Royalties
Operating
lease
(*) Companies directly or indirectly controlled by Chairman of the Board of Directors Diego Della Valle.

TOD’S Group 2017 Half Year Financial Report
06.30.2017
52 Supplementary notes
i i i Commercial transactions with related parties – Receivables and payables
Receivables and payables
euro 000's Receivables Payables Receivables Payables
Parent Company (*) 2,905 342 2,488 564
Directors
Other related parties
Total 2,905 342 2,488 564
06.30.17 06.30.16
.
(*) Companies directly or indirectly controlled by Chairman of the Board of Director s Diego Della Valle. .005 2.132Crdebiti 30.06.10 30.06.09
The purchased amount of ROGER VIVIER brand, purchased by Roger Vivier S.p.A. from the related
party Gousson Consultadoria e Marketing S.r. l. , a company controlled by the President of the
board of directors, Mr. Diego Della Valle, has been separately indicated in the face of the balance
sheet in accordance with CONSOB resolution n. 15519 of July 27t h
, 2006. The remaining amounts
of related party transactions indicated above have not been disclos ed separately in the face of
the financial statements because their amounts are not significant.
Transactions between Group companies included in the scope of consolidation have been
eliminated from the half-year condensed financial statements . Consequently, they have not been
highlighted in these notes.
Compensation of Directors, Statutory Auditors and General Managers
Compensation of Directors and Executives with strategic responsibilities of TOD’s S.p.A. have
been determined in accordance with the Com pensation Policy adopted by TOD’S S.p.A. Board of
Directors resolution at November 11t h
, 2011 as amended on November 12t h
, 2014 and, lastly, on
November 11t h
, 2015. For the first half of 2017 (including compensation for the activities
performed at subsidiaries) compensation amount to respectively 1.9 mill ion euros and 0.7 mill ion
euros.
Compensation for Statutory Auditors of TOD’S S.p.A. at June 30t h
, 2017 amount to 0.2 mill ion of
euro.
Moreover on April 20t h
, 2016 the Shareholders’ Meeting of TOD’S S.p.A. approved a Phantom
Stock Option Plan in favor of the Managing Director Stefano Sincini, as long -term incentive
benefit, consisting of a cash-settle payment, following the approval of the 2018 financial
statements, to be determined on the TOD’S share price with strike price established to euro
121.4.

TOD’S Group 2017 Half Year Financial Report
06.30.2017
53 Supplementary notes
18. Significant non-recurring transactions and events
The Group did not carry out any significant non -recurring transactions in the first half of year
2017.
19. Significant events occurred after the reporting period
No significant events occurred after the end of the reporting period.
TOD’S Group 2017 Half Year Financial Report
06.30.2017
5 4 Attestation
Attestation of the Half-Year condensed financial statements of TOD’S Group pursuant
article 154 bis of D.LGS. 58/98 and of article 81 -ter of Consob Regulation n. 11971 of
May 14t h
1999 and further modifications and integrations.
1 . The undersigned Stefano Sincini, Chief Executive Officer of TOD’S S.p.A., and Rodolfo Ubaldi,
manager responsible for the drawing up of the financial reports of TOD’S S.p.A., c ertify, in
accordance with the provisions of Article 154-bis, subsections 3 and 4, of Legislative Decree no.
58 of February 24t h
, 1998:
• the adequacy in terms of the company’s characteristics and
• effective application
of administrative and accounting procedures for preparation of the 2017 Half Year condensed
financial statements during the period January 1s t
, 2017 to June 30t h
, 2017.
2. They also certify that Half -Year condensed financial statements:
a) have been prepared in accordance with Internatio nal Financial Reporting Standards, as
endorsed by the European Union through Regulation (EC) 1606/2002 of the European
Parliament and Counsel, dated 19t h
July, 2002;
b ) correspond with the account book and ledger entries;
c) give a true and fair view of the assets, l iabilities, incom e and financial position of the
issuer and entities included in the scope of consolidation.
3. Interim report provides a reliable analysis of the significant events for the first six months of
the current fiscal year and the impact of such events on the H alf year condensed financial
statements as well as a description of the main risks and uncertainties for the s econd half of the
year in addition to a reliable analysis of the information on the significant related party
transactions.
Milan, August 3rd
, 2017
Manager responsible for drawing Chief Executive Officer up of the financial report
Stefano Sincini Rodolfo Ubaldi


![Toponymy Template - Map History · Web view276 Sanlucar de Barrameda s.lucar x x 1325 1403 Beccari, F. 78 9 zz 9 y y z → 9 9 0 0 → 278 Puerto de S. Maria p. s.maria [del porto]](https://static.documents.pub/doc/80x56/6025c3ca8f58616305061b31/toponymy-template-map-web-view-276-sanlucar-de-barrameda-slucar-x-x-1325-1403.jpg)


