17
Informe de Economía: Industria química por países y áreas UNIÓN EUROPEA Nº 1 2016 Con la colaboración de:

Informe de Economía: Industria química por países y áreasUNIÓN EUROPEA
Nº 12016
Con la colaboración de:

1
Nº 1 2016
Unión Europea Informe de Economía: Industria química por países y Áreas
INDEX
Foreword
Place of the EU chemicals in the European economy
Production
Sales
External Trade
Energy
Regulatory Costs
Investment
Environment

2
Nº 1 2016
Unión Europea Informe de Economía: Industria química por países y Áreas
FOREWORD
Foreword by René van Sloten, Executive Director, Industrial Policy Programme (Cefic) The European chemical industry, of which the Spanish chemical industry forms an important part, is key for economic development and wealth, providing modern products and materials and enabling technical solutions in virtually all sectors of the economy. With a workforce of 1.2 million and sales of €551 billion (2014), it is one of the largest industrial sectors and an important source of direct and indirect employment in many regions of the European Union. Despite the apparent strength of the industry, the current situation gives cause for concern. The chemical sector was severely affected by the 2008-09 global recession, and after a rapid cyclical turnaround, production remains 5.4% below pre-crisis levels. The world landscape of the chemical industry is changing rapidly. China continues to dominate the world ranking. Moreover, it is planning an ambitious industrial policy strategy to take its chemical industry to the next stage of development – a strategy outlined in the“13th Five-Year Plan” on the Chinese petroleum and chemical industry. China is looking to move from “following the lead” to “taking the lead” and from a “big country” to a “great power” of the petroleum and chemical industry, leading on technology innovation and trade and prevailing in international markets. On the other side of the Atlantic our industry is being challenged by the revival of the US chemical industry which is riding the shale gas boom. Some 200 chemical projects are planned totalling over 140 bn $ investment. In the Middle East Saudi Arabia is embarking on an ambitious strategy aiming to expand downstream production of chemicals. The EU chemicals market share nearly halved in 20 years, down from 32.2 per cent in 1994 to 17.0 per cent in 2014. This is a “dilution effect”, a trend expected to continue in the future. The EU chemical industry is expected to rank third in 2030. With 44% of world market share, China will continue to hold the top ranking in sales, a position once firmly held by Europe. Sales in Asia have grown to more than double those of the European Union. According to an Oxford Economics study on EU chemical industry competitiveness commissioned by Cefic (Oct. 2014), there are many potential reasons for this decline, including high energy prices, currency appreciation, high labour costs, regulatory and tax burdens, among other things. The chemical industry is an energy-intensive industry competing globally. Energy costs are the
1 Technopolis Group, Cumulative Cost Assessment for the EU Chemical Industry, document prepared for the European Commission, 2016, not yet published
European industry’s Achilles’ heel, especially compared to the oil and gas-rich Middle East, and more recently to the United States. Advantageous energy and feedstock prices are a clear enabler of competitiveness. The shale gas boom in the United States has greatly reduced energy and feedstock costs. A clear indicator of this situation is the cost of producing ethylene. Regulatory cost is another key factor shaping profitability of the chemicals sector. Existing EU legislation induces a wide variety of costs for the European chemical industry, which play a role in its ability to compete on a global scale. According to a cumulative cost assessment1, the combined EU regulatory cost on the chemical industry amounts to 30% of the Gross Operating Surplus, indicating that the cost of regulation is a significant factor shaping the profitability of the chemical industry. It is also in the same magnitude to the sector’s yearly R&D spending. Competitiveness challenges continue to increase primarily due to high energy costs relative to other regions and a burdensome EU regulatory environment. Indeed, after years of high energy costs, despite the sharp recent decrease, significant differential remains compared to other regions and will worsen when the oil price will surge again. The industry needs access to energy and (renewable) raw materials at competitive prices. We need also regulatory stability and consistency, and better regulation in order to alleviate the burdensome regulatory environment, as evidenced by the cumulative cost assessment study on the EU chemical industry. I am confident, however, that if these conditions are created in Europe the European chemical industry can continue to play its role as innovator and enabler of a sustainable economy. Chemistry can provide the solutions for the challenges of the world, and Cefic will work to ensure these solutions are developed in Europe.
René van Sloten

3
Nº 1 2016
Unión Europea Informe de Economía: Industria química por países y Áreas
Contribution of the chemical industry to the EU Economy
PLACE OF THE EU CHEMICALS IN THE EUROPEAN ECONOMY
The chemical industry underpins virtually all sectors of the economy and its strategies impact directly on downstream chemicals users. The big industrial users of chemicals are rubber and plastics, construction, pulp and paper, and the automotive industry. Nearly two-thirds of EU chemicals are supplied to the EU industrial sector, including construction. More than one-third of chemicals go to other branches of the EU economy such as agriculture, services and other business activities. The EU chemical industry also makes technology transfer through sales to all other sectors.
The chemical industry contribution to EU gross domestic product (GDP) amounts to 1.1 per cent. This may seem small at first, but should be reassessed taking into consideration the shrinking contribution by manufacturing in many advanced economies, coupled with a rise in service sector output. Cefic supports the Commission’s objective for industrial activity to contribute 20% of GDP by 2020, which should be seen as a directional rather than absolute target. The scale of the task should not be underestimated. Today, industry contributes about 15% of GDP, and investment in industry is in decline. Because of decreasing investment in primary production, Europe is losing ground in terms of technological capability, and existing European value chains are at risk.
Source: Eurostat Data (Input-Ouput 2000) and Cefic analysis.

4
Nº 1 2016
Unión Europea Informe de Economía: Industria química por países y Áreas
PRODUCTION
Situational analysis of the EU chemical industry The European chemical industry is key for economic development and wealth, providing modern products and materials and enabling technical solutions in virtually all sectors of the economy. With a workforce of 1.2 million and sales of €551 billion (2014), it is one of the largest industrial sectors and an important source of direct and indirect employment in many regions of the European Union. Traditionally, Europe has been a leader in chemicals production. Despite the apparent strength of the industry, the current situation gives cause for concern. The chemical sector was severely affected by the 2008-09 global recession, and after a rapid cyclical turnaround, production is growing more slowly than global demand since early 2011. According to the Eurostat data, the sector remains 5.4% below pre-crisis levels (Q4-2015 compared to Q1-2008)
Source: Cefic Chemidata International *Chemicals (excluding pharmaceuticals, Nace Rev2. C20)
Stagnant growth for the EU chemical sector

5
Nº 1 2016
Unión Europea Informe de Economía: Industria química por países y Áreas
SALES Asian outpaces other regions
World chemicals turnover was valued at €3,232 billion in 2014. Global sales grew by 2.6 per cent from €3,151 billion in 2013 to €3,232 billion in 2014. The sales growth rate was considerably lower compared to the 10 year trend, when average annual sales expanded by nearly 9.0 per cent from 2003 to 2013. World chemicals sales in 2014 grew by nearly €81 billion compared with 2013, marking a modest recovery in the world chemical industry. It was largely driven by China, where chemicals sales swelled from €1,007 billion in 2013 to €1,111 billion in 2014.
The EU chemical industry ranks second, along with the United States, in total sales. When including both the European Union and non-EU countries in Europe, total sales reached €649 billion in 2014, or 20 per cent of world chemicals sales in value terms. Worldwide competition has racheted up in the last ten years, however, as China holds the top ranking in sales – a position once firmly held by Europe. The graph shows chemicals sales in Asia have grown to more than double those of the European Union. China continues to dominate the world ranking. China sales levels are as high as the next six countries combined, as much as the NAFTA and EU markets put together. In 2014, the 30 largest chemical-producing countries had a combined turnover of €2,815 billion. Twelve of the top 30 biggest producers are Asian, generating chemicals sales of €1,677 billion, a 58.4 per cent share of chemical sales among the top 30 producing markets and 51.9 per cent of the world market. The world landscape of the chemical industry is changing rapidly. China is planning an ambitious industrial policy strategy to take its chemical industry to the next stage of development – a strategy outlined in the“13th Five-Year Plan” on the Chinese petroleum and chemical industry. China is looking to move from “following the lead” to “taking the
Chemicals sales by country top 10
World chemicals sales: geographic breakdown
Source: Cefic Chemidata International *Rest. Of Europe covers Switzerland, Norway, Turkey, Russia and Ukraine **Noth American Free Trade Agreement ***Asia excluding China, India, Japan and South Korea
6
Nº 1 2016
Unión Europea Informe de Economía: Industria química por países y Áreas
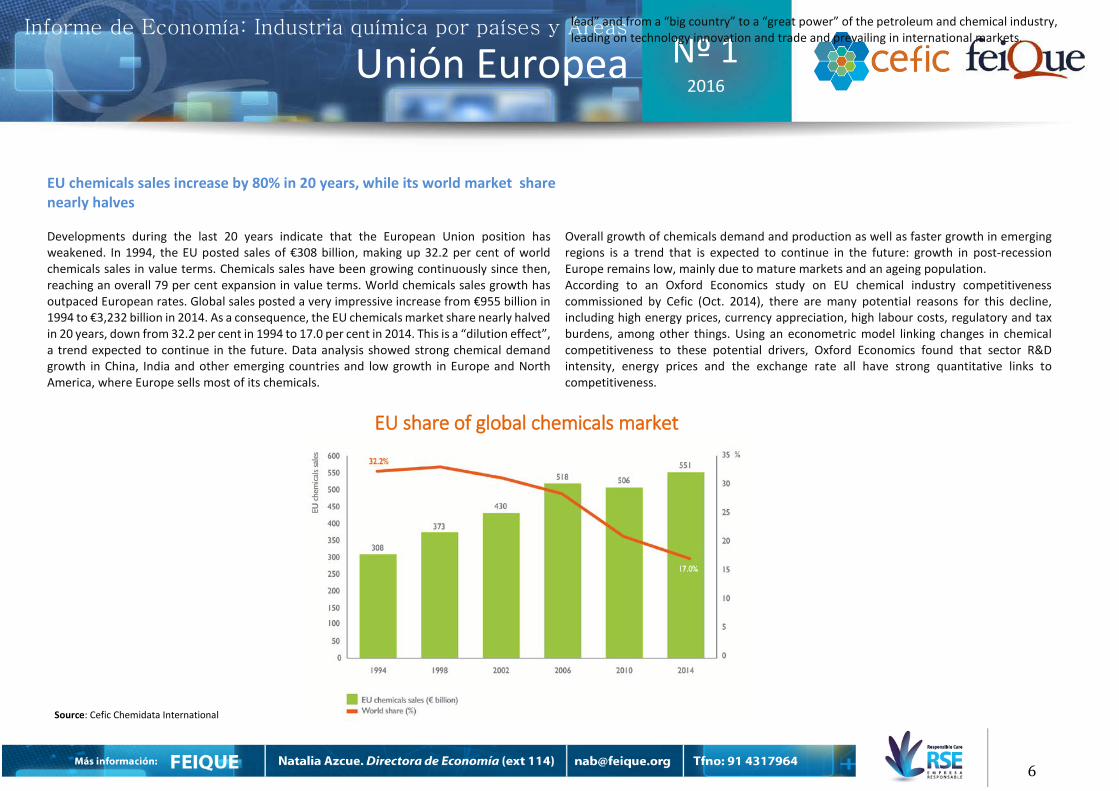
EU share of global chemicals market
lead” and from a “big country” to a “great power” of the petroleum and chemical industry, leading on technology innovation and trade and prevailing in international markets.
EU chemicals sales increase by 80% in 20 years, while its world market share nearly halves
Developments during the last 20 years indicate that the European Union position has weakened. In 1994, the EU posted sales of €308 billion, making up 32.2 per cent of world chemicals sales in value terms. Chemicals sales have been growing continuously since then, reaching an overall 79 per cent expansion in value terms. World chemicals sales growth has outpaced European rates. Global sales posted a very impressive increase from €955 billion in 1994 to €3,232 billion in 2014. As a consequence, the EU chemicals market share nearly halved in 20 years, down from 32.2 per cent in 1994 to 17.0 per cent in 2014. This is a “dilution effect”, a trend expected to continue in the future. Data analysis showed strong chemical demand growth in China, India and other emerging countries and low growth in Europe and North America, where Europe sells most of its chemicals.
Overall growth of chemicals demand and production as well as faster growth in emerging regions is a trend that is expected to continue in the future: growth in post-recession Europe remains low, mainly due to mature markets and an ageing population. According to an Oxford Economics study on EU chemical industry competitiveness commissioned by Cefic (Oct. 2014), there are many potential reasons for this decline, including high energy prices, currency appreciation, high labour costs, regulatory and tax burdens, among other things. Using an econometric model linking changes in chemical competitiveness to these potential drivers, Oxford Economics found that sector R&D intensity, energy prices and the exchange rate all have strong quantitative links to competitiveness.
Source: Cefic Chemidata International

7
Nº 1 2016
Unión Europea Informe de Economía: Industria química por países y Áreas
Trends in overall growth expected to continue – EU share goes down
Long-term analysis shows that overall growth of chemicals demand and production as well as faster growth in emerging regions is a trend that is expected to continue in the future. World chemicals sales are expected to reach the level of €6.3 trillion in 2030. The EU chemical industry is expected to rank third. With 44% of world market share, China will continue to hold the top ranking in sales, a position once firmly held by Europe. The graph shows chemicals sales in Asia have grown to more than double those of the European Union. Although competition in China’s chemical market is currently intensifying and demand growth is weaker than in the past, China still offers a huge and attractive market both for chemical suppliers and their customer industries. In the mid-term, European chemical producers – due to their high technological capabilities and innovative products –are expected to benefit from a robust growth trend in China, both in increased exports or via local investments. To what extent depends on the competitive situation in each market segment and the development of final customer markets that rely on the chemical industry – for example consumer chemicals, automotive, electronics, food and nutrition, etc.
Growth in world chemicals sales 2014-2030
Source: Cefic Chemidata International *Rest of Europe covers Switzerland, Norway, Turkey, Russia and Ukraine **North American Free Trade Agreement ***Asia excluding China and Japan

8
Nº 1 2016
Unión Europea Informe de Economía: Industria química por países y Áreas
EXTERNAL TRADE
EU chemical trade surplus at €43.5 billion in 2014
Trading chemicals around the world stimulates competition, provides an incentive to develop new markets through innovation and stimulates production efficiency. But above all, it helps to improve the quality of human life. As a historically important player in the global chemicals market, the EU chemical industry continues to benefit from trade opportunities. The chart shows that the EU chemical industry registered a solid recovery in 2013 after the 2008 economic crisis, posting a record extra-EU net trade surplus of €48.2 billion. It registered a significant trade surplus of €43.5 billion in 2014. Data analysis indicates however that chemical imports are tending to increase while chemicals exports show a flat line. We need more open competition and open markets. Europe’s net chemical exports last year were €44 billion, but the surplus is declining. Trade agreements with key partners such as the US and Japan would enable our industry to enhance efficiency and better exploit our technical strengths.
Source: Cefic Chemidata International.
Extra-EU chemicals trade balance

9
Nº 1 2016
Unión Europea Informe de Economía: Industria química por países y Áreas
Extra-EU chemicals trade flow, calculated as total exports plus imports, was valued at nearly €232 billion in 2014. The top 10 EU partners accounted for 71% of extra-EU chemicals trade in the same year. The US was by far the EU’s biggest trading partner in chemicals in 2014. It buys €25.5 billion of EU exports, nearly 20% of the EU chemicals total every year, whilst providing €20.4 billion of EU imports.
Transatlantic trade flows are expected to change considerably in the next five years, because the US shale gas boom has triggered a massive build-up of new chemicals production capacity there. Any EU-US deal therefore needs to contain strong provisions regarding access for EU companies to US energy and feedstock. This could help improve the competitiveness of the European chemical industry by narrowing the gas price gap with the US. This is especially important for sectors such as petrochemicals and polymers, which have already lost global export competitiveness in the past decade. For these sectors, gas can account for as much as 60% of operating costs, being used both as a feedstock and to provide energy for crackers. Today China is the EU’s second-biggest chemicals trading partner, accounting for 8 per cent of EU exports. China has become the most important growth market for global chemical companies and a major investment location. Whilst Chinese chemical companies are gradually increasing their focus on specialty chemicals, the country will remain a major importer of commodity chemicals for some time to come. Chinese expansion does not necessarily imply Europe loses out. Rather, there are wins for both, and China offers many opportunities.
Source: Cefic Chemidata international *Trade = exports + imports
Extra-EU chemicals trade* flows with top EU partners

10
Nº 1 2016
Unión Europea Informe de Economía: Industria química por países y Áreas
ENERGY
Energy costs are the European industry’s Achilles’ heel
The chemical industry is an energy-intensive industry competing globally. Anything that increases energy costs in Europe relative to our competitors has a major impact on competitiveness. Energy costs are the European industry’s Achilles’ heel, especially compared to the oil and gas-rich Middle East, and more recently to the United States, which is riding on a shale gas boom. Advantageous energy and feedstock prices are a clear enabler of competitiveness. The shale gas boom in the United States has greatly reduced energy and feedstock costs. A clear indicator of this situation is the cost of producing ethylene.
Ethylene is the highest volume building block in the chemical industry globally. It is the foundation in the production of plastics, detergents and coatings amongst many other materials. Making ethylene in Europe was three times more expensive than in the US in 2013 (due to the shale gas boom) or the Middle East. This is boosting profits abroad and attracting billions of dollars in investment, including from European chemical companies. The latest developments in oil prices have significantly reduced EU costs vis-à-vis the USA. However, the EU-US gap in terms of cost remains a serious handicap for the base chemicals industry in Europe. Last but not least, the arrival of Iran on the world’s crude markets could change the scenario. For many reasons, it is good to see Iran integrating with the world’s economy. Its return to the world’s crude markets will contribute to the supply side, and hopefully to long-term low prices.
Source: CEFIC
Average ethylene cash costs In the EU vs North America
Source: ICIS and Cefic Analysis

11
Nº 1 2016
Unión Europea Informe de Economía: Industria química por países y Áreas
Energy intensity in the EU Chemical industry
EU chemicals energy intensity slashed in half during 23 year period
For many years, the EU chemical industry, including pharmaceuticals, has made strenuous efforts to improve energy efficiency by reducing its fuel and power energy consumption per unit of production. By 2013, energy intensity – energy consumption per unit of production – in the chemical industry, including pharmaceuticals, was 55.4 per cent lower than in 1990. Further improvements to energy efficiency are subject to decreasing returns, however. The chemical industry succeeded during the 23 years from 1990 to 2013 in continuously increasing its output while at the same time keeping its energy input constant. As a result, the EU chemical industry has excelled in significantly lowering its energy intensity by an average of 3.4 per cent per year.
The chemical industry is an energy-intensive industry competing globally. The shale gas revolution in the United States is having an impact on the European chemical and manufacturing industries, as the availability of energy and feedstock from shale gas creates a significant competitive advantage for the US industry. With the exception of the Middle East, where energy and feedstock resources are plentiful, regions not having access to shale gas are suffering from a competitive disadvantage. Shale gas is being developed on a global scale, so other world regions will potentially take advantage of similar benefits in the future.
Source: Eurostat and Cefic Analysis *Energy intensity is measured by energy input per unit of chemicals production (including pharmaceuticals)

12
Nº 1 2016
Unión Europea Informe de Economía: Industria química por países y Áreas
REGULATERY COSTS
Regulatory costs are shaping profitabilityof the chemicals sector Existing EU legislation induces a wide variety of costs for the European chemical industry, which
play a role in its ability to compete on a global scale. Under the REFIT Programme, the European Commission is undertaking an evaluation of the cumulative costs arising from existing EU legislation for the European chemical industry (Cumulative Cost Assessment – CCA). The aim is to have a better understanding of how costs induced by EU legislation affect the sector’s international competitiveness, complementing the evidence-base for future policy-making decisions.
According to initial results of the CCA: in the EU, the total cost of legislation that companies from the six subsectors had to bear amounts to €10 billion per year on average, over the period 2004-2014. When compared to value added, which represents the value generated by the industry, the share of regulatory costs increases to 12% of the value added. Compared to Gross Operating Surplus (GOS), which can be used as a proxy for profit, the cost reaches 30%, indicating that the legislation cost is among the important factors shaping the profitability of the chemical industry. Among the legislation packages, the three main drivers of regulatory cost are industrial emissions (33%), chemicals (30%) and workers safety (24%) – amounting to 87% of the total regulatory costs. The variability of cost across the different subsectors is significant. The higher cost as a percentage of value added is observed in pesticides and other agrochemicals, amounting to 23.2%, and the lowest in plastics at 2.7%. The cost for specialty chemicals represents 16.7% of the value added, for inorganic basic chemicals amounts to 12.1%, for organics basic chemicals is 11.3% and for soaps and detergents is 11.4%.
Significance of EU regulatory cost For the chemicals sector
Source: Technopolys Group, Cumulative Cost Assessment for the EU Chemical industry, document prepared for the European Commission, 2016, not yet published

13
Nº 1 2016
Unión Europea Informe de Economía: Industria química por países y Áreas
Regulatory cost has doubled the last ten years
The chart below illustrates very well the rising legislation costs during the period 2004-2014, with major milestones being the introduction of REACH and CLP in 2007 and 2008 respectively and the investment of companies after 2009 in anticipation of the enforcement of Seveso III in 2012 and ETS Phase 3 in 2013. Energy legislation also contributes to the rising costs, especially after 2012.
The chemical industry will face increasing costs to comply with stricter emission limit values, more ambitious CO2 emission reduction targets and energy efficiency objectives. One can expect that REACH costs will decrease after 2018, while the cost of compliance with biocidal product and plant protection product regulations will continue to expand. Costs of compliance with workers’ safety and transport legislation should remain stable. The CCA is not a deregulation exercise but a tool to inform policy-makers about the impact of regulation on the competitiveness of the chemical industry operating in Europe. Alongside the CCA, the Commission is carrying out a number of ex-post evaluations, including a Fitness Check on Chemical Legislation and a review of REACH. The ultimate goal is to check if existing legislation is achieving its objectives in the most efficient way, consistently with other rules and policies. Where inefficiencies occur, these should be mitigated without reducing existing levels of health, safety and environmental protection. Europe’s chemical industry needs a regulatory framework that is fit for purpose, consistent, cost-effective and which does not negatively impact its competitiveness vs other regions.
Legislation cost during the period 2004-2014
Source: Technopolis Group, Cumulative Cost Assessment for the EU Chemical Industry, document prepared for the European Commission, 2016, not yet published and Cefic analysis

14
Nº 1 2016
Unión Europea Informe de Economía: Industria química por países y Áreas
INVESTMENT Investment in the EU chemical industry has been following a worrying trend
The chart below illustrates clearly that investment (in absolute figures) in the European Union had been increasing from 2004 to 2008, registering a positive trend at a consistent pace. Investment during 2010, however, experienced a steep decline compared to 2008, down by 23.9 per cent. This was followed by a significant increase from €16.2 billion in 2010 to €19.4 billion in 2012. The chemicals sector registered a decrease in investment in 2013, moving down to €18.3 billion in 2013 and slightly up to €18.6 billion in 2014.
In relative terms, however, the ratio of capital spending to sales, or capital intensity, of the European Union chemical industry has been declining since 1999, reaching the value of 3.4 per cent in 2014, down from 5.8 per cent registered in 1999. Capital investment is a key factor in securing the future development of the chemical industry. And, in many cases, major equipment or plant renewals require long-term planning. Such investments are not only related to the improvement of productivity or introduction of new products but are also due to the need to comply with regulations or reduce operating costs (Source: European Commission (2009a), “High Level Group on the Competitiveness of the European Chemical Industry”). A Cefic survey among major chemical companies revealed a shift of investment from the EU to countries outside the EU between 2008 and 2013. Data analysis showed that the share of domestic investment to total investment moved down significantly by 10 percentage points between 2008 and 2013, indicating that the EU business and economic environment is becoming less attractive for EU chemical companies. The European chemical industry needs to maintain investment in its existing infrastructure and in new production facilities to ensure the chemicals sector has a viable and vibrant future. On the sectoral side, the chemical industry subsectors with the highest gross investments in tangible goods, in absolute and relative terms, are petrochemicals, inorganic basic chemicals, plastics in primary forms, fertilisers and nitrogen compounds. The synthetic rubber subsector, at the bottom
Capital spending in the EU Chemical industry
Source: Cefic Chemdata International

15
Nº 1 2016
Unión Europea Informe de Economía: Industria química por países y Áreas
Capital spending by region
According to Cefic Chemdata, industry capital spending in the European Union reached the level of €18.6 billion in 2014. It represents 13.6 per cent of the €136.4 billion spent by the eight largest chemical investing countries. This figure is very low compared to the one experienced 10 years ago, when EU chemicals investment represented 33.6 per cent of the €45.5 billion spent by the eight largest chemical-investing countries.
With regard to China, the situation in 2014 was very spectacular, with Chinese chemical industry spending reaching €76.5 billion, representing half of the total amount invested by the eight largest countries in terms of chemical industry capital spending. The United States continued to see a rise in capital spending as a result of the shale gas and oil boom. The European Union is in a better position compared with Japan, Korea, Russia, India and Brazil.
Source: Cefic Chemdata International

16
Nº 1 2016
Unión Europea Informe de Economía: Industria química por países y Áreas
ENVIRONMENT
Greenhouse gas intensity plummets 75% since 1990
Over the last two decades, the chemical industry, including pharmaceuticals, has made an enormous effort to minimise the environmental impact of its production. Greenhouse gas (GHG) emissions per unit of energy consumption fell by 45 per cent between 1990 and 2013. GHG intensity – the GHG emissions per unit of production – fell by 75 per cent from 1990 to 2013. Until a global agreement on climate change provides for a level playing field for the chemical industry and other energy-intensive sectors, best performers should not be penalised by direct or indirect costs resulting from EU climate policies. The goal of a competitive, low carbon economy should not be pursued at “any price,” and cannot be achieved by making the European economy less competitive.
Greenhouse gas emissions per unit Of energy consumption and per
Unit of production*
Source: Eurostat and Cefic analysis *Including pharmaceuticals


