Informedia @ TRECVID 2011 Lei Bao 2,3,4 , Longfei Zhang 1,2 , Shoou-I Yu 2 , Zhen-zhong Lan 2 , Lu Jiang 2 , Arnold Overwijk 2 , Qin Jin 2 , Shohei Takahashi 5 , Brian Langner 2 , Yuanpeng Li 2 , Michael Garbus 2 , Susanne Burger 2 , Florian Metze 2 , and Alexander Hauptmann 2 1 School of Software, Beijing Institute of Technology, Beijing, 100081, P.R China 2 School of Computer Science, Carnegie Mellon University, Pittsburgh PA 15213, USA 3 Laboratory for Advanced Computing Technology Research, ICT, CAS, Beijing 100190, China 4 Graduate University of Chinese Academy of Sciences, Beijing 100049, China 5 Graduate School of Global Information and Telecommunication Studies, Waseda University, Tokyo, Japan The Informedia group participated in three tasks this year, including Multimedia Event Detection (MED), Semantic Indexing (SIN) and Surveillance Event Detection (SED). The first half of the report describes our efforts on MED and SIN, while the second part discusses our approaches to SED. For Multimedia Event Detection and Semantic Indexing of concepts, generally, both of these tasks consist of three main steps: extracting features, training detectors and fusion. In the feature extraction part, we extracted many low-level features, high-level features and text features. Specifically, we used the Spatial- Pyramid Matching technique to represent the low-level visual local features, such as SIFT and MoSIFT, which describe the location information of feature points. In the detector training part, besides the traditional SVM, we proposed a Sequential Boosting SVM classifier to deal with the large-scale unbalanced data classification problem. In the fusion part, to take the advantage of different features, we tried three different fusion methods: early fusion, late fusion and double fusion. Double fusion is a combination of early fusion and late fusion. The experimental results demonstrated that double fusion is consistently better than or at worst comparable to early fusion and late fusion. The Surveillance Event Detection report in the second half of this paper presents a generic event detection system evaluated in the SED task of TRECVID 2011. We investigated a generic statistical approach with spatio-temporal features applied to seven events, which were defined by the SED task. This approach is based on local spatio-temporal descriptors, called MoSIFT, and generated from pair-wise video frames. Visual vocabularies are generated by cluster centers of MoSIFT features, which were sampled from the video clips. We also estimated the spatial distribution of actions by over-generated person detection and background subtraction. Different sliding window sizes and steps were adopted for different events based on the event duration priors. Several sets of one-against-all action classifiers were trained using cascade non-linear SVMs and Random Forests, which improved the classification performance on unbalanced data just like the SED datasets. Results of 9 runs were presented with variations in i) sliding window size ii) step size of BOW, iii) classifier threshold and iv) classifiers. The performance shows improvement over last year on the event detection task. Acknowledgments: This work was supported in part by the National Science Foundation under Grant No. IIS-0205219 and Grant No. IIS-0705491. The work was also supported in part by the Intelligence Advanced Research Projects Activity (IARPA) via Department of Interior National Business Center contract number D11PC20068. The U.S. Government is authorized to reproduce and distribute reprints for Governmental purposes notwithstanding any copyright annotation thereon. Disclaimer: The views and conclusions contained herein are those of the authors and should not be interpreted as necessarily representing the official policies or endorsements, either expressed or implied, of IARPA, DoI/NBC, or the U.S. Government.
Transcript
Informedia @ TRECVID 2011 Lei Bao2,3,4 , Longfei Zhang1,2, Shoou-I Yu2, Zhen-zhong Lan2, Lu Jiang2, Arnold Overwijk2, Qin
Jin2, Shohei Takahashi5, Brian Langner2, Yuanpeng Li2, Michael Garbus2, Susanne Burger2, Florian Metze2, and Alexander Hauptmann2
1 School of Software, Beijing Institute of Technology, Beijing, 100081, P.R China
2 School of Computer Science, Carnegie Mellon University, Pittsburgh PA 15213, USA 3 Laboratory for Advanced Computing Technology Research, ICT, CAS, Beijing 100190, China
4 Graduate University of Chinese Academy of Sciences, Beijing 100049, China 5 Graduate School of Global Information and Telecommunication Studies, Waseda University, Tokyo, Japan
The Informedia group participated in three tasks this year, including Multimedia Event Detection (MED), Semantic Indexing (SIN) and Surveillance Event Detection (SED). The first half of the report describes our efforts on MED and SIN, while the second part discusses our approaches to SED.
For Multimedia Event Detection and Semantic Indexing of concepts, generally, both of these tasks consist of three main steps: extracting features, training detectors and fusion. In the feature extraction part, we extracted many low-level features, high-level features and text features. Specifically, we used the Spatial-Pyramid Matching technique to represent the low-level visual local features, such as SIFT and MoSIFT, which describe the location information of feature points. In the detector training part, besides the traditional SVM, we proposed a Sequential Boosting SVM classifier to deal with the large-scale unbalanced data classification problem. In the fusion part, to take the advantage of different features, we tried three different fusion methods: early fusion, late fusion and double fusion. Double fusion is a combination of early fusion and late fusion. The experimental results demonstrated that double fusion is consistently better than or at worst comparable to early fusion and late fusion. The Surveillance Event Detection report in the second half of this paper presents a generic event detection system evaluated in the SED task of TRECVID 2011. We investigated a generic statistical approach with spatio-temporal features applied to seven events, which were defined by the SED task. This approach is based on local spatio-temporal descriptors, called MoSIFT, and generated from pair-wise video frames. Visual vocabularies are generated by cluster centers of MoSIFT features, which were sampled from the video clips. We also estimated the spatial distribution of actions by over-generated person detection and background subtraction. Different sliding window sizes and steps were adopted for different events based on the event duration priors. Several sets of one-against-all action classifiers were trained using cascade non-linear SVMs and Random Forests, which improved the classification performance on unbalanced data just like the SED datasets. Results of 9 runs were presented with variations in i) sliding window size ii) step size of BOW, iii) classifier threshold and iv) classifiers. The performance shows improvement over last year on the event detection task. Acknowledgments: This work was supported in part by the National Science Foundation under Grant No. IIS-0205219 and Grant No. IIS-0705491. The work was also supported in part by the Intelligence Advanced Research Projects Activity (IARPA) via Department of Interior National Business Center contract number D11PC20068. The U.S. Government is authorized to reproduce and distribute reprints for Governmental purposes notwithstanding any copyright annotation thereon. Disclaimer: The views and conclusions contained herein are those of the authors and should not be interpreted as necessarily representing the official policies or endorsements, either expressed or implied, of IARPA, DoI/NBC, or the U.S. Government.
Lei Bao1,2,3, Shoou-I Yu1, Zhen-zhong Lan1, Arnold Overwijk1, Qin Jin1,Brian Langner1, Michael Garbus1, Susanne Burger1, Florian Metze1, Alexander Hauptmann1
1Language Technologies Institute, Carnegie Mellon University, Pittsburgh, PA 15213, USA2Laboratory for Advanced Computing Technology Research, ICT, CAS, Beijing 100190, China
3Graduate University of Chinese Academy of Sciences, Beijing 100049, China
Abstract
We report on our results in the TRECVID 2011 Multimedia Event Detection(MED) and Semantic Indexing (SIN) tasks. Generally, both of these tasks con-sist of three main steps: extracting features, training detectors and fusing. In thefeature extraction part, we extracted many low-level features, high-level featuresand text features. We used the Spatial-Pyramid Matching technique to representthe low-level visual local features, such as SIFT and MoSIFT, which describe thelocation information of feature points. In the detector training part, besides thetraditional SVM, we proposed a Sequential Boosting SVM classifier to deal withthe large-scale unbalanced classification problem. In the fusion part, to take theadvantages from different features, we tried three different fusion methods: earlyfusion, late fusion and double fusion. Double fusion is a combination of earlyfusion and late fusion. The experimental results demonstrated that double fusionis consistently better than or at least comparable to early fusion and late fusion.
1 Multimedia Event Detection (MED)
1.1 Feature Extraction
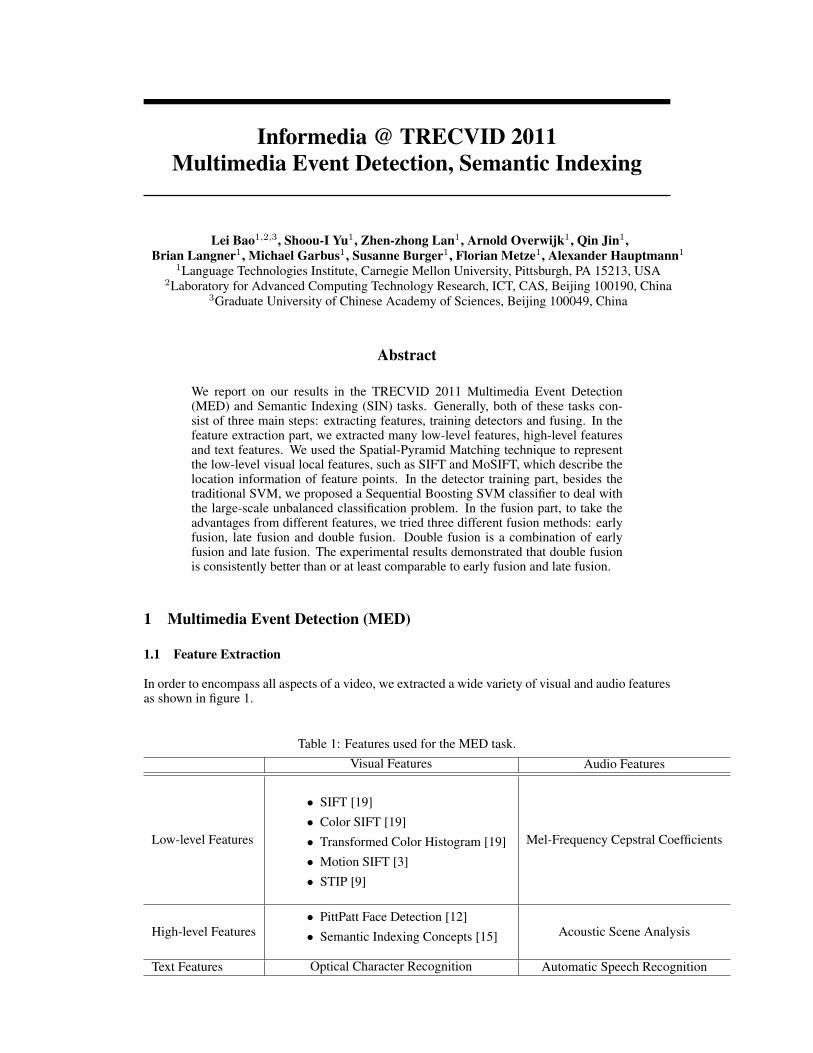
In order to encompass all aspects of a video, we extracted a wide variety of visual and audio featuresas shown in figure 1.
Table 1: Features used for the MED task.Visual Features Audio Features
Low-level Features
• SIFT [19]• Color SIFT [19]• Transformed Color Histogram [19]• Motion SIFT [3]• STIP [9]
Mel-Frequency Cepstral Coefficients
High-level Features• PittPatt Face Detection [12]• Semantic Indexing Concepts [15] Acoustic Scene Analysis
Text Features Optical Character Recognition Automatic Speech Recognition
1.1.1 SIFT, Color SIFT (CSIFT), Transformed Color Histogram (TCH)
These three features describe the gradient and color information of a static image. We used theHarris-Laplace detector for corner detection. For more details, please see [19]. Instead of extractingfeatures from all frames for all videos, we first run shot-break detection and only extract featuresfrom the keyframe of a corresponding shot. The shot-break detection algorithm detects large colorhistogram differences between adjacent frames and a shot-boundary is detected when the histogramdifference is larger than a threshold. For the 16507 training videos, we extracted 572,881 keyframes.For the 32061 testing videos, we extracted 1,035,412 keyframes.
Once we have the keyframes, we extract the three features as in [19]. Given the raw feature files, a4096 word codebook is acquired using the K-Means clustering algorithm. According to the code-book and given a region in an image, we can create a 4096 dimensional vector representing thatregion. Using the Spatial-Pyramid Matching [10] technique, we extract 8 regions from an keyframeimage and calculate a bag-of-words vector for each region. At the end, we get a 8× 4096 = 32768dimensional bag-of-words vector. The 8 regions are calculated as follows.
• The whole image as one region.
• Split the image into 4 quadrants and each quadrant is a region.
• Split the image horizontally into 3 equally sized rectangles and each rectangle is a region.
Since we only have feature vectors describing a keyframe, and a video is described by manykeyframes, we compute a vector representing a whole video by averaging over the feature vectorsfrom each keyframe. The features are then provided to a classifier for classification.
1.1.2 Motion SIFT (MoSIFT)
Motion SIFT [3] is a motion-based feature that combines information from SIFT and optical flow.The algorithm first extract SIFT points, and for each SIFT point, it checks whether there is a largeenough optical flow near the point. If the optical flow value is larger than a threshold, a 256 dimen-sional feature is computed for that point. The first 128 dimensions of the feature vector is the SIFTdescriptor, and the latter 128 dimensions describes the optical flow near the point. We extractedMotion SIFT by calculating the optical flow between neighboring frames, but due to speed issues,we only extract Motion SIFT for the every third frame. Once we have the raw features, a 4096 di-mensional codebook is computed, and using the same process as SIFT, a 32768 dimensional vectoris created for classification.
1.1.3 Space-Time Interest Points (STIP)
Space-Time Interest Points are computed like in [9]. Given the raw features, a 4096 dimensionalcode is computed, and using the same process as SIFT, a 32768 dimensional vector is created forclassification.
1.1.4 Semantic Indexing (SIN)
We predicted the 346 semantic concepts from Semantic Indexing 11 onto the MED keyframes. Fordetails on how we created the models for the 346 concepts, please refer to section 2. Once we havethe prediction scores of each concept on each keyframe, we compute a 346 dimensional featurethat represents a video. The value of each dimension is the mean value of the concept predictionscores on all keyframes in a given video. We tried out different kinds of score merging techniques,including mean and max, and mean had the best performance. These features are then provided to aclassifier for classification.
1.1.5 Face
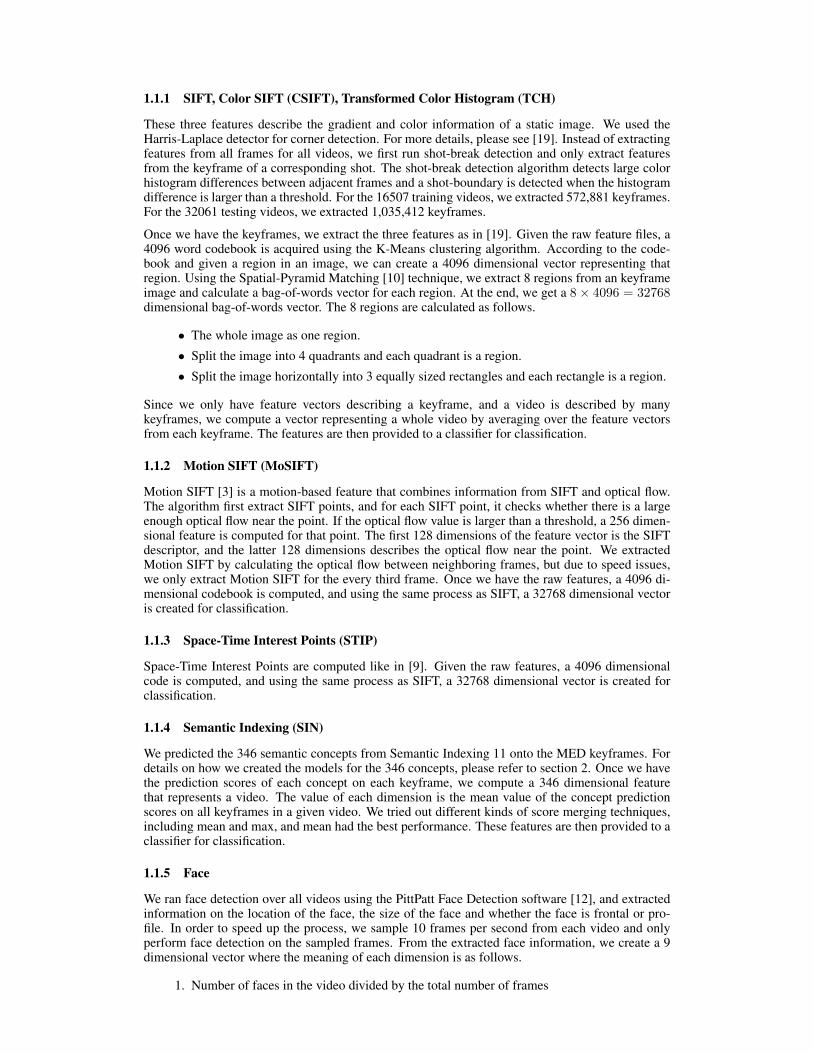
We ran face detection over all videos using the PittPatt Face Detection software [12], and extractedinformation on the location of the face, the size of the face and whether the face is frontal or pro-file. In order to speed up the process, we sample 10 frames per second from each video and onlyperform face detection on the sampled frames. From the extracted face information, we create a 9dimensional vector where the meaning of each dimension is as follows.
1. Number of faces in the video divided by the total number of frames
2. Maximum number of faces in a frame in the whole video.3. Number of frames with more than (including) one face divided by the total number of
frames.4. Number of frames with more than (including) two faces divided by the total number of
frames.5. Number of frontal faces divided by the total number of faces.6. The median of the ratio face width
frame width for all faces in the video.
7. The median of the ratio face heightframe height for all faces in the video.
8. Number of frames in the center of the frame divided by total number of faces. If w and his the width and height of the video respectively, and let (x, y) be the location of the centerof a face, then the face is in the center of the frame if w
4 ≤ x ≤ 3×w4 and h
4 ≤ y ≤ 3×h4 .
9. Median of the confidences of all faces in the video.
We did not perform face tracking or face identification.
1.1.6 Optical Character Recognition (OCR)
We used the Informedia system [5] to extract the OCR. We extracted OCR at a sample rate of 10frames per second. For details of the OCR process, please refer to [11]. Once we have the OCRoutput, we create TF-IDF [13] bag-of-words features for each video. Since OCR rarely gets a wordcompletely correct, the vocabulary we use here is a trigram of characters. For example the word”rarely” will be split into ”rar”, ”are”, ”rel” and ”ely”. In this way, if one of the characters was missrecognized, there are still some trigrams that are correct.
1.1.7 Automatic Speech Recognition (ASR)
We run automatic speech recognition using the Janus [17] and the Microsoft ASR system. Oncecompleted, for each video, we combine the output of each system into one file and view it as adocument. We then perform stemming using the Porter Stemmer, and calculate the TF-IDF [13]bag-of-words vectors for each video.
1.1.8 Mel-Frequency Cepstral Coefficients (MFCC)
We extracted Mel-frequency cepstral coefficients (MFCC) features using the Janus system. Giventhe raw features, we treat the raw features as a computer vision feature (e.g. SIFT) and run theMFCC features through the same computer vision pipeline. Therefore, we compute a 4096 wordcodebook and aggregate all MFCC features in one video to create a 4096 dimensional bag-of-wordsvector. Spatial Pyramid Matching is not reasonable here, so it is not applied.
1.1.9 Acoustic Scene Analysis (ASA)
An expert manually annotated about 3 hours (≈ 120 files) of videos with 42 semantic concepts,which can be derived from the audio: a small ontology links the annotated ”small engine” soundconcept to video concepts, and the words mentioned in the event kits. Using these labels, we trained42 Gaussian Mixture Models, which we connected as an ergodic Hidden Markov Model, used todecode the test data with Viterbi. The symbol sequence generated by this step is treated as a bag-of-word, and fed into an SVM classifier.
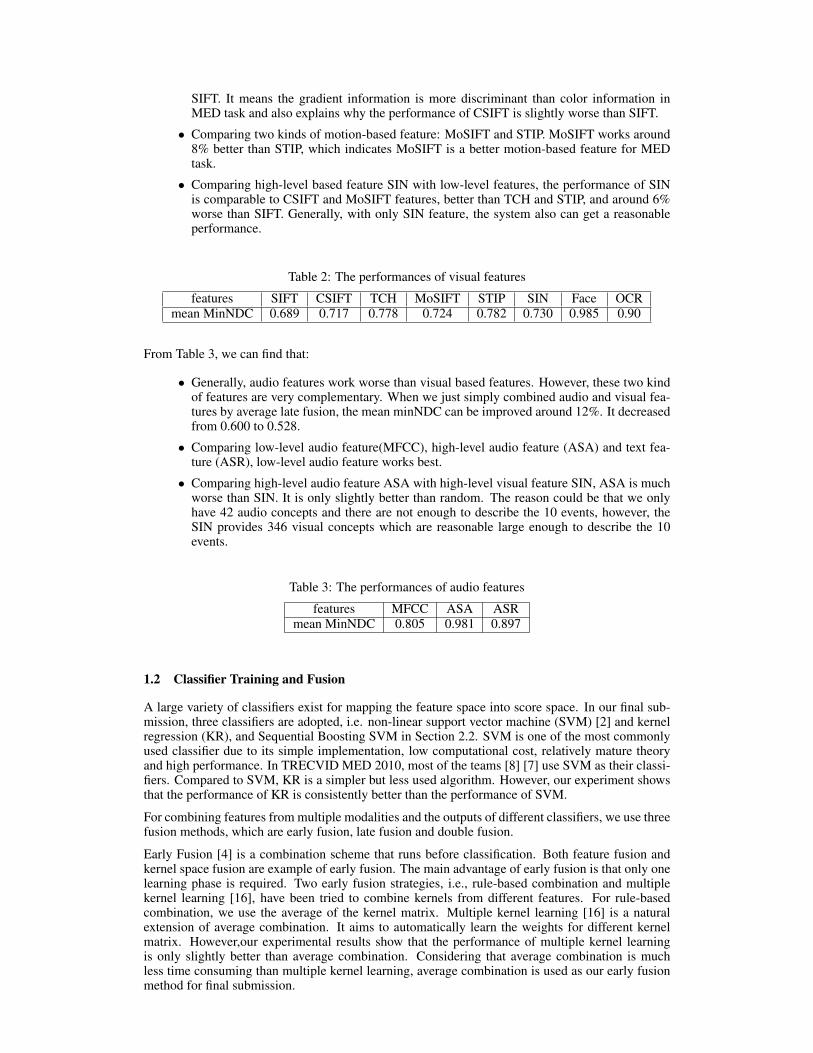
1.1.10 Performance of features
Table 2 and 3 show the performances of the above features when we use non-linear support vectormachine as classifier. The mean minNDC score on 10 Events is used to measure their performances.The smaller mean minNDC score means the better performance. From Table 2, we can find that:
• Generally, comparing low-level visual features, high-level visual features and text visualfeatures, low-level visual features work best.• Comparing three kinds of image-based low-level features: SIFT, CSIFT and TCH, SIFT
describes the gradient information, TCH describes the color information and CSIFT de-scribes both gradient and color information. The performance of TCH is much worse than
SIFT. It means the gradient information is more discriminant than color information inMED task and also explains why the performance of CSIFT is slightly worse than SIFT.
• Comparing two kinds of motion-based feature: MoSIFT and STIP. MoSIFT works around8% better than STIP, which indicates MoSIFT is a better motion-based feature for MEDtask.
• Comparing high-level based feature SIN with low-level features, the performance of SINis comparable to CSIFT and MoSIFT features, better than TCH and STIP, and around 6%worse than SIFT. Generally, with only SIN feature, the system also can get a reasonableperformance.
Table 2: The performances of visual features
features SIFT CSIFT TCH MoSIFT STIP SIN Face OCRmean MinNDC 0.689 0.717 0.778 0.724 0.782 0.730 0.985 0.90
From Table 3, we can find that:
• Generally, audio features work worse than visual based features. However, these two kindof features are very complementary. When we just simply combined audio and visual fea-tures by average late fusion, the mean minNDC can be improved around 12%. It decreasedfrom 0.600 to 0.528.
• Comparing low-level audio feature(MFCC), high-level audio feature (ASA) and text fea-ture (ASR), low-level audio feature works best.
• Comparing high-level audio feature ASA with high-level visual feature SIN, ASA is muchworse than SIN. It is only slightly better than random. The reason could be that we onlyhave 42 audio concepts and there are not enough to describe the 10 events, however, theSIN provides 346 visual concepts which are reasonable large enough to describe the 10events.
Table 3: The performances of audio features
features MFCC ASA ASRmean MinNDC 0.805 0.981 0.897
1.2 Classifier Training and Fusion
A large variety of classifiers exist for mapping the feature space into score space. In our final sub-mission, three classifiers are adopted, i.e. non-linear support vector machine (SVM) [2] and kernelregression (KR), and Sequential Boosting SVM in Section 2.2. SVM is one of the most commonlyused classifier due to its simple implementation, low computational cost, relatively mature theoryand high performance. In TRECVID MED 2010, most of the teams [8] [7] use SVM as their classi-fiers. Compared to SVM, KR is a simpler but less used algorithm. However, our experiment showsthat the performance of KR is consistently better than the performance of SVM.
For combining features from multiple modalities and the outputs of different classifiers, we use threefusion methods, which are early fusion, late fusion and double fusion.
Early Fusion [4] is a combination scheme that runs before classification. Both feature fusion andkernel space fusion are example of early fusion. The main advantage of early fusion is that only onelearning phase is required. Two early fusion strategies, i.e., rule-based combination and multiplekernel learning [16], have been tried to combine kernels from different features. For rule-basedcombination, we use the average of the kernel matrix. Multiple kernel learning [16] is a naturalextension of average combination. It aims to automatically learn the weights for different kernelmatrix. However,our experimental results show that the performance of multiple kernel learningis only slightly better than average combination. Considering that average combination is muchless time consuming than multiple kernel learning, average combination is used as our early fusionmethod for final submission.
In contrast to early fusion, late fusion [4] happens after classification. While late fusion is easier toperform, in general, it needs more computational effort and has potential to lose the correlation inmixed feature space. Normally, another learning procedure is needed to combine these outputs, butin general, because of the overfitting problem, simply averaging the output scores together yieldsbetter or at least comparable results than training another classifier for fusion. Compared to earlyfusion, late fusion is more robust to features that have negative influence. In our final submission, weuse both average combination and logistic regression to combine the outputs of different classifiers.
In our system, we also use a fusion method called double fusion, which combines early fusion andlate fusion together. Specifically, for early fusion, we fuse multiple subsets of single features byusing standard early fusion technologies; for late fusion, we combine output of classifiers trainedfrom single and combined features. By using this scheme, we can freely combine different earlyfusion and late fusion techniques, and get benefits of both. Our results show that double fusion isconsistently better, or at least comparable than early fusion and late fusion.
Table 4: Comparison of classifiers, and Fusion Methods, MinNDC is used as evaluation criteria.
Classifier Early Fusion Late Fusion Double FusionSVM 0.632 0.528 0.519
A submission for a MED 2011 event consists of a video list with scores and a threshold. The scorefor each video is computed by a classifier that is trained on a number of features in Section 1.1.We experimented with three different types of classifiers: SVM, Sequential Boosting and KernelRegression in Section 1.2. For each classifier we explored early fusion, late fusion and a techniquethat we call double fusion in Section 1.2. Given the scores for each video per event, we have twomethods to compute the actual threshold. The first method is a simple cutoff at 1800. This numberguarantees us that the false alarm rate will be lower than 6%, because we return less than 6% of allvideos. Moreover the number of videos that our system did not detect will be as low as possiblewithin the 6% false alarm criteria. Notice that this method is very conservative and will likely notbe close to the best possible threshold. The second method is to use the best threshold of our crossvalidation experiments in the training data. This method is obviously less conservative and turnedout to be very unstable in weighted fusion techniques, but as we will see later it performs well foraverage fusion techniques.
1.3.1 Primary run
Since the primary run is the most important, we prefer it to be our best run, however we don’twant to risk the chance that we are over-fitting on the training data and therefore the results haveto be stable across different splits in our training data. Moreover the actual threshold also plays animportant role in the evaluation and should therefore be stable as well. We believed that both ourearly and late fusion approach would have a decent performance, but from our experiments noneof them was consistently better even though there sometimes was a significant difference betweenthe two approaches. Double fusion on the other hand showed very promising results, better than orcomparable to both early and late fusion. Moreover the actual thresholds seemed to be stable, basedon the number of retrieved videos for each event. Therefore we decided to submit a double fusionrun, using SVM and average fusion in the late fusion stage of double fusion, as our primary run.We chose SVM, because the average performance of our Sequential Boosting SVM and Kernel Re-gression experiments were very similar. Furthermore we preferred average fusion over a weightingscheme learned by logistic regression, because we believed that the weighting scheme was likelyover-fitting to the training data.
1.3.2 DoubleKernelLG
In our experiments performed on the training data, we got better performance using a weightingscheme learned by logistic regression for the late fusion part of double fusion. Also kernel regressiongave slightly better results than the other classifiers. However we believe that this behavior might
be explained by over-fitting and therefore not transform to the testing data. Nonetheless it is worthbeing a non-primary run in case that it actually would be better.
1.3.3 Double3ClassifierLG
This is slightly more conservative run compared to the DoubleKernelLG run, because we use aweighted combination learned by logistic regression of the three different classifiers: SVM, Se-quential Boosting SVM and Kernel Regression. For the average performance across events, thisdoes not make a significant difference on average. However it does reduce the variance withinevents, because not all three classifiers perform equally well for all events. Therefore it is a morestable run when we take individual events into account.
1.3.4 Late3ClassifierAverage
The previous three submissions are all dependent on the early fusion performance, while this runomits that part completely. For the threshold, we simply set the actual threshold to 1800 videos tomake the false alarm rate will be lower than 6%. Similarly to the Double3ClassiferLG, we againperformed an average fusion on the results from the three classifers to reduce the variance withinevents.
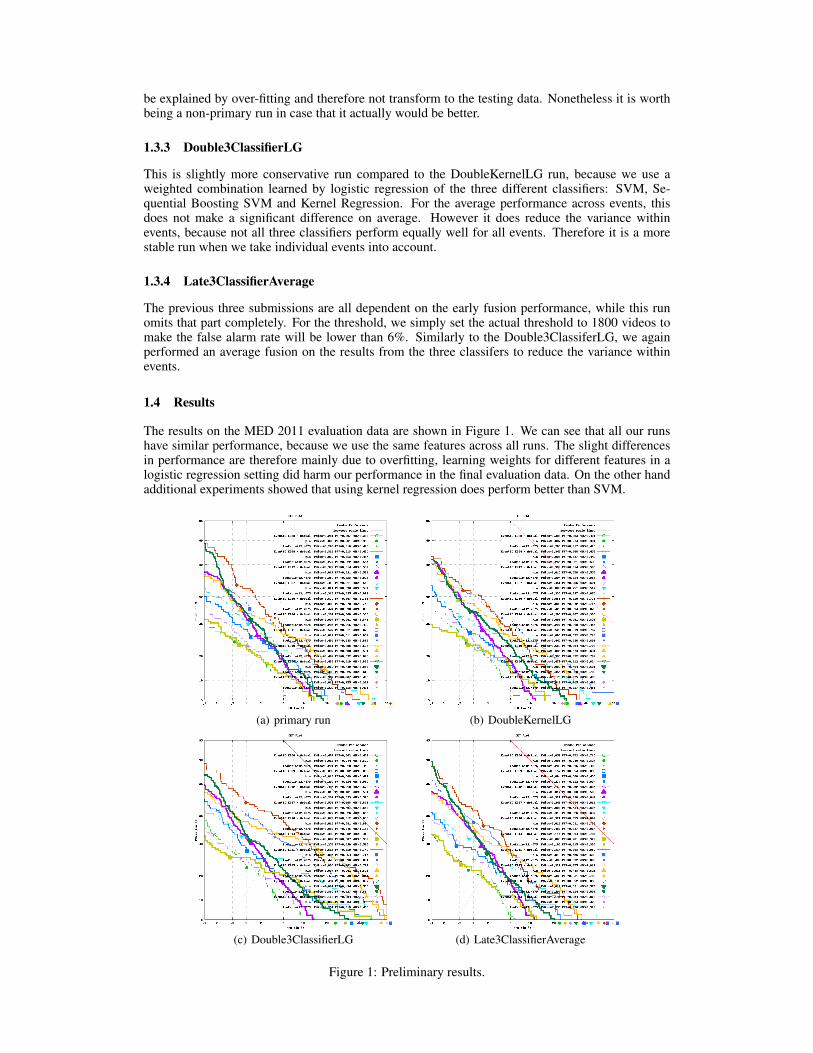
1.4 Results
The results on the MED 2011 evaluation data are shown in Figure 1. We can see that all our runshave similar performance, because we use the same features across all runs. The slight differencesin performance are therefore mainly due to overfitting, learning weights for different features in alogistic regression setting did harm our performance in the final evaluation data. On the other handadditional experiments showed that using kernel regression does perform better than SVM.
As we know, MED task focus on the multimedia content analysis on video level. SIN task focus onthe video clips (shot) level. We can expect that, most of the useful low-level features in MED task canalso be useful for SIN task. However, considering the time-consuming problem, we only used threemost representative features for SIN task: SIFT, Color SIFT (CSIFT) and Motion SIFT (MoSIFT).SIFT and CSIFT describe the gradient and color information of images. MoSIFT describes both theoptical flow and gradient information of video clips. Since the Harris-Laplace detectors only candetect a few feature points for some simple scenes such as sky, we also used dense-sampling detectorto sample feature points besides Harris-Laplace detector. The more details about these featuresplease refer to Section 1.1. Generally, these three features provide most of the useful informationfor SIN task.
2.2 Sequential Boosting SVM
2.2.1 Problem Analysis
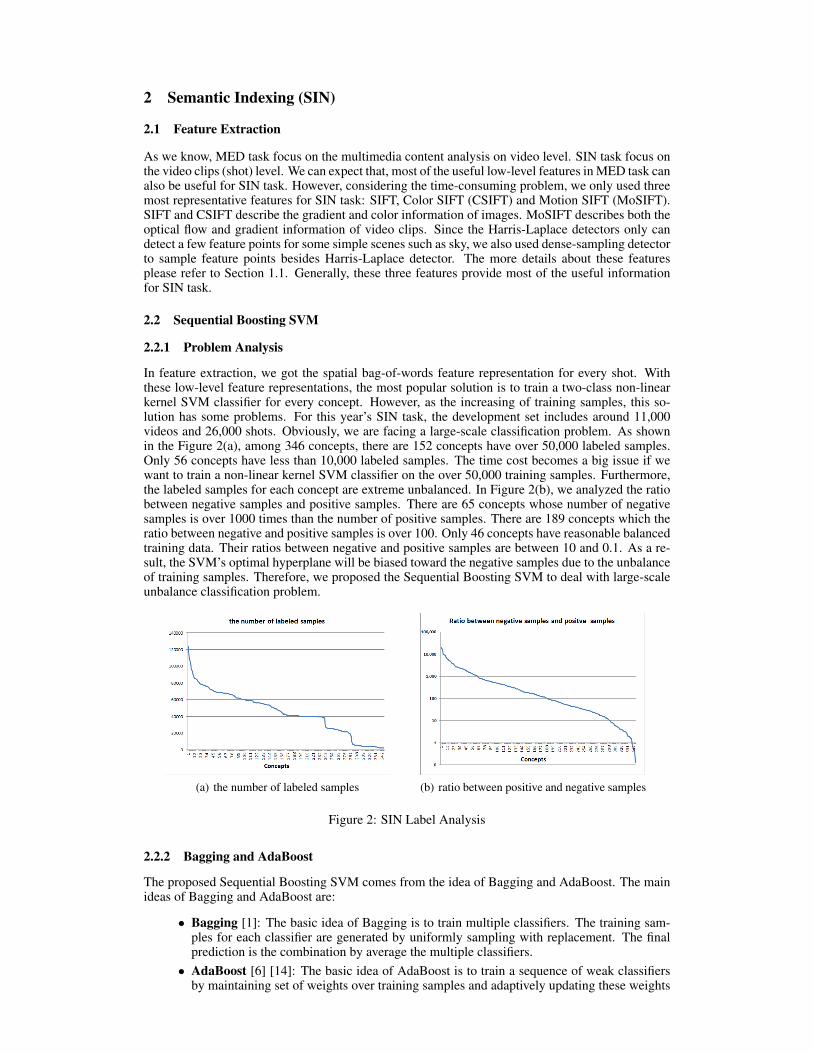
In feature extraction, we got the spatial bag-of-words feature representation for every shot. Withthese low-level feature representations, the most popular solution is to train a two-class non-linearkernel SVM classifier for every concept. However, as the increasing of training samples, this so-lution has some problems. For this year’s SIN task, the development set includes around 11,000videos and 26,000 shots. Obviously, we are facing a large-scale classification problem. As shownin the Figure 2(a), among 346 concepts, there are 152 concepts have over 50,000 labeled samples.Only 56 concepts have less than 10,000 labeled samples. The time cost becomes a big issue if wewant to train a non-linear kernel SVM classifier on the over 50,000 training samples. Furthermore,the labeled samples for each concept are extreme unbalanced. In Figure 2(b), we analyzed the ratiobetween negative samples and positive samples. There are 65 concepts whose number of negativesamples is over 1000 times than the number of positive samples. There are 189 concepts which theratio between negative and positive samples is over 100. Only 46 concepts have reasonable balancedtraining data. Their ratios between negative and positive samples are between 10 and 0.1. As a re-sult, the SVM’s optimal hyperplane will be biased toward the negative samples due to the unbalanceof training samples. Therefore, we proposed the Sequential Boosting SVM to deal with large-scaleunbalance classification problem.
(a) the number of labeled samples (b) ratio between positive and negative samples
Figure 2: SIN Label Analysis
2.2.2 Bagging and AdaBoost
The proposed Sequential Boosting SVM comes from the idea of Bagging and AdaBoost. The mainideas of Bagging and AdaBoost are:
• Bagging [1]: The basic idea of Bagging is to train multiple classifiers. The training sam-ples for each classifier are generated by uniformly sampling with replacement. The finalprediction is the combination by average the multiple classifiers.
• AdaBoost [6] [14]: The basic idea of AdaBoost is to train a sequence of weak classifiersby maintaining set of weights over training samples and adaptively updating these weights
after each Boosting iteration: the samples that are misclassified gain weight while the sam-ples that are classified correctly lose weight. Therefore, the future weak classifier will beforced to focus on the hard samples. Finally, the combination of these weak classifiers willbe a strong classifier.
2.2.3 Sequential Boosting SVM
Intuitively, Bagging strategy can help us to solve the large-scale unbalance classification problem.Firstly, Bagging strategy divides the large-scale training problem to several smaller training prob-lems. Each of them only contains a reasonable number of training examples. The training timecost will not a big issue. Meanwhile, to overcome the unbalanced problem, we can keep all of thepositive examples and only execute the random sampling on negative examples. The number ofsampled negative examples of each set is the same with the number of positive samples. Therefore,each classifier will be trained on a balanced number of positive and negative samples. This is theAsymmetric Bagging strategy proposed in [18]. However, since the training data for SIN task isextreme unbalanced and its size is large, in most of cases, the sampled examples for each baggingclassifier cannot cover the whole training examples. This will hurt the final performance.
To improve the performance of bagging classifiers, an intuitive solution is to choose the most im-portance examples for each bagging classifier. Therefore, even the bagging classifiers only use alimited number of training examples, the sampled most importance examples already contain themost information of the whole training set. Inspired by the main idea of AdaBoost weighting [14],we proposed the Sequential Boosted Sampling strategy. The adaptively updating weights of trainingexamples are used as a metric to measure the importance of training examples. Examples that canbe easily misclassified get high possibility to be sampled. Examples that can be easily classified getlow possibility. Therefore, the small classifier will focus on the hard examples, which will boost theperformance even only a small part of training examples are used.
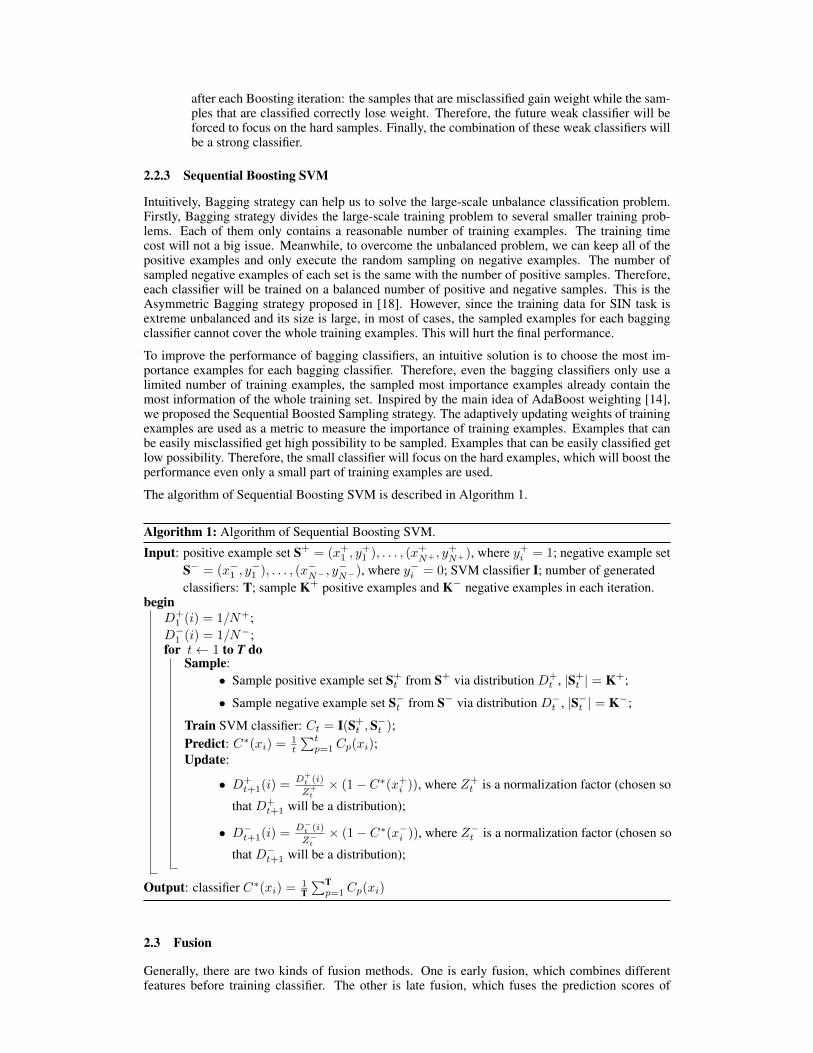
The algorithm of Sequential Boosting SVM is described in Algorithm 1.
Algorithm 1: Algorithm of Sequential Boosting SVM.
Input: positive example set S+ = (x+1 , y
+1 ), . . . , (x
+N+ , y
+N+), where y+i = 1; negative example set
S− = (x−1 , y
−1 ), . . . , (x
−N− , y
−N−), where y−i = 0; SVM classifier I; number of generated
classifiers: T; sample K+ positive examples and K− negative examples in each iteration.begin
D+1 (i) = 1/N+;
D−1 (i) = 1/N−;
for t← 1 to T doSample:
• Sample positive example set S+t from S+ via distribution D+
t , |S+t | = K+;
• Sample negative example set S−t from S− via distribution D−
t , |S−t | = K−;
Train SVM classifier: Ct = I(S+t ,S−
t );Predict: C∗(xi) =
1t
∑tp=1 Cp(xi);
Update:
• D+t+1(i) =
D+t (i)
Z+t
× (1− C∗(x+i )), where Z+
t is a normalization factor (chosen so
that D+t+1 will be a distribution);
• D−t+1(i) =
D−t (i)
Z−t
× (1− C∗(x−i )), where Z−
t is a normalization factor (chosen so
that D−t+1 will be a distribution);
Output: classifier C∗(xi) =1T∑T
p=1 Cp(xi)
2.3 Fusion
Generally, there are two kinds of fusion methods. One is early fusion, which combines differentfeatures before training classifier. The other is late fusion, which fuses the prediction scores of
different features’ classifiers. Considering the time cost to train classifier, we only took early fusion,which only need train a classifier. In order to explore multi-modal features, we also design a multi-modal Sequential Boosting SVM. In each layer, not only the training samples will be re-sampled bytheir weights, but also the using feature will be change Sequentially. Since we extracted five kinds offeatures for SIN task: MoSIFT spatial bag-of-word (MoSIFT), SIFT spatial bag-of-word by Harris-Laplace detector (SIFT-HL), SIFT spatial bag-of-word by dense sampling (SIFT-DS), Color SIFTspatial bag-of-word by Harris-Laplace detector (CSIFT-HL) and Color SIFT spatial bag-of-wordby dense sampling (CSIFT-DS). We pre-computed the distance matrix between training data for allof these five features. In early fusion part, we just weighted fused their distance matrix. We triedseveral different kinds of fusion combination and got some combined features.
• SIFT-HL-DS: averagely fuse SIFT-HL and SIFT-DS;
• CSIFT-HL-DS: averagely fuse CSIFT-HL and CSIFT-DS;
• MoSIFT-SIFT-CSIFT: averagely fuse MoSIFT, SIFT-HL and CSIFT-HL;
• MoSIFT-SIFT2-CSIFT2: averagely fuse MoSIFT, SIFT-HL-DS and CSIFT-HL-DS.
2.4 Submission
This year, we trained 4 different kinds of models and submitted 4 runs.
• MoSIFT model: we used MoSIFT spatial bag-of-word feature and trained 10-layers Se-quential Boosting SVM classifier. We submitted this as CMU 1 run.
• MoSIFT-SIFT-CSIFT model: we used MoSIFT-SIFT-CSIFT feature and trained 10-layers Sequential Boosting SVM classifier. We submitted this as CMU 2 run.
• MoSIFT-SIFT2-CSIFT2 model: we used MoSIFT-SIFT2-CSIFT2 feature and trained10-layers Sequential Boosting SVM classifier. We didn’t submit this run.
• MoSIFT-SIFT2-CSIFT2 multimodal: we used MoSIFT, SIFT-HL-DS and CSIFT-HL-DS to train 20-layers multi-modal Sequential Boosting SVM. The order of the features isMoSIFT, SIFT-HL-DS and CSIFT-HL-DS. We submitted this run as CMU 3 run.
• MoSIFT-SIFT2-CSIFT2 latefusion: we averagely fused the prediction scores fromMoSIFT-SIFT2-CSIFT2 model and MoSIFT-SIFT2-CSIFT2 multimodal and submittedthis as CMU 4 run.
The performance of the above runs are in Table 5. As we can see:
• MoSIFT spatial bag-of-word feature is a good feature for SIN task. Only MoSIFT itselfcan help us get reasonable performance (mean infAP: 0.1064).
• SIFT-HL and CSIFT-HL are very complemental features for MoSIFT. After we combinedSIFT-HL and CSIFT-HL feature with MoSIFT feature, the mean infAP is improved from0.1064 to 0.1337. We got about 30% improvement from SIFT-HL and CSIFT-HL feature.
• SIFT-DS and CSIFT-DS can improve the performance of SIFT-HL and CSIFT-HL in SINtask. Based on CMU 2, after we combined SIFT-DS and CSIFT-HL, we got 5% improve-ment from 0.1337 to 0.1407.
• Multi-modal Sequential Boosting SVM works slightly better than early fusion. The per-formance of MoSIFT-SIFT2-CSIFT2 multimodal is 0.1464, which is 4% better than theperformance of early fusion 0.1407.
Table 5: The performances of submissions
Run ID model mean infAP of 50 conceptsCMU 1 MoSIFT model 0.1064CMU 2 MoSIFT-SIFT-CSIFT model 0.1337
In feature part, we only tried three most representative visual features. Obviously, for some conceptsin SIN task, such as Speech, Singing and Talking, the audio feature can be very useful. In ourcurrent experiment of MED task, MFCC bag-of-word feature works well for MED task and is verycomplementary to visual features. We will try MFCC audio feature to improve the current SINperformance. In classification part, Sequential Boosting SVM works well for SIN task. However,there is an open issue that how to decide the number of classifier layers. That will be anotherfuture work for SIN task. In fusion part, Multi-modal Sequential Boosting SVM is a good solutionto combine different modalities. Currently, we used a fixed feature order. However, it will be aninteresting question that how to choose the most useful feature for next layer classifier.
3 Acknowledgments
This work has been supported by the Intelligence Advanced Research Projects Activity (IARPA) viaDepartment of Interior National Business Center contract number D11PC20068. The U.S. Govern-ment is authorized to reproduce and distribute reprints for Governmental purposes notwithstandingany copyright annotation thereon. Disclaimer: The views and conclusions contained herein arethose of the authors and should not be interpreted as necessarily representing the official policies orendorsements, either expressed or implied, of IARPA, DoI/NBC, or the U.S. Government.
References
[1] L. Breiman and L. Breiman. Bagging predictors. In Machine Learning, pages 123–140, 1996.
[2] C.-C. Chang and C.-J. Lin. LIBSVM: A library for support vector machines. ACM Transac-tions on Intelligent Systems and Technology, 2:27:1–27:27, 2011.
[3] M.-Y. Chen and A. Hauptmann. Mosift: Recognizing human actions in surveillance videos,2009.
[4] C. Cortes, M. Mohri, and A. Rostamizadeh. L 2 regularization for learning kernels. In Proceed-ings of the Twenty-Fifth Conference on Uncertainty in Artificial Intelligence, pages 109–116.AUAI Press, 2009.
[5] D. Das, D. Chen, and A. G. Hauptmann. Improving multimedia retrieval with a video OCR. InSociety of Photo-Optical Instrumentation Engineers (SPIE) Conference Series, volume 6820of Presented at the Society of Photo-Optical Instrumentation Engineers (SPIE) Conference,January 2008.
[6] Y. Freund and R. E. Schapire. A decision-theoretic generalization of on-line learning and anapplication to boosting, 1997.
[7] G. Iyengar. Discriminative model fusion for semantic concept detection and annotation invideo. Proceedings of the eleventh ACM international Conference on Multimedia, pages 255–258, 2003.
[8] Y. Jiang, X. Zeng, G. Ye, S. Bhattacharya, D. Ellis, M. Shah, and S. Chang. Columbia-UCF TRECVID2010 multimedia event detection: Combining multiple modalities, contextualconcepts, and temporal matching. In NIST TRECVID Workshop, 2010.
[9] I. Laptev. On space-time interest points. International Journal of Computer Vision, 64(2-3):107–123, 2005.
[10] S. Lazebnik, C. Schmid, and J. Ponce. Beyond bags of features: Spatial pyramid matching forrecognizing natural scene categories. In CVPR (2), pages 2169–2178, 2006.
[11] H. Li, L. Bao, Z. Gao, A. Overwijk, W. Liu, L. Zhang, S. Yu, M. Chen, F. Metze, and A. Haupt-mann. Informedia @ TRECVID 2010. TRECVID Video Retrieval Evaluation Workshop, NIST,2010.
[12] PittPatt. Pittpatt face detection. http://www.pittpatt.com/.
[13] G. Salton and e. M. McGill. Introduction to Modern Information Retrieval. McGraw-Hill,1983.
[14] R. E. Schapire and Y. Singer. Improved boosting algorithms using confidence-rated predic-tions. In Machine Learning, pages 80–91, 1999.
[15] A. F. Smeaton, P. Over, and W. Kraaij. Evaluation campaigns and TRECVID. In MIR ’06:Proceedings of the 8th ACM International Workshop on Multimedia Information Retrieval,pages 321–330, New York, NY, USA, 2006. ACM Press.
[16] C. Snoek, M. Worring, and A. Smeulders. Early versus late fusion in semantic video analysis.In Proceedings of the 13th annual ACM International Conference on Multimedia, pages 399–402. ACM, 2005.
[17] H. Soltau, F. Metze, C. Fugen, and A. Waibel. A One-pass Decoder based on PolymorphicLinguistic Context Assignment. In Proc. Automatic Speech Recognition and Understanding(ASRU), Madonna di Campiglio, Italy, Dec. 2001. IEEE.
[18] D. Tao, X. Tang, X. Li, and X. Wu. Asymmetric bagging and random subspace for supportvector machines-based relevance feedback in image retrieval. IEEE Trans. Pattern Anal. Mach.Intell., 28:1088–1099, July 2006.
[19] K. E. A. van de Sande, T. Gevers, and C. G. M. Snoek. Evaluating color descriptors for ob-ject and scene recognition. IEEE Transactions on Pattern Analysis and Machine Intelligence,32(9):1582–1596, 2010.
[11] C.-C. Chang and C.-J. Lin. LIBSVM: a library for support vector machines, 2001. Software
http://www.csie.ntu.edu.tw/~cjlin/libsvm/
[12] N. Dalal and B. Triggs. Histogram of oriented gradient for human detection. In CVPR, 2005.
[13] P. Viola, M. Jones, and D. Snow. Detecting pedestrians using patterns of motion and appearance. In CVPR, 2003
[14] Medeiros, H., Park, J.; Kak, A.A parallel color
p1-8, June 2008
[15] Babenko, B. Ming-Hsuan Yang; Belongie, S.
CVPR2009 Workshops), p 983-90, 2009
[16] Ming-yu Chen, Huan Li, and Alexander Hauptmann. Informedia @
[17 ] Over, Paul and Awad, George and Fiscus, Jon and Antonishek, Brian and Michel, Martial and Smeaton, Alan F.
and Kraaij, Wessel and Quénot, Georges (2011)
mechanisms, and metrics. In: TRECVID
[18] R. Benmokhtar and I. Laptev, “INRIA
http://www-nlpir.nist.gov/projects/tvpubs/tv10.papers/inria[19] G. Zhu, M. Yang, K. Yu, W. Xu and Y. Gong, “Detecting Video Events Based on Action Recognition in Complex
Scenes Using Spatio-Temporal Descriptor”
Schuldt, C. Laptev, and B. I. Caputo. Recognizing human actions: a local SVM approach. ICPR(17), pp 32
-time interest points. ICCV, pages 432–439, 2003.
F. Wong and R. Cipolla. Extracting spatiotemporal interest points using global information. ICCV, pp 1
A. Klaser, M. Marszałek, and C. Schmid. A spatio-temporal descriptor based on 3D-gradients. BMVC,
G. Willems, T. Tuytelaars, and L. V. Gool. An efficient dense and scale-invariant spatio-temporal interest point
663, 2008.
A. Oikonomopoulos, L. Patras, and M. Pantic. Spatiotemporal saliency for human action recognition.
P. Dollar, V. Rabaud, G. Cottrell, and S. Belongie. Behavior recognition via sparse spatio-temporal features. IEEE
International Workshop on Visual Surveillance and Performance Evaluation of Tracking and Surveillance,
MoSIFT: Reocgnizing Human Actions in Surveillance Videos . CMU
[9] National Institute of Standards and Technology (NIST): TRECVID 2009 Evaluation for Surveillance Event


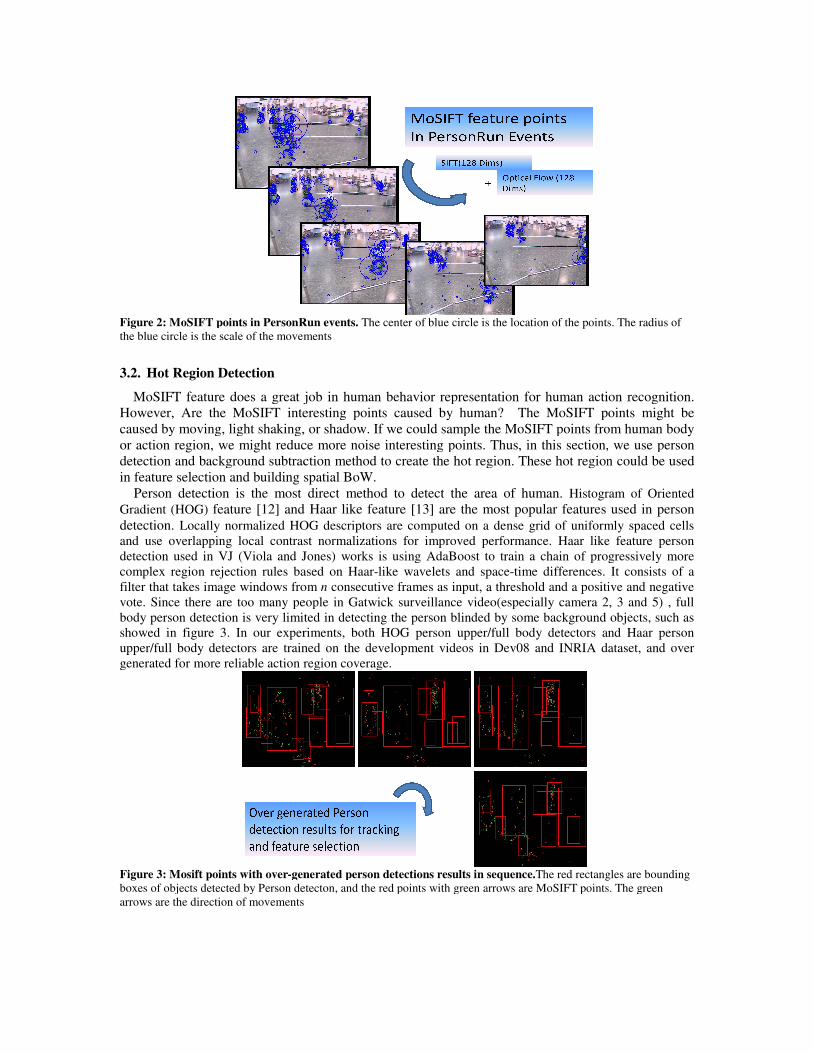

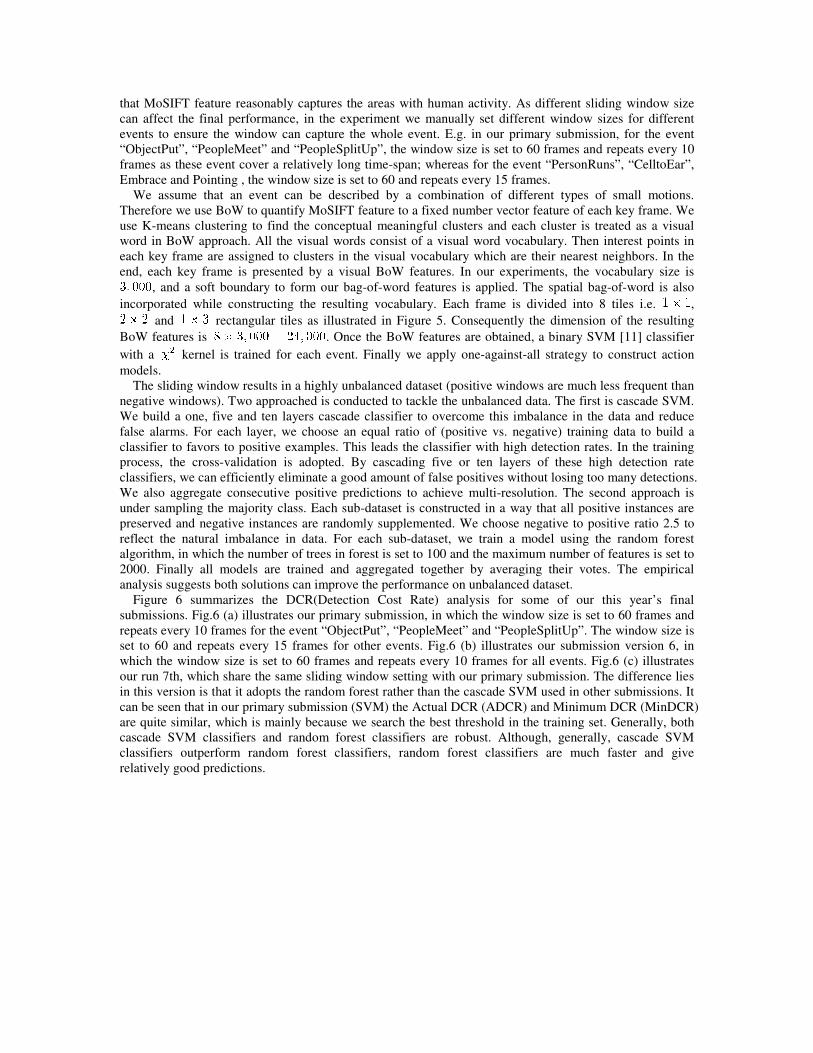


![Informedia@TRECVID 2014 MED and MERour system by employing linear classifiers and Product Quantization (PQ) [9], thus allowing us to perform search over 200,000 videos on 47 features](https://static.documents.pub/doc/80x56/5fddb22376a3776be864d760/informediatrecvid-2014-med-and-mer-our-system-by-employing-linear-classifiers-and.jpg)


