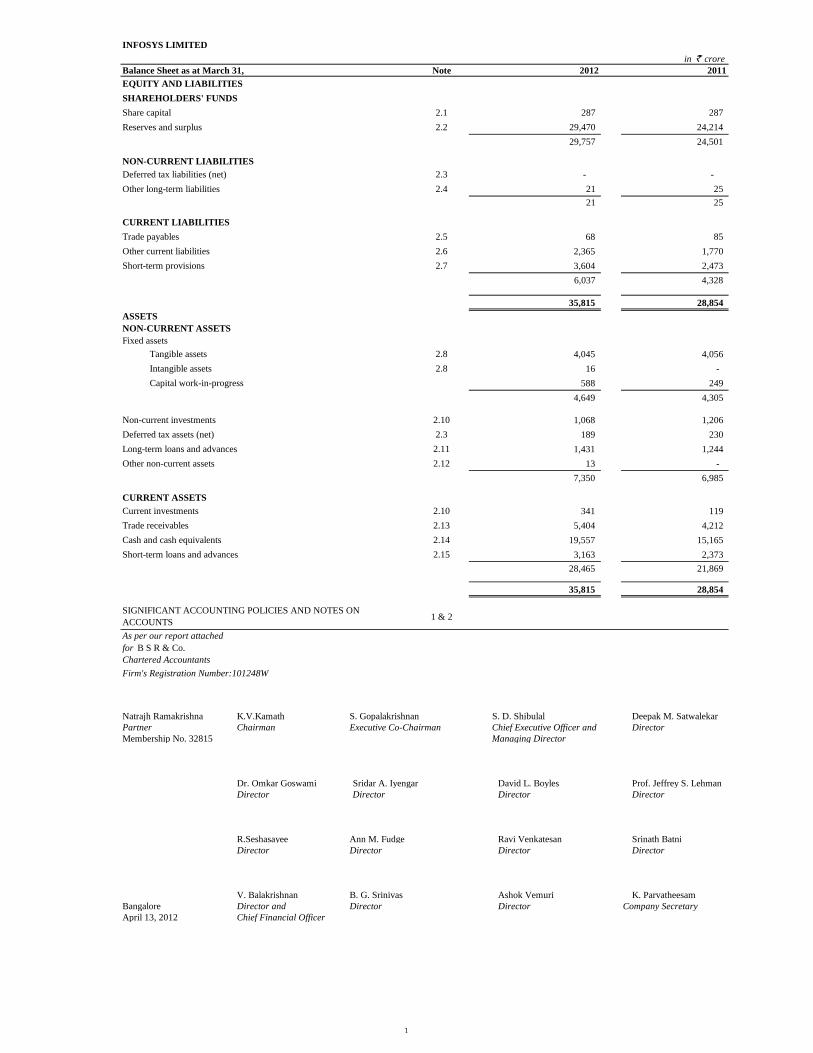
INFOSYS LIMITED in ` crore Balance Sheet as at March 31, Note 2012 2011 EQUITY AND LIABILITIES SHAREHOLDERS' FUNDS Share capital 2.1 287 287 Reserves and surplus 2.2 29,470 24,214 29,757 24,501 NON-CURRENT LIABILITIES Deferred tax liabilities (net) 2.3 - - Other long-term liabilities 2.4 21 25 21 25 CURRENT LIABILITIES Trade payables 2.5 68 85 Other current liabilities 2.6 2,365 1,770 Short-term provisions 2.7 3,604 2,473 6,037 4,328 35,815 28,854 ASSETS NON-CURRENT ASSETS Fixed assets Tangible assets 2.8 4,045 4,056 Intangible assets 2.8 16 - Capital work-in-progress 588 249 4,649 4,305 Non-current investments 2.10 1,068 1,206 Deferred tax assets (net) 2.3 189 230 Long-term loans and advances 2.11 1,431 1,244 Other non-current assets 2.12 13 - 7,350 6,985 CURRENT ASSETS Current investments 2.10 341 119 Trade receivables 2.13 5,404 4,212 Cash and cash equivalents 2.14 19,557 15,165 Short-term loans and advances 2.15 3,163 2,373 28,465 21,869 35,815 28,854 1 & 2 As per our report attached for B S R & Co. Chartered Accountants Firm's Registration Number:101248W Natrajh Ramakrishna K.V.Kamath S. Gopalakrishnan S. D. Shibulal Deepak M. Satwalekar Partner Chairman Executive Co-Chairman Chief Executive Officer and Director Membership No. 32815 Managing Director Dr. Omkar Goswami Sridar A. Iyengar David L. Boyles Prof. Jeffrey S. Lehman Director Director Director Director R.Seshasayee Ann M. Fudge Ravi Venkatesan Srinath Batni Director Director Director Director V. Balakrishnan B. G. Srinivas Ashok Vemuri K. Parvatheesam Bangalore Director and Director Director Company Secretary April 13, 2012 Chief Financial Officer SIGNIFICANT ACCOUNTING POLICIES AND NOTES ON ACCOUNTS 1
Transcript
INFOSYS LIMITED
in ` crore
Balance Sheet as at March 31, Note 2012 2011
EQUITY AND LIABILITIES
SHAREHOLDERS' FUNDS
Share capital 2.1 287 287
Reserves and surplus 2.2 29,470 24,214
29,757 24,501
NON-CURRENT LIABILITIES
Deferred tax liabilities (net) 2.3 - -
Other long-term liabilities 2.4 21 25
21 25
CURRENT LIABILITIES
Trade payables 2.5 68 85
Other current liabilities 2.6 2,365 1,770
Short-term provisions 2.7 3,604 2,473
6,037 4,328
35,815 28,854
ASSETS
NON-CURRENT ASSETS
Fixed assets
Tangible assets 2.8 4,045 4,056
Intangible assets 2.8 16 -
Capital work-in-progress 588 249
4,649 4,305
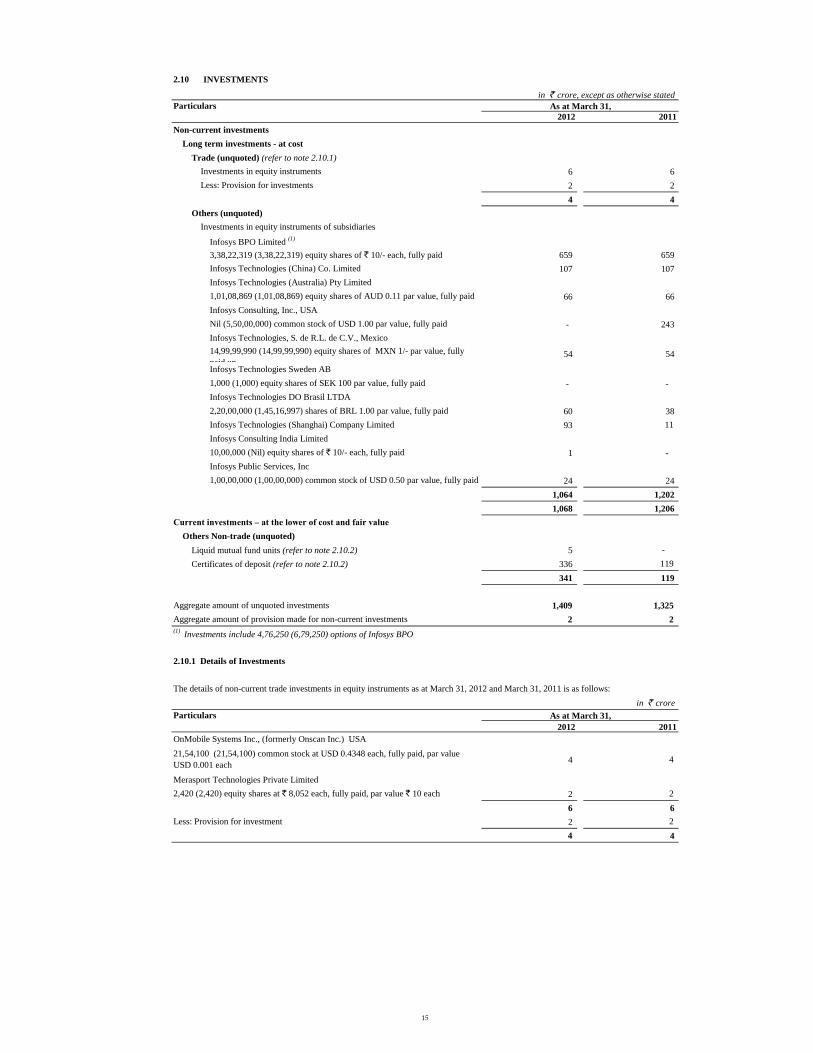
Non-current investments 2.10 1,068 1,206
Deferred tax assets (net) 2.3 189 230
Long-term loans and advances 2.11 1,431 1,244
Other non-current assets 2.12 13 -
7,350 6,985
CURRENT ASSETS
Current investments 2.10 341 119
Trade receivables 2.13 5,404 4,212
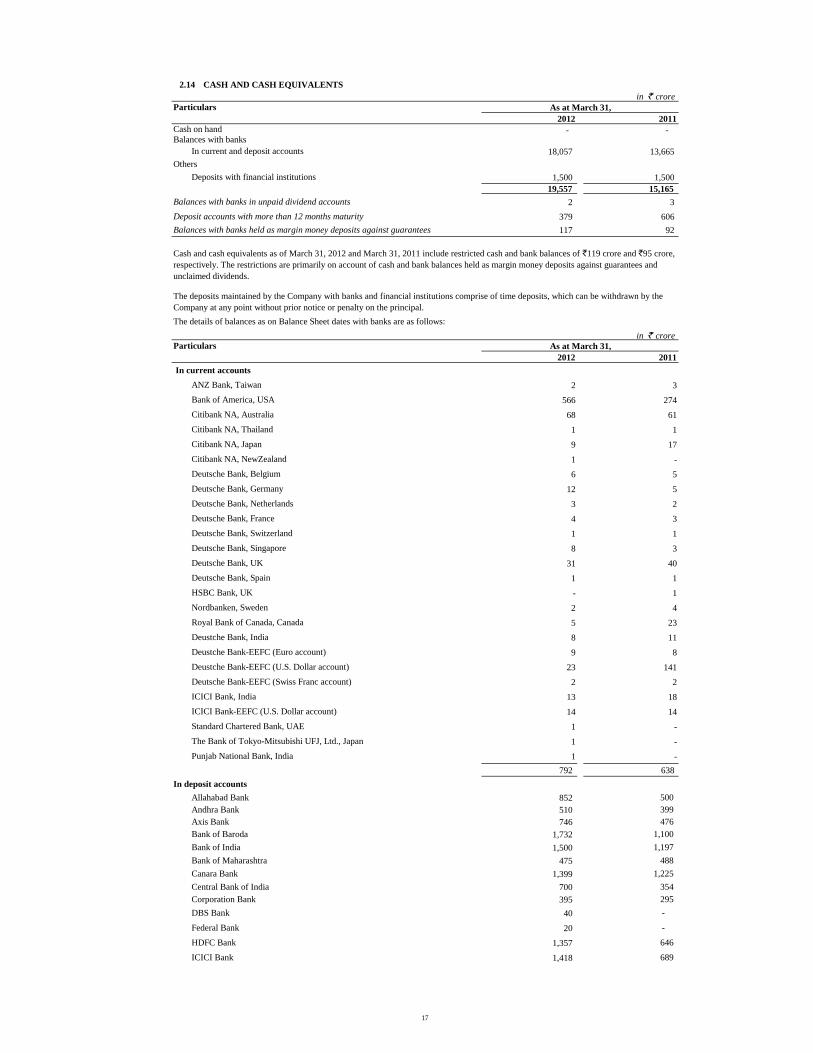
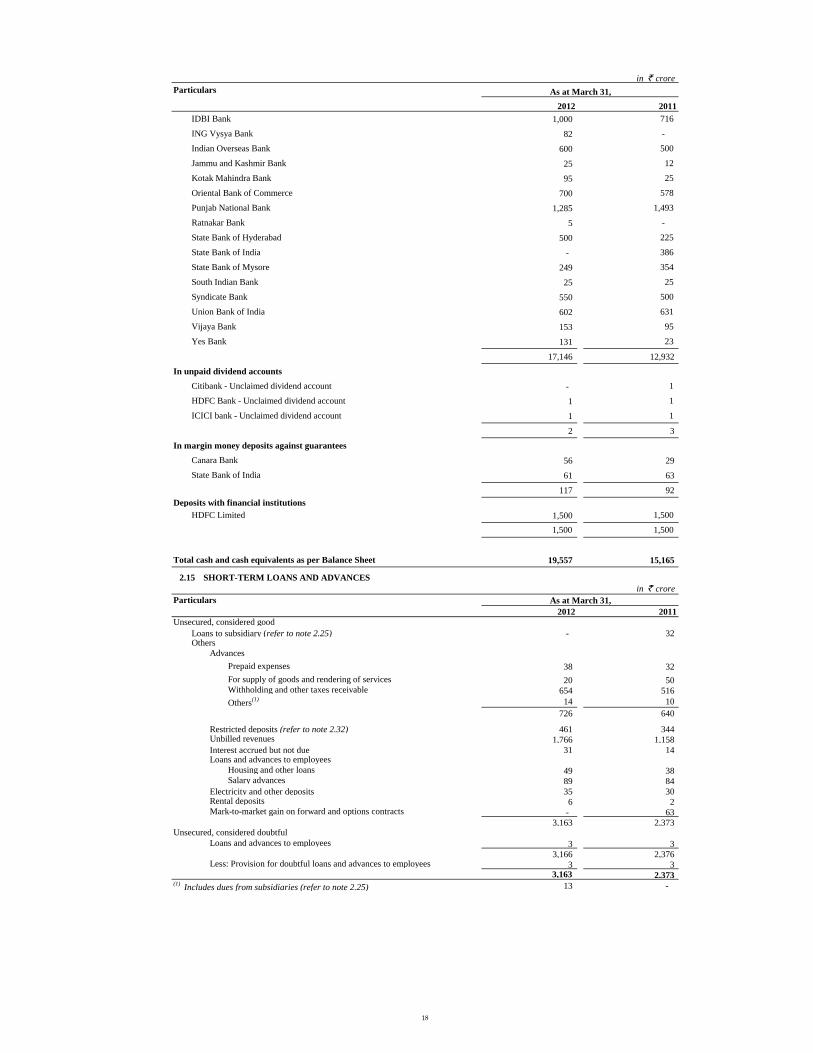
Cash and cash equivalents 2.14 19,557 15,165
Short-term loans and advances 2.15 3,163 2,373
28,465 21,869
35,815 28,854
1 & 2
As per our report attached
for B S R & Co.
Chartered Accountants
Firm's Registration Number:101248W
Natrajh Ramakrishna K.V.Kamath S. Gopalakrishnan S. D. Shibulal Deepak M. Satwalekar
Partner Chairman Executive Co-Chairman Chief Executive Officer and Director
Membership No. 32815 Managing Director
Dr. Omkar Goswami Sridar A. Iyengar David L. Boyles Prof. Jeffrey S. Lehman
Director Director Director Director
R.Seshasayee Ann M. Fudge Ravi Venkatesan Srinath Batni
Director Director Director Director
V. Balakrishnan B. G. Srinivas Ashok Vemuri K. Parvatheesam
Bangalore Director and Director Director Company Secretary
April 13, 2012 Chief Financial Officer
SIGNIFICANT ACCOUNTING POLICIES AND NOTES ON
ACCOUNTS
1
INFOSYS LIMITED
in ` crore, except per share data
Statement of Profit and Loss for the year ended March 31, Note 2012 2011
Income from software services and products 2.16 31,254 25,385
Other income 2.17 1,829 1,147
Total revenue 33,083 26,532
Expenses
Employee benefit expenses 2.18 15,473 12,459
Cost of technical sub-contractors 2.18 2,483 2,044
Travel expenses 2.18 944 771
Cost of software packages and others 2.18 625 459
Communication expenses 2.18 203 170
Professional charges 437 299
Depreciation and amortisation expense 2.8 794 740
Other expenses 2.18 1,028 769
Total expenses 21,987 17,711
PROFIT BEFORE TAX AND EXCEPTIONAL ITEM 11,096 8,821
Tax expense:
Current tax 2.19 3,053 2,521
Deferred tax 2.19 57 (143)
PROFIT AFTER TAX BEFORE EXCEPTIONAL ITEM 7,986 6,443
Dividend income, net of taxes 2.34 484 -
PROFIT AFTER TAX AND EXCEPTIONAL ITEM 8,470 6,443
EARNINGS PER EQUITY SHARE
Equity shares of par value `5/- each
Before Exceptional item
Basic 139.07 112.26
Diluted 139.06 112.22
After Exceptional item
Basic 147.51 112.26
Diluted 147.50 112.22
Number of shares used in computing earnings per share 2.31
Basic 57,41,99,094 57,40,13,650
Diluted 57,42,29,742 57,42,01,958
1 & 2
As per our report attached
for B S R & Co.
Chartered Accountants
Firm's Registration Number : 101248W
Natrajh Ramakrishna K.V.Kamath S. Gopalakrishnan S. D. Shibulal Deepak M. Satwalekar
Partner Chairman Executive Co-Chairman Chief Executive Officer and Director
Membership No. 32815 Managing Director
Dr. Omkar Goswami Sridar A. Iyengar David L. Boyles Prof. Jeffrey S. Lehman
Director Director Director Director
R.Seshasayee Ann M. Fudge Ravi Venkatesan Srinath Batni
Director Director Director Director
V. Balakrishnan B. G. Srinivas Ashok Vemuri K. Parvatheesam
Bangalore Director and Director Director Company Secretary
April 13, 2012 Chief Financial Officer
SIGNIFICANT ACCOUNTING POLICIES AND NOTES
ON ACCOUNTS
2
INFOSYS LIMITED
in ` crore
Cash Flow Statement for the year ended March 31, Note 2012 2011
CASH FLOWS FROM OPERATING ACTIVITIES
Profit before tax 11,096 8,821
Depreciation and amortisation expense 794 740
Interest and dividend income (1,720) (1,086)
Profit of sale of tangible assets 2.35.5 (2) -
19 (6)
(60) (5)
Changes in assets and liabilities
Trade receivables 2.35.1 (1,180) (968)
Loans and advances and other assets 2.35.2 (819) (704)
Liabilities and provisions 2.35.3 671 234
8,799 7,026
Income taxes paid 2.35.4 (2,844) (2,756)
NET CASH GENERATED BY OPERATING ACTIVITIES 5,955 4,270
CASH FLOWS FROM INVESTING ACTIVITIES
Payment towards capital expenditure 2.35.5 (1,296) (1,152)
Investments in subsidiaries 2.35.6 (104) (77)
Disposal of other investments 2.35.7 (222) 3,378
Interest and dividend received 2.35.8 1,703 1,086
CASH FLOWS FROM INVESTING ACTIVITIES BEFORE EXCEPTIONAL ITEM 81 3,235
Dividend income, net of taxes 2.34 484 -
565 3,235
CASH FLOWS FROM FINANCING ACTIVITIES
6 24
Repayment of loan given to subsidiary 2.35.9 35 14
Dividends paid including residual dividend (2,012) (3,156)
Dividend tax paid (327) (524)
NET CASH USED IN FINANCING ACTIVITIES (2,298) (3,642)
60 5
NET INCREASE/(DECREASE) IN CASH AND CASH EQUIVALENTS 4,282 3,868
110 -
CASH AND CASH EQUIVALENTS AT THE BEGINNING OF THE PERIOD 15,165 11,297
CASH AND CASH EQUIVALENTS AT THE END OF THE PERIOD 19,557 15,165
1 & 2
As per our report attached
for B S R & Co.Chartered Accountants
Firm's Registration Number : 101248W
Natrajh Ramakrishna K.V.Kamath S. Gopalakrishnan S. D. Shibulal Deepak M. Satwalekar
Partner Chairman Executive Co-Chairman Chief Executive Officer and Director
Membership No. 32815 Managing Director
Dr. Omkar Goswami Sridar A. Iyengar David L. Boyles Prof. Jeffrey S. Lehman
Director Director Director Director
R.Seshasayee Ann M. Fudge Ravi Venkatesan Srinath Batni
Director Director Director Director
V. Balakrishnan B. G. Srinivas Ashok Vemuri K. ParvatheesamBangalore Director and Director Director Company Secretary
April 13, 2012 Chief Financial Officer
Effect of exchange differences on translation of foreign currency cash and cash
equivalents
SIGNIFICANT ACCOUNTING POLICIES AND NOTES ON ACCOUNTS
Adjustments to reconcile profit before tax to cash provided by operating activities
Effect of exchange differences on translation of foreign currency cash and cash
equivalents
Proceeds from issuance of share capital on exercise of stock options
Effect of exchange differences on translation of assets and liabilities
NET CASH PROVIDED BY/(USED IN) INVESTING ACTIVITIES
Add: Bank balances taken over from Infosys Consulting Inc., USA pursuant to
merger (refer to note 2.25)
3
Significant accounting policies and notes on accounts
Company overview
1
1.1
1.2
1.3 Revenue recognition
Significant accounting policies
Basis of preparation of financial statements
Use of estimates
Infosys Limited ('Infosys' or 'the Company') along with its majority-owned and controlled subsidiary, Infosys BPO Limited
('Infosys BPO') and wholly-owned and controlled subsidiaries, Infosys Technologies (Australia) Pty. Limited ('Infosys
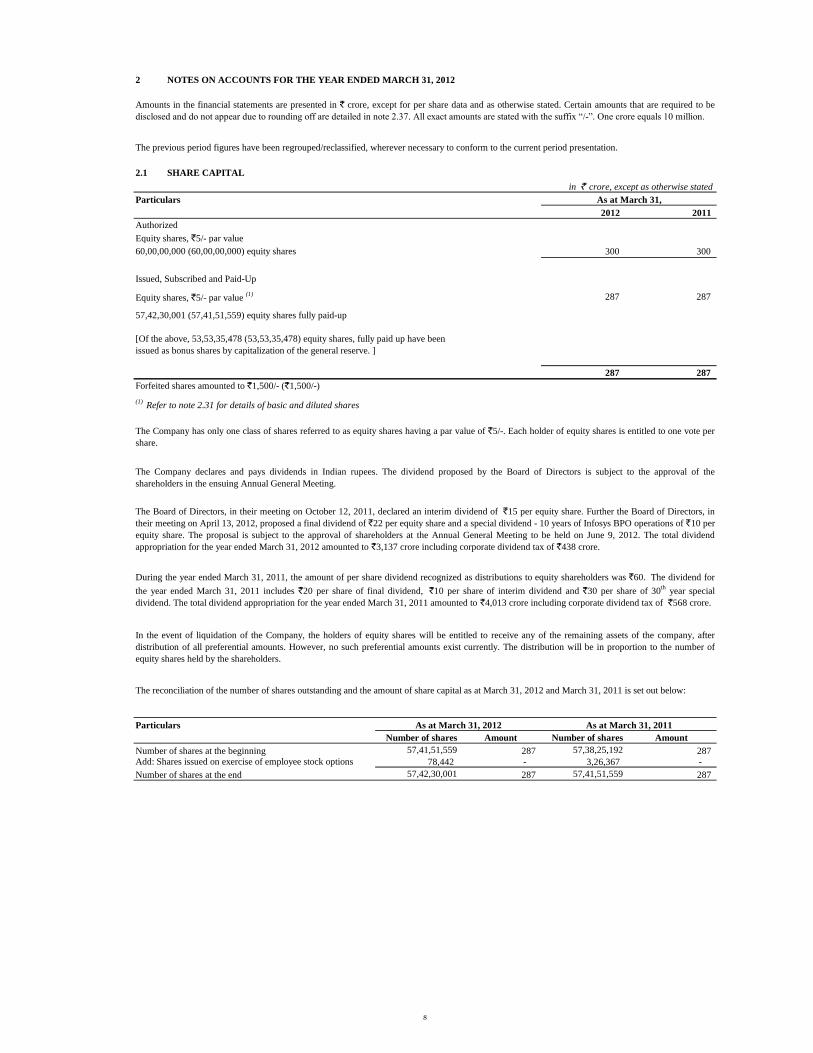
Number of shares at the beginning 57,41,51,559 287 57,38,25,192 287
78,442 - 3,26,367 -
Number of shares at the end 57,42,30,001 287 57,41,51,559 287
The Board of Directors, in their meeting on October 12, 2011, declared an interim dividend of `15 per equity share. Further the Board of Directors, in
their meeting on April 13, 2012, proposed a final dividend of `22 per equity share and a special dividend - 10 years of Infosys BPO operations of `10 per
equity share. The proposal is subject to the approval of shareholders at the Annual General Meeting to be held on June 9, 2012. The total dividend
appropriation for the year ended March 31, 2012 amounted to `3,137 crore including corporate dividend tax of `438 crore.
As at March 31,
[Of the above, 53,53,35,478 (53,53,35,478) equity shares, fully paid up have been
issued as bonus shares by capitalization of the general reserve. ]
The Company has only one class of shares referred to as equity shares having a par value of `5/-. Each holder of equity shares is entitled to one vote per
share.
(1) Refer to note 2.31 for details of basic and diluted shares
The Company declares and pays dividends in Indian rupees. The dividend proposed by the Board of Directors is subject to the approval of the
shareholders in the ensuing Annual General Meeting.
During the year ended March 31, 2011, the amount of per share dividend recognized as distributions to equity shareholders was `60. The dividend for
the year ended March 31, 2011 includes `20 per share of final dividend, `10 per share of interim dividend and `30 per share of 30th
year special
dividend. The total dividend appropriation for the year ended March 31, 2011 amounted to `4,013 crore including corporate dividend tax of `568 crore.
In the event of liquidation of the Company, the holders of equity shares will be entitled to receive any of the remaining assets of the company, after
distribution of all preferential amounts. However, no such preferential amounts exist currently. The distribution will be in proportion to the number of
equity shares held by the shareholders.
As at March 31, 2012 As at March 31, 2011
Add: Shares issued on exercise of employee stock options
Amounts in the financial statements are presented in ` crore, except for per share data and as otherwise stated. Certain amounts that are required to be
disclosed and do not appear due to rounding off are detailed in note 2.37. All exact amounts are stated with the suffix “/-”. One crore equals 10 million.
The reconciliation of the number of shares outstanding and the amount of share capital as at March 31, 2012 and March 31, 2011 is set out below:
8
Stock option plans
1998 Stock Option Plan ('the 1998 Plan')
1999 Stock Option Plan ('the 1999 Plan')
2012 2011
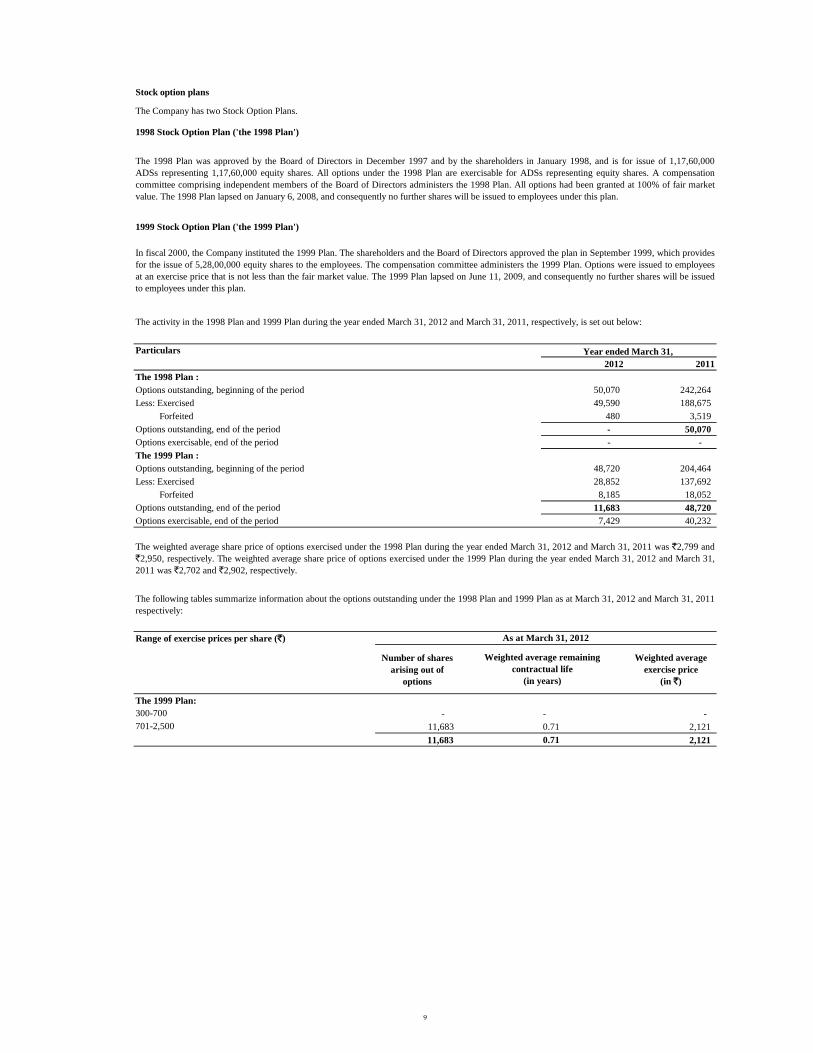
The 1998 Plan :
Options outstanding, beginning of the period 50,070 242,264
Less: Exercised 49,590 188,675
Forfeited 480 3,519
Options outstanding, end of the period - 50,070
Options exercisable, end of the period - -
The 1999 Plan :
Options outstanding, beginning of the period 48,720 204,464
Less: Exercised 28,852 137,692
Forfeited 8,185 18,052
Options outstanding, end of the period 11,683 48,720
Options exercisable, end of the period 7,429 40,232
Range of exercise prices per share (`)
Number of shares
arising out of
options
Weighted average
exercise price
(in `)
The 1999 Plan:
- - -
11,683 0.71 2,121
11,683 0.71 2,121
The Company has two Stock Option Plans.
The 1998 Plan was approved by the Board of Directors in December 1997 and by the shareholders in January 1998, and is for issue of 1,17,60,000
ADSs representing 1,17,60,000 equity shares. All options under the 1998 Plan are exercisable for ADSs representing equity shares. A compensation
committee comprising independent members of the Board of Directors administers the 1998 Plan. All options had been granted at 100% of fair market
value. The 1998 Plan lapsed on January 6, 2008, and consequently no further shares will be issued to employees under this plan.
In fiscal 2000, the Company instituted the 1999 Plan. The shareholders and the Board of Directors approved the plan in September 1999, which provides
for the issue of 5,28,00,000 equity shares to the employees. The compensation committee administers the 1999 Plan. Options were issued to employees
at an exercise price that is not less than the fair market value. The 1999 Plan lapsed on June 11, 2009, and consequently no further shares will be issued
to employees under this plan.
The activity in the 1998 Plan and 1999 Plan during the year ended March 31, 2012 and March 31, 2011, respectively, is set out below:
Year ended March 31,
As at March 31, 2012
Weighted average remaining
contractual life
(in years)
Particulars
The following tables summarize information about the options outstanding under the 1998 Plan and 1999 Plan as at March 31, 2012 and March 31, 2011
respectively:
The weighted average share price of options exercised under the 1998 Plan during the year ended March 31, 2012 and March 31, 2011 was `2,799 and
`2,950, respectively. The weighted average share price of options exercised under the 1999 Plan during the year ended March 31, 2012 and March 31,
Accrued compensation to employees 31 24 Others 8 20
459 406
Deferred tax liabilities
Branch profit tax 270 176
270 176
2.4 OTHER LONG-TERM LIABILITIES
in ` crore
Particulars
2012 2011
Others
14 18
7 7
21 25
2.5 TRADE PAYABLES
in ` crore
Particulars
2012 2011
Trade payables(1)
68 85
68 85 (1)
Includes dues to subsidiaries (refer to note 2.25) 61 55
2.6 OTHER CURRENT LIABILITIES
in ` crore
Particulars
2012 2011
Accrued salaries and benefits
Salaries and benefits 53 42 Bonus and incentives 394 363
Other liabilities
824 537 Retention monies 42 21 Withholding and other taxes payable 454 292
4 4
Other payables(1)
31 1 Advances received from clients 14 19 Unearned revenue 519 488 Mark-to-market loss on forward and options contracts 28 - Unpaid dividends 2 3
2,365 1,770 (1)
Includes dues to subsidiaries (refer to note 2.25) 29 -
As at March 31,
As at March 31,
As at March 31,
As at March 31, 2012 and March 31, 2011, the Company has provided for branch profit tax of `270 and `176 crore, respectively, for its
overseas branches, as the Company estimates that these branch profits would be distributed in the foreseeable future. Branch profit tax
balance increased by `22 crore during the year ended March 31, 2012 due to foreign currency fluctuation impact.
Provision for expenses
Gratuity obligation - unamortised amount relating to plan amendment,
current (refer to note 2.28)
Gratuity obligation - unamortised amount relating to plan amendment (refer to
note 2.28 )
Rental deposits received from subsidiary (refer to note 2.25)
As at March 31,
Deferred tax assets and deferred tax liabilities have been offset wherever the Company has a legally enforceable right to set off current tax
assets against current tax liabilities and where the deferred tax assets and deferred tax liabilities relate to income taxes levied by the same
taxation authority.
11
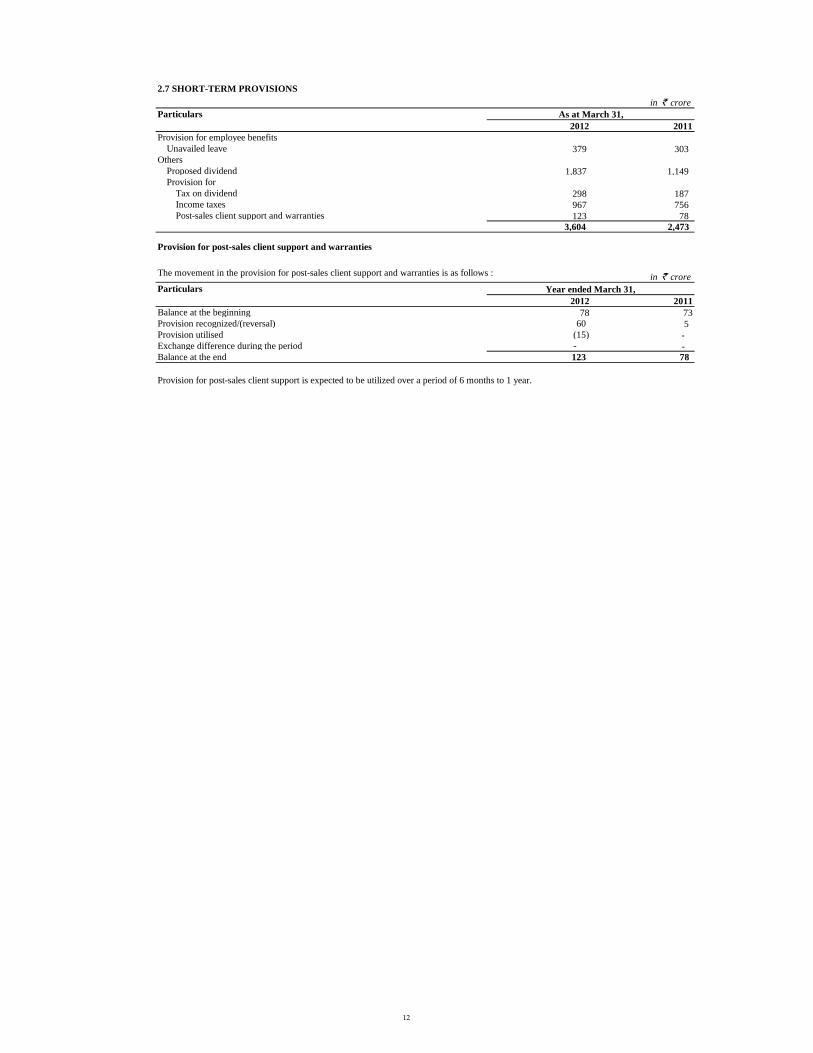
2.7 SHORT-TERM PROVISIONS
in ` crore
Particulars
2012 2011
Provision for employee benefits
Unavailed leave 379 303 Others
Proposed dividend 1,837 1,149 Provision for
Tax on dividend 298 187 Income taxes 967 756 Post-sales client support and warranties 123 78
3,604 2,473
Provision for post-sales client support and warranties
The movement in the provision for post-sales client support and warranties is as follows : in ` crore
Particulars
2012 2011
Balance at the beginning 78 73 Provision recognized/(reversal) 60 5 Provision utilised (15) - Exchange difference during the period - - Balance at the end 123 78
As at March 31,
Provision for post-sales client support is expected to be utilized over a period of 6 months to 1 year.
Year ended March 31,
12
2.8 FIXED ASSETS
in ` crore, except as otherwise stated
As at Additions/Adjustments Deductions/ As at As at For the Deductions/Adjustments As at As at As at
April 1, during the period Retirement during March 31, April 1, period during March 31, March 31, March 31,
2011 the period 2012 2011 the period 2012 2012 2011
Buildings include ` 250/- being the value of 5 shares of ` 50/- each in Mittal Towers Premises Co-operative Society Limited.
(2) Includes certain assets provided on operating lease to Infosys BPO, a subsidiary.
(3)
During the years ended March 31, 2012 and March 31, 2011, certain assets which were old and not in use having gross book value of ` 559 crore and ` 440 crore respectively, (net book value nil) were retired.
(4)
Includes computer equipment having gross book value of ` 10 crore (net book value ` 2 crore) transferred from Infosys Consulting Inc. on merger.
Particulars
Original cost Depreciation and amortization Net book value
13
in ` crore
Particulars CostAccumulated
depreciationNet book value
Buildings 60 29 31
60 25 35 Plant and machinery 3 3 -
3 2 1 Computer equipment 1 1 -
1 1 - Furniture and fixtures 2 2 -
1 1 -
Total 66 35 31
65 29 36
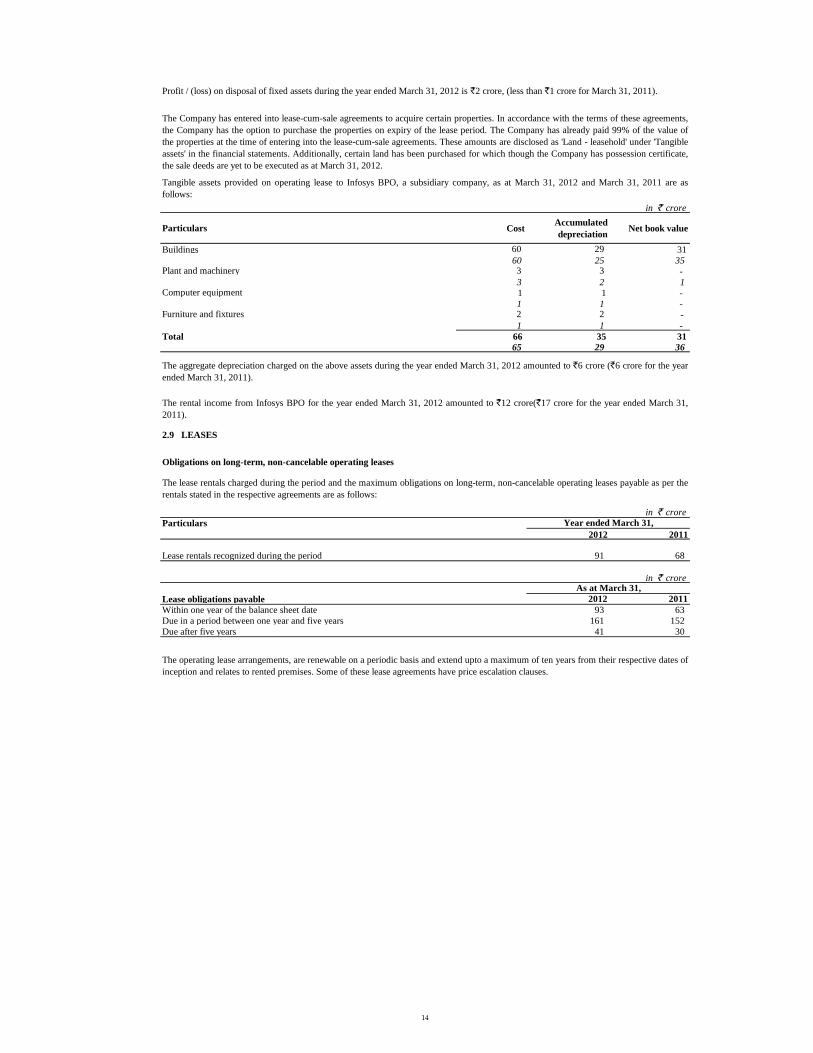
2.9 LEASES
Obligations on long-term, non-cancelable operating leases
in ` crore
Particulars
2012 2011
Lease rentals recognized during the period 91 68
in ` crore
Lease obligations payable 2012 2011
Within one year of the balance sheet date 93 63
Due in a period between one year and five years 161 152
Due after five years 41 30
Profit / (loss) on disposal of fixed assets during the year ended March 31, 2012 is `2 crore, (less than `1 crore for March 31, 2011).
The Company has entered into lease-cum-sale agreements to acquire certain properties. In accordance with the terms of these agreements,
the Company has the option to purchase the properties on expiry of the lease period. The Company has already paid 99% of the value of
the properties at the time of entering into the lease-cum-sale agreements. These amounts are disclosed as 'Land - leasehold' under 'Tangible
assets' in the financial statements. Additionally, certain land has been purchased for which though the Company has possession certificate,
the sale deeds are yet to be executed as at March 31, 2012.
The lease rentals charged during the period and the maximum obligations on long-term, non-cancelable operating leases payable as per the
rentals stated in the respective agreements are as follows:
The operating lease arrangements, are renewable on a periodic basis and extend upto a maximum of ten years from their respective dates of
inception and relates to rented premises. Some of these lease agreements have price escalation clauses.
Tangible assets provided on operating lease to Infosys BPO, a subsidiary company, as at March 31, 2012 and March 31, 2011 are as
follows:
The aggregate depreciation charged on the above assets during the year ended March 31, 2012 amounted to `6 crore (`6 crore for the year
ended March 31, 2011).
Year ended March 31,
The rental income from Infosys BPO for the year ended March 31, 2012 amounted to `12 crore(`17 crore for the year ended March 31,
Third party items bought for service delivery to clients 162 139
625 459
Communication expenses
Telephone charges 150 130
Communication expenses 53 40
203 170
Year ended March 31,
Income from software services
Income from software products
Year ended March 31,
Year ended March 31,
Interest received on deposits with banks and others
Dividend received on investment in mutual fund units
Miscellaneous income, net
Gains / (losses) on foreign currency, net
19
in ` crore
Particulars
2012 2011
Other expenses
Office maintenance 232 188
Power and fuel 154 142
Brand building 82 70
Rent 91 68
Rates and taxes, excluding taxes on income 51 48
Repairs to building 41 44
Repairs to plant and machinery 37 33
Computer maintenance 46 33
Consumables 24 23
Insurance charges 25 24
Research grants 3 14
Marketing expenses 19 14
Commission charges 24 12
Printing and Stationery 11 11
Professional membership and seminar participation fees 14 10
Postage and courier 9 9
Advertisements 4 6
Provision for post-sales client support and warranties 60 5
Commission to non-whole time directors 8 5
Freight Charges 1 1
Provision for bad and doubtful debts and advances 60 3
Books and periodicals 3 3
Auditor's remuneration
Statutory audit fees 1 1
Bank charges and commission 2 1
Donations 26 1
1,028 769
2.19 TAX EXPENSE
in ` crore
2012 2011
Current tax
3,053 2,521
57 (143)
3,110 2,378
Income taxes
The provision for taxation includes tax liabilities in India on the company’s global income as reduced by exempt incomes
and any tax liabilities arising overseas on income sourced from those countries. Infosys' operations are conducted through
Software Technology Parks ('STPs') and Special Economic Zones ('SEZs'). Income from STPs were tax exempt for the
earlier of 10 years commencing from the fiscal year in which the unit commences software development, or March 31,
2011. Income from SEZs is fully tax exempt for the first 5 years, 50% exempt for the next 5 years and 50% exempt for
another 5 years subject to fulfilling certain conditions.
Deferred taxes
Income taxes
Year ended March 31,
Year ended March 31,
20
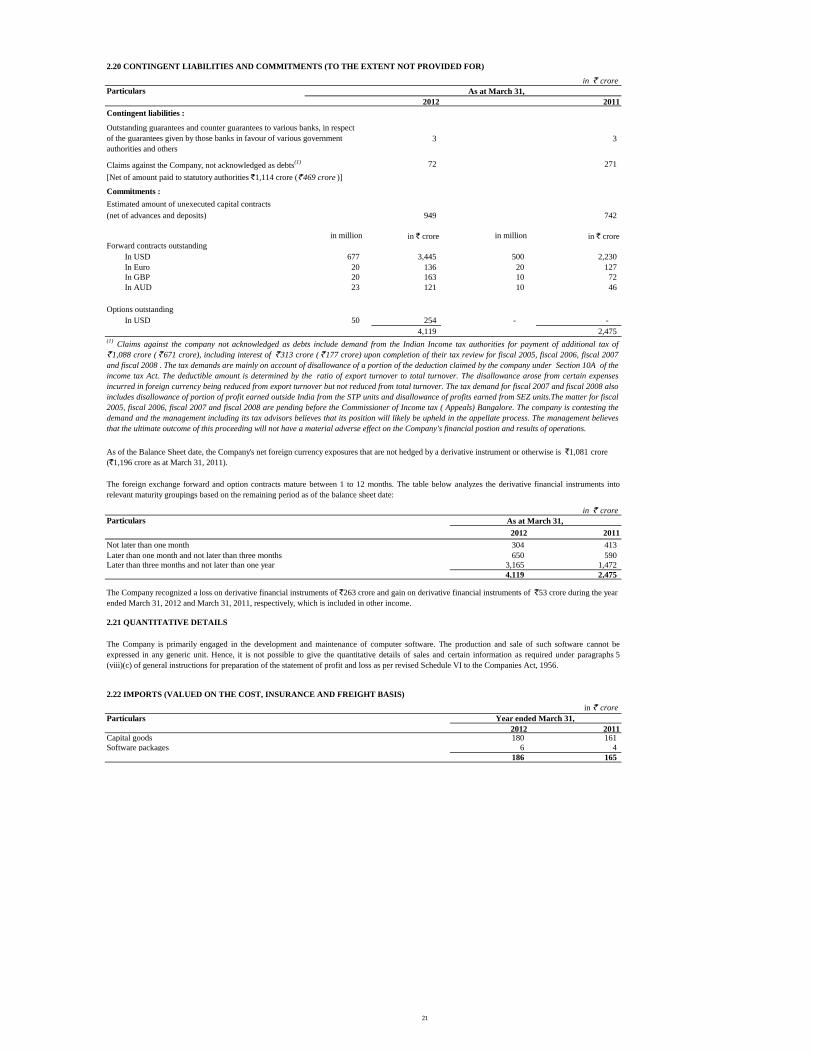
2.20 CONTINGENT LIABILITIES AND COMMITMENTS (TO THE EXTENT NOT PROVIDED FOR)
in ` crore
Particulars
Contingent liabilities :
3 3
Claims against the Company, not acknowledged as debts(1) 72 271
Commitments :
Estimated amount of unexecuted capital contracts
(net of advances and deposits) 949 742
in million in ` crore in million in ` croreForward contracts outstanding
In USD 677 3,445 500 2,230
In Euro 20 136 20 127
In GBP 20 163 10 72
In AUD 23 121 10 46
Options outstanding
In USD 50 254 - -
4,119 2,475
in ` crore
Particulars
2012 2011
Not later than one month 304 413
Later than one month and not later than three months 650 590
Later than three months and not later than one year 3,165 1,472
4,119 2,475
2.21 QUANTITATIVE DETAILS
2.22 IMPORTS (VALUED ON THE COST, INSURANCE AND FREIGHT BASIS)
in ` crore
Particulars
2012 2011Capital goods 180 161
Software packages 6 4
186 165
As at March 31,
(1)Claims against the company not acknowledged as debts include demand from the Indian Income tax authorities for payment of additional tax of
` 1,088 crore ( ` 671 crore), including interest of ` 313 crore ( ` 177 crore) upon completion of their tax review for fiscal 2005, fiscal 2006, fiscal 2007
and fiscal 2008 . The tax demands are mainly on account of disallowance of a portion of the deduction claimed by the company under Section 10A of the
income tax Act. The deductible amount is determined by the ratio of export turnover to total turnover. The disallowance arose from certain expenses
incurred in foreign currency being reduced from export turnover but not reduced from total turnover. The tax demand for fiscal 2007 and fiscal 2008 also
includes disallowance of portion of profit earned outside India from the STP units and disallowance of profits earned from SEZ units.The matter for fiscal
2005, fiscal 2006, fiscal 2007 and fiscal 2008 are pending before the Commissioner of Income tax ( Appeals) Bangalore. The company is contesting the
demand and the management including its tax advisors believes that its position will likely be upheld in the appellate process. The management believes
that the ultimate outcome of this proceeding will not have a material adverse effect on the Company's financial postion and results of operations.
As of the Balance Sheet date, the Company's net foreign currency exposures that are not hedged by a derivative instrument or otherwise is `1,081 crore
(`1,196 crore as at March 31, 2011).
The Company recognized a loss on derivative financial instruments of `263 crore and gain on derivative financial instruments of `53 crore during the year
ended March 31, 2012 and March 31, 2011, respectively, which is included in other income.
Year ended March 31,
[Net of amount paid to statutory authorities `1,114 crore (` 469 crore )]
Outstanding guarantees and counter guarantees to various banks, in respect
of the guarantees given by those banks in favour of various government
authorities and others
The foreign exchange forward and option contracts mature between 1 to 12 months. The table below analyzes the derivative financial instruments into
relevant maturity groupings based on the remaining period as of the balance sheet date:
As at March 31,
The Company is primarily engaged in the development and maintenance of computer software. The production and sale of such software cannot be
expressed in any generic unit. Hence, it is not possible to give the quantitative details of sales and certain information as required under paragraphs 5
(viii)(c) of general instructions for preparation of the statement of profit and loss as per revised Schedule VI to the Companies Act, 1956.
2012 2011
21
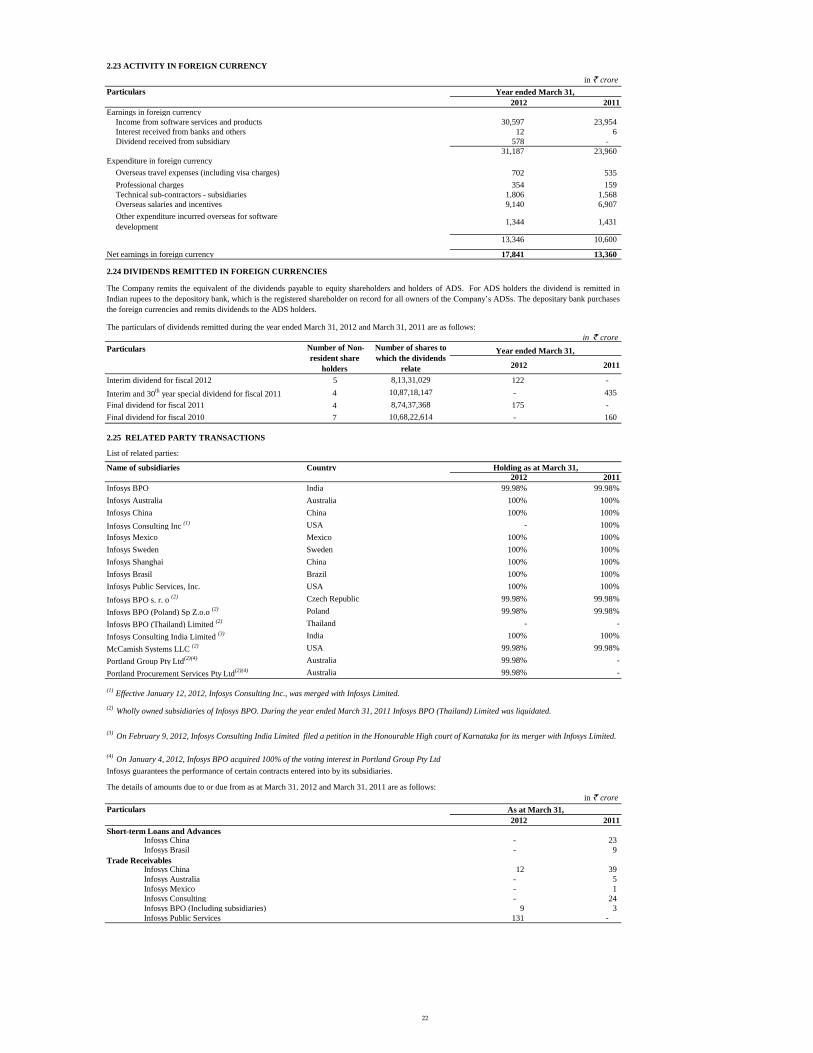
2.23 ACTIVITY IN FOREIGN CURRENCY
in ` crore
Particulars
2012 2011
Earnings in foreign currency
Income from software services and products 30,597 23,954
Infosys Consulting India Limited (3) India 100% 100%
McCamish Systems LLC (2) USA 99.98% 99.98%
Portland Group Pty Ltd(2)(4) Australia 99.98% -
Portland Procurement Services Pty Ltd(2)(4) Australia 99.98% -
in ` crore
Particulars
2012 2011
Infosys China - 23
Infosys Brasil - 9
Infosys China 12 39
Infosys Australia - 5
Infosys Mexico - 1
Infosys Consulting - 24
Infosys BPO (Including subsidiaries) 9 3
Infosys Public Services 131 -
Short-term Loans and Advances
(1) Effective January 12, 2012, Infosys Consulting Inc., was merged with Infosys Limited.
Infosys guarantees the performance of certain contracts entered into by its subsidiaries.
The details of amounts due to or due from as at March 31, 2012 and March 31, 2011 are as follows:
The Company remits the equivalent of the dividends payable to equity shareholders and holders of ADS. For ADS holders the dividend is remitted in
Indian rupees to the depository bank, which is the registered shareholder on record for all owners of the Company’s ADSs. The depositary bank purchases
the foreign currencies and remits dividends to the ADS holders.
Overseas travel expenses (including visa charges)
10,68,22,614
Number of Non-
resident share
holders
Number of shares to
which the dividends
relate
8,74,37,368
(4) On January 4, 2012, Infosys BPO acquired 100% of the voting interest in Portland Group Pty Ltd
Trade Receivables
Year ended March 31,
10,87,18,147
Year ended March 31,
8,13,31,029
(2) Wholly owned subsidiaries of Infosys BPO. During the year ended March 31, 2011 Infosys BPO (Thailand) Limited was liquidated.
As at March 31,
(3) On February 9, 2012, Infosys Consulting India Limited filed a petition in the Honourable High court of Karnataka for its merger with Infosys Limited.
Other expenditure incurred overseas for software
development
Name of subsidiaries Holding as at March 31,
22
in ` crore
Particulars
2012 2011
Infosys Australia 1 -
Infosys BPO (Including subsidiaries) 1 -
Infosys Public Services 11 -
Infosys China 6 32
Infosys Australia 52 -
Infosys BPO (Including subsidiaries) 2 3
Infosys Consulting - 17
Infosys Consulting India - 1
Infosys Mexico - 1
Infosys Sweden 1 1
Infosys Australia 2 -
Infosys BPO (Including subsidiaries) 8 -
Infosys Consulting India 2 -
Infosys Public Services 17 -
Infosys BPO (Including subsidiaries) 3 -
Infosys BPO 7 7
in ` crore
Particulars
2012 2011
Capital transactions:
Infosys Shanghai 82 11
Infosys Mexico - 14
Infosys Brasil 22 10
Infosys China - 42
Infosys Consulting India 1 -
Loans
Infosys Brasil (10) 9
Infosys China (25) (23)
Revenue transactions:
Purchase of services
Infosys Australia 1,333 889
Infosys China 263 240
Infosys Consulting 146 353
Infosys Consulting India 2 5
Infosys BPO (Including subsidiaries) 27 17
Infosys Sweden 10 12
Infosys Mexico 27 49
Infosys Brasil 1 3
Infosys Consulting (including subsidiaries) 2 -
Infosys BPO (including subsidiaries) 101 114
Interest income
Infosys China 1 2
Infosys Brasil 1 -
Sale of services
Infosys Australia 14 33
Infosys China 8 6
Infosys Brasil 1 -
Infosys Mexico 5 -
Infosys BPO (including subsidiaries) 34 21
Infosys Consulting 43 73
Infosys Public Services 171 -
Sale of shared services including facilities and personnel
Infosys BPO (including subsidiaries) 57 78
Infosys Consulting 21 4
Dividend income
Infosys Australia 578 -
The table below describes the compensation to key managerial personnel which comprise directors and members of executive council:
in ` crore
Particulars
2012 2011Salaries and other employee benefits 45 33
Year ended March 31,
During the year ended March 31, 2012, an amount of `20 crore (Nil for the year ended March 31, 2011) was donated to Infosys Foundation, a not-for-
profit foundation, in which certain directors of the Company are trustees.
Purchase of shared services including facilities and
personnel
Deposit taken for shared services
Financing transactions
Deposit given for shared services
Other Receivables
Trade Payables
Other Payables
Year ended March 31,
The details of the related party transactions entered into by the Company, in addition to the lease commitments described in note 2.8, for the year ended
March 31, 2012 and March 31, 2011 are as follows:
During the year ended March 31, 2012, an amount of Nil (`12 crore for the year ended March 31, 2011 respectively) has been granted to Infosys Science
Foundation, a not-for-profit foundation, in which certain directors and officers of the Company are trustees.
As at March 31,
23
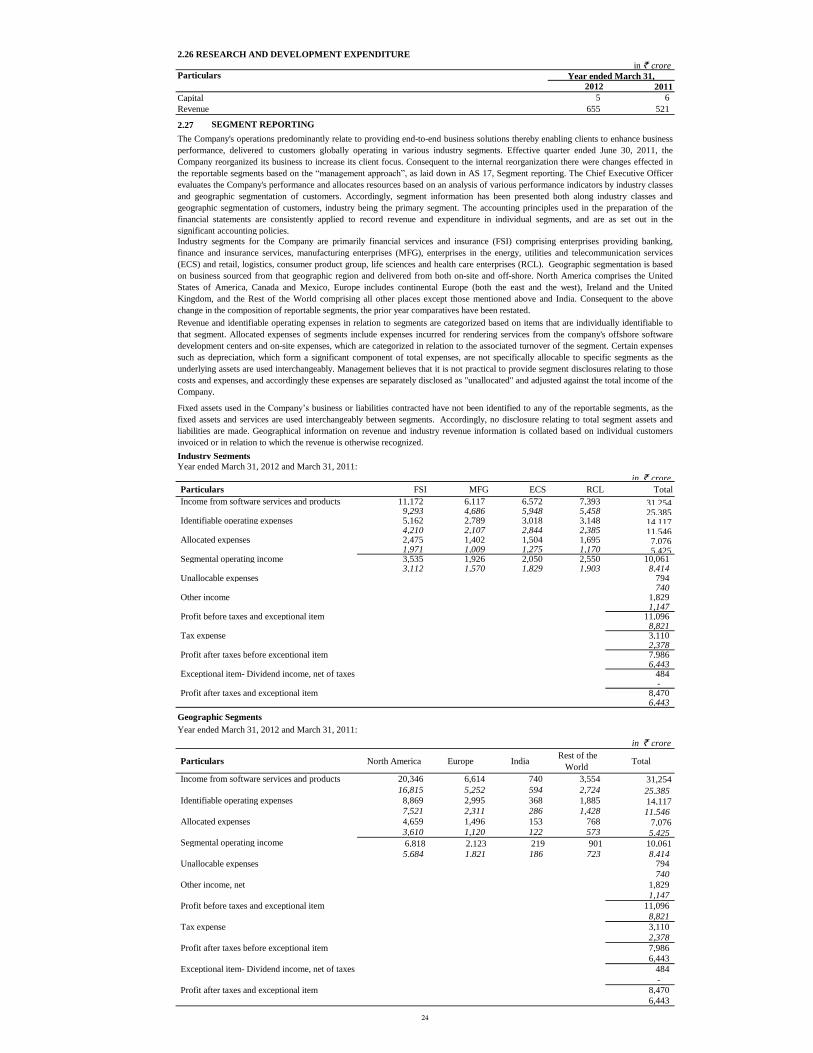
2.26 RESEARCH AND DEVELOPMENT EXPENDITURE
in ` croreParticulars
2012 2011
Capital 5 6
Revenue 655 521
2.27
Industry Segments
in ` crore
Particulars FSI MFG ECS RCL Total
Income from software services and products 11,172 6,117 6,572 7,393 31,254 9,293 4,686 5,948 5,458 25,385
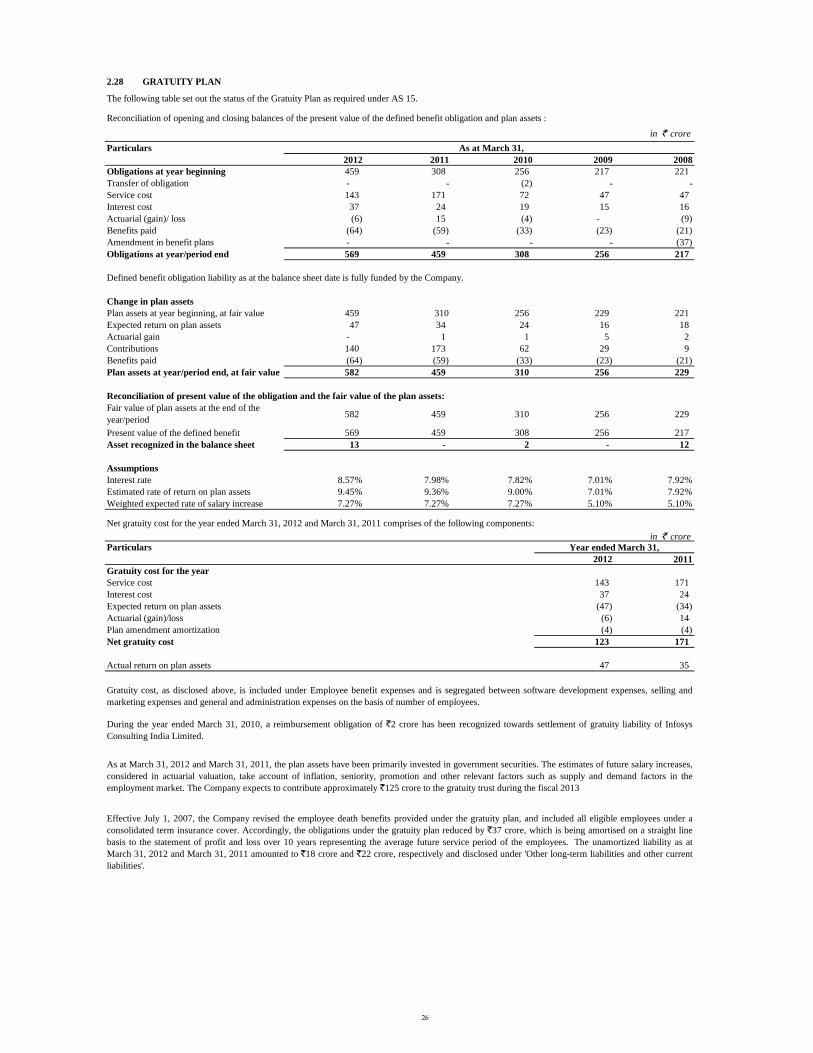
Net gratuity cost for the year ended March 31, 2012 and March 31, 2011 comprises of the following components:
in ` crore
Particulars
2012 2011
Gratuity cost for the year
Service cost 143 171
Interest cost 37 24
Expected return on plan assets (47) (34)
Actuarial (gain)/loss (6) 14
Plan amendment amortization (4) (4)
Net gratuity cost 123 171
Actual return on plan assets 47 35
Reconciliation of opening and closing balances of the present value of the defined benefit obligation and plan assets :
Gratuity cost, as disclosed above, is included under Employee benefit expenses and is segregated between software development expenses, selling and
marketing expenses and general and administration expenses on the basis of number of employees.
During the year ended March 31, 2010, a reimbursement obligation of `2 crore has been recognized towards settlement of gratuity liability of Infosys
Consulting India Limited.
As at March 31, 2012 and March 31, 2011, the plan assets have been primarily invested in government securities. The estimates of future salary increases,
considered in actuarial valuation, take account of inflation, seniority, promotion and other relevant factors such as supply and demand factors in the
employment market. The Company expects to contribute approximately `125 crore to the gratuity trust during the fiscal 2013
Effective July 1, 2007, the Company revised the employee death benefits provided under the gratuity plan, and included all eligible employees under a
consolidated term insurance cover. Accordingly, the obligations under the gratuity plan reduced by `37 crore, which is being amortised on a straight line
basis to the statement of profit and loss over 10 years representing the average future service period of the employees. The unamortized liability as at
March 31, 2012 and March 31, 2011 amounted to `18 crore and `22 crore, respectively and disclosed under 'Other long-term liabilities and other current
liabilities'.
in ` crore
As at March 31,Particulars
Year ended March 31,
Fair value of plan assets at the end of the
year/period
Present value of the defined benefit
26
2.29 PROVIDENT FUND
in ` crore
2012 2011 2010 2009 2008
1,816 1,579 1,295 997 743
1,816 1,579 1,295 997 743
Asset recognized in balance sheet - - - - -
Assumptions used in determining the present value obligation of the interest rate guarantee under the Deterministic Approach:
2012 2011 2010 2009 2008
8.57% 7.98% 7.83% 7.01% 7.96%
8 years 7 years 7 years 6 years 6 years
8.25% 9.50% 8.50% 8.50% 8.50%
2.30 SUPERANNUATION
2.31 RECONCILIATION OF BASIC AND DILUTED SHARES USED IN COMPUTING EARNINGS PER SHARE
Particulars
2012 2011
57,41,99,094 57,40,13,650
30,648 1,88,308
57,42,29,742 57,42,01,958
2.32 RESTRICTED DEPOSITS
2.33 DUES TO MICRO SMALL AND MEDIUM ENTERPRISES
2.34 EXCEPTIONAL ITEM
During the quarter and year ended March 31, 2012, the Company received dividend of `484 crore, net of taxes of `94 crore from its wholly owned
subsidiary Infosys Australia.
The company has no dues to micro and small enterprises during the year ended March 31, 2012 and March 31, 2011 and as at March 31, 2012 and March
31, 2011.
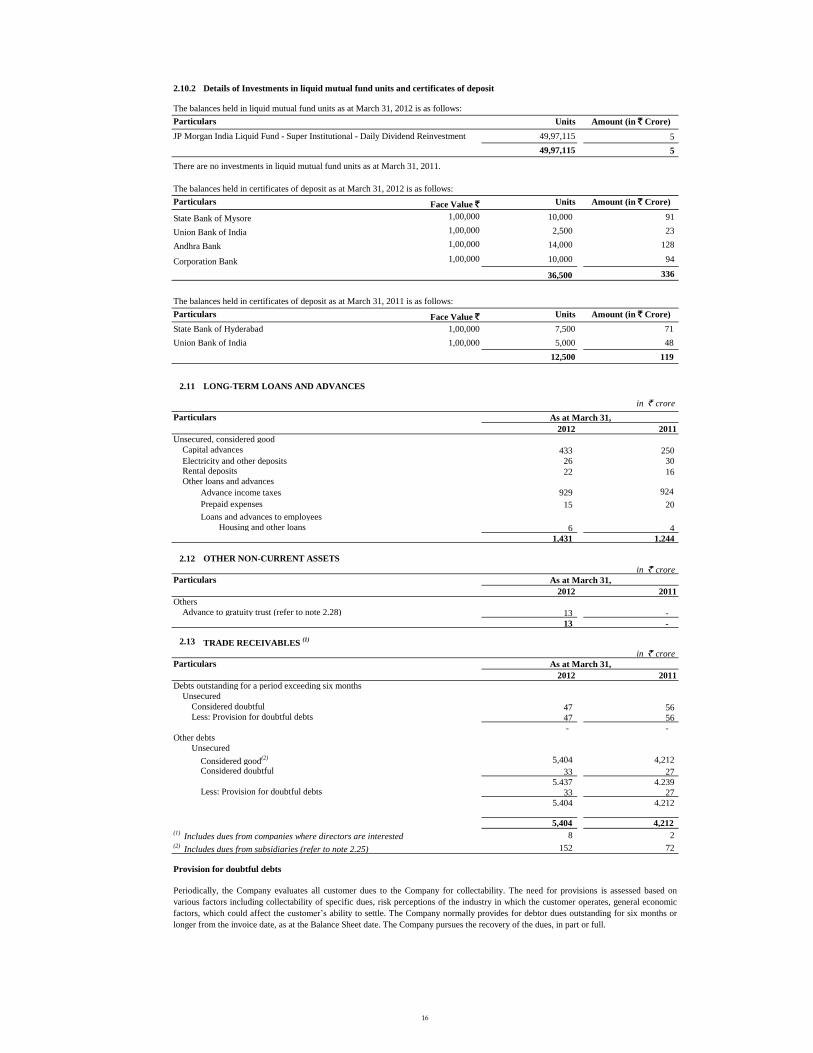
Deposits with financial institutions as at March 31, 2012 include `461 crore (`344 crore as at March 31, 2011) deposited with Life Insurance Corporation
of India to settle employee-related obligations as and when they arise during the normal course of business. This amount is considered as restricted cash
and is hence not considered 'cash and cash equivalents'.
The details of fund and plan asset position are given below:
Particulars
The Guidance on Implementing AS 15, Employee Benefits (revised 2005) issued by Accounting Standards Board (ASB) states that benefits involving
employer established provident funds, which require interest shortfalls to be recompensed are to be considered as defined benefit plans. The Actuarial
Society of India has issued the final guidance for measurement of provident fund liabilities during the quarter ended December 31, 2011. The actuary has
accordingly provided a valuation and based on the below provided assumptions there is no shortfall as at March 31, 2012 , 2011, 2010, 2009 and 2009,
respectively.
The Company contributed `214 crore towards provident fund during the year ended March 31, 2012, respectively (`179 crore during the year ended
March 31, 2011, respectively).
The Company contributed `63 crore to the superannuation trust during the year ended March 31, 2012, respectively (`57 crore during the year ended
March 31, 2011, respectively).
As at March 31,
Plan assets at period end, at fair value
Present value of benefit obligation at period
end
Particulars As at March 31,
Government of India (GOI) bond yield
Remaining term of maturity
Expected guaranteed interest rate
Year ended March 31,
Add: Effect of dilutive issues of shares/stock options
Number of shares considered as weighted average shares and
potential shares outstanding
Number of shares considered as basic weighted average shares
outstanding
27
2.35 SCHEDULES TO CASH FLOW STATEMENTS
in ` crore, except as otherwise stated
Particulars2012 2011
2.35.1 CHANGE IN TRADE RECEIVABLES
As per the balance sheet 5,404 4,212
12 -
4,212 3,244
1,180 968
2.35.2 CHANGE IN LOANS AND ADVANCES AND OTHER ASSETS
As per the balance sheet (current and non current)(1)
4,605 3,617
18 22
Interest accrued but not due 31 14 Loan to subsidiary - 32 Advance income taxes 929 924
Capital Advance 433 250
3,194 2,375 Less: Opening balance considered 2,375 1,671
819 704
(2) refer to note 2.28
2.35.3 CHANGE IN LIABILITIES AND PROVISIONS
As per the balance sheet (current and non current)(1) 6,050 4,353
Less: Unpaid dividend 2 3 Retention monies 42 21 Gratuity obligation - unamortised amount relating to plan amendment 18 22 Provisions separately considered in Cash Flow statement
Income taxes 967 756
Proposed dividend 1,837 1,149
Tax on dividend 298 187
2,886 2,215 Less: Opening balance considered 2,215 1,981
671 234
2.35.4 INCOME TAXES PAID
Charge as per the profit and loss account 3,110 2,378
Add/(Less) : Increase/(Decrease) in advance income taxes (1)
(1) 283
Increase/(Decrease) in deferred taxes (2)(3) (57) 143
Income tax benefit arising from exercise of stock options (1) (11)
(Increase)/Decrease in income tax provision(4)
(207) (37)
2,844 2,756
(2) excludes exchange difference of ` 22 crore and ` 6 crore for the year ended March 31, 2012 and March 31, 2011
2.35.5 PAYMENT TOWARDS CAPITAL EXPENDITURE
As per the balance sheet (1)(2) 797 1,017
Less: Profit on sale of tangible assets 2 -
Less: Opening capital work-in-progress 249 228 Add: Closing capital work-in-progress 588 249
Add: Opening retention monies 21 66
Less: Closing retention monies 42 21
Add: Closing capital advance 433 250
Less: Opening capital advance 250 181
1,296 1,152
2.35.6 INVESTMENTS IN SUBSIDIARIES (1)
As per the balance sheet (2)
1,063 1,202 Less: Opening balance considered
(3)959 1,125
104 77 (1)
refer to note 2.25 for investment made in subsidiaries
2.35.7 INVESTMENT/(DISPOSAL) OF OTHER INVESTMENTS
Opening balance considered 119 3,497
Less: Closing balance 341 119
(222) 3,378
2.35.8 INTEREST AND DIVIDEND RECEIVED
Interest and dividend income as per profit and loss account 1,720 1,086 Add: Opening interest accrued but not due on certificate of deposits and bank deposits 14 14
Less: Closing interest accrued but not due on certificate of deposits and bank deposits 31 14
and subsidiary loan
1,703 1,086
2.35.9 LOAN GIVEN TO SUBSIDIARIES
Closing Balance - 32
Less: Increase in loan balance due to exchange difference 3 -
Less: Opening balance 32 46
(35) (14)
(3) excludes investment of ` 243 crore as of March 31, 2011 in Infosys Consulting Inc., USA pursuant to merger effective January 2012
(2) net of assets having gross book value of ` 10 crore (net book value ` 2 crore) taken over from Infosys Consulting Inc., USA pursuant to
merger effective January 2012
(2) excludes investment in Infosys Consulting India Limited of ` 1 crore taken over from Infosys Consulting Inc., USA pursuant to merger
effective January 2012
Year ended March 31,
Less: Gratuity obligation - unamortised amount relating to plan amendment(2)
(1) net of ` 3 crore movement in land from leasehold to free-hold upon acquisition for the year ended March 31, 2011
Less: Trade receivables taken over from Infosys Consulting Inc., USA pursuant to merger
effective January 2012
Less: Opening balance considered
(1) excludes loans and advances and other assets of ` 2 crore taken over from Infosys Consulting Inc., USA pursuant to merger effective
January 2012
(1) excludes trade payables of ` 8 crore taken over from Infosys Consulting Inc., USA pursuant to merger effective January 2012
(1) excludes advance taxes ` 6 crore taken over from Infosys Consulting Inc., USA pursuant to merger effective January 2012
(4) excludes provision for taxes of ` 4 crore taken over from Infosys Consulting Inc., USA pursuant to merger effective January 2012
(3) excludes deferred tax asset of ` 38 crore taken over from Infosys Consulting Inc., USA pursuant to merger effective January 2012
28
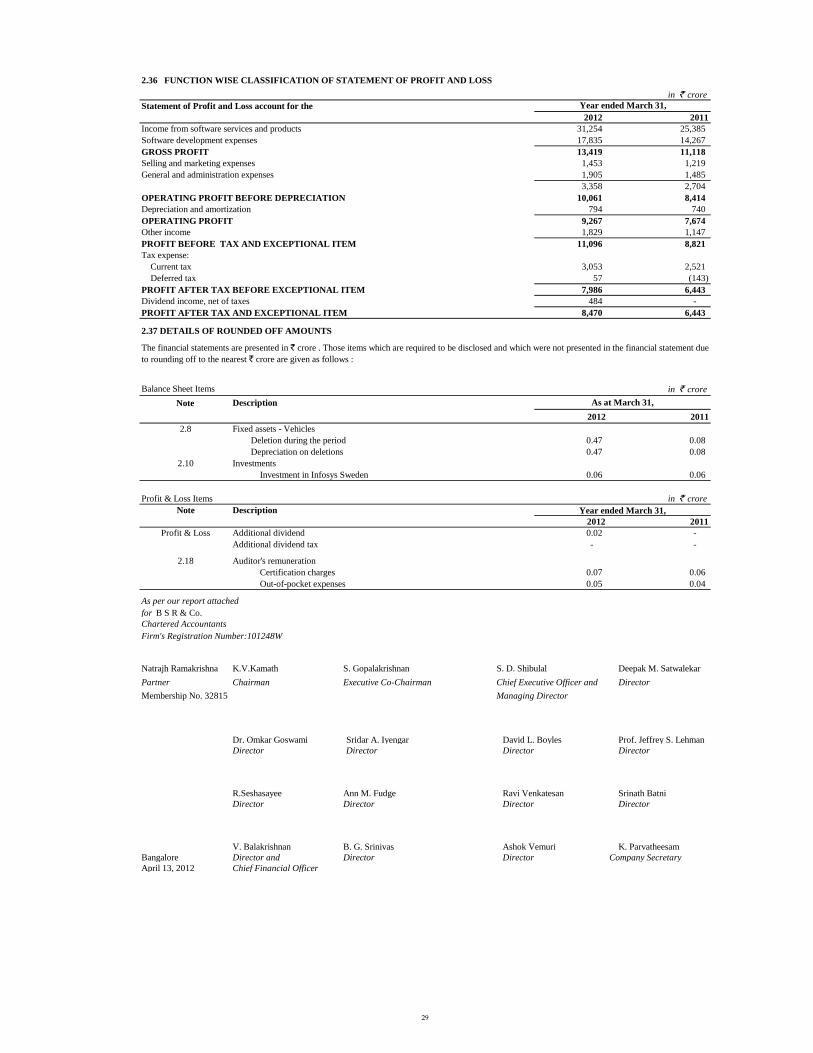
2.36 FUNCTION WISE CLASSIFICATION OF STATEMENT OF PROFIT AND LOSS
in ` crore
Statement of Profit and Loss account for the
2012 2011
Income from software services and products 31,254 25,385
Software development expenses 17,835 14,267
GROSS PROFIT 13,419 11,118
Selling and marketing expenses 1,453 1,219
General and administration expenses 1,905 1,485
3,358 2,704
OPERATING PROFIT BEFORE DEPRECIATION 10,061 8,414
Depreciation and amortization 794 740
OPERATING PROFIT 9,267 7,674
Other income 1,829 1,147
PROFIT BEFORE TAX AND EXCEPTIONAL ITEM 11,096 8,821
Tax expense:
Current tax 3,053 2,521
Deferred tax 57 (143)
PROFIT AFTER TAX BEFORE EXCEPTIONAL ITEM 7,986 6,443
Dividend income, net of taxes 484 -
PROFIT AFTER TAX AND EXCEPTIONAL ITEM 8,470 6,443
2.37 DETAILS OF ROUNDED OFF AMOUNTS
Balance Sheet Items in ` crore
Note Description
2012 2011
2.8 Fixed assets - Vehicles
Deletion during the period 0.47 0.08
Depreciation on deletions 0.47 0.08
2.10 Investments
Investment in Infosys Sweden 0.06 0.06
Profit & Loss Items in ` crore
Note Description
2012 2011
Profit & Loss Additional dividend 0.02 -
Additional dividend tax - -
2.18 Auditor's remuneration
Certification charges 0.07 0.06
Out-of-pocket expenses 0.05 0.04
As per our report attached
for B S R & Co.
Chartered Accountants
Firm's Registration Number:101248W
Natrajh Ramakrishna K.V.Kamath S. Gopalakrishnan S. D. Shibulal Deepak M. Satwalekar
Partner Chairman Executive Co-Chairman Chief Executive Officer and Director
Membership No. 32815 Managing Director
Dr. Omkar Goswami Sridar A. Iyengar David L. Boyles Prof. Jeffrey S. Lehman
Director Director Director Director
R.Seshasayee Ann M. Fudge Ravi Venkatesan Srinath Batni
Director Director Director Director
V. Balakrishnan B. G. Srinivas Ashok Vemuri K. Parvatheesam
Bangalore Director and Director Director Company Secretary
April 13, 2012 Chief Financial Officer
Year ended March 31,
Year ended March 31,
The financial statements are presented in ` crore . Those items which are required to be disclosed and which were not presented in the financial statement due
to rounding off to the nearest ` crore are given as follows :