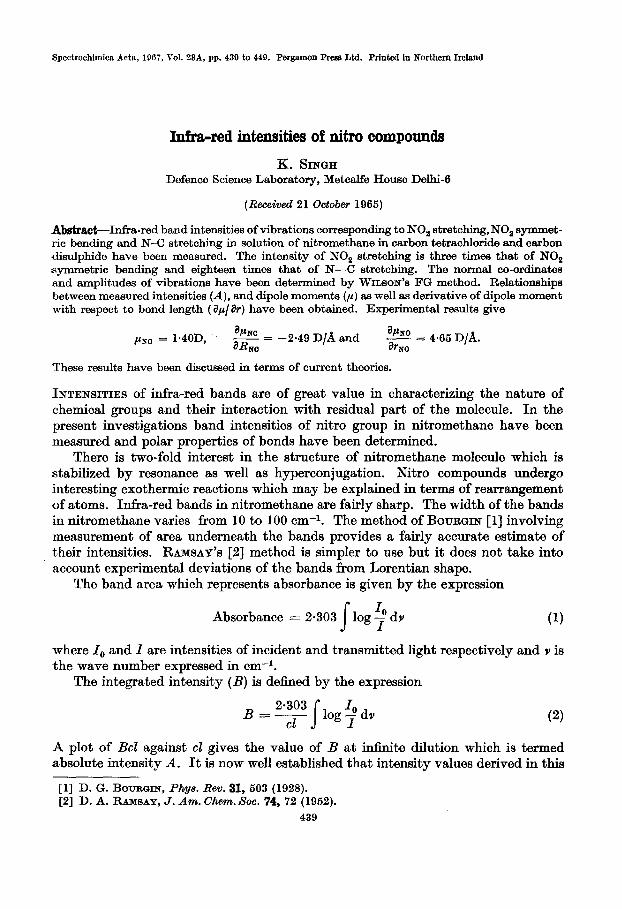
Spectrochimica Acta, 1967, Vol. 23A, pp. 439 to 449. Pergamon Press Ltd. Printed in Northern Ireland I&a-red intensities of nitro compounds K. SINGlH Defence Science Laboratory, Metcalfe House Delhi-0 (Received 21 October 1965) Abstract_--Infrared band intensities of vibrations corresponding to NO, stretching,NOs symmet- ric bending end N-C stretching in solution of nitromethanein carbon tetrachloride end carbon disulphide have been mesenred. The intensity of NO, stretching is three times that of NO, symmetric bending and eighteen times that of N-G stretching. The normel co-ordinates snd amplitudes of vibrations have been determined by WILSON’S FG method. Relationships betweenmeasuredintensities(A), and dipole moments (p) as well ss derivative of dipole moment with respect to bond length ( a,~/%) hsve been obtained. Experimental results give /‘xc = 1.40D, apNQ - = a&c -2.49 D/A end E = 4.65 D/A. These results hsve been discussedin terms of current theories. INTENSITIES of i&a-red bands are of great value in characterizing the nature of chemical groups and their interaction with residual part of the molecule. In the present investigations band intensities of nitro group in nitromethane have been measured and polar properties of bonds have been determined. There is two-fold interest in the structure of nitromethane molecule which is stabilized by resonance as well as hyperconjugation. Nitro compounds undergo interesting exothermic reactions which may be explained in terms of rearrangement of atoms. I&a-red bands in nitromethane are fairly sharp. The width of the bands in nitromethane varies from 10 to 100 cm- l. The method of BOTJWIN [l] involving measurement of area underneath the bands provides a fairly accurate estimate of their intensities. RAMSAY’S [2] method is simpler to use but it does not take into account experimental deviations of the bands from Lorentian shape. The band area which represents absorbance is given by the expression Absorbance = 2.303 s log $ dv (1) where 1, and I are intensities of incident and transmitted light respectively and v is the wave number expressed in cm-l. The integrated intensity (B) is defined by the expression 2.303 B=cd s log : dv A plot of Bcl against cl gives the value of B at in&rite dilution which is termed absolute intensity A. It is now well established that intensity values derived in this [l] D. G. BOURQIN, Phye. Rev. 31, 503 (1928). [2] D. A. RAMSAY, J. Am. Chma. Sot. 74, 72 (1952). 439
Transcript
Spectrochimica Acta, 1967, Vol. 23A, pp. 439 to 449. Pergamon Press Ltd. Printed in Northern Ireland
I&a-red intensities of nitro compounds
K. SINGlH
Defence Science Laboratory, Metcalfe House Delhi-0
(Received 21 October 1965)
Abstract_--Infrared band intensities of vibrations corresponding to NO, stretching,NOs symmet- ric bending end N-C stretching in solution of nitromethane in carbon tetrachloride end carbon disulphide have been mesenred. The intensity of NO, stretching is three times that of NO, symmetric bending and eighteen times that of N-G stretching. The normel co-ordinates snd amplitudes of vibrations have been determined by WILSON’S FG method. Relationships between measured intensities (A), and dipole moments (p) as well ss derivative of dipole moment with respect to bond length ( a,~/%) h sve been obtained. Experimental results give
/‘xc = 1.40D, apNQ - = a&c
-2.49 D/A end E = 4.65 D/A.
These results hsve been discussed in terms of current theories.
INTENSITIES of i&a-red bands are of great value in characterizing the nature of chemical groups and their interaction with residual part of the molecule. In the present investigations band intensities of nitro group in nitromethane have been measured and polar properties of bonds have been determined.
There is two-fold interest in the structure of nitromethane molecule which is stabilized by resonance as well as hyperconjugation. Nitro compounds undergo interesting exothermic reactions which may be explained in terms of rearrangement of atoms. I&a-red bands in nitromethane are fairly sharp. The width of the bands in nitromethane varies from 10 to 100 cm- l. The method of BOTJWIN [l] involving measurement of area underneath the bands provides a fairly accurate estimate of their intensities. RAMSAY’S [2] method is simpler to use but it does not take into account experimental deviations of the bands from Lorentian shape.
The band area which represents absorbance is given by the expression
Absorbance = 2.303 s
log $ dv (1)
where 1, and I are intensities of incident and transmitted light respectively and v is the wave number expressed in cm-l.
The integrated intensity (B) is defined by the expression
2.303 B=cd
s log : dv
A plot of Bcl against cl gives the value of B at in&rite dilution which is termed absolute intensity A. It is now well established that intensity values derived in this
[l] D. G. BOURQIN, Phye. Rev. 31, 503 (1928). [2] D. A. RAMSAY, J. Am. Chma. Sot. 74, 72 (1952).
439
440 K. i+XQH
way are independent of slit width over a wide range. Values of A are related to polar properties of bonds including dipole moment (p) and effective charge a,u/&. Values of these parameters have been determined from the band intensities for A, modes of vibrations. An explanation of low value of dipole moment is offered below.
EXPERIMENTAL
Nitromethane with boiling point 101.2”C was used. Carbon tetrachloride had a purity of 99.9 per cent and carbon disulphide had a reagent grade purity. The spectra of pure solvents indicated the absence of interfering impurities. The spectra of solutions of nitromethane in these solvents were recorded on Perkin-Elmer 221 I. R. spectrophotometer using sodium chloride optics. The slit width employed was about O-1 mm. A cell with a nominal length of 2 = O-103 mm was used, the cell length being measured by counting fringes. The spectral records gave percentage transmis- sion versus wave length. The fractional transmission was transferred into log 1,/I. Replots representing variation of log IO/1 with wave number Y in cm-l were obtained. Values of absolute intensity A were foundfromslopes of the lines representing BcZ vs. cl. For each concentration (c) three independent values of A were obtained. An average value of A is given in Table 1. The area under each band was measured by graphical count. An interval of about 30 to 50 cm-l on each side of the peak, de- pending upon the wave length region and intensity, was found to be adequate. Beyond this region there was no appreciable contribution to the area. Background correction was applied by recording spectra of pure solvents. To correct for the presence of a shoulder in the band for symmetric stretching the fall in intensity on the left-hand side of the band near the foot has been assumed to be Lorentian in nature. Due to limitations of the optics in-plane asymmetric and out-of-plane bend- ing modes could not be studied.
RESULTS
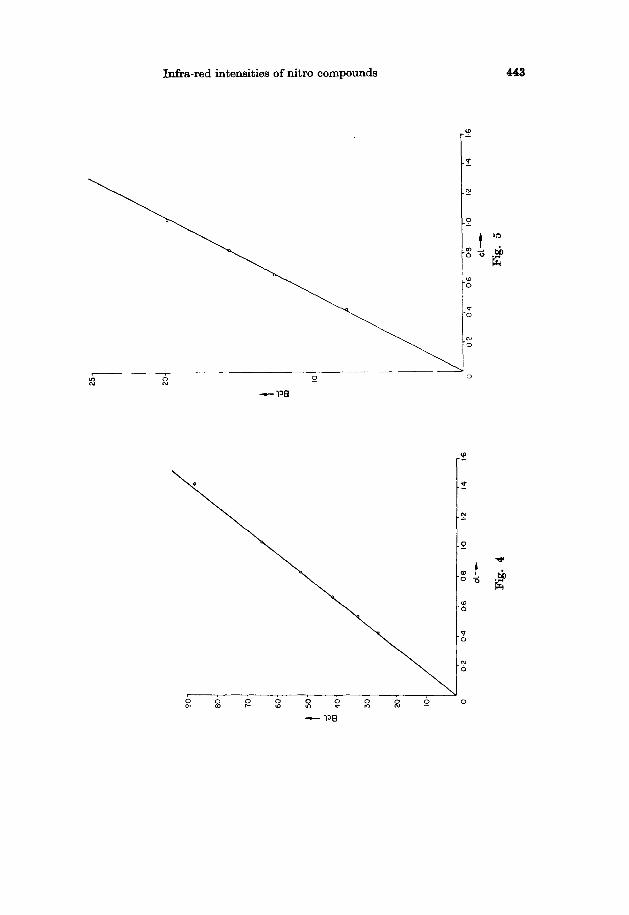
A spectrum of nitromethane in the region 600-3500 cm-l is shown in Fig. 1. The absorption peaks are quite sharp. The peak due to NO, symmetric stretching is overlapped on the right-hand side by other bands. The intensity of only the left-hand side of the band was measured. A representative plot of log I,/1 vs. wave number is shown in Fig. 2. The plots of Bcl vs. optical concentration cl for NO, symmetric stretching, NO, symmetric bending and C-N stretching bands are given in Figs. 3, 4 and 5. The positions of skeletal vibrations, widths at half intensity and absolute intensities of these bands are given in Table 1.
Evaluation of the derivative of dipole moment with respect to normal coordinate Q is carried out by making use of the data on intensity. a,u/aQ, is related to absolute intensity (A) by means of the expression [3]
3C2 1000 A
(i$) = ‘( NnOd )
1’2 (3)
where C is the velocity of light, N is Avogadro’s number, A is intensity in mole-l 1.
[3] B.L. CRAWPORD and H.L.DINsMoRE,J.C~~~.P~~~. 18,1682 (1950).
Infra-red intensities of nitro compounds
Concentration (0 74 moles/l.)
650 7o-3 850 950
Wove number I cm-l
Fig. I(a)
I Corxentrotion (0.74 moles/l.)
650 700 650 950
Wove number Y cm-l
Fig. l(b)
l25c fioo
1250 1400
442 K. SIN~H
lnfbred intensities of nitro compounds 443
444 K. SINC4H
cm-2, and d is degeneracy. The factor 8 is often assumed to be given by the expres- sion [4]
(4)
where n is refractive index of the medium. In view of the uncertain&y about 0, this correction has been ignored and 0 is
assumed equal to one. The values of (a~/@,) ‘s are given in Table 1. The error in
Table 1. Intensity of various bands
Mode
Position Half of the intensity band width (cm-l) (cm-l)
Intensity A (mole-11.cm~2) f (%/a)
ccl, N-C Stretching 916 4.8 0.0372 x 10⁴ 0.296 NO, Symmetric 1377 18.6 0.63 x lo4 1.220
stretching NO, Symmetrio 656 7.4 0.19 x 10⁴ 0.670
the measurement of A is not more than 10 per cent. The frequencies at maximum absorption in carbon disulphide are 914, 1378, 654 cm-l for C-N stretching, sym- metric NO, stretching and NO, symmetric bending modes respectively. The intensity values in CS, are about the same as in Ccl,.
Normal co-ordinates involved in the interpretation of the results have been calculated by the F-G method of WILSON [5]. It is assumed that CH, group is a single particle with mass = 15.04 atomic mass units and the molecule M-NO, is planar with symmetry group C,. Recent X-ray [6] investigations lend support to the planarity of C-NO, group. Structural constants and atomic masses are given below
R = 1.64 A m 15.04 r = 1.21 A
M = ?nN = 14.01
u. = 127’ Atomic mass units
,!? = 116”, 30’ m”y z ;6$
PM =%
Fig. 6
The significance of the symbols R, T, cc, fi and y is given in Fig. 6. Angular displacement Ay is the change in angle resulting from the rocking of the
[4] E. THORNTON, Molecular Spectroscopy, p. 205, Pergamon Press, London (1959). [5] E. B. WILSON, J. Clwn. Phys. 7, 1047 (1939); 9, 76 (1941). [S] C. PHILIPS and G. M. J. SCHMIDT, ActaCryst. 17, 222 (1964).
Infrared intensities of nitro compounds 446
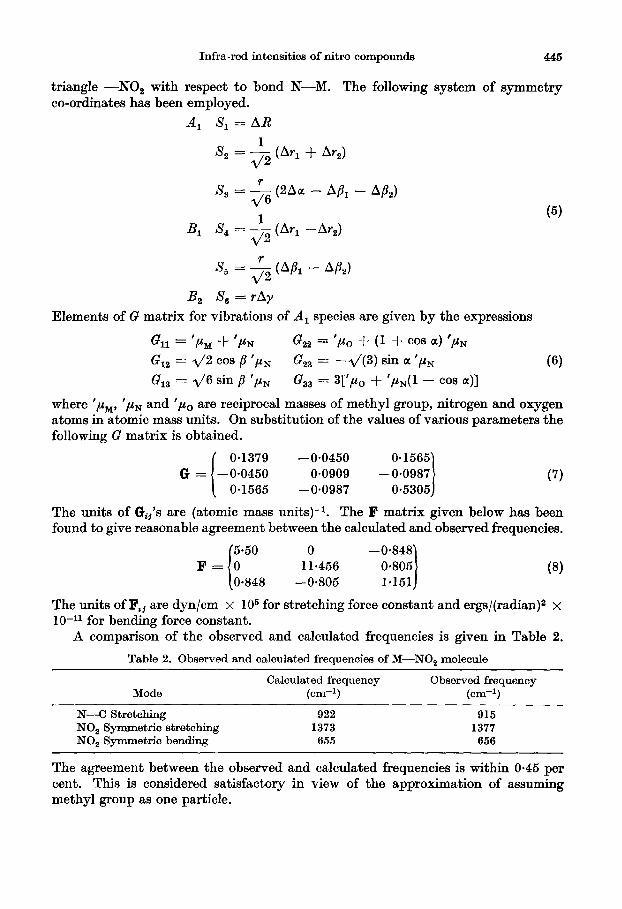
triangle -NO, with respect to bond N-M. The following system of symmetry co-ordinates has been employed.
A, S, = AR
6 = +2 (AT, + AT,)
S, = *6 (2Aa - A& - A/&)
B, S, = -& (AT, - Ar,) (5)
B, S, = rAy
Elements of G matrix for vibrations of A, species are given by the expressions
GI, = ‘Pail + #PN G,, = ‘PO + (1 + cos a) ‘iu~
G,, = 2/2 cos /I ‘,uN G, = --d(3) sin a ‘pN (6) G,, = 2/6 sin j3 ‘,uuN G,, = 3L’ro + ‘PN(~ - cos a)]
where ‘run, ‘,uuN and ‘po are reciprocal masses of methyl group, nitrogen and oxygen atoms in atomic mass units. On substitution of the values of various parameters the following G matrix is obtained.
L
0.1379 - 0.0450 0.1565 G = -0.0450 0.0909 - 0.0987
1 (7)
0.1565 -0.0987 0.5305
The units of G1,‘s are (atomic mass units)-l. The F matrix given below has been found to give reasonable agreement between the calculated and observed frequencies.
(
5.50 0 - 0.848 F= 0 11.456 0.805
0.848 -0.805 1.151 I (3)
The units of F,, are dyn/cm x lo6 for stretching force constant and ergs/(radian)s x lo-l1 for bending force constant.
A comparison of the observed and calculated frequencies is given in Table 2.
Table 2. Observed and calculated frequencies of M-NO, molecule
Mode Calculated frequency
(cm-l) Observed frequency
(cm-l)
N-C Stretching 922 915 NO, Symmetric stretching 1373 1377 NO, Symmetric bending 655 656
The agreement between the observed and calculated frequencies is within 0.45 per cent. This is considered satisfactory in view of the approximation of assuming methyl group as one particle.
446 K. SINQH
The elements of L-1 matrix were determined by solving the equations
The elements of (L-l)tt are in a.m.S2 units. The derivatives of dipole moment with respect to symmetry co-ordinates can be
obtained from the relationship
ap ( 1 - = 2 (L-l)v as, i ( 1 -$
i (12)
where matrix L-1 relates the normal co-ordinates to symmetry coordinates
Qi = x (L-%,S, (13) i
The signs of ( ap/ 89,) ‘s in expression (3) are ambiguous. Eight combinations of signs are possible giving rise to eight sets of (a,u/&‘,)‘s. The values of (a~/aKJ’s obtained with the help of expression (12) are given in Table 3.
Table 3. Eight sets of derivatives of dipole moment with respect to symmetry co-ordinates
Taking into consideration the geometry of the molecule, it is possible to derive the following relationships between (a~/iZY,) and polar properties including dipole moment and effective charge
Eight sets of values of ,u and
aP %c -= as1 aR,,
aP u aiho as, i d/(2) cos 2 * jy--
NO
(14)
(15)
+ -=- as,
(16)
(a,u/ar) determined from absolute intensities are given
I&a-red intensities of nitro oompounda 447
in Table 4. On the basis of reasonableness of magnitude and sign, it is possible to assign suitable values to p and (a~/&).
Table 4. Eight possible sets of valuea of polarity parameters
%N-cl aRN-a +No/ arNO Cr~0lrN0
+++ 5.019 --- -5.019 ++- 1.336 -- + - 1.336
+-+ I.190 -+- -1.190 +-- -2.493 -++ 2.493
-3.171 -1.101 +3.171 +1*101 -1.943 t1.047
1.943 - I.047 3.422 -0.993
-3.422 +0*993 +4*650 +I.156 -4.650 -I*155
DISCUSSION OF RESULTS Gross features of intensity in various bands of M-NO, molecule are interesting.
The data in Table 1 show that the intensity of symmetric stretching band is about three times that of the symmetric bending. The band corresponding to C-N stretching possesses intensity only one sixth of the intensity of symmetric bending mode. The intensity A = O-63 x lo4 mole-l 1. cm-2 for symmetric NO, stretching mode is comparable to the one reported by FLETT [7].
Any effect of carbon tetrachloride on infra-red intensities has been neglected in the present investigations. This is reasonable as carbon tetrachloride is known to be least perturbing agent [8].
A check on the assumed geometry of the molecule is provided by the study of values of elements of F-matrix. The value of FI1 = 5.5 x lo6 dyn/cm is in agreement with the value of stretching force[9] constant of N-C band as reported in literature. The element F,, represents the sum of stretching force constant of NO bond and the interaction constant between two NO bonds. A value of F,, = 11.47 x lo6 dynjcm is not far out from the value of this constant reported for NO, molecule [lo]. A bending force constant of Fa3 = 1.15 x lo-l1 ergs/(radian)2 is very nearly the same as in NO, molecule. A check on the values of elements in L-1 is provided by the fact that the following two relationships are satisfied:
LL’=G (17) L’FG = AL (16)
where L’ is the transpose of matrix L and A is the matrix whose elements are eigen values of the normal vibrations.
On the basis of reasonableness of signs and magnitudes of ap/ar and ,U it is possible to select an acceptable solution out of eight alternatives given in Table 4. YAIUDA and PERSON [ 1 l] have analysed the infra-red intensity data for nitrous oxide mole- cule. They have shown that a,u/& and ,uNo have values of 6.39 D/A and 0.65 D
[7] M. ST. FLETI-, Spectrochim. Acta 18, 1537 (1962). [S] A. R. H. COLE and A. J. MITCHELL, Spctrochim. Acta 20, 747 (1964). [9] W. J. 0. THOMAS, J. Chem.Soc. 2383 (1952).
[lo] R. E. WESTON, J. C&m. Php. 26, 1248 (1967). [ll] H. YAMADA and W. B. PEARSON, J. Chem. Phya. 41, 2478 (1964).
448 K. SINGH
respectively. In set No. 7 both iY,u/ar and ,u possess the same sign as in the case of N,O molecule. Again effective charge i&o/&o in set 7 possesses the highest magnitude out of all the eight solutions. On this basis a combination of + - - signs is found to give an acceptable solution. The value of effective charge a,u&aRNC is equal to -2.93 D. The negative sign may arise from fall in electron density with extension in length of N-C bond. As a result of extension, decrease in hypercon- jugation brings about reduction in electron density in the region between N and C atoms. There is also a change in hybridization which influences the charge distribu- tion. On rehybridization there is an increase in P-character along the NC bond and enhancement of s-character at the central atom. This is followed by redistribution of charge resulting in an increase in negative charge on the central nitrogen atom and fall in dipole moment of N-C bond. The decrease in hyperconjugation and fall in dipole moment arising from rehybridization are the main factors which are respons- ible for the negative sign of apNC/i3RN,.
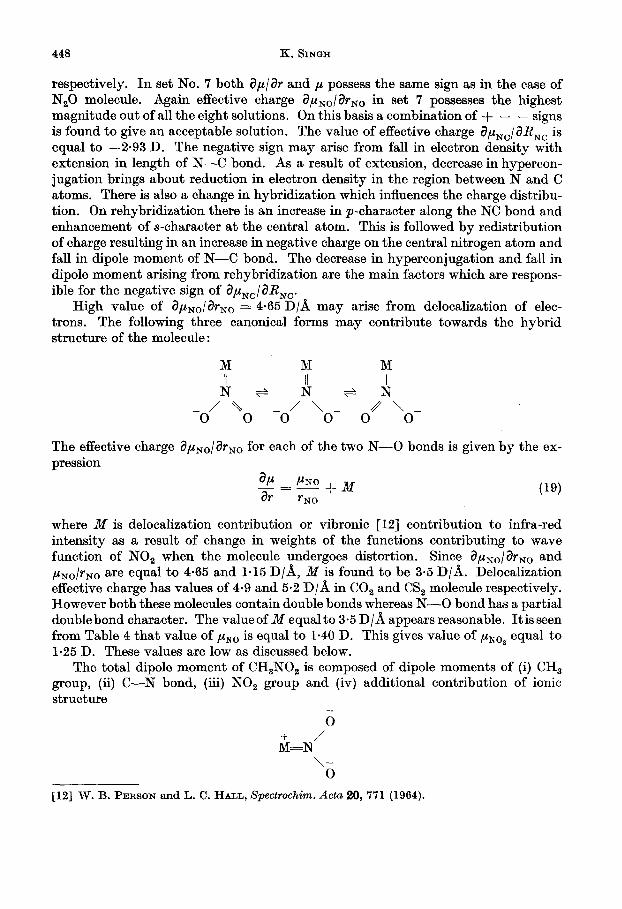
High value of ap&ar,o = 4.65 D/A may arise from delocalization of elec- trons. The following three canonical forms may contribute towards the hybrid structure of the molecule:
M M M 4 II
+ _.A
-0 /\ AN\ _- ?i
-0 0 //
0 0 \o-
The effective charge a~No/ar,o for each of the two N-O bonds is given by the ex- pression
(19)
where M is delocalization contribution or vibronic [12] contribution to infra-red intensity as a result of change in weights of the functions contributing to wave function of NO, when the molecule undergoes distortion. Since apNo/&No and p,o/r,o are equal to 4.65 and 1.15 D/A, M is found to be 3.5 D/A. Delocalization effective charge has values of 4.9 and 5.2 D/A in CO, and CS, molecule respectively. However both these molecules contain double bonds whereas N-O bond has a partial double bond character. The value of M equal to 3.5 D/A appears reasonable. It is seen from Table 4 that value of ,uNo is equal to 1.40 D. This gives value of ,uNo, equal to 1.25 D. These values are low as discussed below.
The total dipole moment of CH,NO, is composed of dipole moments of (i) CH, group, (ii) C-N bond, (iii) NO, group and (iv) additional contribution of ionic structure
M=N /O
\- 0
[12] W. B. PERSON and L. C. HALL, Spectrochim. Acta 20, 771 (1904).
Infra-red intensities of nitro compounds 449
arising from hyperconjugation. On assigning values [13, 141 of 0.4, 0-45, l-25 and O-45 D respectively to these components, the total dipole moment of nitromethane is found to be 1.65 D. This value is lower than the observed dipole moment of nitro- methane ,uCH,NO~ = 3.13 D in carbon tetrachloride [15].
It may be mentioned that unequal values of both ap/ar and ,U are sometimes obtained for different types of symmetry of vibrations when zeroth order approxi- mation is used. Also the dynamic dipole moment [16] quite often differs from the static dipole moment. It is not, therefore, surprising that modes [17] of vibration of symmetry species A, lead to a value of ,uXolr,o = l-155 D/L% or ,uNo = l-40 D. It may be mentioned that this value is higher than the dynamic dipole [12] moment of N-O bond pNo = 0.65 D in N,O, but it is lower [18] than the value of static
h0 = 3.92 D in NO, group. pNo is equal to 1.5 D for N-O single bond. The agree-
ment between static and dynamic values can be improved by taking into account assumptions suggested by SVERDLOV [19]. This aspect of the problem is under investigation.
Acknowledgement-Thanks of the author are due to Shri J. S. ANAND for help in experimental work.
[13] J. W. SMITH, Electric Dipole Moment, p. 92, Butterworths, London (1955). [14] W. B. JOHN, Hyperconjugation p. 27, Oxford University Press, London (1952). [15] A. EVAN ARKEL and J. L. SNOEK, Trans. Faraday Sot. 30, 707 (1934). [IS] A. D. DICKSON I. M. MILLS and B. CRAXVFORD, J. C&m. Phys. 27, 448 (1957). [17] A. R. H. COLS and A. J. MICHELL, Spectrochim. Acta 20, 739 (1964). [18] P. H. HERMANS, Theoretical Organic ChemGtry p. 126-130, Elsevier, London (1954). [lQ] L. M. SVERDLOV, Optika i Spectroskopyiu 10, 76 (1959); 7, 97 (1959).