Infrared and reflectron time-of-flight massspectroscopic study on the synthesis ofglycolaldehyde in methanol (CH3OH) andmethanol–carbon monoxide (CH3OH–CO)ices exposed to ionization radiation†
Surajit Maity, Ralf I. Kaiser* and Brant M. Jones*
Received 6th December 2013, Accepted 6th February 2014
DOI: 10.1039/c3fd00121k
We present conclusive evidence on the formation of glycolaldehyde (HOCH2CHO)
synthesized within astrophysically relevant ices of methanol (CH3OH) and methanol–
carbon monoxide (CH3OH–CO) upon exposure to ionizing radiation at 5.5 K. The
radiation induced chemical processes of the ices were monitored on line and in situ via
infrared spectroscopy which was complimented by temperature programmed
desorption studies post irradiation, utilizing highly sensitive reflectron time-of-flight
mass spectrometry coupled with single photon fragment free photoionization (ReTOF-
PI) at 10.49 eV. Specifically, glycolaldehyde was observed via the n14 band and further
enhanced with the associated frequency shifts of the carbonyl stretching mode
observed in irradiated isotopologue ice mixtures. Furthermore, experiments conducted
with mixed isotopic ices of methanol–carbon monoxide (13CH3OH–CO, CH318OH–CO,
CD3OD–13CO and CH3OH–C18O) provide solid evidence of at least three competing
reaction pathways involved in the formation of glycolaldehyde via non-equilibrium
chemistry, which were identified as follows: (i) radical–radical recombination of HCO
and CH2OH formed via decomposition of methanol – the “two methanol pathway”; (ii)
via the reaction of one methanol unit (CH2OH from the decomposition of CH3OH) with
one carbon monoxide unit (HCO from the hydrogenation of CO) – the “one methanol,
one carbon monoxide pathway”; and (iii) formation via hydrogenation of carbon
monoxide resulting in radicals of HCO and CH2OH – the “two carbon monoxide
pathway”. In addition, temperature programmed desorption studies revealed an increase
in the amount of glycolaldehyde formed, suggesting further thermal chemistry of
trapped radicals within the ice matrix. Sublimation of glycolaldehyde during the warm
up was also monitored via ReTOF-PI and validated via the mutual agreement of the
associated isotopic frequency shifts within the infrared band positions and the identical
sublimation profiles obtained from the ReTOF spectra and infrared spectroscopy of the
Department of Chemistry, W. M. Keck Research Laboratory in Astrochemistry, University of Hawaii at Manoa,
corresponding isotopes. In addition, an isomer of glycolaldehyde (ethene-1,2-diol) was
tentatively assigned. Confirmation of the identified pathways based on infrared
spectroscopy was also obtained from the observed ion signals corresponding to
isotopomers of glycolaldehyde. These coupled techniques provide clear, concise
evidence of the formation of a complex and astrobiologically important organic,
glycolaldehyde, relevant to the icy mantles observed in the interstellar medium.
1. Introduction
During the last decade, the glycolaldehyde molecule (HCOCH2OH) has receivedconsiderable attention in the astronomy, astrochemistry, and astrobiologycommunities. Glycolaldehyde was rst detected in the richest molecular source inthe Galaxy, Sgr B2(N),1 located in the galactic center molecular cloud SagittariusB2, also known as the Large Molecular Heimat.2 Chemical differentiation waslater observed in the structural isomers of glycolaldehyde,3 i.e. methyl formate(HCOOCH3) and acetic acid (CH3COOH), whose formation routes are unknown.2
Consequently, an understanding of the chemistry behind the formation of gly-colaldehyde and its isomers may help to explain the observed differentiation,since structural isomers can be exploited as a chemical clock to unravel theunderlying chemistry in extraterrestrial environments such as star formingregions. A subsequent extensive line search of glycolaldehyde allowed the deter-mination of the fractional abundance of f(H2) z 5.9 � 10�11 in Sgr B2 (N).4 Fromhere, a tentative identication of glycolaldehyde outside of the galactic center wasmade in 2005 towards the hot core G31.40+0.31,5 and later conrmed by the sameauthors in 2009,6 with the glycolaldehyde emission originating from the hottest($300 K) section with a rather large (estimated) fractional abundance of f(H2)z 5� 10�8. This yielded the only conrmed detection outside our galaxy. In additionto glycolaldehyde, other complex organic molecules (COM) have been detected inthe galactic center, such as methyl formate (HCOOCH3), acetaldehyde (CH3COH),ketene (H2CCO), and ethylene oxide (c-C2H4O).7 The most recent detection ofglycolaldehyde has been with the Atacama Large Millimeter Array (ALMA) towardthe protostellar binary system IRAS 16293-2422.8 Here, glycolaldehyde was foundin the warm (200–300 K) gas close to the individual components of the binary,with an estimated fractional abundance of f(H2) z 5 � 10�9, which the authorsnote correlates with an origin related to the energetic processing viaUV photolysisof an icy grain mantle consisting of methanol and carbon dioxide followed bysublimation during the warm up phase.
As glycolaldehyde is the simplest monosaccharide sugar detected in numerousastrophysical environments ranging from hot cores to the galactic centermolecular cloud, the detection of glycolaldehyde immediately prompted interestwithin the astrobiological community, as the presence of glycolaldehyde directlypertains to the ‘origin of life’ question. Here, glycolaldehyde is one of the keyprecursors in the formation of ribonucleic acid (RNA).9–13 Since the ‘RNA World’origin of life hypothesis14–17 is currently one of the dominating theories within thecommunity,18,19 glycolaldehyde has been heavily implicated in the literature onthe premise that it correlates well with the abiotic formation of ribose, which is acentral back bone of RNA. Yet, one of the main difficulties in considering an ‘RNAWorld’ relationship to the origin of life is the complication of forming RNA
prebiotically.20,21 There has been experimental evidence however, showing thatabiotic formation of nucleotides from basic starting materials is possible, andthus not an entirely impractical chemical route. In particular, glycolaldehyde canreact via an aldol condensation to ultimately produce ribose.22 Additionally thepolymerization of formaldehyde (the formose reaction23) has been suggested asplausible prebiotic route to glycolaldehyde and ribose (Shapiro, 2000).24 However,as pointed out by Shapiro (2000),24 no prebiotic route exists that preferentiallyleads to the synthesis of ribose specically over a conglomerate of other sugars,despite many efforts. Some success has been demonstrated in generating ribose2,4-diphosphate in a possibly prebiotic reaction of monophosphate glyco-laldehyde and formaldehyde.25 Also, it should be noted that ribose has beenshown to be produced in elevated yields following a formose type mechanism inmixtures containing aldehyde, glycolaldehyde, and minerals such as pyrite,borate and silicates.26 In addition, ribonucleotides were abiotically synthesized ina multistep reaction utilizing only cyanamide (CN2H2), cyanoacetylene (C3HN),glyceraldehyde (C3H6O3) and glycolaldehyde (HOCH2CHO).27 Consequently, theabiotic synthesis of nucleotides is feasible. Furthermore, as pointed out recently,an upper limit of 108 kg year�1 of glycolaldehyde may have been deposited on anearly Earth via comets and interplanetary dust, in addition to the 108 kg year�1
that may have been formed in situ on an early Earth.28 Additionally, the detectionof glycolaldehyde around the newly formed star IRAS 16293B implies that thismolecule may be involved in planet forming processes.8
Due to the importance of glycolaldehyde, over the last few decades, studiesexploring the radiation induced synthesis of glycolaldehyde pertaining to ices ofmethanol have been numerous. Of the rst papers, most were focused on spec-troscopy of radicals; the photolysis (Ehv ¼ 145 nm, 8.4 eV) of methanol isolated inan argon matrix produced the hydroxymethyl (CH2OH) radical.29 The productionof this CH2OH radical in addition to the methyl (CH3) and the methoxy radical(CH3O) via X-ray radiolysis of crystalline methanol was later conrmed usingelectron pair resonance spectroscopy at 4.2 K.30 Products of g-irradiated methanolice were found to be molecular hydrogen (H2), ethylene glycol (HOCH2CH2OH),methane (CH4), carbon monoxide (CO), dimethyl ether (CH3OCH3), and ethanol(CH3CH2OH).31 From here, pure methanol and binary mixtures of methanol withwater and carbonmonoxide were exposed to distinct sources of ionizing radiation(summarized in Table S1 of the ESI†). All of the previous experimental resultspredominantly agree that simple molecules (CO, CO2, CH4, H2CO), with somedegree of overlapping with the detection of ethanol, ethylene glycol, water, andthe formyl radical (HCO), are formed in situ via energetic processing. Crucialdiscrepancies do exist however, such as the assignment of acetone, which wasrst suggested as a result of 3 keV He+ bombardment of pure methanol,32 and wassubsequently tentatively assigned in later studies.33–36 However, the assignment ofacetone was refuted in a study with 0.8 MeV H+ bombardment of a methanol–water mixture;37 from this study, the assignment of the observed vibrationalbands that were ascribed to acetone were subsequently attributed to the HCOO�
ion. Far IR spectroscopy was used to examine the phase change of crystalline toamorphous methanol induced by 0.7 MeV H+ irradiation. Although no productswere specically identied, the authors noted that the irradiated methanol wouldnot re-crystallize with thermal annealing, which was attributed to additionalproducts synthesized within the methanol ice matrix.38 Higher order alcohols
were attributed to an unidentied feature at 1088 cm�1 aer broad band UVphotolysis of pure methanol ice via a hydrogen microwave discharge lamp at 10 Kin addition to the standard group of daughter molecules (CO, CO2, CH4, H2CO).This assignment of a higher mass alcohol was further veried by the observationthat the IR band started to disappear (indicating sublimation) at 120 K and wascompletely gone at 230 K, suggesting a molecule with a similar volatility tomethanol.39 Aer the rst detection of glycolaldehyde in the galactic center,1 aresurgence in methanol irradiation experiments occurred in the hopes ofexplaining the origin of this sugar, along with its isomers, methyl formate andacetic acid. One of the rst irradiation experiments to identify glycolaldehyde as aproduct of methanol ice exposed to ionizing radiation utilized 5 keV electrons,thereby simulating the track of secondary electrons generated within the trajec-tory of galactic cosmic rays40 and a binary mixture of methanol and carbonmonoxide.41 Here, glycolaldehyde was identied in irradiated methanol ices at 10K and also following warm up, whereas in the binary mixture (CH3OH–CO), gly-colaldehyde in conjunction with methyl formate was immediately identied insitu at 10 K with a total applied dose of 0.7 eV per 16 amu. In addition, glyco-laldehyde and methyl formate were distinguished by utilizing temperature pro-grammed desorption coupled with gas phase detection via a quadrupole massspectrometer based on the unique fragmentation pattern (e.g. the methyl formatecation – HCOO+) at distinct sublimation temperatures. Following the studies ofBennett et al.,40,41 similar work was conducted utilizing broad band UV photonsproduced via a hydrogen microwave discharge lamp, in which glycolaldehyde wasonly inferred as a potential product aer photolysis of CH3OH and CH3OH–COices. Recently, glycolaldehyde was only briey mentioned as an endogenousproduct upon exposure to 200 keV protons at relatively high doses of 34 eV42 and18 eV43 per 16 amu. In the most recent experiment, Chen et al. reported theformation of glycolaldehyde in irradiated methanol ices utilizing so X-rays withpeak energies of 300 eV and 550 eV over a broad band spectrum (250–1200 eV)44
following warm up, in agreement with the previous observation of Bennett et al.;41
methyl formate, acetic acid, formic acid and ethylene glycol were also reported.No mention of glycolaldehyde was made in the experiments involving variousheavy cosmic ray analogs,45 or in the irradiation of methanol at very low doseswith so X-rays.46 To summarize, numerous experiments have been conductedover recent decades regarding the chemical modication of methanol ices uponexposure to ionizing radiation relevant to astrophysical conditions. Within thesestudies, a general consensus on the formation of small molecules, which can bedetected easily via infrared spectroscopy (FTIR) (CO, CO2, H2CO, CH4) and for themost part ethanol, ethylene glycol, and methyl formate, has been ascertained.However, the main difference thus far is the ambiguity in the assignment ofglycolaldehyde in the majority of the processed ices.
In this study, we present compelling evidence from infrared spectral datacorrelated for the rst time with temperature programmed desorption studiesexploiting single photon ionization (10.49 eV) reectron time-of-ight massspectrometry (ReTOF) gas phase detection of glycolaldehyde synthesized in irra-diated ices of CH3OH and CH3OH–CO along with selected isotopologues, exposedto doses of up to 6.5 eV per molecule relevant to the life time of an interstellar icygrain within a cold molecular cloud prior to the warm up (star formation) phase;at this point the grain begins to warm, causing radicals to diffuse and the
endogenous radiolytically synthesized molecules to sublimate into the gas phase,allowing for direct observation via radio astronomical observations.
2. Experimental
The experiments were carried out in a novel, contamination-free ultra-highvacuum (UHV) chamber at the W. M. Keck Research Laboratory in Astrochemistry(Fig. 1). The main chamber was evacuated down to a base pressure typically of afew 10�11 Torr using oil-free magnetically suspended turbomolecular pumpsbacked with dry scroll pumps. A cold nger assembled from oxygen free highconductivity copper (OFHC) was coupled to a UHV compatible closed-cyclehelium refrigerator (Sumitomo Heavy Industries, RDK-415E). A polished silvermirror was then mounted to the cold nger insulated with 0.1 mm thick indiumfoil to ensure thermal conductivity, and subsequently cooled to a nal tempera-ture of 5.5 � 0.1 K; the entire ensemble was freely rotatable within the horizontalcenter plane, and translatable in the vertical (z-axis) via a UHV compatible bellow(McAllister, BLT106) and differential pumped rotational feed through (Ther-moionics Vacuum Products, RNN-600/FA/MCO). From here, the correspondinggases were then deposited through a glass capillary with a background (uncor-rected for ion gauge sensitivity) pressure reading in the main chamber of 5� 10�8
Torr for approximately 3 minutes, yielding an ice sample with nal thicknesses of510 � 10 nm for pristine methanol ices, and 495 � 10 nm for mixed ices of
Fig. 1 Schematic top view of the main chamber including the analytical instruments,radiation sources, and the cryogenic target (point of converging lines). The alignment ofthe cryogenic target, radiation sources, infrared, Raman, and UV–vis spectrometer allowssimultaneous online and in situmeasurements of the modification of the targets upon theexposure to irradiation. After the irradiation, the cold head can be rotated 180� to face theReTOF mass spectrometer; the target can then be warmed up allowing the newly formedproducts to sublimate, whereupon they are photoionized and mass analyzed. The inset(top right) shows the geometry of the ReTOF ion source lenses with respect to the targetand ionization laser.
methanol–carbon monoxide. The thickness of the sample was determined in situusing laser interferometry. Here, the cooled silver target was rotated to face aHeNe laser (CVI Melles-Griot; 25-LHP-230, 632 nm), which struck the target at anincident angle of 4� relative to the sample normal, and was reected towards aphotodiode (CVI Melles-Griot Si Photodiode; 13DAS005 with a 632.8 nm narrowband pass lter, CVI Xll-632.8-12.6M). The induced current in the photodiode wasmonitored as a function of time with a picoammeter (Keithley Model 6485), whilethe gas was introduced into the chamber at a constant rate through a precisionleak valve, whereupon it nally condensed onto the low temperature silver target.During the deposition, the HeNe laser was reected off the surface of the silvertarget and the freshly deposited ice sample, causing an interference pattern. Therelation between the period of the interference curve between two maxima orminima relates to a change in thickness, Dd, as described by Heavens,47 where l0is the laser wavelength (632.8 nm), qi is the incident angle (4�), and nf is therefractive index of the ice. Here, a priori knowledge of the index of refraction (nf) isrequired for accurate determination of the deposited ice thickness. Taking intoconsideration the known index of refraction for the substrate,48–50 the index ofrefraction can also be derived by measuring the intensity ratio between themaximum and minimum of the measured interference curve.49,50 From thistechnique, we derived an index of refraction nf¼ 1.34� 0.02 for puremethanol, inagreement with published data of 1.33,51 and nf ¼ 1.35 � 0.02 for the binaryCH3OH–CO mixture. The column densities were calculated utilizing a modiedLambert–Beer relationship52–54 with the absorption coefficients of 1.3 � 10�17 cmmolecule�1 and 1.1 � 10�17 cm molecule�1 for the 1028 cm�1 (n8; CH3OH) and2090 cm�1 (n1;
13CO) bands, respectively.41,55,56 Accordingly, the mixed methanol–carbon monoxide ice was found to be in the ratio of (4.0 � 0.2) : (5.0 � 0.2). Inaddition, isotopically-labeled CD3OD,
13CH3OH, and CH318OH ices for pure
methanol irradiation experiments and CD3OD–CO,13CH3OH–CO, CH3
18OH–CO,CD3OD–
13CO, CH318OH–C18O, and CH3OH–C18O mixed ices for methanol–
carbon monoxide irradiation experiments were also used to conrm infraredassignments via isotope shis, and in the reectron time-of-ight data via shistheir in mass-to-charge ratios.
Each of the amorphous ices was irradiated with 5 keV electrons isothermally at5.5 � 0.1 K for one hour at 30 nA over a square area of 1.0 � 0.1 cm2 and at anangle of 70� relative to the surface normal. The emission current was measuredprior to irradiation on line and in situ utilizing a Faraday cup (Kimball Physics,FC-71) mounted inside a differentially pumped chamber on an ultra-high vacuumcompatible translation state. The total dose deposited into the ice sample wasdetermined from Monte Carlo simulations (CASINO)57 taking into considerationthe scattering coefficient and the energy deposited from the back scatteredelectrons. The total energy deposited into the amorphous ice was 6.5 � 0.8 eV perCH3OH molecule, and 5.2 � 0.8 eV per molecule on average for the irradiationexperiments of the binary CH3OH–CO (4 : 5) ice mixture. It should be noted herethat in determining the applied dose of the isotopic analogs, that both the indexof refraction and density were assumed to be that of their respective normalcounterparts, as most of these data are not empirically available. Furthermore,the density of the CH3OH–CO ice mixture was calculated to be 1.026 g cm�3 basedon the column density weighted fraction of their respective pure densities (1.020 gcm�3 CH3OH, 1.029 g cm�3 CO41) in the limit of volume additivity.58
For the on line and in situ identication of new molecular band carriers of theices during irradiation, a Fourier transform infrared spectrometer (Nicolet 6700)monitored the samples throughout the duration of the experiment, with an IRspectrum collected every two minutes in the range of 6000–400 cm�1 at a reso-lution of 4 cm�1. Each FTIR spectrum was recorded in the absorption–reection–absorption mode (reection angle ¼ 45�) for two minutes, resulting in a set of 30infrared spectra during the radiation exposure for each system. We recognize thatintegrated band areas can be altered by optical interference effects inherit inabsorption–reection–absorption FTIR spectroscopy, as demonstrated by Teoliset al.;59 however, this issue is circumvented by integration of weak bands, whoseabsorbance remains linear with respect to the amount of ice deposited.60 Aer theirradiation, the sample was kept at 5.5 K for one hour, then temperature pro-grammed desorption (TPD) studies were conducted by heating the irradiated icesat a rate of 0.5 K min�1 to 300 K. Throughout the thermal sublimation process,the ice samples were monitored via infrared spectroscopy and single photonionization reectron time-of-ight mass spectroscopy61 separately, i.e. eachexperiment was conducted twice. For the gas phase detection, the products wereionized upon sublimation via single photon ionization exploiting pulsed (30 Hz)coherent vacuum ultraviolet (VUV) light at 118.2 nm (10.49 eV), generated via non-linear four wave mixing. The ions were then extracted into a reectron time-of-ight mass spectrometer, whereupon the ions were mass resolved according totheir arrival times. Please see the ESI† for more detailed description regardingCASINO calculations, coherent VUV light generation, and reectron time-of-ightmass spectroscopy.
3. Results3.1 Infrared spectroscopy
3.1.1 Qualitative analysis. The infrared spectra of pure methanol ice andmixed ices of methanol (CH3OH)–carbon monoxide (CO) recorded before andaer irradiation along with the assignments are shown in Fig. 2A and 2B. Duringthe irradiation, multiple new absorption features emerged (summarized in theESI, Tables S2 and S3†) alongside the absorptions of the pristine ices. In theirradiated methanol (Fig. 2A, ESI Table S2†) and methanol–carbon monoxide ices(Fig. 2B, ESI Table S3†), the hydroxymethyl radical (CH2OH) was detected via then4 absorption band at 1192 cm�1 and 1193 cm�1, respectively, in good agreementwith previously reported values of 1197 cm�1 in UV photolyzed methanol ices byGerakines et al.,39 1197 cm�1 and 1192 cm�1 in methanol40 and methanol–carbonmonoxide ices41 exposed to electron irradiation, and 1193 cm�1 in methanol icesirradiated with so X-rays by Chen et al.44 Formaldehyde (H2CO) was observed viathe n2, n3, and n4 absorption bands at 1246 cm�1, 1499 cm�1 and 1726 cm�1 inmethanol ice, and at 1249 cm�1, 1497 cm�1 and 1726 cm�1 in methanol–carbonmonoxide ice; again, these absorptions agree with previous studies.37,39–41 Methylformate (HCOOCH3) was identied via its n14 fundamental at 1714 cm�1, which isin good agreement with the literature value of 1718 cm�1 in electron irradiationexperiments with methanol40 and methanol–carbon monoxide ices41 and UVphotolysis of methanol ices by Gerakines et al.,39 and 1720 cm�1 by Modica et al.with pure methyl formate spectra at 16 K.42,43 The formation of a formyl radical(HCO) was identied via the n3 fundamental at 1842 cm�1 in both the irradiated
Fig. 2 (A) (Top) Infrared spectra of the methanol ices at 5.5 K before (dotted trace) andafter (solid trace) irradiation. (Bottom) The newly formed products as labeled are shown inthe 1900–800 cm�1 region. (B) (Top) Infrared spectra of the methanol–carbon monoxideices at 5.5 K before (dotted trace) and after (solid trace) irradiation. (Bottom) The newlyformed products as labeled are shown in the 1900–800 cm�1 region.
ices, as previously assigned at 1848 cm�1 by Hudson et al.,37 and at 1842 cm�1 byBennett et al.40,41 and Chen et al.39,44 Methane (CH4) was detected via the n4
fundamental at 1304 cm�1 and 1303 cm�1 in the methanol and methanol–carbonmonoxide ices, respectively. Formation of carbon monoxide (CO) was conrmedvia the n1 fundamental at 2135 cm�1 in methanol ice. In addition, carbon dioxidewas detected via the n3 mode at 2339 cm�1 in irradiated methanol ice and 2342cm�1 in the irradiated methanol–carbon monoxide ice. Ethylene glycol was iden-tied in both irradiated ices via the n9 fundamental at 1094 cm�1, based on theassignment of this molecule in previous studies of irradiated methanol ices37,40 at1090 cm�1 and 1088 cm�1. It should be mentioned that all other relatively stronginfrared absorption bands of ethylene glycol coincidentally overlap with themethanol absorptions40,41 and consequently are masked. Glycolaldehyde (HOCH2-
CHO) was identied by the n14 (CO of HCO stretching) fundamental at 1743 cm�1 inboth methanol and methanol–carbon monoxide ices. The assignment of theobserved bands to glycolaldehyde are based on previous studies of irradiatedmethanol40 ices at 1747 cm�1, irradiated methanol–carbon monoxide ices41 at 1757cm�1, and matrix isolation studies of glycolaldehyde at 13 K at 1747 cm�1.62,63 Asecond band at 1062 cm�1 in the methanol–carbon monoxide ice can be attributedto the n7 fundamental of glycolaldehyde, in agreement with previous studies.41–43,62,63
The assignment of these absorptions was also conrmed via their isotopic shis inirradiated ices consisting of CD3OD,
13CH3OH and CH318OH, as compiled in Table
S2 in the ESI,† and irradiated binary mixed ices consisting of CD3OD–CO,13CH3OH–CO, CH3
18OH–CO, CD3OD–13CO, CH3
18OH–C18O and CH3OH–C18O ascompiled in Table S3 in the ESI.†
3.1.2 Deconvolution of the carbonyl absorption features. The new absorptionfeatures connected to the carbonyl functional group in the 1800–1600 cm�1
region are very broad (Fig. 3a and 3b), implying the presence of multiple carriers.Further evidence is obtained from the additional infrared absorption features ofthe carbonyl band regions in the irradiated mixed isotopic ices, as shown inFigure 3b. These ndings suggest the presence of multiple underlying molecularcarriers, and possibly different isotopomers (in the mixed isotopic ices) as well.Therefore, the absorption features in 1800–1600 cm�1 were deconvoluted with thepeak positions, and their associated assignments are shown in Fig. 3 and listed inTables 1–3. The rationale behind the assignments is discussed below.
In the case of irradiated methanol (CH3OH) ices, the deconvolution (Fig. 3a)identied four distinct bands centered at 1743 cm�1, 1726 cm�1, 1714 cm�1 and1697 cm�1. The band at 1743 cm�1 is assigned to the n14 band of glycolaldehyde(HOCH2CHO), as discussed previously based on earlier experimental work.40,41,62,63
The absorptions at 1726 cm�1 and 1714 cm�1 can be linked to the n4 fundamentalof formaldehyde (H2CO) and the n14 of methyl formate (HCOOCH3), which are ingood agreement with the literature data at 1726 cm�1 and 1718 cm�1, respec-tively.39–43 Finally, the band observed at 1697 cm�1 can be attributed to the Fermiresonance splitting of the n14 fundamental and the 2n6 overtone band of glyco-laldehyde.41,44,63 To support these assignments, deconvolution of the bands in1800–1600 cm�1 region for the isotopically labeled ices of CD3OD,
13CH3OH, andCH3
18OH were also completed. The n14 band of glycolaldehyde (HOCH2CHO) at1743 cm�1 is expected to show an isotopic shi of 26 cm�1 in CD3OD ices,64 37cm�1 in 13CH3OH ices,64 and 30 cm�1 in CH3
18OH ices.65 In the present investi-gation, the corresponding isotopomers of glycolaldehyde, DOCD2CDO in CD3OD
Fig. 3 (a) Deconvoluted infrared absorption features in the region of the carbonyl functionalgroup in (A) CH3OH, (B) CD3OD, (C) 13CH3OH, and (D) CH3
18OH ices. The bands marked as(1) and (4) are assigned as the n14 and 2n6 bands of glycolaldehyde (HOCH2CHO), respec-tively. The bands marked as (2) and (3) are assigned to formaldehyde (H2CO) and methylformate (HCOOCH3). The dotted line in (B) corresponds to 2n8 of CD3OD as in the pristineice. (b) Deconvoluted infrared absorption features in the region of the carbonyl functionalgroup in (A) CH3OH–CO, (B) CD3OD–CO, (C) 13CH3OH–CO, (D) CH3
18OH–CO, (E)CD3OD–13CO, (F) CH3
18OH–C18O, and (G) CH3OH–C18O ices. The bands marked as (1), (2),(3) and (4) are assigned to n14 of glycolaldehyde, n4 of formaldehyde and n14 of methylformate, and 2n6 bands of glycolaldehyde and their isotopomers (Table 3), respectively.41 In
assigned based on peak positions of 1711 cm�1, 1703 cm�1 and 1713 cm�1,respectively, with corresponding isotopic shis of 32 cm�1, 40 cm�1 and 30 cm�1
(Table 1), in agreement with the expected frequency shis.64,65 The formaldehydeidentication was based on the n4 band, observed at 1676, 1687 and 1693 cm�1 inthe irradiated CD3OD,
13CH3OH and CH318OH ices, respectively. The corre-
sponding isotopic shis of 50, 39 and 33 cm�1 agree well with the respectiveliterature values66,67 of 45, 38 and 33 cm�1. Methyl formate was conrmed via then14 band at 1676 cm�1 and 1682 cm�1 in 13CH3OH and CH3
18OH ices, withisotopic shis of 38 cm�1 and 32 cm�1 respectively, in close agreement withtypical shis of carbonyl stretching frequencies upon 13C and 18O substitution ofabout 40 cm�1 and 30 cm�1, respectively.65 In addition, the band assigned to theFermi resonance (of the n14 fundamental and an overtone from 2n6) also showsrelevant isotopic shis (Table 1).65
The deconvoluted absorption bands of the carbonyl functional group in the1800–1600 cm�1 region reveal four distinct bands (Figure 3a) in the case ofisotopically pure (only one isotope of each atom) binary ices consisting ofCH3OH–CO, CD3OD–CO and CH3
18OH–C18O, similar to that of the irradiatedpure methanol ices. Here, the glycolaldehyde isotopomers HOCH2CHO,DOCD2CDO and H18OCH2CH
18O were identied at 1743 cm�1, 1714 cm�1 and1715 cm�1 (Table 2), respectively, in excellent agreement with the assigned bandsof the corresponding isotopomers observed in irradiated methanol ices (Table 1).However, in the mixed isotopic ices, i.e., 13CH3OH–CO, CH3
18OH–CO,CD3OD–
13CO and CH3OH–C18O, where two different atomic isotopes (12C/13C and16O/18O) are present together, the prole of the carbonyl band was rather unique.Here, evidence of two different isotopomers of glycolaldehyde is observed in theirradiated ices of the mixed isotopes. Fig. 4 presents the isotopomers of glyco-laldehyde in thesemixed isotopic ices, showing that at least two different carbonylfunctional groups could be formed and subsequently detected in the relevantinfrared spectral region. For example, H13C16O and H12C16O following irradiationof the 13CH3OH–CO system, H12C18O and H12C16O in the CH3
18OH–CO system,D12C16O and D13C16O in the CD3OD–
13CO system, and H12C16O and H12C18O inthe CH3OH–C18O system are expected and can ultimately lead to the synthesis offour different isotopomers of glycolaldehyde. For instance, in the case of irradi-ated CH3
18OH–CO ice, four different isotopomers of glycolaldehyde, H18OCH2-
CH18O, H18OCH2CHO, HOCH2CH18O and HOCH2CHO, can be formulated. Here,
the carbonyl group (HC18O) in H18OCH2CH18O and HOCH2CH
18O can be formedvia the decomposition of CH3
18OH. Furthermore, the carbonyl unit (HCO), inH18OCH2CHO and HOCH2CHO can be synthesized via the hydrogenation of thecarbon monoxide (CO). Note that, despite the existence of four different iso-topomers, the n14 (CO stretching of the HCO unit) fundamental band will onlyindicate two glycolaldehyde isotopomers, as in the CH3
18OH–C18O (1715 cm�1)and CH3OH–CO (1743 cm�1) ices. Unfortunately, the isotopic combination isattributed to the alcohol vibrational mode, and is consequently masked by the
(C), (D), (E) and (G), the bands marked as (10), (20), (30) and (40) are assigned to n14 of glyco-laldehyde, n4 of formaldehyde, n14 of methyl formate, and 2n6 bands of glycolaldehyde andtheir isotopomers, respectively. The dotted lines in (B) and (E) correspond to 2n8 of CD3OD asin the pristine ice.
broad parent methanol feature. Indeed, deconvolution of the carbonyl absorptionin the 1800–1600 cm�1 region of irradiated CH3
18OH–CO ices (Fig. 3b) resulted inidentied bands at 1708 cm�1 (band 1) and 1743 cm�1 (band 10), which are inclose agreement with the expected frequencies based on the isotopically labeledpure ices as mentioned above. Similar to the irradiated CH3
18OH–CO ices,deconvolution of the mixed isotopic ices of 13CH3OH–CO, CD3OD–
13CO andCH3OH–C18O reveal two distinct carbonyl bands as shown in Fig. 3b, with theassignments also listed in Table 3. Here, in the isotopically labeled 13CH3OH–COirradiated ices, the n14 fundamental of glycolaldehyde isotopomers with H13COand HCO functional groups are expected at 1703 cm�1 and 1743 cm�1, based onthe observed band positions in the irradiated 13CH3OH ices and CH3OH–CO ices.As expected, deconvolution elucidates a band at 1743 cm�1 (band 10) corre-sponding to the carbon monoxide hydrogenation products. Unfortunatelyhowever, the expected band at 1703 cm�1 could not be identied due to a strongtransition of the n14 fundamental of methyl formate (HCOO13CH3) at 1710 cm�1
(band 30). In CD3OD–13CO ices, the deconvolution of the relevant 1800–1600
cm�1 region required the inclusion of the 2n8 overtone band of CD3OD (1666cm�1, ESI Table S3†). Consequently, any prediction may result in an ambiguousinterpretation. However, the fully deuterated isotopomers of glycolaldehydewith the DCO carbonyl functional group (Fig. 4) can be attributed to the bandobserved at 1709 cm�1 (band 1), in agreement with irradiated CD3OD–CO ices(1714 cm�1). Finally, in CH3OH–C18O ices, the n14 fundamental of the glyco-laldehyde isotopomers with HCO and HC18O carbonyl functional groups areexpected at 1715 cm�1 and 1743 cm�1, based on the observed band positions inthe irradiated CH3
18OH–C18O and CH3OH–CO ices. Certainly, deconvolutionreveals two bands centered at 1707 cm�1 (band 10) and 1747 cm�1 (band 1),which are in close agreement with our expectations based on the irradiatedisotopically pure ices as mentioned above.
Fig. 4 Schematic representation of the formation of glycolaldehyde isotopomers inmixed isotopic ices of 13CH3OH–CO, CH3
18OH–CO, CD3OH–13CO and CH3OH–C18O.Here, two different carbonyl functional units (H13C16O and H12C16O in 13CH3OH–CO;H12C18O and H12C16O in CH3
18OH–CO; D12C16O and D13C16O in CD3OD–13CO; H12C16Oand H12C18O in CH3OH–C18O) are expected to be observed in each system. The observedpeak positions are shown in parentheses.
Faraday Discussions Paper
Fig. 3b and Tables 1–3 also show the identication of n4 of the formaldehydeisotopologues, and n14 of the methyl formate isotopologues. In the case ofisotopically pure ices of CH3OH–CO, CD3OD–CO and CH3
18OH–C18O, formalde-hyde was conrmed via band positions at 1726 cm�1, 1686 cm�1, 1693 cm�1,respectively, and methyl formate bands were observed at 1714 cm�1, 1668 cm�1
and 1680 cm�1. Both frequency shis are in excellent agreement with theobserved band positions in the irradiated methanol (isotopically pure) ices (Table1). Similar to the detection of two different isotopomers of glycolaldehyde in themixed isotopic ices of 13CH3OH–CO, CH3
18OH–CO, CD3OD–13CO and CH3OH–
C18O, two isotopomers of formaldehyde andmethyl formate were also observed inthe carbonyl stretching regions in each system as expected. Here, H2CO andH2
13CO were conrmed via bands at 1724 cm�1 (band 20) and 1692 cm�1 (band 2)following irradiation of 13CH3OH–CO ice, in agreement with the observed bandpositions of H2CO (1726 cm�1) and H2
13CO (1687 cm�1) in irradiated CH3OH and13CH3OH ices. Further, aer the irradiation of CH3
18OH–CO and CH3OH–C18Oices, H2C
18O was observed at 1692 (band 2) and 1695 cm�1 (band 20), respectively,with H2CO conrmed at 1724 cm�1 (band 20) and 1726 cm�1 (band 2), respec-tively. These peak positions agree with the observed positions of formaldehyde inirradiated pure CH3
18OH (1693 cm�1) and CH3OH (1726 cm�1) ices. In irradiatedCD3OD–
13CO ices, D2CO and D213CO were observed at 1678 cm�1 (band 2) and
1655 cm�1 (band 20), respectively, matching well with the band at 1676 cm�1 inirradiated CD3OD ice, and the literature value for the isotope shi of D2
13CO (71cm�1) is close to the observed value of 76 cm�1.68 Similarly, two isotopomers ofmethyl formate were also observed in the isotopically mixed ices of methanol–carbon monoxide. Here, HCO and H13CO of methyl formate in the irradiated13CH3OH–CO ice were detected at 1710 cm�1 (band 30) and 1678 cm�1 (band 3),which are close to the observed values of methyl formate in CH3OH (1714 cm�1)
and 13CH3OH (1676 cm�1) ices. In irradiated CH318OH–CO and CH3OH–C18O ices,
HC18O units of methyl formate isotopomers were observed at 1680 cm�1 (band 3)and 1684 cm�1(band 30), respectively and the HCO carbonyl unit was observed at1714 cm�1 (band 30) and 1716 cm�1 (band 3), respectively. These peak positionsagree with the observed positions of methyl formate in irradiated pure CH3
18OH(1682 cm�1) and CH3OH (1714 cm�1) ices. In irradiated CD3OD–
13CO ices, DCOand D13CO carbonyl units of methyl formate were observed at 1666 cm�1 (band 3)(1664 cm�1 in irradiated CD3OD ice) and 1647 cm�1 (band 30), respectively. Theisotope shi observed in the case of the D13CO (67 cm�1) carbonyl unit in methylformate is reasonable based on the observed shi in the case of the formaldehydeisotopomer (the Dn of D2
13CO is 71 cm�1), as discussed earlier.3.1.3 Quantitative analysis of glycolaldehyde formation. In the case of
methanol ices, considering an infrared absorption coefficient of 1.3 � 10�17 cmmolecule�1 for the n8 band of methanol,40 the initial column density of 1.8� 0.2�1017 molecules cm�2 decreased to 1.2 � 0.2 � 1017 molecules cm�2 aer irradi-ation, with a decrease of 6.0� 0.6� 1016 molecules of methanol (Table 4). Duringthe irradiation by 5 keV electrons with a beam current of 30 nA, a total of 6.7 �1014 electrons penetrated the sample. From here, we can estimate that 90 � 9molecules of methanol were destroyed by each impinging electron, which isequivalent to 1.9 � 0.2 � 10�2 molecules eV�1. During the same period of time,3.1 � 0.3 � 1014 molecules of glycolaldehyde were produced, with a productionrate of 1.0 � 0.1 � 10�4 molecules eV�1. The glycolaldehyde abundance is thuscalculated to be 0.17� 0.02% with respect to the initial methanol column density.Furthermore, in the case of methanol–carbon monoxide ices, 4.1 � 0.4 � 1016
molecules of methanol out of 1.1 � 0.1 � 1017 molecules cm�2, and 5.4 � 0.5 �1016 molecules of carbon monoxide out of 1.8 � 0.2 � 1017 molecules cm�2 weredestroyed during the irradiation. This leads to the rates of destruction of meth-anol and carbon monoxide of 1.3 � 0.2 � 10�2 and 1.8 � 0.2 � 10�2 moleculeseV�1, respectively. Additionally, 1.6� 0.1� 1015 molecules of glycolaldehyde wereproduced immediately following irradiation, with an estimated yield of 5.2 � 0.5� 10�4 molecules eV�1. The glycolaldehyde abundance is thus calculated to be 1.4� 0.1% and 0.89 � 0.09% with respect to the initial column densities of themethanol and carbon monoxide, respectively. Note that this production rate(molecules eV�1) is almost ve times greater than the rate of glycolaldehydeformation in pure methanol ices, suggesting the presence of a more favorablereaction pathway, most probably the hydrogenation of carbon monoxide to theformyl radical, as observed in previous studies.41
3.2 ReTOF mass spectroscopy
In addition to the detection of glycolaldehyde using FTIR spectroscopy, weemployed complementary, highly sensitive single photoionization ReTOF massspectrometry coupled with temperature programmed desorption (TPD) studies toidentify glycolaldehyde in the irradiated methanol ices and mixed methanol–carbon monoxide ices based on the mass-to-charge ratios, the sublimationtemperatures and the corresponding shis in the mass-to-charge ratios uponisotope substitution. Fig. 5A and 5B show the complete ReTOF mass spectra as afunction of temperature during the warm-up phase aer the irradiation of themethanol and methanol–carbon monoxide ices, respectively. The spectra display
the intensity as total counts of the ionized products subliming into the gas phaseat well-dened temperatures.
In the case of the irradiated methanol ices, the molecular formulae of theproducts can be assigned by tracing the sublimation of the irradiated isotopicallylabeled ices (D4-methanol (CD3OD),
13C-methanol (13CH3OH) and 18O-methanol(CH3
18OH)) via a shi by 1 amu for each hydrogen (replacing H by D) and carbon(replacing 12C by 13C) atom, and 2 amu for each oxygen (replacing 16O by 18O)atom. Further, the isotopically labeled counterparts can be easily identied in allfour ices by plotting the sublimation temperatures versus the ion counts andverifying that these species have identical sublimation proles.61,65 In the case ofbinary ices of methanol–carbon monoxide, in addition to the natural isotopic icesof CH3OH–CO, selected isotopically labeled ices CD3OD–CO,
13CH3OH–CO,CH3
18OH–CO, CD3OD–13CO, CH3
18OH–C18O and CH3OH–C18O were also exposedto ionizing radiation, and the radiation induced products were analyzed followingTPD utilizing ReTOFMS. Here, the molecular formulae of the products wereassigned based on the same methodology as discussed above. Further, thepresent set of isotopic ices helped us to assign whether the C/H/O bearingmolecules followed the incorporation of the carbon monoxide unit. As anexample, from the results from FTIR spectroscopy (Section 3.1), the carbonyl unit(HCO) of the glycolaldehyde (HOCH2CHO) product can be formed from bothmethanol and carbon monoxide. Here, selected mixed isotopically labeled binaryices of 13CH3OH–CO, CH3
18OH–CO, CD3OD–13CO and CH3OH–C18O were studied
to assign the molecular formula along with their formation routes.3.2.1 Glycolaldehyde (HOCH2CHO). Specic attention is paid to the detec-
tion of glycolaldehyde (HOCH2CHO) in the interstellar analogous ices of meth-anol and binary ices of methanol–carbon monoxide. In these irradiated CH3OHices and CH3OH–CO ices, the molecular ion peak of glycolaldehyde (C2H4O2
+) isexpected at m/z ¼ 60 amu. It should be mentioned that with the molecularformula C2H4O2, four possible isomers exists with following ionization energies(IE): glycolaldehyde (HOCH2CHO; IE ¼ 10.20 eV), ethene-1,2-diol (HOCH]
CHOH; IE ¼ 9.62 eV), methyl formate (HCOOCH3; IE ¼ 10.84 eV) and acetic acid(CH3COOH; IE ¼ 10.63 eV). Among these isomers, methyl formate (10.84 eV) andacetic acid (10.63 eV) have ionization energies higher than the energy of thephotoionization source (10.49 eV) and therefore do not contribute to the ionsignal at m/z ¼ 60 amu. However, the other two isomers, glycolaldehyde andethene-1,2-diol, have ionization energies of 10.20 eV and 9.62 eV, respectively, andtherefore can be ionized.
3.2.2 Glycolaldehyde in irradiated methanol ices. First, we would like todiscuss the identication of glycolaldehyde in methanol ices. It should bementioned here that, in ices of methanol isotopologues, molecular ion signals ofC2H4O2 and its isotopomers are expected at m/z ¼ 60 amu (C2H4O2
+; CH3OH ice),m/z¼ 64 amu (C2D4O2
+; CD3OD ice),m/z¼ 62 amu (13C2H4O2+; 13CH3OH ice), and
at m/z ¼ 64 amu (C2H418O2
+; CH318OH ice). Table 5 shows feasible formation
routes of C2H4O2 isomers, glycolaldehyde and ethene-1,2-diol, through therecombination of radical reactants (HCO, CH2OH, and CHOH) which can beformed upon radiolysis of methanol. Here, a glycolaldehyde molecule is formu-lated via the radical–radical combination of one HCO with a CH2OH radical, andethene-1,2-diol is formally formed via dimerization of CHOH or a tautomerizationmechanism of glycolaldehyde.
Fig. 5 (A) ReTOF mass spectra as a function of the temperature of the newly formedproducts subliming into the gas phase from the irradiatedmethanol (CH3OH) ices. (B) ReTOFmass spectra as a function of the temperature of the newly formed products subliming intothe gas phase from the irradiated methanol–carbon monoxide (CH3OH–CO) ices.
Faraday Discussions Paper
Fig. 6 depicts the sublimation prole of integrated ion counts atm/z ¼ 60 amu(C2H4O2
+). In principle, the ion signal atm/z¼ 60 amu can also originate from theionization of C3H8O (m/z ¼ 60 amu) isomers such as 1-propanol (10.22 eV), 2-propanol (10.17 eV), and methoxyethane (9.72 eV); these molecules have ioniza-tion energies lower than the 10.49 eV ionization photon. The distinct peak at 120K is assigned to C3H8O isomers, as observed in previously irradiated CH4–COices.65 Furthermore, the pronounced peak at 200 K displays a similar onset to thesublimation prole of m/z ¼ 62 amu (C2H6O2
+), as shown in Fig. 6. The similarityin the onsets of the sublimation proles of m/z ¼ 60 amu (C2H4O2
+) and m/z ¼ 62amu (C2H6O2
+) implies that the ion signal atm/z¼ 60 amu (C2H4O2+) could be due
to the photofragmentation of the parent C2H6O2 molecules. In an effort to explorethis possibility, the TPD ReTOF mass spectra of pure ethylene glycol (HOCH2-
CH2OH; IE ¼ 10.16 eV) and a 10% mixture of ethylene glycol in methanol andmethanol–carbon monoxide ices were recorded as a function of temperatureunder identical experimental parameters. Here, ethylene glycol did not exhibitany fragmentation tom/z¼ 60 amu, indicating that co-sublimation of C2H4O2 (m/z ¼ 60 amu) along with ethylene glycol (C2H6O2; m/z ¼ 62 amu) is responsible forthe signal detected at 200 K.
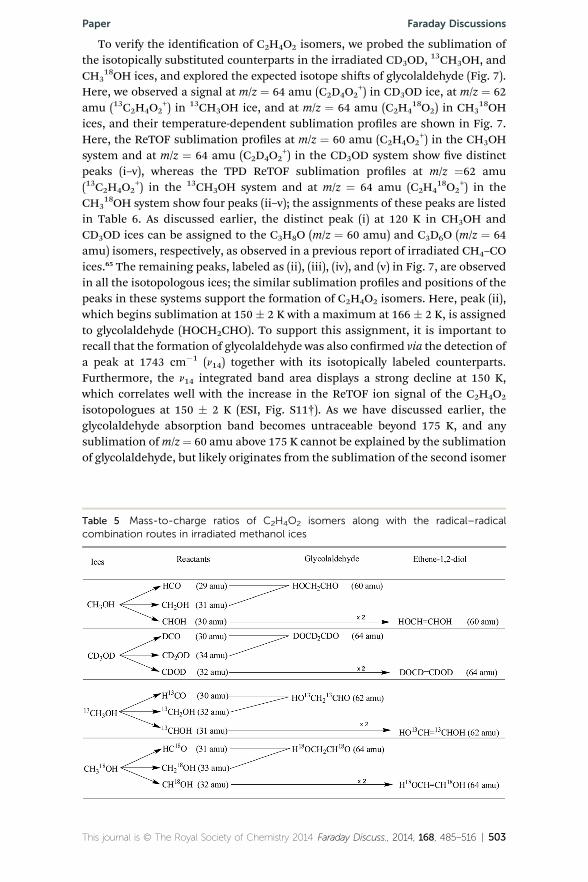
To verify the identication of C2H4O2 isomers, we probed the sublimation ofthe isotopically substituted counterparts in the irradiated CD3OD,
13CH3OH, andCH3
18OH ices, and explored the expected isotope shis of glycolaldehyde (Fig. 7).Here, we observed a signal at m/z ¼ 64 amu (C2D4O2
+) in CD3OD ice, at m/z ¼ 62amu (13C2H4O2
+) in 13CH3OH ice, and at m/z ¼ 64 amu (C2H418O2) in CH3
18OHices, and their temperature-dependent sublimation proles are shown in Fig. 7.Here, the ReTOF sublimation proles at m/z ¼ 60 amu (C2H4O2
+) in the CH3OHsystem and at m/z ¼ 64 amu (C2D4O2
+) in the CD3OD system show ve distinctpeaks (i–v), whereas the TPD ReTOF sublimation proles at m/z ¼62 amu(13C2H4O2
+) in the 13CH3OH system and at m/z ¼ 64 amu (C2H418O2
+) in theCH3
18OH system show four peaks (ii–v); the assignments of these peaks are listedin Table 6. As discussed earlier, the distinct peak (i) at 120 K in CH3OH andCD3OD ices can be assigned to the C3H8O (m/z ¼ 60 amu) and C3D6O (m/z ¼ 64amu) isomers, respectively, as observed in a previous report of irradiated CH4–COices.65 The remaining peaks, labeled as (ii), (iii), (iv), and (v) in Fig. 7, are observedin all the isotopologous ices; the similar sublimation proles and positions of thepeaks in these systems support the formation of C2H4O2 isomers. Here, peak (ii),which begins sublimation at 150 � 2 K with a maximum at 166 � 2 K, is assignedto glycolaldehyde (HOCH2CHO). To support this assignment, it is important torecall that the formation of glycolaldehyde was also conrmed via the detection ofa peak at 1743 cm�1 (n14) together with its isotopically labeled counterparts.Furthermore, the n14 integrated band area displays a strong decline at 150 K,which correlates well with the increase in the ReTOF ion signal of the C2H4O2
isotopologues at 150 � 2 K (ESI, Fig. S11†). As we have discussed earlier, theglycolaldehyde absorption band becomes untraceable beyond 175 K, and anysublimation ofm/z¼ 60 amu above 175 K cannot be explained by the sublimationof glycolaldehyde, but likely originates from the sublimation of the second isomer
Table 5 Mass-to-charge ratios of C2H4O2 isomers along with the radical–radicalcombination routes in irradiated methanol ices
ethene-1,2-diol. Correspondingly, we assign peaks (iii) and (iv) at 200 K and 210 Kto the sublimation of ethene-1,2-diol (HOCH]CHOH). Recall that the peak at 200K is due to the co-sublimation of C2H4O2 along with ethylene glycol as discussedpreviously. Note that ethene-1,2-diol, having two OH functional groups, caninteract more strongly with ethylene glycol via hydrogen bonding, and co-subli-mation is therefore reasonable. Furthermore, sublimation of ethene-1,2-diolpeaking at 210 K (iv) is also reasonable, as ethene-1,2-diol has a higher polaritycompared to glycolaldehyde (HOCH2CHO). In addition to this, evidence ofinfrared absorption in the OH stretching region (see Fig. 8) aer the completesublimation of ethylene glycol at around 210 K also suggests the presence ofethene-1,2-diol in the ices, which peaks at 210 K. Finally, the distinct peak ataround 234 K (v) can be assigned to fragmentation from glycerol (C3H8O3), basedon a recent study on the photoionization of glycerol (C3H8O3) which identied aprominent photofragment at m/z ¼ 60 amu (C2H4O2) with an appearance energyof 9.9 eV.69 The identication of glycerol in these experiments will be presented ina follow up article, as we are focusing solely on glycolaldehyde here.
3.2.3 Glycolaldehyde in irradiated methanol–carbon monoxide ices. Here wewould like to discuss the detection of glycolaldehyde (HOCH2CHO) during theTPD studies in irradiated methanol–carbon monoxide isotopologue ices. Radicalreactants HCO, CH2OH, and CHOH can be formed once again via radiolysis ofCH3OH, or specically in this system via the stepwise hydrogenation of carbonmonoxide molecules as shown in Table 7. Note that, in the case of isotopicallypure ices, namely CH3OH–CO, CD3OD–CO, and CH3
18OH–C18O, where only oneisotope of each atom is present, C2H4O2 isotopologues can only be observed atm/z¼ 60 amu (C2H4O2
+), 64 amu (C2D4O2+), and 64 amu (C2H4
18O2+), respectively.
However, in the case of isotopically mixed ices such as 13CH3OH–CO, CH318OH–
CO, CD3OD–13CO and CH3OH–C18O, two different isotopes of either carbon (12C
Fig. 6 Top: sublimation profile of integrated counts at m/z ¼ 60 amu (C2H4O2+) in the
peak at 200 K of m/z ¼ 60 amu is a result of the co-sublimation of C2H4O2 with C2H6O2.The signal atm/z¼ 62 amu (C2H6O2
+) is due to ethylene glycol (HOCH2CH2OH; 10.16 eV).The distinct peak at 120 K corresponds to C3H8O (m/z¼ 60 amu; 1-propanol (10.22 eV), 2-propanol (10.17 eV)), as observed in previous results of irradiated CH4–CO ices.65 Further,the peak at around 234 K is assigned to the fragmentation from higher molecular massC3H8O3 (glycerol), which shows a prominent fragmentation at m/z ¼ 60 amu (C2H6O2
Fig. 7 Sublimation profiles of ion counts atm/z ¼ 60 amu (C2H4O2+), 64 amu (C2D4O2
+),62 amu (13C2H4O2
+), and 64 amu (C2H418O2
+) in CH3OH, CD3OD, 13CH3OH, and CH318OH
systems, respectively. In the case of CD3OD ices, the peak at 120 K (i) corresponds toC3D6O (m/z ¼ 64 amu; acetone (9.7 eV), propanal (10.0 eV)), as observed in a previousreport of irradiated CD4–CO ices.65 The peak at 200 K is a result of the co-sublimation ofC2H4O2
+ (m/z ¼ 60 amu) with ethylene glycol (C2H6O2). Detailed assignments of thepeaks (i–v) are listed in Table 6.
Paper Faraday Discussions
and 13C) or oxygen (16O and 18O) are present together; hence two different isotopicsets of radical reactants are possible, as identied via in situ FTIR spectroscopy ofthe processed ices (Section 3.1.2). Here, radical–radical recombination leads tothe observation of C2H4O2 isotopologues at three different masses are expected tobe observed in each system; at m/z ¼ 60 amu (C2H4O2
+), 61 amu (C13CH4O2+) and
62 amu (13C2H4O2+) in the 13CH3OH–CO system, at m/z ¼ 60 amu (C2H4O2
+), 62amu (C2H4O
18O+) and 64 amu (C2H418O2
+) in the CH318OH–CO system, at m/z ¼
66 amu (13C2D4O2+), 65 amu (C13CD4O2
+) and 64 amu (C2D4O2+) in the
CD3OD–13CO system, and nally at m/z ¼ 64 amu (C2H4
18O2+), 62 amu
(C2H4O18O+) and 60 amu (C2H4O2
+) in the CH3OH–C18O system. Note that, in allthe above cases (Table 7), both glycolaldehyde and ethene-1,2-diol cannot beseparated based on isotopic mass shis; however, we can contemplate theirdetection in irradiated methanol–carbon monoxide ices.
Fig. 9 depicts the sublimation prole of integrated ion counts at m/z ¼ 60(C2H4O2
+) in CH3OH–CO ices. The small peak at 120 K is assigned to C3H8Oisomers, similar to the result for methanol ices. Here, the sublimation prole ofC2H6O2 is also presented in Fig. 9, and the peak at 196 � 2 K can be attributed tothe co-sublimation of C2H4O2 isomers along with ethylene glycol (C2H6O2), asdiscussed in Section 3.2.2. Note that, in isotopically pure ices of CH3OH–CO,CD3OD–CO and CH3
18OH–C18O, C2H4O2 isotopologues are observed only atm/z¼
Fig. 8 Infrared absorption spectra of the irradiated methanol (CH3OH) and methanol–carbon monoxide (CH3OH–CO) ices at 210 K and 218 K. The broad peak from 3500 to3050 cm�1 is assigned to the OH stretching vibrations of alcohols present in the ices. Thetemperatures of 210 K and 218 K in the CH3OH and CH3OH–CO systems correspond tothe sublimation of ethene-1,2-diol with ethylene glycol already being sublimed in the gasphase.
Paper Faraday Discussions
60 amu (C2H4O2+), 64 amu (C2D4O2
+) and 64 amu (C2H418O2
+), respectively, asderived in Table 7 and shown in Fig. 10. In the case of the CD3OD–CO system, thepeak at 125 K can be assigned to C3D6O (m/z¼ 64 amu) isomers. Furthermore, thesublimation proles of C2H4O2 isotopologues depict two distinct peaks at 196� 2 Kand 218 � 2 K. The maximum at 196 � 2 K is assigned to the sublimation of gly-colaldehyde. To support these assignments, we recall that the formation of glyco-laldehyde was also conrmed via the detection of peaks at 1743 cm�1 (n14) and 1062cm�1 (n7) in the post-irradiated ices of methanol–carbon monoxide, together withthe expected frequency shis of the isotopically labeled counterparts. The inte-grated infrared absorption band area of glycolaldehyde at 1743 cm�1 (n14) shows aslow decline in column density at 150 K, followed by a rapid decline at 180 � 2 K(ESI, Fig. S11†). Note that in ESI Fig. S12,† the sublimation proles derived fromTPD ReTOF spectroscopy correlate well with the slow (150 K) and then fast (178� 2K) sublimation of glycolaldehyde observed in the FTIR data. However, the peak at218 � 2 K cannot be explained by the sublimation of glycolaldehyde, as no trace ofglycolaldehyde can be observed in the infrared spectra aer 195 K. Here, the peak at218 � 2 K is likely to be due to the sublimation of ethene-1,2-diol. As discussedearlier, ethene-1,2-diol is expected to sublimate at a higher temperature due to itshigher polarity, and correspondingly stronger intermolecular interactions.Furthermore, the infrared spectrum at 218 K (Fig. 8) shows evidence of absorptionin the OH stretching region, which suggests the presence of ethene-1,2-diol, andthus is attributed to the peak at 218 K, as shown in Fig. 9.
4. Discussion
We would like to discuss now the formation mechanisms of glycolaldehyde. Theformation routes are based on the empirical evidence presented above, i.e. theobservation of distinct isotopomers of glycolaldehyde following irradiation within
Table 7 Mass-to-charge ratios of the C2H4O2 isomers, along with the radical–radicalcombination routes in irradiated methanol–carbon monoxide ices
Faraday Discussions Paper
isotopically mixed ices, and in conjunction with previously identied routesguided by the kinetic modeling and numerical tting of the temporal evolution ofnewly formed products in irradiated ices of methanol40 and methanol–carbon
monoxide ices41 (Fig. 11). In the case of methanol ices, irradiation induceddecomposition of methanol follows three major competing reaction pathways: (1)unimolecular decomposition to a hydroxymethyl (CH2OH) radical and a supra-thermal hydrogen atom, (2) unimolecular decomposition to a methoxy (CH3O)radical and a suprathermal hydrogen atom, and (3) decomposition to formalde-hyde (H2CO) and molecular hydrogen (or two hydrogen atoms).
CH3OH / CH2OH + H (1)
CH3OH / CH3O + H (2)
CH3OH / H2CO + H2 (3)
Among these, reaction (3) is the most dominating pathway, having the rateconstant 4.4 � 10�4 s�1, which is about six and four times faster than reaction (1)(k ¼ 6.95� 10�5 s�1) and reaction (2) (k ¼ 1.04� 10�4 s�1),40 respectively.Furthermore, both the hydroxymethyl radical and the methoxy radical were foundto undergo subsequent unimolecular decomposition to produce formaldehydeand a hydrogen atom, as in reaction (4) and reaction (5), respectively.
CH2OH / H2CO + H (4)
CH3O / H2CO + H (5)
Recall that, during the irradiation of all isotopologue ices, infrared absorptionsdue to the formaldehyde and hydroxymethyl radicals are indeed observed withcorresponding frequency shis. The kinetic tting also suggests that formalde-hyde is decomposed to form the formyl (HCO) radical and a hydrogen atom(reaction (6)).
H2CO / HCO + H (6)
Fig. 9 Top: sublimation profile of ion counts atm/z ¼ 60 amu (C2H4O2+) in the CH3OH–
CO system. Bottom: sublimation profile of m/z ¼ 62 amu (C2H6O2+), suggesting that the
first peak at 198 K in m/z ¼ 60 amu is a result of co-sublimation of C2H4O2 with ethyleneglycol (C2H6O2; HOCH2CH2OH). The peak at 120 K is due to C3H8O (m/z ¼ 60 amu; 1-propanol (10.22 eV), 2-propanol (10.17 eV)), as observed previously for irradiated CH4–COices.65
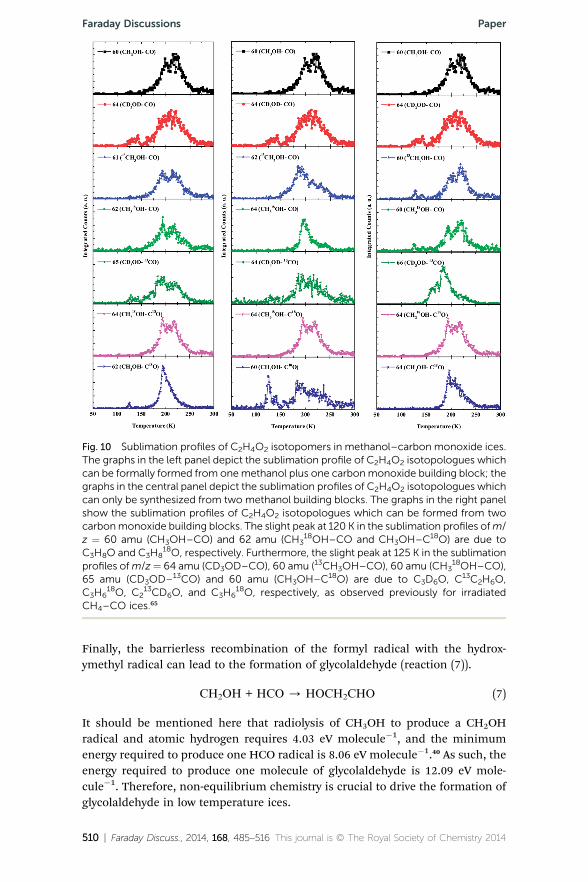
Fig. 10 Sublimation profiles of C2H4O2 isotopomers in methanol–carbon monoxide ices.The graphs in the left panel depict the sublimation profile of C2H4O2 isotopologues whichcan be formally formed from onemethanol plus one carbonmonoxide building block; thegraphs in the central panel depict the sublimation profiles of C2H4O2 isotopologues whichcan only be synthesized from two methanol building blocks. The graphs in the right panelshow the sublimation profiles of C2H4O2 isotopologues which can be formed from twocarbonmonoxide building blocks. The slight peak at 120 K in the sublimation profiles ofm/z ¼ 60 amu (CH3OH–CO) and 62 amu (CH3
18OH–CO and CH3OH–C18O) are due toC3H8O and C3H8
18O, respectively. Furthermore, the slight peak at 125 K in the sublimationprofiles ofm/z¼ 64 amu (CD3OD–CO), 60 amu (13CH3OH–CO), 60 amu (CH3
18OH–CO),65 amu (CD3OD–13CO) and 60 amu (CH3OH–C18O) are due to C3D6O, C13C2H6O,C3H6
18O, C213CD6O, and C3H6
18O, respectively, as observed previously for irradiatedCH4–CO ices.65
Faraday Discussions Paper
Finally, the barrierless recombination of the formyl radical with the hydrox-ymethyl radical can lead to the formation of glycolaldehyde (reaction (7)).
CH2OH + HCO / HOCH2CHO (7)
It should be mentioned here that radiolysis of CH3OH to produce a CH2OHradical and atomic hydrogen requires 4.03 eV molecule�1, and the minimumenergy required to produce one HCO radical is 8.06 eV molecule�1.40 As such, theenergy required to produce one molecule of glycolaldehyde is 12.09 eV mole-cule�1. Therefore, non-equilibrium chemistry is crucial to drive the formation ofglycolaldehyde in low temperature ices.
In the presence of carbon monoxide, suprathermal atomic hydrogen producedduring the decomposition of methanol can overcome the barrier of addition (4.03eV molecule�1) to the carbon monoxide molecule, leading to the formation of aformyl radical via reaction (8), which may be followed by reaction (7) leading tothe formation of glycolaldehyde as well.
CO + H / HCO (8)
Note that in binary ices of methanol and carbon monoxide, the formyl radicalcan be produced via at least two different reaction mechanisms, either via radi-olysis of methanol (reactions (1)–(6)), or via hydrogenation of carbon monoxide(reaction (8)). The reaction mechanisms discussed above suggest that, in themixed isotopic ices, 13CH3OH–CO, CH3
18OH–CO, CD3OD–13CO and OH–C18O,
two different glycolaldehyde isotopomers can be formed with the CH2OH unitfrom methanol building blocks and the HCO unit either from carbon monoxidebuilding blocks or from methanol building blocks. The deconvolution of thecarbonyl absorption in the FTIR spectra of these ices indeed revealed theproduction of glycolaldehyde isotopologues; thereby supporting the mechanismproposed by Bennett et al.40,41
In addition to this, successive hydrogenation of carbon monoxide could led tothe formation of a CH2OH radical unit which can recombine with the HCO radicalunit, formed via the above mentioned reaction pathways (6) and (8), to formglycolaldehyde as well (see Fig. 11). In this regard, the hydrogenation of the formylradical (HCO) formed via reaction (8) to form formaldehyde (H2CO), and asubsequent hydrogenation leading to the formation of the CH2OH radical viareaction pathways (9) and (10) is expected, as shown in Fig. 4 and 11.
HCO + H / H2CO (9)
H2CO + H / CH2OH (10)
Fig. 11 Reaction scheme for the formation of glycolaldehyde (HOCH2CHO) in irradiatedmethanol and in methanol–carbon monoxide mixed ices extracted from the kineticfittings of the column density of the products. The red arrow indicates the dominantpathway among other pathways for the formation of formaldehyde.40,41 The blue arrowsindicate additional proposed reaction pathways based on the current experimental results.
Reaction pathway (9) suggests the formation of formaldehyde via hydrogenationof carbon monoxide. Recall that, in the mixed isotopic ices of methanol–carbonmonoxide, 13CH3OH–CO, CH3
18OH–CO, CD3OD–13CO and CH3OH–C18O, two iso-
topomers of formaldehyde were observed (Table 3) in each system. As an example,in CH3
18OH–CO ices, formaldehyde bands were identied at 1692 cm�1 and 1724cm�1, and these band positions were close to the formaldehyde bands observed inCH3
quently, these observations conrmed the detection of H2C18O as well as H2CO at
1692 cm�1 and 1724 cm�1, respectively, in CH318OH–CO ices. The above observa-
tion provides clear evidence that reaction pathway (9) occurs. Furthermore, thehydrogenation of formaldehyde to form the CH2OH radical, followed by recombi-nation with the HCO radical unit (reaction (7)) can result in the formation of gly-colaldehyde as well. Note that, in the mixed isotopic ices of methanol–carbonmonoxide, two different isotopomers of CH2OH radicals (via reaction pathways (1)and (10)) and two different isotopomers of HCO radicals (reaction pathways (6) and(8)) could lead to the formation of four isotopomers of glycolaldehydemolecules, asshown in Fig. 4. However, within these four isotopomers, only two isotopic carbonylunits (HCO) are present, which results in the detection of two different infraredabsorptions of the glycolaldehyde carbonyl stretching vibration in the mixedisotopic ices (Table 3, Fig. 3b). As an example, in the CH3
18OH–CO system, CH2OH,formed via the successive hydrogenation of carbon monoxide ((8)–(10)), canrecombine with HC18O (via reactions (1)–(6)) or HCO (reaction (8)), resulting inHOCH2CH
18O and HOCH2CHO (see Fig. 4). These two isotopomers have identicalcarbonyl units of H18OCH2CH
18O and H18OCH2CHO (reactions (1)–(8)); conse-quently, the two carbonyl stretching frequencies detected at 1708 cm�1 (HC18O)and 1743 cm�1 (HCO) correspond to the respective isotopomers of glycolaldehyde.Based on the in situ FTIR and TPD ReTOF mass spectroscopic evidence presentedabove, the overall reaction pathways ultimately resulting in the formation of gly-colaldehyde are presented in Fig. 11.
Also note the increase of glycolaldehyde abundance during the warm up phaseof the irradiated ices. Here, the increase of glycolaldehyde was associated with asimultaneous decrease in the amount of formyl radicals. In the case of irradiatedmethanol ices, the amount of glycolaldehyde increased by almost the exact sameamount by which formyl radicals decreased, about 5 � 1014 molecules. Similarly,a corresponding increase in the amount of glycolaldehyde with the decrease inthe amount of formyl radicals was observed following the warm up of the irra-diated mixed methanol and carbon monoxide ices. Here, the amount of glyco-laldehyde increases by a similar order of magnitude (2 � 1014 molecules);however, the amount of formyl radical decreased by almost an order of magnitudemore (1.6 � 1015 molecules), accounting for only 12% of the apparent increase inglycolaldehyde, suggesting that an additional chemical route is involved. Theseobservations imply additional thermal chemistry of the trapped radicals diffusingthrough the methanol matrix following reaction (7), ultimately yieldingglycolaldehyde.
5. Conclusions
The present experimental approach specically focused on the detection of gly-colaldehyde in irradiated methanol ices and methanol–carbon monoxide binary
ices along with their isotopically labeled counterparts. Here we utilized twocomplementary detection techniques, infrared spectroscopy and single photo-ionization ReTOF mass spectrometry, in order to analyze the endogenoussynthesized products formed via radiation induced chemical processing. The online and in situ infrared spectroscopy identied the formation of the astro-biologically important molecule glycolaldehyde, based on the agreement of theobserved infrared band positions and the associated isotopic shis with theliterature data. In the case of mixed isotopic ices of methanol–carbon monoxide(13CH3OH–CO, CH3
18OH–CO, CD3OD–13CO and CH3OH–C18O) where two
different isotopes of carbon or oxygen are present together, deconvolution of thebroad carbonyl absorption features identied at least two isotopomers of glyco-laldehyde (Fig. 3B and Table 3). This conrms the presence of at least two reactionpathways in methanol–carbon monoxide ices for the formation of the carbonylfunctional group (HCO) of glycolaldehyde, via the decomposition of methanoland the hydrogenation of carbon monoxide molecules. Accordingly, during theTPD studies of irradiated methanol and methanol–carbon monoxide ices andtheir isotopologues, using single photoionization ReTOF mass spectrometry weconrmed the detection of glycolaldehyde based on the identical sublimationproles of the corresponding shied masses. Furthermore, the agreementbetween the sublimation of glycolaldehyde obtained from ReTOF mass spec-troscopy and FTIR spectroscopy supports this detection. In themixed isotopic ices(13CH3OH–CO, CH3
18OH–CO, CD3OD–13CO and CH3OH–C18O) we were able to
detect glycolaldehyde at three different isotopic masses, suggesting that at leastthree competing reaction mechanisms are involved in the formation of glyco-laldehyde in the irradiated ices at 5 K: (i) formation of glycolaldehyde via ahydrogenation mechanism of carbon monoxide, (ii) formation of glycolaldehydevia the reaction of one methanol unit with carbon monoxide unit, and (iii) via thedecomposition of a methanol molecule followed by recombination of HCO andCH2OH radicals.
Upon warming up of the irradiated samples, the column density of the gly-colaldehyde shows an increase, implying the presence of additional thermalchemistry, most probably via the diffusion and ensuing reaction of trappedradicals. Further, the fractional abundance of the glycolaldehyde in the irradiatedmethanol ices was estimated (see the ESI for relevant details†) within the range4.5 � 0.5 to 1.8 � 0.2 � 10�8 with respect to molecular hydrogen; in methanol–carbon monoxide ices the fractional abundance of glycolaldehyde is from 1.9 �0.2 � 10�7 to 5.7 � 0.6 � 10�8. These estimated glycolaldehyde abundances areclose to the abundances of those calculated based on our observations, with dosesrelevant to the typical lifetime of interstellar ices prior to the star-formationinduced warm up phase. Therefore, our laboratory simulation demonstrates thatradiation exposure of bulk ices containing methanol and methanol–carbonmonoxide, relevant to the actual physical environment of an ice covered grainmantle, will ultimately lead to the synthesis of glycolaldehyde.
Acknowledgements
The authors would like to thank the W. M. Keck Foundation, the University ofHawaii, and the NASA Exobiology Program MNX13AH62G.
1 J. M. Hollis, F. J. Lovas and P. R. Jewell, Astrophys. J., 2000, 540, L107–L110.2 L. E. Snyder, Proc. Natl. Acad. Sci. U. S. A., 2006, 103, 12243–12248.3 J. M. Hollis, S. N. Vogel, L. E. Snyder, P. R. Jewell and F. J. Lovas, Astrophys. J.,2001, 554, L81–L85.
4 D. T. Halfen, A. J. Apponi, N. Woolf, R. Polt and L. M. Ziurys, Astrophys. J., 2006,639, 237–245.
5 M. T. Beltran, R. Cesaroni, R. Neri, C. Codella, R. S. Furuya, L. Testi andL. Olmi, Astron. Astrophys., 2005, 435, 901–925.
6 M. T. Beltran, C. Codella, S. Viti, R. Neri and R. Cesaroni, Astrophys. J., 2009,690, L93.
7 M. A. Requena-Torres, J. Martın-Pintado, S. Martın andM. R. Morris, Astrophys.J., 2008, 672, 352.
8 J. K. Jørgensen, C. Favre, S. E. Bisschop, T. L. Bourke, E. F. van Dishoeck andM. Schmalzl, Astrophys. J., 2012, 757, L4.
9 J. L. Bada, Earth Planet. Sci. Lett., 2004, 226, 1–15.10 D. P. Bartel and P. J. Unrau, Trends Biochem. Sci., 1999, 24, M9–M13.11 A. Lazcano and S. L. Miller, Cell, 1996, 85, 793–798.12 O. Leslie E, Crit. Rev. Biochem. Mol. Biol., 2004, 39, 99–123.13 L. E. Orgel, Trends Biochem. Sci., 1998, 23, 491–495.14 F. H. C. Crick, J. Mol. Biol., 1968, 38, 367–379.15 L. E. Orgel, J. Mol. Biol., 1968, 38, 381–393.16 L. E. Orgel, Cold Spring Harbor Symp. Quant. Biol., 1987, 52, 9–16.17 C. R. Woese, The genetic code: The molecular basis for genetic expression, Harper
& Row, New York, 1967.18 S. A. Benner, H.-J. Kim and M. A. Carrigan, Acc. Chem. Res., 2012, 45, 2025–
2034.19 M. Yarus, Origins Life Evol. Biosphere, 2013, 43, 19–30.20 M. Levy and S. L. Miller, Proc. Natl. Acad. Sci. U. S. A., 1998, 95, 7933–7938.21 K. Ruiz-Mirazo, C. Briones and A. de la Escosura, Chem. Rev., 2014, 114, 285–
366.22 R. Breslow, M. Levine and Z.-L. Cheng, Origins Life Evol. Biosphere, 2010, 40,
11–26.23 M. A. Boutlerow, Comptes rendus hebdomadaires des seances de l'Academie des
Sciences., 1861, 53, 145.24 R. Shapiro, Origins Life Evol. Biosphere, 1988, 18, 71–85.25 D. Muller, S. Pitsch, A. Kittaka, E. Wagner, C. E. Wintner, A. Eschenmoser and
G. Ohlogewidmet, Helv. Chim. Acta, 1990, 73, 1410–1468.26 S. A. Benner, H.-J. Kim, M.-J. Kim and A. Ricardo, Cold Spring Harbor
Perspectives in Biology, 2010, 2.27 M. W. Powner, B. Gerland and J. D. Sutherland, Nature, 2009, 459, 239–242.28 C. Harman, J. Kasting and E. Wolf, Origins Life Evol. Biosphere, 2013, 43, 77–98.29 M. E. Jacox and D. E. Milligan, J. Mol. Spectrosc., 1973, 47, 148–162.30 K. Toriyama and M. Iwasaki, J. Am. Chem. Soc., 1979, 101, 2516–2523.31 E. P. Kalyazin and G. V. Kovalev, Khim. Vys. Energ., 1978, 12, 371–373.32 G. A. Baratta, A. C. Castorina, G. Leto, M. E. Palumbo, F. Spinella and
G. Strazzulla, Planet. Space Sci., 1994, 42, 759–766.
33 M. H. Moore, R. F. Ferrante and J. A. Nuth III, Planet. Space Sci., 1996, 44, 927–935.
34 M. E. Palumbo, A. C. Castorina and G. Strazzulla, Astron. Astrophys., 1999, 342,551–562.
35 G. Strazzulla, M. Arena, G. A. Baratta, C. A. Castorina, G. Celi, G. Leto,M. E. Palumbo and F. Spinella, Adv. Space Res., 1995, 16, 61–71.
36 G. Strazzulla, A. C. Castorina and M. E. Palumbo, Planet. Space Sci., 1995, 43,1247–1251.
37 R. L. Hudson and M. H. Moore, Icarus, 2000, 145, 661–663.38 R. L. Hudson and M. H. Moore, Radiat. Phys. Chem., 1995, 45, 779–789.39 P. A. Gerakines, W. A. Schutte and P. Ehrenfreund, Astron. Astrophys., 1996,
312, 289–305.40 C. J. Bennett, S.-H. Chen, B.-J. Sun, A. H. H. Chang and R. I. Kaiser, Astrophys.
J., 2007, 660, 1588.41 C. J. Bennett and R. I. Kaiser, Astrophys. J., 2007, 661, 899–909.42 P. Modica and M. E. Palumbo, Astron. Astrophys., 2010, 519, A22.43 P. Modica, M. E. Palumbo and G. Strazzulla, Planet. Space Sci., 2012, 73, 425–
429.44 Y. J. Chen, A. Ciaravella, G. M. M. Caro, C. Cecchi-Pestellini, A. Jimenez-
Escobar, K. J. Juang and T. S. Yih, Astrophys. J., 2013, 778, 162.45 A. L. F. de Barros, A. Domaracka, D. P. P. Andrade, P. Boduch, H. Rothard and
E. F. da Silveira, Mon. Not. R. Astron. Soc., 2011, 418, 1363–1374.46 A. Ciaravella, G. M. Caro, A. J. Escobar, C. Cecchi-Pestellini, S. Giarrusso,
M. Barbera and A. Collura, Astrophys. J., 2010, 722, L45.47 O. S. Heavens, Optical Properties of Thin Solid Films, Butterworths Scientic
Publications, London, 1955.48 P. Winsemius, F. F. v. Kampen, H. P. Lengkeek and C. G. v. Went, J. Phys. F:
Met. Phys., 1976, 6, 1583.49 A. M. Goodman, Appl. Opt., 1978, 17, 2779–2787.50 M. S. Westley, G. A. Baratta and R. A. Baragiola, J. Chem. Phys., 1998, 108, 3321–
3326.51 D. M. Hudgins, S. A. Sandford, L. J. Allamandola and A. G. G. M. Tielens,
Astrophys. J. Suppl., 1993, 86, 713–870.52 C. J. Bennett, C. Jamieson, A. M. Mebel and R. I. Kaiser, Phys. Chem. Chem.
Phys., 2004, 6, 735–746.53 A. Wada, N. Mochizuki and K. Hiraoka, Astrophys. J., 2006, 644, 300.54 R. L. Hudson and M. H. Moore, J. Geophys. Res., 2001, 106, 33275–33284.55 R. Brunetto, G. Caniglia, G. A. Baratta and M. E. Palumbo, Astrophys. J., 2008,
686, 1480.56 M. Garozzo, D. Fulvio, Z. Kanuchova, M. E. Palumbo and G. Strazzulla, Astron.
Astrophys., 2010, 509, A67.57 P. Hovington, D. Drouin and R. Gauvin, Scanning, 1997, 19, 1–14.58 R. Luna, M. A. Satorre, M. Domingo, C. Millan and C. Santonja, Icarus, 2012,
221, 186–191.59 B. D. Teolis, M. J. Loeffler, U. Raut, M. Fama and R. A. Baragiola, Icarus, 2007,
190, 274–279.60 K. I. Oberg, R. T. Garrod, E. F. van Dishoeck and H. Linnartz, Astron. Astrophys.,
2009, 504, 891–913.61 B. M. Jones and R. I. Kaiser, J. Phys. Chem. Lett., 2013, 4, 1965–1971.
62 A. Aspiala, J. Murto and P. Sten, Chem. Phys., 1986, 106, 399–412.63 J. Ceponkus, W. Chin, M. Chevalier, M. Broquier, A. Limongi and C. Crepin, J.
Chem. Phys., 2010, 133, 094502.64 K. Cai and J. Wang, J. Phys. Chem. B, 2009, 113, 1681–1692.65 R. I. Kaiser, S. Maity and B. M. Jones, Phys. Chem. Chem. Phys., 2014, 16, 3399–
3424.66 J. Lohilahti, T. A. Kainu and V.-M. Horneman, J. Mol. Spectrosc., 2005, 233, 275–
279.67 T.-L. Tso and E. K. C. Lee, J. Phys. Chem., 1984, 88, 5475–5482.68 J. Lohilahti, T. A. Kainu and V.-M. Horneman, J. Mol. Spectrosc., 2005, 233, 275–
279.69 F. Bell, Q. N. Ruan, A. Golan, P. R. Horn, M. Ahmed, S. R. Leone and M. Head-
Gordon, J. Am. Chem. Soc., 2013, 135, 14229–14239.