INFRARED PHOTODISSOCIATION SPECTROSCOPY OF CLUSTER ANIONS IN THE GAS PHASE by Holger Schneider Diploma (Chemistry), Universität Karlsruhe (TH), 2004 A thesis submitted to the Faculty of the Graduate School of the University of Colorado in partial fulfillment of the requirements for the degree of Doctor of Philosophy Department of Chemistry and Biochemistry 2008
Transcript
INFRARED PHOTODISSOCIATION SPECTROSCOPY
OF CLUSTER ANIONS IN THE GAS PHASE
by
Holger Schneider
Diploma (Chemistry), Universität Karlsruhe (TH), 2004
A thesis submitted to the
Faculty of the Graduate School of the
University of Colorado in partial fulfillment
of the requirements for the degree of
Doctor of Philosophy
Department of Chemistry and Biochemistry
2008
This thesis entitled:
Infrared Photodissociation Spectroscopy of Cluster Anions in the Gas Phase
Written by Holger Schneider
has been approved for the
Department of Chemistry and Biochemistry
The final copy of this thesis has been examined by both signatories, and we find that
both the content and the form meet acceptable presentation standards of scholarly
work in the above mentioned discipline
iii
Schneider, Holger (Ph.D. Physical Chemistry)
Infrared Photodissociation Spectroscopy of Cluster Anions in the Gas Phase Thesis directed by Professor J. Mathias Weber
Infrared photodissociation spectroscopy has been applied to mass-selected anion-
molecule complexes in the gas phase. In combination with quantum chemical
calculations, this technique has proven to be very successful for gaining insight into
the structures and interaction behavior of such species. We have used the “Ar
nanomatrix” approach (which means tagging of the target clusters with a small
number of Ar atoms) in order to produce cold complexes close to their ground state
equilibrium structures and to facilitate dissociation upon absorption of one infrared
photon.
The first part of this work deals with the investigation of the hydration of anions.
While the hydration behavior of atomic anions such as halides is well understood, not
much is known about the interaction between metal anions and water. Infrared spectra
of M-·H2O (M = Au, Ag, Cu) have been measured in this study and it has been shown
that they introduce a new motif for the solvation of small atomic anions, intermediate
between the clear-cut hydration motifs known so far due to the shallowness of their
potential energy curves. A second focus of the work on anion hydration has been on
complexes of water molecules and anions with extended negative charge distribution
such as the C6FnH6-n-·(H2O)m (n = 4 - 6, m = 1,2) and SF6
-·(H2O)m (m = 1 - 3) clusters.
While the binding motifs of water ligands to the fluorobenzenes have been found to
correspond mostly to the structures displayed by other anions where the charge is not
localized in a small part of the molecule (such as anions with triatomic domains), the
SF6-·(H2O)m (m = 1 - 3) complexes show another binding motif, reminiscent of the
heavier halide-water complexes. Moreover, the hydration shell of the sulfur
hexafluoride anion was found to exhibit delayed onset of water-water network
iv
formation, leading to water-water interaction only upon binding of a third water
ligand.
An intramolecular, infrared triggered reaction is described in the example of
the SF6-·HCOOH complex. It was found that the reaction could be influenced by the
degree of Ar solvation, effectively shutting down upon attachment of two or more Ar
atoms with the Ar acting as a coolant. The structure of the complex and three
different reaction channels identified could be determined. Aided by high-level
quantum calculations, a possible reaction pathway is proposed.
Lastly, a study on A-·C6FnH6-n (n = 0 - 5, A = Cl, I, SF6) is presented. This
system is of considerable interest in the context of anion recognition via interactions
with electron-deficient aromatic systems. Varying the number of fluorine atoms
around the carbon ring one at a time offers the possibility of tuning the electronic
properties of the aromatic molecule. Arenes with a high degree of fluorination offer
two competing binding motifs to an anion, namely binding to the top of the ring
(displaying a positive electrostatic potential) and binding to the periphery of the ring
via hydrogen bonding to one of the CH groups, which become increasingly acidic
upon increasing the number of fluorine atoms. It has been shown that the latter
prevails up to pentafluorobenzene, so that full fluorination of the ring is needed in the
case of fluorinated benzenes to make the binding motif switch to the top of the ring.
To my parents and my sisters
vi
Acknowledgements
There are many people I do owe a lot and without the help of whom I would have
never managed to accomplish this work. First of all, I would like to thank my advisor
Mathias Weber. He has been both a great friend and advisor, who has always been
able to pass on his own passion for physical chemistry. Not only did he never get
tired of teaching me the secrets of working in a laboratory, but he was always ready to
help out whenever problems occurred, and I could always count on his support in
personal issues and the planning of my future. Without his willingness to take me
along the next step in his own career after finishing in Karlsruhe and starting in his
new position in Colorado, I would have never been offered the opportunity to spend
most of my time as a graduate student abraod, which has been a great experience. I
want to use the opportunity to express that I am truly grateful at this point!
I would also like to thank Manfred Kappes, who accepted me to work with his group
in Karlsruhe in Germany already as an undergraduate. Getting introduced to the
fascinating research in his group certainly helped me to make the decision about my
major in favor of physical chemistry. I did my diploma thesis and started as a
graduate student in his group as well, but even after leaving for Colorado, he was
always willing to support me whenever it turned out to be necessary.
A special place in this list is taken by my family. My parents supported me
immensely through all my life and studies, and without their neverending willingness
to discuss and help me with all issues in my life, it is impossible I would have ever
made it through. I would also like to thank my sisters Irmhild and Dagmar at this
point, on whose unlimited support I could always count as well!
I was very lucky to have great friends and coworkers both in Karlsruhe and in
Boulder. My two labmates in JILA, Jesse Marcum and Chris Adams, deserve a
special thank you at this point. There were immensely helpful in building up the
laboratoy and getting experiments to run and work, and I certainly learnt a lot in the
numerous discussions we had about science in general and physical chemistry
specifically. But more than that, they have both been great friends, without whom
vii
working in the laboratory would have been only half as much fun and who offered me
much insight into life in the US. I hope I will still know both of them many years
from now! I also want to thank the people in the “ion-molecule” groups of Carl
Lineberger, Veronica Bierbaum and Barney Ellison, with whom I had many fruitful
interactions and who were always willing stop their own work in order to help out.
I would also like to say thank you to the people from the machine and electronics
shop and the IT support for their help with the setup of the laboratory and the
experiments, and their patience in dealing with all the obstacles which occurred along
the way.
Lastly, without writing down any further names, I would like to thank all friends and
coworkers I had along the way of my studies, who all contributed to the fact that I can
say at this point that I greatly enjoyed the last years and I learnt a lot not only with
5.3.3. The Cl-·C6H6 complex dimer ............................................................ 138
5.3.4. Spectra and structures of the Cl-·C6FnH6-n complexes ...................... 143
5.3.5. Vibrational spectrum and binding motif for the Cl-·C6F5H complex 146
5.3.6. Role of the anion............................................................................... 152
5.3.7. Summary and conclusions ................................................................ 154
5.4. References for Chapter V.......................................................................... 156
xi
List of Tables and Figures Table 3.1 Theoretical results for some of the energetic and geometric properties of
the M-·H2O complexes (M = Au, Ag, Cu) ............................................. 36 Table 3.2 Experimental and calculated IR band positions of the M-·H2O complexes
(M = Au, Ag, Cu).................................................................................. 38 Table 3.3 Relevant geometric values for the C6F6
- anion as calculated by DFT/B3-LYP/TZVPP (for labeling of atoms compare Figure 3.9)....... 47
Table 3.4 Relevant geometric values for the C6F5H- anion as calculated by
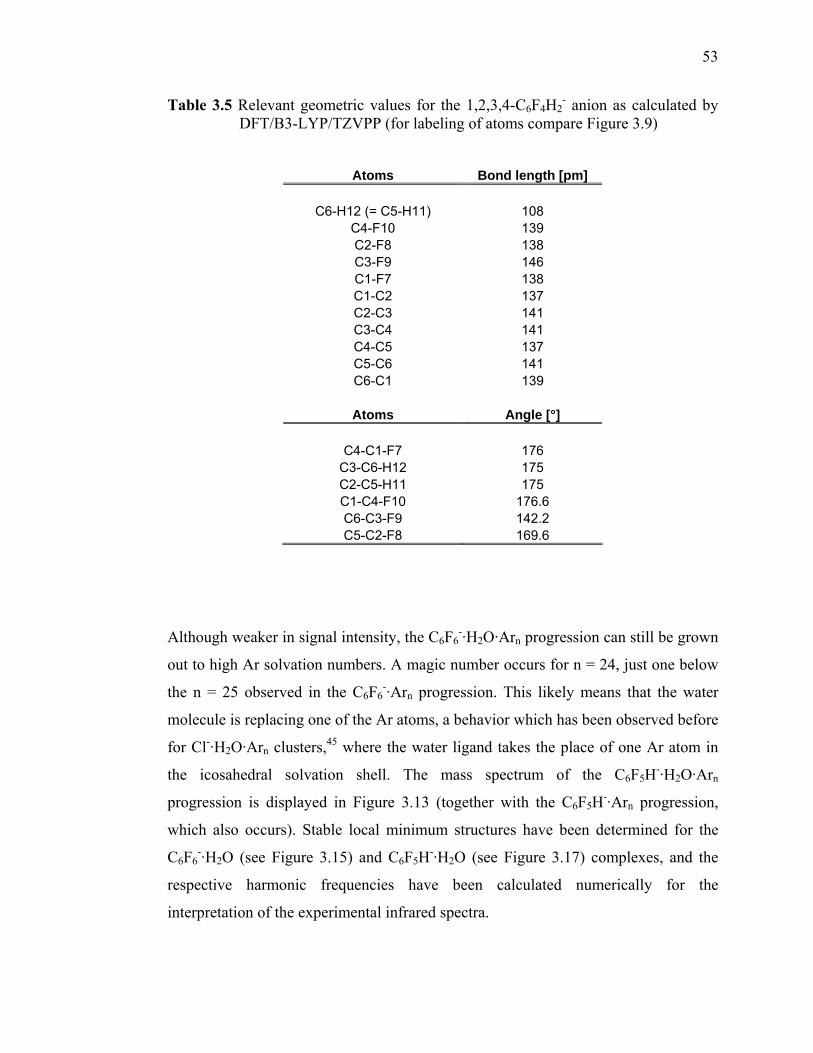
DFT/B3-LYP/TZVPP (for labeling of atoms compare Figure 3.9)....... 51 Table 3.5 Relevant geometric values for the 1,2,3,4-C6F4H2
- anion as calculated by DFT/B3-LYP/TZVPP (for labeling of atoms compare Figure 3.9)....... 53
Table 3.6 Experimental and calculated (DFT, B3-LYP, TZVPP, scaled for
anharmonicity) positions of the symmetric (νs) and antisymmetric (νas) OH stretching bands of the water molecule in the C6F6
-·H2O complex for the six lowest lying isomers; ∆νs / ∆νas – corresponding band widths; δν - splitting between these two bands; the numbers in the first row refer to the respective isomer as labeled in Figure 3.15 ................................. 60
Table 3.7 Experimental band positions (νs for the symmetric, νas for the
antisymmetric OH stretching band), widths (∆νs and ∆νas respectively) and splittings (δν) for the C6F6
-·H2O·Ar3, C6F5H-·H2O·Ar2 and 1,2,3,4-C6F4H2
-·H2O·Ar3 clusters........................................................... 62 Table 3.8 Experimental and calculated (DFT, B3-LYP, TZVP, scaled for
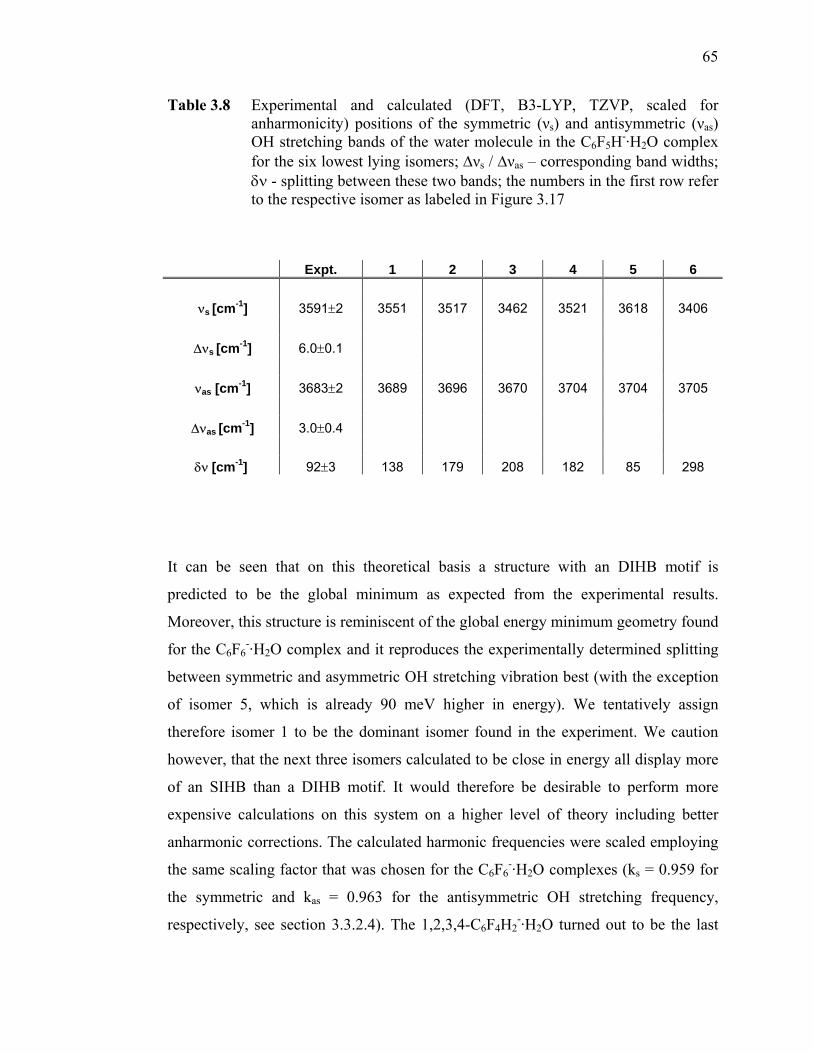
anharmonicity) positions of the symmetric (νs) and antisymmetric (νas) OH stretching bands of the water molecule in the C6F5H-·H2O complex for the six lowest lying isomers; ∆νs / ∆νas – corresponding band widths; δν - splitting between these two bands; the numbers in the first row refer to the respective isomer as labeled in Figure 3.17 ................................. 65
xii
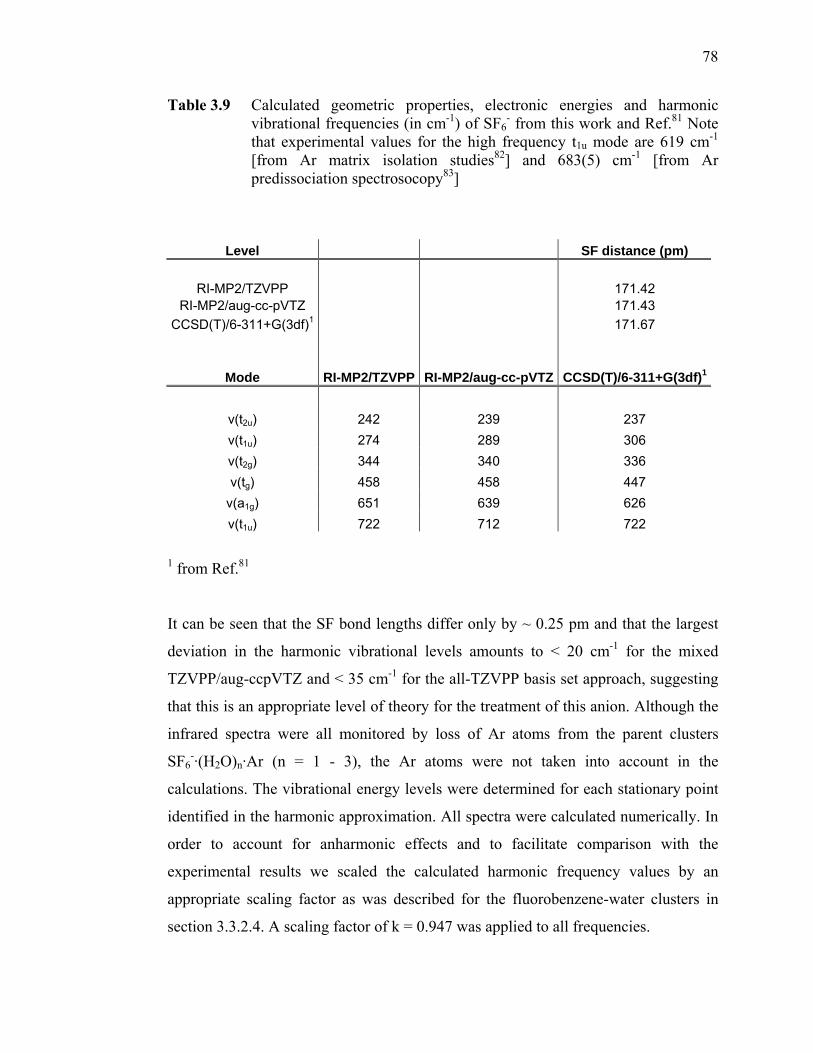
Table 3.9 Calculated geometric properties, electronic energies and harmonic vibrational frequencies (in cm-1) of SF6
- from this work and Ref.81. Note that experimental values for the high frequency t1u mode are 619 cm-1 [from Ar matrix isolation studies82] and 683(5) cm-1 [from Ar predissociation spectrosocopy83] ........................................................... 78
Table 3.10 Experimental and calculated (MP2, TZVP and aug-cc-pVTZ basis set,
respectively, scaled for anharmonicity) positions of the symmetric (νs) and antisymmetric (νas) OH stretching bands of the water molecule in the SF6
-·H2O complex for the two lowest lying isomers (SIHB ground state and DIHB transition state); the numbering of the isomers in the first row refers to the respective geometry as labeled in Figure 3.21................... 82
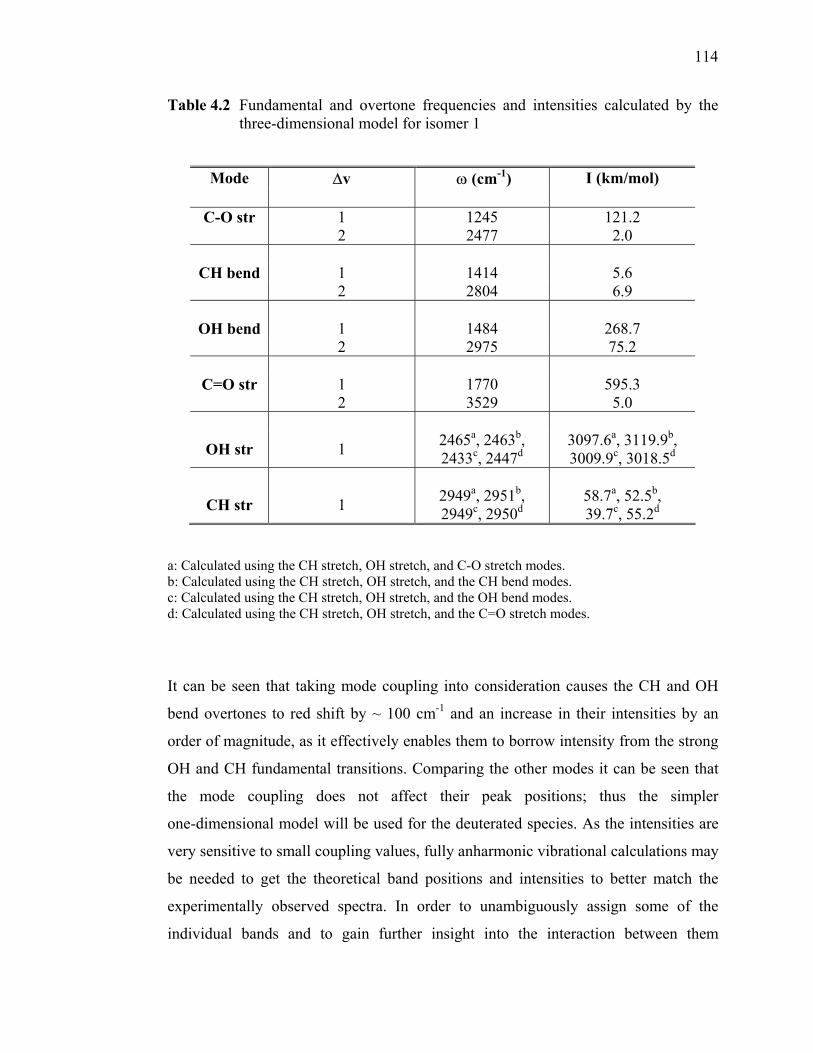
Table 4.1 Fundamental and overtone frequencies and intensities calculated by the
one-dimensional model (see section 4.2.2) for the two isomers of SF6
-·HCOOH........................................................................................ 113 Table 4.2 Fundamental and overtone frequencies and intensities calculated by the
three-dimensional model for isomer 1 ................................................. 114 Table 4.3 Fundamental and overtone frequencies and intensities calculated by the
one-dimensional model for SF6-·DCOOH and SF6
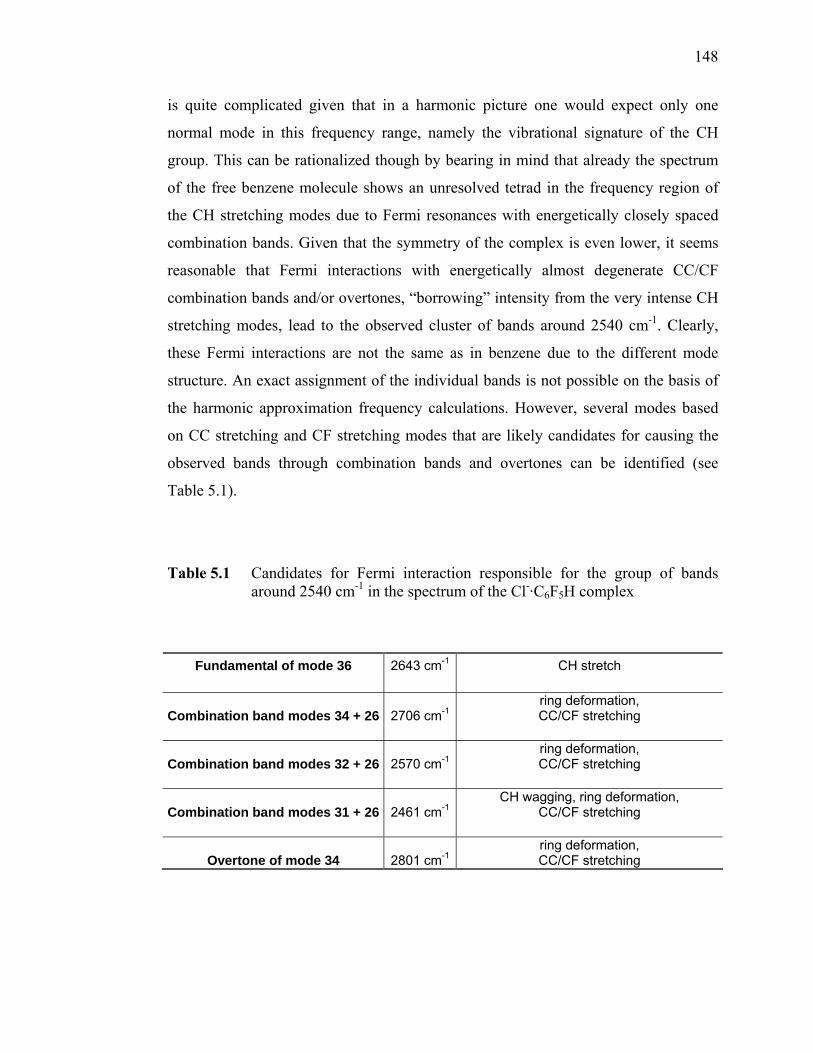
-·HCOOD.............. 115 Table 5.1 Candidates for Fermi interaction responsible for the group of bands
around 2540 cm-1 in the spectrum of the Cl-·C6F5H complex.............. 148
xiii
Figure 2.1 Schematic overview of the setup for the infrared photodissociation spectroscopy experiment (top view) ........................................................ 5
Figure 2.2 Schematic overview of the entrainment ion source3................................ 7 Figure 2.3 Schematic overview of the entrainment source modified for the
generation of metal-ion molecule complexes6 ......................................... 9 Figure 2.4 Schematic overview of the IR-OPO/OPA ............................................. 13 Figure 2.5 Schematic representation of the photodissociation process after
vibrational excitation of the chromophore (represented here by the evaporation of the Ar atoms from the C6F6
-·H2O·Ar3 parent)................ 16 Figure 3.1 Typical binding motifs found for anions in a complex with a water
molecule; A – SIHB motif (single ionic hydrogen bond); B – DIHB motif (double ionic hydrogen bond) ...................................................... 23
Figure 3.2 Ar predissociation spectra as taken from Ref.9; (a) F-·H2O·Ar2,
(b) Cl-·H2O·Ar11, (c) Br-·H2O·Ar3 and I-·H2O·Ar3; Free – OH not involved in a hydrogen bond, IHB – ionic H bond, B – overtone of the water intramolecular bending mode, IM – combination band involving the ion-water intermolecular stretching vibration.................................. 24
Figure 3.3 Spectra of X-·(H2O)2 clusters as taken from Ref.9; (a) F-·(H2O)2·Ar3
(structure shown in inset) (b) Cl-·(H2O)2·Ar3 (c) Br-·(H2O)2·Ar3 (d) I-·(H2O)2·Ar3 (structure of species (b) – (d) depicted in inset); arrow: position of H bonded OH stretch in the neutral water dimer, F – position of free OH stretch; IHBAD – Ionic H bond of a water molecule acting as a hydrogen bond donor to the ion and acceptor to the neighboring water; IHBDD – Ionic H bond of a water molecule acting as a hydrogen bond donor to both the ion and the neighboring water; IW – Signature of the OH stretch involved in the hydrogen bond between the two water molecules ............................................................................................... 27
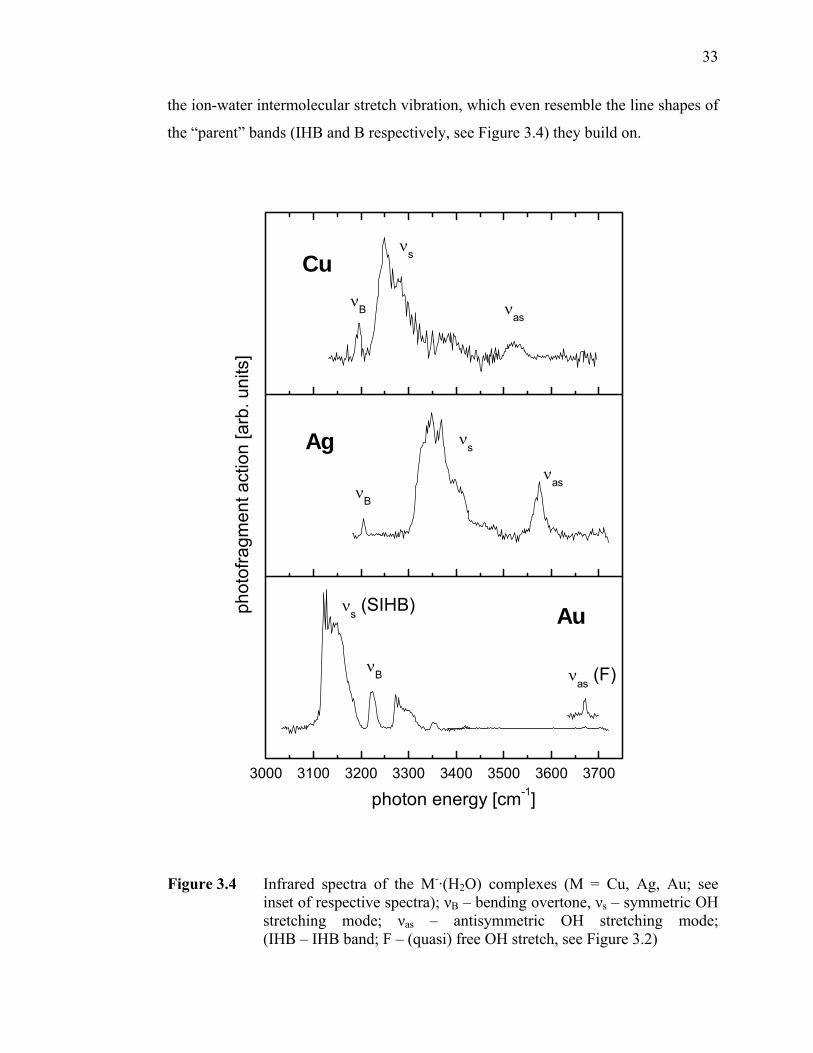
Figure 3.4 Infrared spectra of the M-·(H2O) complexes (M = Cu, Ag, Au; see inset
Figure 3.5 IHB band positions for the known anion-water complexes as a function
of the proton affinities of the ions (from Refs.11,43); open squares – known SIHB complexes; open triangles – known DIHB complexes; full squares – coinage metal-water complexes; in the case of (suspected) DIHB configurations the lower energy (i.e. symmetric stretch) IHB band is listed ................................................................................................... 35
Figure 3.6 Calculated potential energy curves (CCSD(T) without zero-point
corrections) from Ref.42 for the M-·H2O complexes (M = Au, Ag, Cu, see inset) along the M-H-O angle .......................................................... 37
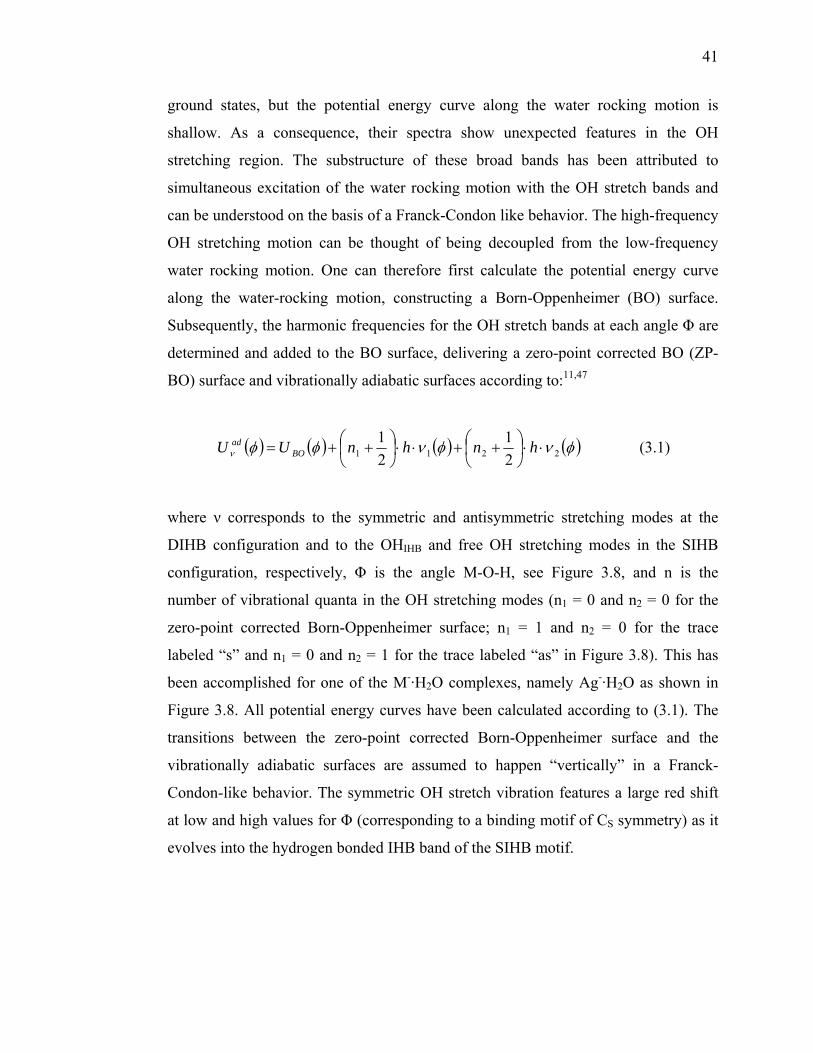
Figure 3.7 IR spectra of the M-·H2O·Arn complexes (M = Au, Ag, Cu; n = 1,2).... 40 Figure 3.8 Calculated OH Born-Oppenheimer surface and OH stretching
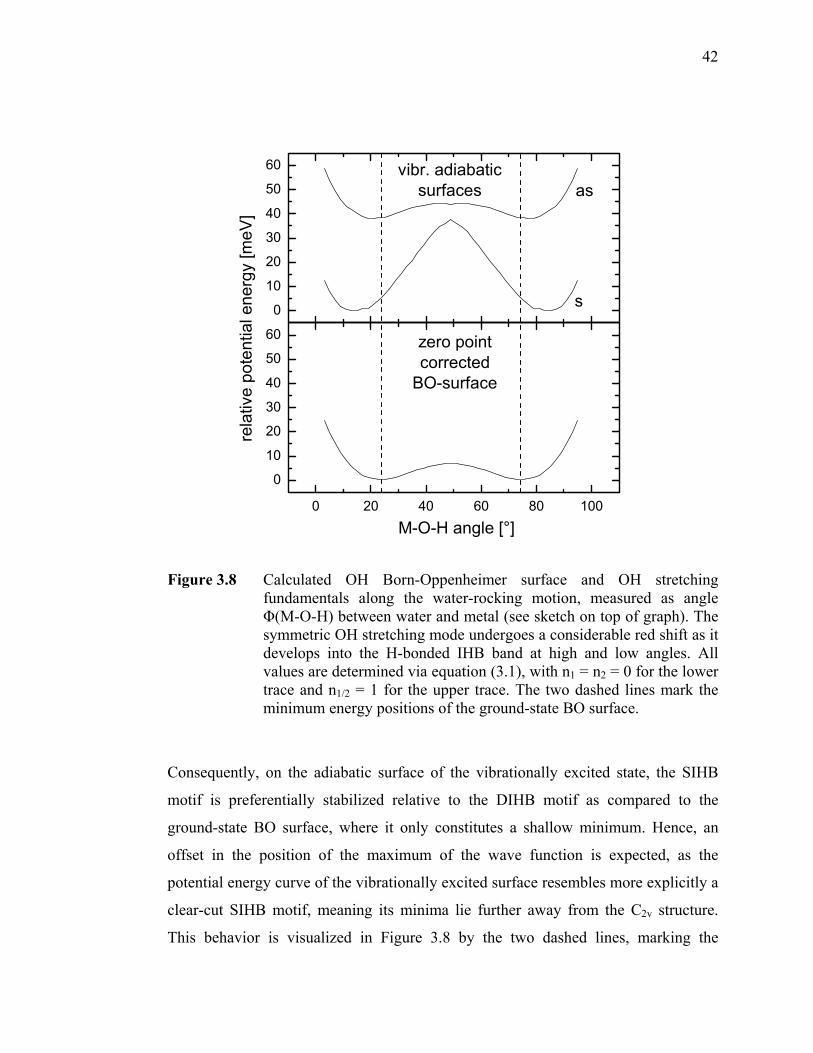
fundamentals along the water-rocking motion, measured as angle Φ(M-O-H) between water and metal (see sketch on top of graph). The symmetric OH stretching mode undergoes a considerable red shift as it develops into the H-bonded IHB band at high and low angles. All values are determined via equation (3.1), with n1 = n2 = 0 for the lower trace and n1/2 = 1 for the upper trace. The two dashed lines mark the minimum energy positions of the ground-state BO surface. .................................. 42
Figure 3.9 Calculated structures (B3-LYP/TZVPP) of (A) C6F6
- (B) C6F5H- (C) 1,2,3,4-C6F4H2
- ................................................................................ 47 Figure 3.10 Schematic representation of the Jahn-Teller effect and orbital
stabilization upon geometric distortion (taken from Ref.59) .................. 48 Figure 3.11 Mass spectrum showing the C6F6
-·Arn anion progression (n is shown in intervals of five, as indicated in the Figure)…………………………...49
Figure 3.12 Mass spectra of the Ar progressions of C6F6
-·H2O·Arn and C6F6-·Arn,
produced by entrainment of small amounts of C6F6 and H2O vapor into an expansion of neat Ar ......................................................................... 54
xv
Figure 3.13 Mass Spectrum of C6F5H-·H2O·Arn and C6F5H-·Arn progressions, produced by entrainment of small amounts of C6F5H and H2O vapor into an expansion of neat Ar ......................................................................... 55
Figure 3.14 Infrared spectrum of C6F6
-·H2O·Ar3 (recorded via registering loss of all three Ar atoms); νs – symmetric OH stretching mode of the water ligand; νas – antisymmetric OH stretching mode of the water ligand ................ 57
Figure 3.15 Calculated structures (DFT/B3-LYP/TZVPP) of the six isomers within
100 meV above the global energy minimum (isomer 1) ....................... 59 Figure 3.16 Infrared spectra of C6F6
-·H2O·Ar3 (top), C6F5H-·H2O·Ar2 (center) and 1,2,3,4-C6F4H2
-·H2O·Ar3 (bottom) measured via the loss of all Ar atoms both over the entire covered spectral range (left column) and zoomed in around the symmetric (νs) and antisymmetric (νas) OH stretching vibration (right column)......................................................................... 61
Figure 3.17 Calculated structures (DFT/B3-LYP/TZVPP) of the six isomers within
100 meV above the global energy minimum (isomer 1) ....................... 64 Figure 3.18 Electron autodetachment (AD) and vibrational predissociation (VP)
spectra of the C6F5H-·Arn (n = 0 - 3) anions. (The VP spectra are recorded via loss of the attached argon atoms). The lowest spectrum is a simulation using the scaled calculated harmonic value for the CH stretching vibration of the bare pentafluorobenzene anion using a Gaussian fit with 6 cm-1 half width........................................................ 67
Figure 3.19 Infrared Spectra of C6F6
-·(H2O)2·Ar2 (top trace) and C6F5H-·(H2O)2·Ar2 (bottom trace) measured by monitoring loss of the two Ar atoms upon irradiation............................................................................................... 71
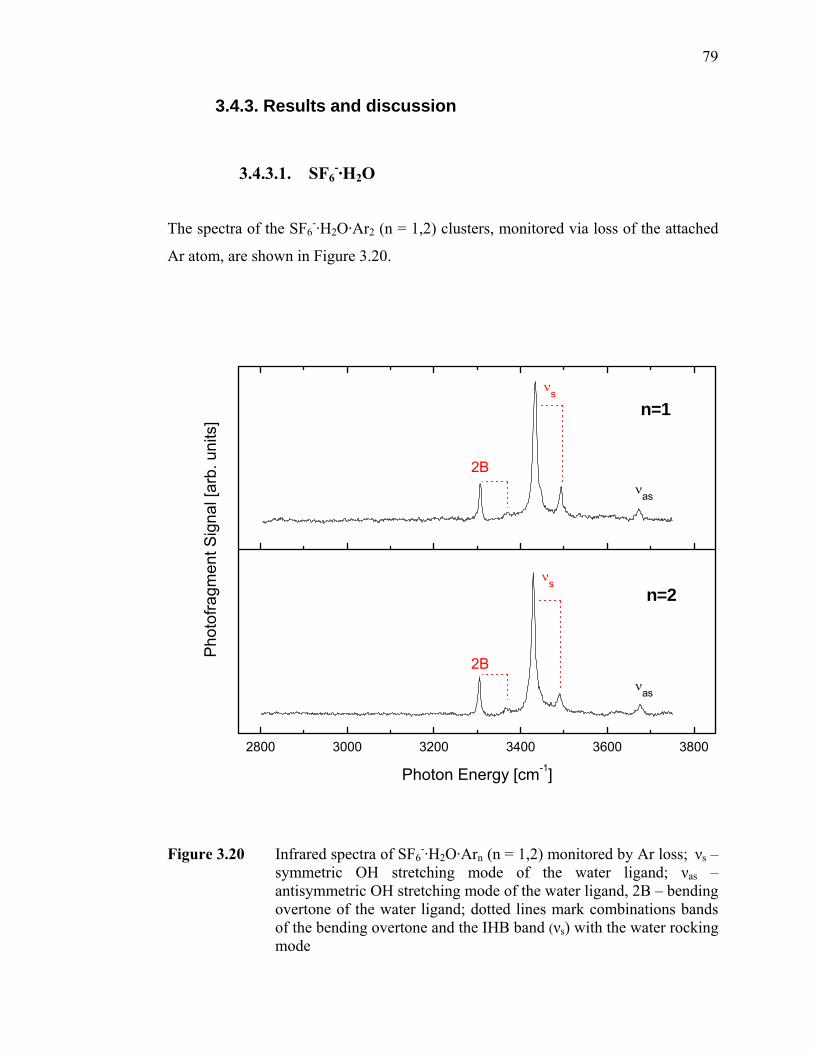
Figure 3.20 Infrared spectra of SF6
-·H2O·Arn (n = 1,2) monitored by Ar loss; νs – symmetric OH stretching mode of the water ligand; νas – antisymmetric OH stretching mode of the water ligand, 2B – bending overtone of the water ligand; dotted lines mark combinations bands of the bending overtone and the IHB band (νs) with the water rocking mode............... 79
xvi
Figure 3.21 Structures of the three isomers lowest in energy of the SF6-·H2O
complex. Dotted lines indicate hydrogen bonds. Relative energies are based on MP2 calculations (zero-point corrected) with a TZVPP basis set for all atoms. ..................................................................................... 81
Figure 3.22 Experimental spectrum of the SF6
-·H2O (monitored by the loss of one Ar atom, see top trace) as compared to the simulated spectra (MP2/TZVPP, scaled for anharmonicity, see text) of isomer (a) and isomer (b), Figure 3.21. Simulations assume a Gaussian peak shape and a FWHM of 6 cm-1) .................................................................................................... 83
Figure 3.23 Infrared spectra of SF6
-·(H2O)n·Ar (n = 1,2) monitored by Ar loss; νs – symmetric OH stretching mode of the water ligand; νas – antisymmetric OH stretching mode of the water ligand, 2B – bending overtone of the water ligand; dotted lines mark combinations bands of the bending overtone and the IHB band (νs) with the water rocking mode............... 85
Figure 3.24 Structures of the isomers lowest in energy of the SF6
-·(H2O)2 complex. Dotted lines indicate hydrogen bonds. Relative energies are based on MP2 calculations with a TZVPP basis set for all atoms. Geometries (d) and (e) are saddle points along several coordinates............................... 87
Figure 3.25 Experimental spectrum of the SF6
-·(H2O)2 complex (monitored by the loss of one Ar atom, see top trace) as compared to the simulated spectra (MP2/TZVPP, scaled for anharmonicity, see text) of isomer (a), (b) and (c), Figure 3.24. (Simulations assume a Gaussian peak shape and a FWHM of 6 cm-1) .................................................................................. 88
Figure 3.26 Infrared spectra of SF6
-·(H2O)n·Ar (n = 1 - 3) monitored by Ar loss; νs – symmetric OH stretching mode of the water ligand; νas – antisymmetric OH stretching mode of the water ligand, 2B – bending overtone of the water ligand; dotted lines mark combinations bands of the bending overtone and the IHB band (νs) with the water rocking mode ................................................................................................................ 90
Figure 3.27 Structures of the isomers lowest in energy of the SF6
-·(H2O)3 complex. Dotted lines indicate hydrogen bonds. Relative energies are based on MP2 calculations with a TZVPP basis set for all atoms. ....................... 91
xvii
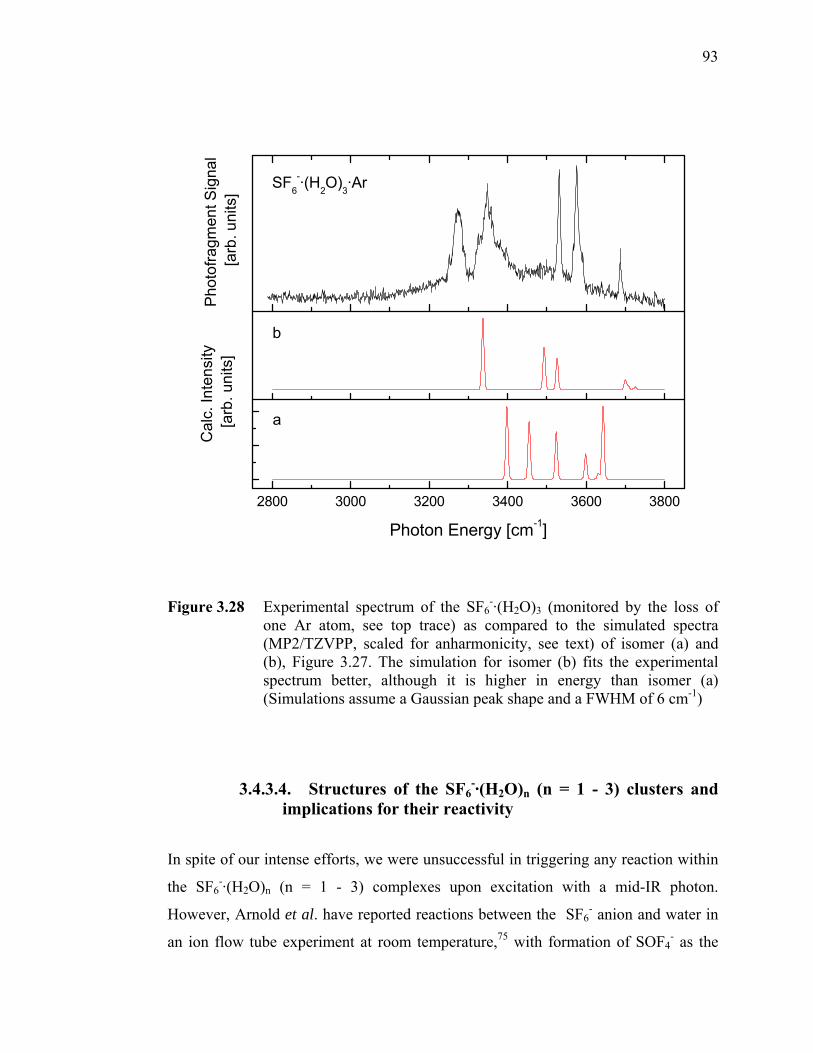
Figure 3.28 Experimental spectrum of the SF6-·(H2O)3 (monitored by the loss of one
Ar atom, see top trace) as compared to the simulated spectra (MP2/TZVPP, scaled for anharmonicity, see text) of isomer (a) and (b), Figure 3.27. The simulation for isomer (b) fits the experimental spectrum better, although it is higher in energy than isomer (a) (Simulations assume a Gaussian peak shape and a FWHM of 6 cm-1) . 93
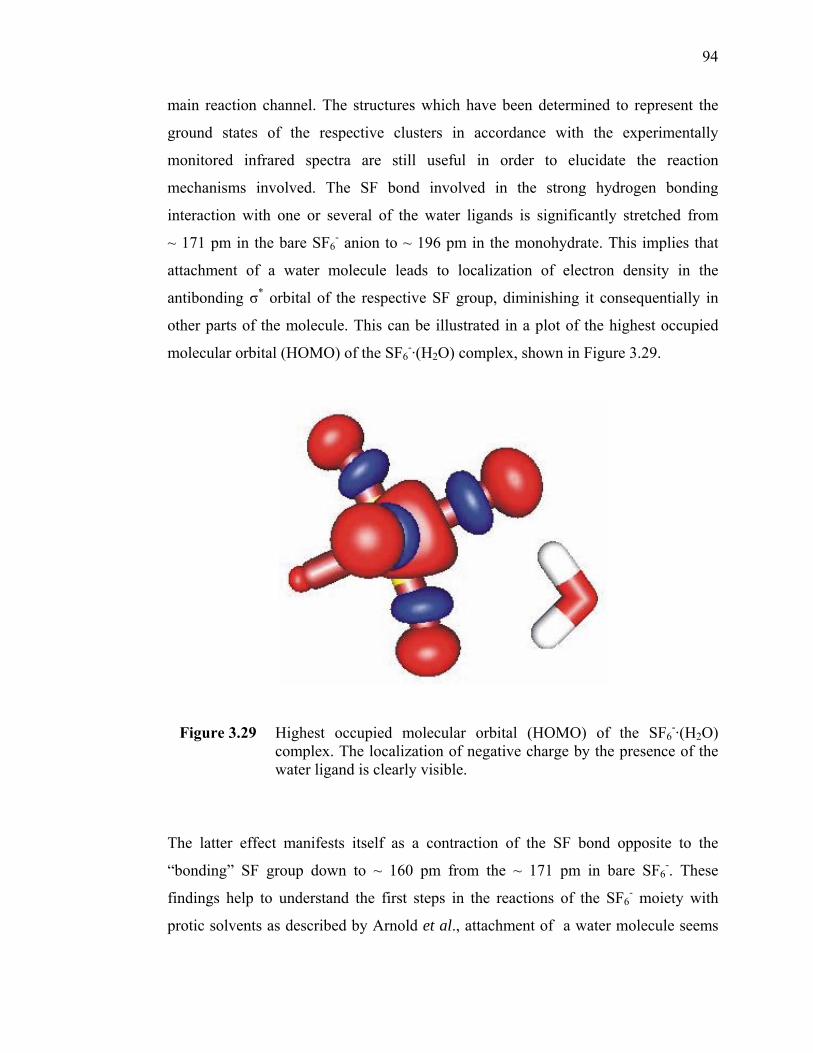
Figure 3.29 Highest occupied molecular orbital (HOMO) of the SF6
-·(H2O) complex. The localization of negative charge by the presence of the water ligand is clearly visible. ........................................................................................ 94
Figure 4.1 One-dimensional potential energy profile for a nucleophilic substitution
(SN2) both in the gas phase and in solution (from Ref.8) ..................... 107 Figure 4.2 Structures of the two lowest lying isomers of SF6
-·HCOOH, isomer 1 is the global minimum ............................................................................. 110
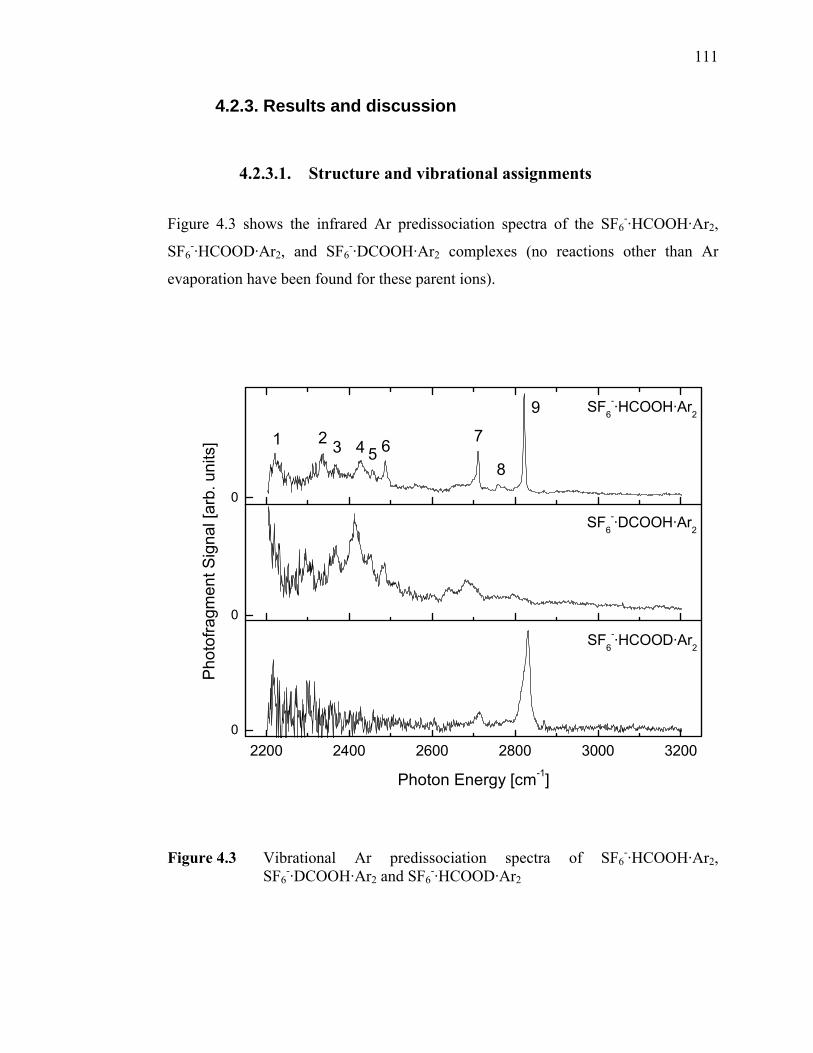
Figure 4.3 Vibrational Ar predissociation spectra of SF6
-·HCOOH·Ar2, SF6
-·DCOOH·Ar2 and SF6-·HCOOD·Ar2............................................. 111
Figure 4.4 Spectrum of SF6
-·HCOOH complex recorded via registering the product ions of all possible fragmentation channels: SF4
recorded via registering the product ions of the fragmentation channel leading to the SF4
- product ion and of the SF6-·HCOOH·Ar2 complex via
registering the loss of two Ar atoms .................................................... 119 Figure 4.6 Adiabatic potential energy curve along the intrinsic reaction coordinate
(calculated at the DFT level of theory) ................................................ 121 Figure 4.7 Evolution of relevant bond lengths along the reaction coordinate, see
Figure 4.6 for the labeling of the atoms............................................... 121
xviii
Figure 5.1 Illustration of the electrostatic potential around C6H6 (left) and C6F6
(right) (calculated with Gaussian03W, HF/3-21G* level17). The color coding from blue to red represents positive to negative electrostatic potentials. ............................................................................................. 130
Figure 5.2 Schematic representations of the quadrupole moments of benzene (left)
and hexafluorobenzene (right) and their suggested interaction motifs with an anionic moiety......................................................................... 130
Figure 5.3 Illustration of possible binding motifs for the interaction of anions with
electron-deficient arenes on the example of MP2/aug-cc-pVDZ optimized geometries for Cl- complexes with tetracyanobenzene (from Ref.28)................................................................................................... 133
Figure 5.4 Ar predissociation spectra for Cl-·C6H6·Ar (top trace) and Cl-·C6H6·Ar3
(bottom trace)....................................................................................... 139 Figure 5.5 Benzene CH stretching tetrad (according to Ref.54,56) ......................... 140 Figure 5.6 Calculated minimum energy structures for the chloride-benzene complex
........................................................................................................... 141 Figure 5.7 Ar predissociation spectra for all isomers at all fluorination levels (each
row corresponds to a certain number of fluorine atoms (marked as green in the sketches of the ligand structures) in the ligand, starting with benzene on top) of Cl-·C6FnH6-n·Arm clusters. Horizontal axis: photon energy in cm-1; Vertical axis: photofragment yield in arbitrary units. The arrows indicate the calculated scaled harmonic frequencies of the most intense CH stretching bands................................................................. 144
Figure 5.8 Ar predissociation spectra for all isomers at all fluorination levels
(complexes with equal number of fluorine atoms in the ligand are marked by the same color) of Cl-·C6FnH6-n·Arm clusters (monitored by the loss of the Ar messenger atoms) .................................................... 144
Figure 5.9 Ar predissociation spectra for Cl-·C6H6·Ar (top trace) and Cl-·C6F5H·Ar
Figure 5.10 Calculated structure for the Cl-·C6F5H complex (DFT/B3-LYP/TZVP) via ring bonding ................................................................................... 149
Figure 5.11 Calculated potential energy surface along the CH stretching coordinate
in [C6F5···H···Cl]- (MP2/TZVP). The squares are single-point energies at various C-H distances, with fixed C-Cl distance, whereas the rest of the coordinates were relaxed but constrained to C2v symmetry................. 151
Figure 5.12 Centroid frequency as a function of the number of fluorine atoms. Open
squares denote complexes with bifurcated hydrogen bonds, while data corresponding to hydrogen bonds involving isolated CH groups are shown as full squares. .......................................................................... 152
Figure 5.13 Infrared predissociation spectra of X-·C6F5H·Ar3 with X = SF6 (top
trace) and I (bottom trace).................................................................... 153
1
1. Motivation
The mutual interaction between ions and their chemical environment plays a crucial
role in chemistry. A detailed understanding of these interactions at a molecular level
is therefore important in many areas, ranging from processes in biological systems
and organisms to chemical reaction mechanisms, in which anions frequently occur as
important reactive intermediates. However, investigations of the intrinsic properties
governing the interactions between ions and their surroundings are difficult to
perform in liquid phase, due to many-body forces, fluctuations in their solvent shell
and solvent molecules further away from the ion. A convenient approach to
circumvent these problems inherent to experiments in solution is to perform
experiments on the systems of interest in the gas phase, where ionic species can be
easily mass selected, making sure that only one particular system is probed each time.
Moreover, ion-molecule complexes can be studied without the influence of other
chemical environments, allowing access to their intrinsic interaction features. At the
same time, the number of ligand molecules around the respective ion can be varied
one at a time, making investigations of the structure of solvation shells and the
influence of the solvent shell size on the interaction properties experimentally
amenable. For very large clusters, one might eventually be able to extrapolate to the
bulk limit, with the cluster sizes necessary for a good approximation depending on the
property under consideration.1 A variety of different techniques has been developed
or modified to study ion-molecule complexes and clusters in the gas phase, such as
mass spectrometry and reactivity studies,1-4 ion mobility experiments,5 photoelectron
spectroscopy6 and photodissociation experiments,3,4,7,8 to name just a few. Infrared
predissociation spectroscopy3,7,9 has turned out to be very fruitful for the investigation
of the structural properties of ion-molecule complexes, especially if accompanied by
quantum chemical calculations to aid the interpretation of the vibrational spectra
obtained. The successful application of this method is based on the changes in the
bonding properties and the symmetries of the respective free ions and molecules upon
introducing interactions between them, as any deformations and perturbations will be
2
encoded in the vibrational spectrum of the complexes. Infrared spectroscopy therefore
provides a very sensitive tool for registering the geometries of the complexes under
consideration as compared to their uncomplexed constituents. The vibrational
signatures of the fundamental transitions of some important functional groups (such
as CH or OH groups) fall within the mid-infrared range of the spectrum, making a
wide range of complexes and clusters accessible to this experimental technique. As
will be explained in detail in chapter two, it is not possible to use conventional
infrared absorption spectroscopy in order to realize these experiments while working
with a molecular beam of mass selected ions in the gas phase. However,
photodissociation action spectroscopy turns out to be a convenient experimental
approach. Several studies that have been performed using this technique are presented
in this work. An investigation of the hydration behavior of atomic metal anions is
presented using the example of the coinage metal anions and put into context with
earlier studies on the hydration of small and medium sized anions. The dependence of
hydration structure motifs on the size and polarizability of the charge distribution
within the respective anionic charge carrier is investigated in complexes of C6FnH6-n-
(n = 4 – 6) and SF6- anions with water ligands. Having demonstrated the power of the
technique on studying the interaction of these anions with their chemical surroundings
and solvation shells, a study on the sulfur hexafluoride-formic acid complex is
discussed, showing that in some cases it is possible to trigger an intracluster reaction
upon excitation of the ion-molecule complex with an infrared photon. Finally a study
of chloride-fluorobenzene complexes is presented, shedding light on the interactions
of anions with electron-deficient aromatic molecules.
3
1.1. References for Chapter I
1 V. E. Bondybey and M. K. Beyer, International Reviews in Physical
Chemistry 21 (2), 277 (2002). 2 Gas Phase Ion Chemistry, edited by M. T. Bowers (Academic Press, New
York, 1979); M. P. Irion, International Journal of Mass Spectrometry and Ion Processes 121 (1-2), 1 (1992); A. G. Marshall and L. Schweikhard, International Journal of Mass Spectrometry and Ion Processes 118, 37 (1992); P. B. Armentrout and T. Baer, J. Phys. Chem. 100 (31), 12866 (1996); M. T. Bowers, A. G. Marshall, and F. W. McLafferty, J. Phys. Chem. 100 (31), 12897 (1996); D. C. Parent and S. L. Anderson, Chemical Reviews 92 (7), 1541 (1992); P. B. Armentrout, International Journal of Mass Spectrometry 200 (1-3), 219 (2000); J. E. Braun, T. Mehnert, and H. J. Neusser, International Journal of Mass Spectrometry 203 (1-3), 1 (2000); B. S. Freiser, Journal of Mass Spectrometry 31 (7), 703 (1996); A. A. Viggiano, S. T. Arnold, and R. A. Morris, International Reviews in Physical Chemistry 17 (2), 147 (1998); P. B. Armentrout, Annual Review of Physical Chemistry 52, 423 (2001); G. Niedner-Schatteburg and V. E. Bondybey, Chemical Reviews 100 (11), 4059 (2000); M. T. Rodgers and P. B. Armentrout, Mass Spectrometry Reviews 19 (4), 215 (2000); M. K. Beyer, Mass Spectrometry Reviews 26 (4), 517 (2007); P. B. Armentrout, International Journal of Mass Spectrometry 227 (3), 289 (2003); D. K. Böhme and H. Schwarz, Angewandte Chemie-International Edition 44 (16), 2336 (2005); D. Schröder and H. Schwarz, in Modern Mass Spectrometry (2003), Vol. 225, pp. 133; H. Schwarz, Angewandte Chemie-International Edition 42 (37), 4442 (2003); H. Schwarz, International Journal of Mass Spectrometry 237 (1), 75 (2004).
3 B. Brutschy, Chemical Reviews 92 (7), 1567 (1992). 4 J. M. Farrar, International Reviews in Physical Chemistry 22 (4), 593 (2003). 5 D. E. Clemmer and M. F. Jarrold, Journal of Mass Spectrometry 32 (6), 577
(1997); A. A. Shvartsburg, R. R. Hudgins, P. Dugourd, and M. F. Jarrold, Chemical Society Reviews 30 (1), 26 (2001); T. Wyttenbach and M. T. Bowers, in Modern Mass Spectrometry (2003), Vol. 225, pp. 207; P. Weis, S. Gilb, P. Gerhardt, and M. M. Kappes, International Journal of Mass Spectrometry 216 (1), 59 (2002).
6 U. Boesl and W. J. Knott, Mass Spectrometry Reviews 17 (4), 275 (1998); A.
W. Castleman and K. H. Bowen, Journal of Physical Chemistry 100 (31), 12911 (1996); O. Cheshnovsky, S. H. Yang, C. L. Pettiette, M. J. Craycraft, and R. E. Smalley, Review of Scientific Instruments 58 (11), 2131 (1987); C. E. H. Dessent, J. Kim, and M. A. Johnson, Accounts of Chemical Research 31
4
(9), 527 (1998); G. Gantefor, G. S. IckingKonert, H. Handschuh, and W. Eberhardt, International Journal of Mass Spectrometry and Ion Processes 159, 81 (1996); K. Müller-Dethlefs, O. Dopfer, and T. G. Wright, Chemical Reviews 94 (7), 1845 (1994); R. E. Continetti, International Reviews in Physical Chemistry 17 (2), 227 (1998); C. E. H. Dessent, M. A. Johnson, I. Becker, and O. Cheshnovsky, in Electron Transfer-from Isolated Molecules to Biomolecules, Pt 1 (1999), Vol. 106, pp. 265; K. Müller-Dethlefs and E. W. Schlag, Angewandte Chemie-International Edition 37 (10), 1346 (1998); D. M. Neumark, Annual Review of Physical Chemistry 52, 255 (2001); J. H. Hendricks, H. L. de Clercq, C. B. Freidhoff, S. T. Arnold, J. G. Eaton, C. Fancher, S. A. Lyapustina, J. T. Snodgrass, and K. H. Bowen, Journal of Chemical Physics 116 (18), 7926 (2002); D. M. Neumark, Physical Chemistry Chemical Physics 7 (3), 433 (2005); A. Sanov and W. C. Lineberger, Physical Chemistry Chemical Physics 6 (9), 2018 (2004); A. Stolow, A. E. Bragg, and D. M. Neumark, Chemical Reviews 104 (4), 1719 (2004); X. B. Wang, X. Yang, and L. S. Wang, International Reviews in Physical Chemistry 21 (3), 473 (2002).
7 E. J. Bieske and O. Dopfer, Chemical Reviews 100 (11), 3963 (2000); E. J.
Bieske and J. P. Maier, Chemical Reviews 93 (8), 2603 (1993); O. Dopfer, International Reviews in Physical Chemistry 22 (3), 437 (2003); M. A. Duncan, International Reviews in Physical Chemistry 22 (2), 407 (2003); J. M. Lisy, International Reviews in Physical Chemistry 16 (3), 267 (1997).
8 O. Dopfer, Zeitschrift Fur Physikalische Chemie-International Journal of
Research in Physical Chemistry & Chemical Physics 219 (2), 125 (2005); M. A. Duncan, Annual Review of Physical Chemistry 48, 69 (1997); T. Ebata, A. Fujii, and N. Mikami, International Reviews in Physical Chemistry 17 (3), 331 (1998); A. Fujii, T. Sawamura, S. Tanabe, T. Ebata, and N. Mikami, Chemical Physics Letters 225 (1-3), 104 (1994).
9 S. Djafari, G. Lembach, H. D. Barth, and B. Brutschy, Zeitschrift Fur
Physikalische Chemie-International Journal of Research in Physical Chemistry & Chemical Physics 195, 253 (1996); R. C. Dunbar, International Journal of Mass Spectrometry 200 (1-3), 571 (2000); M. B. Knickelbein, Philosophical Magazine B-Physics of Condensed Matter Statistical Mechanics Electronic Optical and Magnetic Properties 79 (9), 1379 (1999); C. Riehn, K. Buchhold, B. Reimann, S. Djafari, H. D. Barth, B. Brutschy, P. Tarakeshwar, and K. S. Kim, Journal of Chemical Physics 112 (3), 1170 (2000); W. H. Robertson and M. A. Johnson, Annual Review of Physical Chemistry 54, 173 (2003); E. J. Bieske, Chemical Society Reviews 32 (4), 231 (2003).
5
2. Experiment
2.1. Overview A schematic overview of the photodissociation spectrometer used for the
investigation of the systems presented in this work is shown in Figure 2.1. It consists
of a supersonic entrainment ion source for the production of the anionic complexes of
interest, a reflectron-time-of-flight mass spectrometer (TOF-MS) and an infrared
optical parametric converter as a light source. These components are described in
detail in the following sections, together with the specific parameters employed for
running the experiments presented here.
Figure 2.1 Schematic overview of the setup for the infrared photodissociation spectroscopy experiment (top view)
6
2.2. Ion source
The anionic species of interest are generated employing an electron impact plasma
ion source in combination with a pulsed supersonic expansion (see Ref.1 and
references therein). A neutral plasma is generated by impact of electrons with
energies at 800 eV (emitted from a heated thoriated tungsten wire, 0.005’’, 1% ThO,
in the electron gun) into the high density region of a supersonic expansion. There,
anions can be formed via attachment of slow secondary electrons (which mostly stem
from ionization of argon atoms by the highly energetic electrons generated via the
electron gun) to molecular precursor molecules XY. This results in the formation of
temporary negative ions according to reactions of the type:
XY + e- → [XY-]* (2.1)
The transient negative ions formed this way can then either autodetach the electron or
be stabilized in collisions or by dissociation, forming stable anions in one of the
following ways:
[XY-]* → X- + Y (2.2) dissociative attachment
[XY-]* + M → XY- + M + EKin (2.3) collisional stabilization
The ion-molecule cluster ions which are to be investigated can be created in
association reactions with the respective ligand:
[XY-] + n·L → XY-·Lm + (n – m)·L (2.4)
It can be very difficult, however, to find the optimal conditions for the generation of
the desired species, if a premix of suitable gases is co-expanded. In addition, although
some cooling is provided by the expansion of the mixture from moderate backing
pressures (between ~ 3 - 14 bar, depending on the system) into high vacuum (typical
operating pressures of the source chamber range between the low 10-6 to mid
7
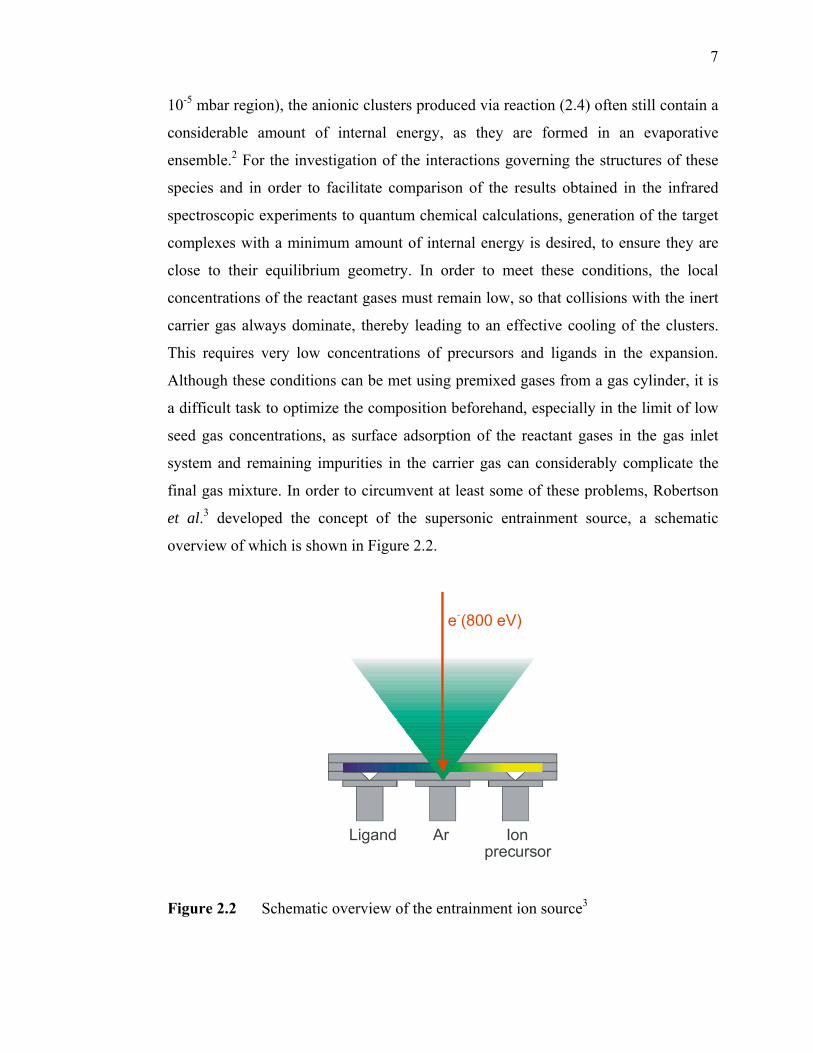
10-5 mbar region), the anionic clusters produced via reaction (2.4) often still contain a
considerable amount of internal energy, as they are formed in an evaporative
ensemble.2 For the investigation of the interactions governing the structures of these
species and in order to facilitate comparison of the results obtained in the infrared
spectroscopic experiments to quantum chemical calculations, generation of the target
complexes with a minimum amount of internal energy is desired, to ensure they are
close to their equilibrium geometry. In order to meet these conditions, the local
concentrations of the reactant gases must remain low, so that collisions with the inert
carrier gas always dominate, thereby leading to an effective cooling of the clusters.
This requires very low concentrations of precursors and ligands in the expansion.
Although these conditions can be met using premixed gases from a gas cylinder, it is
a difficult task to optimize the composition beforehand, especially in the limit of low
seed gas concentrations, as surface adsorption of the reactant gases in the gas inlet
system and remaining impurities in the carrier gas can considerably complicate the
final gas mixture. In order to circumvent at least some of these problems, Robertson
et al.3 developed the concept of the supersonic entrainment source, a schematic
overview of which is shown in Figure 2.2.
Ar Ion precursor
e (800 eV)-
Ligand
Figure 2.2 Schematic overview of the entrainment ion source3
8
The working principle of this source is based on a hydrodynamic process first
described by Campargue.4 The entrainment of molecules into the flow of an
expansion is most efficient for molecules in the vicinity of the nozzle orifice, where
they penetrate through the border of the expansion cone and mix with the expanding
carrier gas. Moreover, the plasma region of the molecular beam can be found in the
same volume, and negative ions are formed at this point by attachment of slow
secondary electrons. One of the great advantages of this source in comparison to the
co-expansion of premixed gases is that it allows for in situ optimization of the
composition of the gas mixture, so that among all of the ions formed in the expansion
the anionic complex of interest can be optimized for maximum intensity. This is
achieved by controlling the valves independently (both with respect to start time and
gas pulse duration), providing great flexibility in the relative timing and composition
of the expanding gas cloud and therefore eventually of the species generated. Pulsed
valves of the General Valve Series 9 (1 mm orifice) are used for the introduction of
the ligand molecules into the reactor. An expansion of neat Ar (99.9999% purity) is
generated by an Even-Lavie-Valve, allowing for very short opening times (typically
25 µs) and high backing pressures (up to 100 bar, typically operated at 14 bar in this
experiment), which in turn allows operating the source chamber at relatively low
background pressures. In addition, cold, Ar solvated complexes X-·Ln·Arm can be
generated via sequential ligand exchange reactions:
XY-·Arp + L → XY-·L·Arm + (p – m)·Ar (2.5)
The source chamber is pumped by a 2000 L/s diffusion pump (BOC Edwards
Diffstak) and a 1000 L/s turbomolecular pump (Turbovac 1000C, Leybold). The
experiment is operated at 20 Hz repetition rate, which results in pressures in the
source chamber between several 10-6 to several 10-5 mbar during operation. Within
the source chamber, the molecular beam expands freely between the repeller and
extractor plate of a home-built Wiley-McLaren5 TOF-MS, where the anions are
accelerated to kinetic energies of approximately 3.5 keV into a differential pumping
stage pumped by a 520 L/s turbomolecular pump (Pfeiffer TMU 521 YP) to operating
9
pressures of several 10-8 mbar. The ion source described so far has been designed for
the generation and optimization of ionic molecular clusters, relying on substances
with sufficiently high vapor pressures. For the production of clusters containing metal
anions a modification has been developed in our group to allow for the production of
such species as well.6 In order to achieve this, one of the entraining valves is replaced
by a rotating steel plate, on which a wire consisting of the target metal is mounted. By
focusing an intense laser beam (generated by a Nd:YAG laser, Innolas Spitlight 300,
typically operated at 50 mJ per pulse / 1064 nm) onto the rim of the rotating wire, the
metal is vaporized and subsequently entrained into the main Ar expansion. The rest of
the settings and parameters remains similar as has been described for the metal-free
targets. A schematic representation of the entrainment ion source modified for the
generation of metal ion-molecule complexes is shown in Figure 2.3.
ArLigand
e (800 eV)-
Rotating target holder
Vaporizationlaser
Focusing lens
Figure 2.3 Schematic overview of the entrainment source modified for the generation of metal-ion molecule complexes6
10
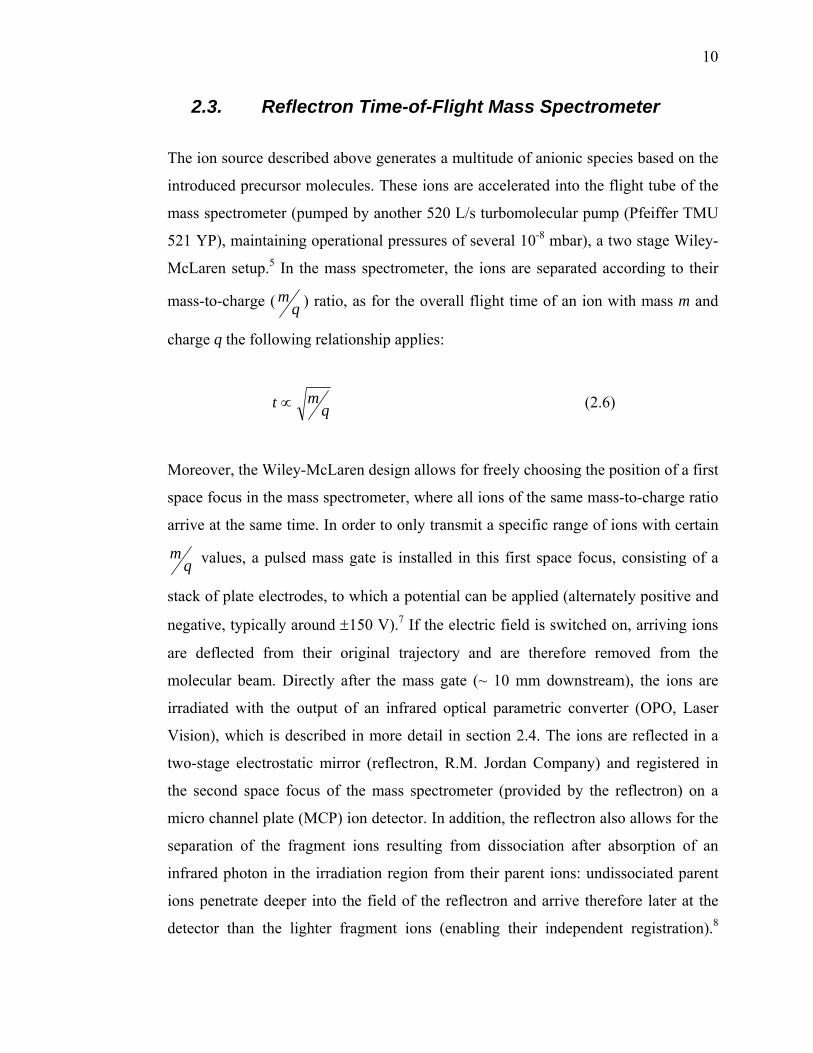
2.3. Reflectron Time-of-Flight Mass Spectrometer
The ion source described above generates a multitude of anionic species based on the
introduced precursor molecules. These ions are accelerated into the flight tube of the
mass spectrometer (pumped by another 520 L/s turbomolecular pump (Pfeiffer TMU
521 YP), maintaining operational pressures of several 10-8 mbar), a two stage Wiley-
McLaren setup.5 In the mass spectrometer, the ions are separated according to their
mass-to-charge ( qm ) ratio, as for the overall flight time of an ion with mass m and
charge q the following relationship applies:
qmt ∝ (2.6)
Moreover, the Wiley-McLaren design allows for freely choosing the position of a first
space focus in the mass spectrometer, where all ions of the same mass-to-charge ratio
arrive at the same time. In order to only transmit a specific range of ions with certain
qm values, a pulsed mass gate is installed in this first space focus, consisting of a
stack of plate electrodes, to which a potential can be applied (alternately positive and
negative, typically around ±150 V).7 If the electric field is switched on, arriving ions
are deflected from their original trajectory and are therefore removed from the
molecular beam. Directly after the mass gate (~ 10 mm downstream), the ions are
irradiated with the output of an infrared optical parametric converter (OPO, Laser
Vision), which is described in more detail in section 2.4. The ions are reflected in a
two-stage electrostatic mirror (reflectron, R.M. Jordan Company) and registered in
the second space focus of the mass spectrometer (provided by the reflectron) on a
micro channel plate (MCP) ion detector. In addition, the reflectron also allows for the
separation of the fragment ions resulting from dissociation after absorption of an
infrared photon in the irradiation region from their parent ions: undissociated parent
ions penetrate deeper into the field of the reflectron and arrive therefore later at the
detector than the lighter fragment ions (enabling their independent registration).8
11
Employing a reflectron also helps to extend the flight path of the ions considerably
and therefore to increase the resolution of the mass spectrometer, which is defined as
tt
mmR
∆=
∆=
2 (2.7)
and in the present mode of operation typically reaches values around R ~ 800. In
principle, there are two different strategies for measuring the desired
photodissociation spectra. One possibility is to measure the depletion of the parent ion
signal upon irradiation with the infrared light. Analogously to Lambert-Beer’s law,
the parent ion intensity is measured with (NP) and without (NP,0) the laser beam, with
the ratio of these two values being related to the cross section in the following way
σ(ν):9
{ })()(exp1)(
0,
ννσααν F
NN
P
P ⋅−⋅+−= (2.8)
where F(ν) is the number of photons per area integrated over the laser pulse, and α the
imperfect overlap of the ion packets and the laser beam (0 < α < 1), which can be
determined by measuring the depletion of the ion beam as a function of the laser
intensity. However, measuring the depletion of the parent ion signal in the described
way works well only if an appreciable part of the ion beam (at least ~ 10%) is
depleted upon irradiation with light.10 However, typical infrared photodissociation
experiments result in a depletion of the parent ion signal on the order of 0.1 – 1%,
preventing this approach from being a convenient route for obtaining the desired
results. These problems can be circumvented by measurement of the photofragment
action. In this case, not the depletion of the parent ions, but the intensity of fragment
ions produced (NF) following irradiation is monitored as a function of the infrared
frequency ν. In the limit of small depletion (which for infrared predissociation
experiments can be assumed to hold), the following relation between cross section,
fragment ion yield and laser intensity applies:
12
νννσν )()()( IN F
⋅∝ (2.9)
The main drawback of this approach is that absolute cross sections are usually not
obtainable. However, most of the structural information is encoded in the relative
cross sections. In most of the experiments presented in this work, Ar solvated
complexes have been investigated, which decay on a time scale short compared to the
flight time of the parent ion through the mass spectrometer and therefore with near-
unit efficiency.
2.4. Laser system
The infrared light used to irradiate the complexes in the mass spectrometer is
provided by an optical parametric oscillator (OPO) and optical parametric amplifier
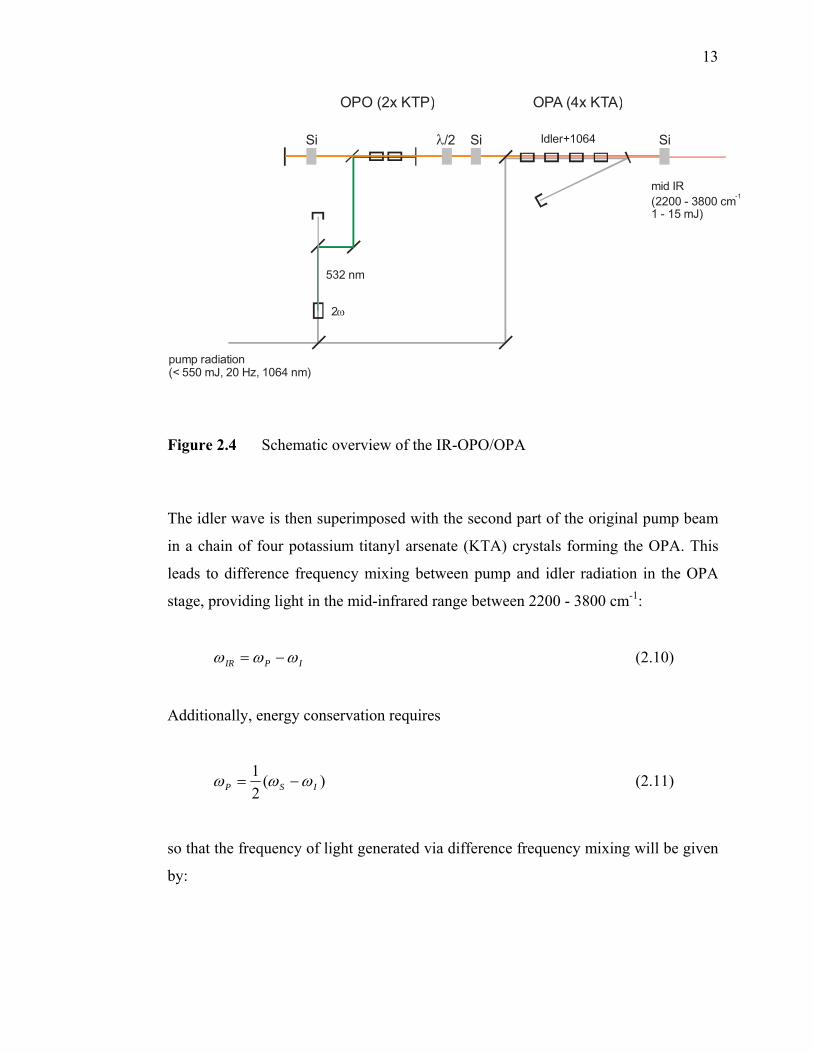
(OPA), shown in Figure 2.4. The setup is pumped with the output of a Nd:YAG laser
~ 7 ns). The pump radiation of frequency ωP (fundamental of the Nd:YAG laser,
λP = 1064 nm) is split in two parts with the relative ratio 1:2. The weaker beam is
used to pump the OPO (consisting of two potassium titanyl phosphate (KTP) crystals)
after being frequency-doubled in a KTP crystal. This results in the generation of a
signal wave in the range between 710 - 885 nm and an idler wave in the range
between 1330 - 2120 nm. After a double pass through the OPO crystals, both the
signal wave and the remaining pump radiation are filtered out of the OPO resonator
by a Si filter. The OPO cavity is resonant for the idler wave.
13
2ω
OPO (2x KTP) OPA (4x KTA)
pump radiation(< 550 mJ, 20 Hz, 1064 nm)
532 nm
Idler+1064
mid IR(2200 - 3800 cm-1
1 - 15 mJ)
Si Si Siλ/2
Figure 2.4 Schematic overview of the IR-OPO/OPA
The idler wave is then superimposed with the second part of the original pump beam
in a chain of four potassium titanyl arsenate (KTA) crystals forming the OPA. This
leads to difference frequency mixing between pump and idler radiation in the OPA
stage, providing light in the mid-infrared range between 2200 - 3800 cm-1:
IPIR ωωω −= (2.10)
Additionally, energy conservation requires
)(21
ISP ωωω −= (2.11)
so that the frequency of light generated via difference frequency mixing will be given
by:
14
⎭⎬⎫
⎩⎨⎧
−⋅⋅=⎭⎬⎫
⎩⎨⎧
−⋅⋅⋅=−=−−=nm
ccSPS
PSSPPIR 1064112112)2(
λπ
λλπωωωωωω
(2.12)
- IRω : angular frequency of the mid-infrared radiation generated by difference
frequency mixing in the OPA, [ ]nmnmIR 4550,2600∈λ
- Iω : angular frequency of the idler wave [ ]mmI µµλ 2.2,3.1∈
- Sω : angular frequency of the signal wave [ ]nmnmS 885,710∈λ
- Pω : angular frequency of the pump radiation provided by the Nd:YAG laser,
nmP 1064=λ
Light in this frequency range can be used for the investigation of the structures of a
wide range of complexes, as important fundamental vibrational transitions of many
molecules fall within that region of the spectrum, such as OH and CH stretching
modes. The OPO is tunable in that range without gaps and provides pulses of ~ 7 ns
duration and energies of 1 - 15 mJ, depending on the pump laser intensity and the
infrared frequency. After the OPA stage, a dichroic mirror is installed to remove the
residual pump radiation from the light beam. A Brewster “stack of plates” polarizer is
used to isolate either the horizontally polarized mid-infrared or the vertically
polarized idler wave from the output. The band width of the OPO is ~ 2 cm-1. The
infrared beam is routed to the mass spectrometer via gold mirrors and passed twice
through the interaction region in order to double the signal-to-noise ratio before
eventually being measured by a pyroelectric detector (Molectron J-4). A Si and an
anti-reflection coated Ge filter are placed in the beam in order to filter the remaining
1064 nm radiation from the pump laser and amplified idler radiation out of the light
beam. The IR-OPO/OPA and the infrared beam path can be purged by dry nitrogen in
order to avoid absorption of the infrared light by ambient atmospheric trace gases
such as water or carbon dioxide prior to reaching the mass spectrometer. Frequency
calibration of the setup is achieved by analyzing the signal wave of the OPO
(transmitted through the OPO output coupler) with a fiber optic spectrometer (Ocean
15
Optics), which in turn is calibrated against the well-known emission spectrum of an
Ar discharge. On the basis of the resolution of the spectrometer in the spectral region
in question (~ 2 cm-1) and the intrinsic bandwidth of the optical parametric converter
(~ 2 cm-1), we conservatively assume our frequency scale to be accurate within
3 cm-1. The photofragment signal is eventually measured as described in the previous
paragraph as a function of the OPO frequency and during each scan, 16 laser shots are
acquired and averaged per data point (employing digital oscilloscopes, Tektronix
TDS 2022). The fragment ion intensity is normalized to the infrared intensity (thereby
correcting for fluctuations in the infrared pulse energy). Several spectra are recorded
on different days to ensure reproducibility and averaged to increase the signal-to-
noise ratio.
2.5. Infrared predissociation spectroscopy and effects of Ar solvation
The investigation of molecular complexes in the gas phase prevents the application of
classical absorption spectroscopy due to the low particle densities in the molecular
beam. Usually, minimum analyte particle densities on the order of
> 1011 particles/cm3 for bulk samples or > 1014 particles/cm3 for surface samples are
required. These conditions allow for measuring the attenuation of the light beam
passing through a sample and eventually the determination of the absorption cross
section according to Lambert-Beer’s law:
{ }lnII
⋅⋅−= νν σexp0
(2.13)
However, typical particle densities in a molecular beam are on the order of
< 105 particles/cm3 (and typically even considerably lower), thereby precluding this
approach. Alternatively, instead of measuring the absorbance of the light beam before
and after interacting with the particles under investigation, one can monitor the effect
it exerts on the sample particles by registering their dissociation after photon
16
absorption. As described in section 2.3, this can be achieved by employing the action
spectroscopy technique, based on monitoring the fragment ions resulting from the
irradiation process as a function of the frequency of the infrared light. A sketch of the
process leading to fragmentation is shown in Figure 2.5.
XY-·(H2O)n·Ar m + hν
[XY-·(H2O)n·Ar m]*
XY-·[(H 2O)n]* ·Ar m
XY-·(H2O)n· + m·Ar
Figure 2.5 Schematic representation of the photodissociation process after vibrational excitation of the chromophore (represented here by the evaporation of the Ar atoms from the C6F6
-·H2O·Ar3 parent) However, an intrinsic problem of the photodissociation approach is that it is only
feasible if the absorption of one photon will lead to dissociation of the parent ion on
the timescale of the experiment with (near) unit efficiency, which is often the case for
molecular cluster targets and photon energies in the visible and ultraviolet region.
However, even the non-covalent ion-molecule interactions considered in this work
will often exceed the infrared photon energies used for excitation of fundamental
vibrational transitions, which means that only cluster ions already containing a certain
17
amount of internal energy would be accessible for dissociation. One solution is to
apply sequential absorption of several photons in order to reach the dissociation limit
of the target ion.11 However, this approach requires high intensity infrared light
sources such as free electron lasers12 which are not easily available. In addition, most
information on the relative intensities of the observed spectral features is lost due to
the nonlinearity of multi-photon processes. In order to circumvent these problems, the
so-called messenger technique can be used, in which weakly bound “messenger” or
“spy” atoms are attached to the complex of interest.9,13 This technique has been
widely used in photodissociation experiments and relies on the evaporation of some
or all messenger atoms upon irradiation of the chromophore (represented by the
infrared active mode of the untagged ion-molecule complex which absorbs the
photon):
MpmMXYMXY pm ⋅−+⋅→⋅ −+−+ )(// (2.14)
This technique offers two advantages. First, the complexes under investigation are
cold, since they necessarily have a low internal energy content due to the low binding
energy of the messenger atom. As a result, one can hope that the Ar-tagged
complexes are close to their equilibrium structures, which is important for meaningful
comparison to the results of quantum chemical calculations. Moreover, table top
laser systems can be used, as the complex fragments upon absorption of one photon.
The non-covalent interaction with the weakly bound messenger atom will be broken
as soon as the excitation energy is redistributed into a normal mode leading to
dissociation. This intracluster or intermolecular redistribution of vibrational energy
follows the mechanism of internal vibrational redistribution (IVR).14 Of course, it can
be argued that the introduction of additional atoms into the cluster of interest might
introduce new problems by perturbing its structure away from the equilibrium
geometry of the bare species. This might pose experimental difficulties for studying
cationic species,15 where the interaction between ion and messenger atom is not
purely based on dispersion forces but is often also characterized by some amount of
covalent contributions. This is usually only a minor effect in the investigation of
18
anionic complexes, due to the low interaction energies (typically on the order of a few
hundred wavenumbers), and the influence of the messenger atom on the overall
complex geometry is generally negligible. Suitable candidates for serving as
messenger atoms, which have been frequently employed before, include nitrogen and
rare gas atoms. Among the latter, Ar constitutes the most convenient species in many
cases, as it is sufficiently weakly bound to the ion-molecule complex to leave the
geometry essentially unperturbed but strong enough to achieve a sufficient abundance
of Ar-tagged ions in the molecular beam to obtain good signal-to-noise ratios within
reasonable data acquisition times. Moreover, it is chemically inert and has no
rotational or vibrational degrees of freedom. Finally, it is monoisotopic, thereby
simplifying the mass spectrometric analysis. Typical shifts in the vibrational spectra
caused by Ar solvation lie within the range of 0 - 10 cm-1/Ar atom. With an increasing
number of Ar atoms attached to the ion-molecule complex under investigation, these
shifts approach those seen in the infrared spectra of species trapped in cold Ar
matrices, which can amount to several 10 cm-1. They represent essentially the bulk
analogue to the messenger technique or “Ar nanomatrix” approach in the gas phase.
19
2.6. References for Chapter II 1 M. A. Johnson and W. C. Lineberger, in Techniques for the Study of Gas-
Phase Ion Molecule Reactions, edited by J. M. Farrar and W. Saunders (Wiley, New York, 1988), pp. 591.
2 C. E. Klots, Journal of Chemical Physics 83 (11), 5854 (1985). 3 W. H. Robertson, J. A. Kelley, and M. A. Johnson, Review of Scientific
Instruments 71 (12), 4431 (2000). 4 R. Campargue, Journal of Chemical Physics 52 (4), 1795 (1970). 5 W. C. Wiley and I. H. McLaren, Review of Scientific Instruments 26 (12),
1150 (1955). 6 J. M. Weber, Rev. Sci. Instrum. 76, 043301 (2005). 7 C. W. Stoermer, S. Gilb, J. Friedrich, D. Schooss, and M. M. Kappes, Review
of Scientific Instruments 69 (4), 1661 (1998); R. Weinkauf, K. Walter, C. Weickhardt, U. Boesl, and E. W. Schlag, Zeitschrift Fur Naturforschung Section a-a Journal of Physical Sciences 44 (12), 1219 (1989).
8 U. Boesl, R. Weinkauf, and E. W. Schlag, International Journal of Mass
Spectrometry and Ion Processes 112 (2-3), 121 (1992). 9 D. Schooss, S. Gilb, J. Kaller, M. M. Kappes, F. Furche, A. Köhn, K. May,
and R. Ahlrichs, Journal of Chemical Physics 113 (13), 5361 (2000). 10 D. Schooss, Dissertation, Universität Karlsruhe (TH) (1999). 11 R. C. Dunbar, International Journal of Mass Spectrometry 200 (1-3), 571
(2000); M. A. Duncan, International Reviews in Physical Chemistry 22 (2), 407 (2003); R. B. Metz, International Reviews in Physical Chemistry 23 (1), 79 (2004); J. Oomens, D. T. Moore, G. Meijer, and G. von Helden, Physical Chemistry Chemical Physics 6 (4), 710 (2004); B. Simard, S. Denommee, D. M. Rayner, D. van Heijnsbergen, G. Meijer, and G. von Helden, Chemical Physics Letters 357 (3-4), 195 (2002); J. Oomens, B. G. Sartakov, G. Meijer, and G. Von Helden, International Journal of Mass Spectrometry 254 (1-2), 1 (2006).
12 D. Oepts, A. F. G. Vandermeer, and P. W. Vanamersfoort, Infrared Physics &
Technology 36 (1), 297 (1995).
20
13 P. Ayotte, G. H. Weddle, J. Kim, and M. A. Johnson, Chemical Physics 239 (1-3), 485 (1998); B. A. Collings, K. Athanassenas, D. Lacombe, D. M. Rayner, and P. A. Hackett, Journal of Chemical Physics 101 (5), 3506 (1994); F. Federmann, K. Hoffmann, N. Quaas, and J. P. Toennies, European Physical Journal D 9 (1-4), 11 (1999); A. Terasaki, S. Minemoto, M. Iseda, and T. Kondow, European Physical Journal D 9 (1-4), 163 (1999); T. Diederich, J. Tiggesbäumker, and K. H. Meiwes-Broer, Journal of Chemical Physics 116 (8), 3263 (2002); S. Grebenev, E. Lugovoi, B. G. Sartakov, J. P. Toennies, and A. F. Vilesov, Faraday Discussions 118, 19 (2001); J. M. Lisy, Journal of Chemical Physics 125 (13) (2006).
14 F. F. Crim, Annual Review of Physical Chemistry 44, 397 (1993); D. J.
Nesbitt and R. W. Field, Journal of Physical Chemistry 100 (31), 12735 (1996); C. G. Elles and F. F. Crim, Annual Review of Physical Chemistry 57, 273 (2006).
15 N. Solca and O. Dopfer, Chemical Physics Letters 325 (4), 354 (2000); R. V.
Olkhov, S. A. Nizkorodov, and O. Dopfer, Journal of Chemical Physics 108 (24), 10046 (1998).
21
3. Anion Hydration
3.1. General background
3.1.1. Condensed phase experiments
The structure of the hydration shell of ions has long been of interest, as its
understanding on a molecular level is of crucial importance in chemistry. Early work
on the hydration of ions in the condensed phase already yielded important results.
Neutron diffraction studies showed that water binds to cations via the oxygen atom
while simple anions like the chloride anion are bound in an asymmetric motif, with
one hydrogen atom being involved in a strong hydrogen bond to the anion (therefore
called ionic H-bonded (IHB) OH group) while the other one points away.1 As a
consequence, water molecules in the solvation shell around a cation tend to avoid
each other, while the water ligands grouped around an anion are able to form a
delicate binding network, as the free hydrogen atom can be tethered to neighboring
water ligands in hydrogen bonds. In addition to these fundamental insights into the
basic solvation behavior of ions in the liquid phase, it was possible to unveil some of
the infrared signatures of this asymmetric binding motif (displayed e.g. by the halide
ions) by investigating the infrared spectra of dilute frozen electrolytes.2 It could be
shown that a unique band characteristic for the H-bonded OH stretch vibration exists,
red shifted more than 100 cm-1 as compared to the pure solvent spectrum.
Unfortunately, it was neither possible to infer any additional features from the
spectrum nor could the method be used to elucidate the structure of a hydration shell
around an ion, thereby demonstrating some of the major limitations of condensed
phase experiments, where fluctuations in the solvation shell and the bulk water
molecules not coordinated to ions tend to mask the spectroscopic signature of the
interaction between the solvated ions and their surrounding ligands. Experimentally,
this leads to broad, unresolved spectra which cannot be used to obtain any
information about subtle details like hydration shells, at least for linear spectroscopy
22
methods. This is demonstrated by the broad infrared signatures of the OH stretch
vibrations in bulk liquid water.3 These problems can be circumvented by the cluster
approach in gas phase experiments, which allows mass selection of specific cluster
sizes and permits building up a hydration shell around an ion one solvent molecule at
a time while obtaining detailed spectroscopic information on the respective structures.
3.1.2. Infrared spectroscopy and binding motifs of X-·(H2O)n clusters
As described above, infrared spectroscopy of clusters constitutes an ideal tool to gain
the desired structural information, since the OH stretching vibrations are highly
sensitive to the interactions both between the solvated ion and the surrounding water
molecules and between the water ligands themselves. The focus of the investigations
presented in this work is on the hydration of anions, which is multifaceted and whose
details are still not completely understood due to the interplay of water bonding
motifs to the anion and the other water ligands.
3.1.2.1. The binary complex X-·H2O
The interaction and binding motifs of atomic and small molecular anions and single
water molecules has been thoroughly investigated and is now fairly well understood.
Complexes of an atomic anion (such as the halides) and a water ligand adopt a
binding motif which has CS symmetry and is referred to as the “single ionic H bond”
(SIHB) motif shown in Figure 3.1 (A).4-9 In this structure, one strong hydrogen bond
is formed between one of the OH groups of the water molecule and the anion, while
the second OH group points away from the anion and is essentially a free OH group.
23
A
B
Figure 3.1 Typical binding motifs found for anions in a complex with a water molecule; A – SIHB motif (single ionic hydrogen bond); B – DIHB motif (double ionic hydrogen bond)
As a result of this symmetry lowering compared to the free water molecule (C2v), the
two OH oscillators are decoupled. The symmetric stretching mode of the free water
molecule develops into an intense band in the IR spectrum, characterized
predominantly by the motion of the OH group involved in the hydrogen bond to the
anion and giving rise to a red shift of up to several hundred wavenumbers in
comparison to the centroid of the symmetric and antisymmetric stretch vibrations of
bare water (3707 cm-1). It is therefore generally referred to as the IHB band (“ionic H
bond”). The antisymmetric stretching mode evolves into a weak band dominated by
the motion of the free OH group, which shows up in the IR spectrum around the
position of the average of the symmetric and antisymmetric stretching vibrations of
bare water (3707 cm-1). It is named for this reason F band (“free”). The spectra and
vibrational signatures of the binary halide-water clusters have been extensively
studied, both experimentally7,8 and theoretically,4,10 and it is instructive to take a
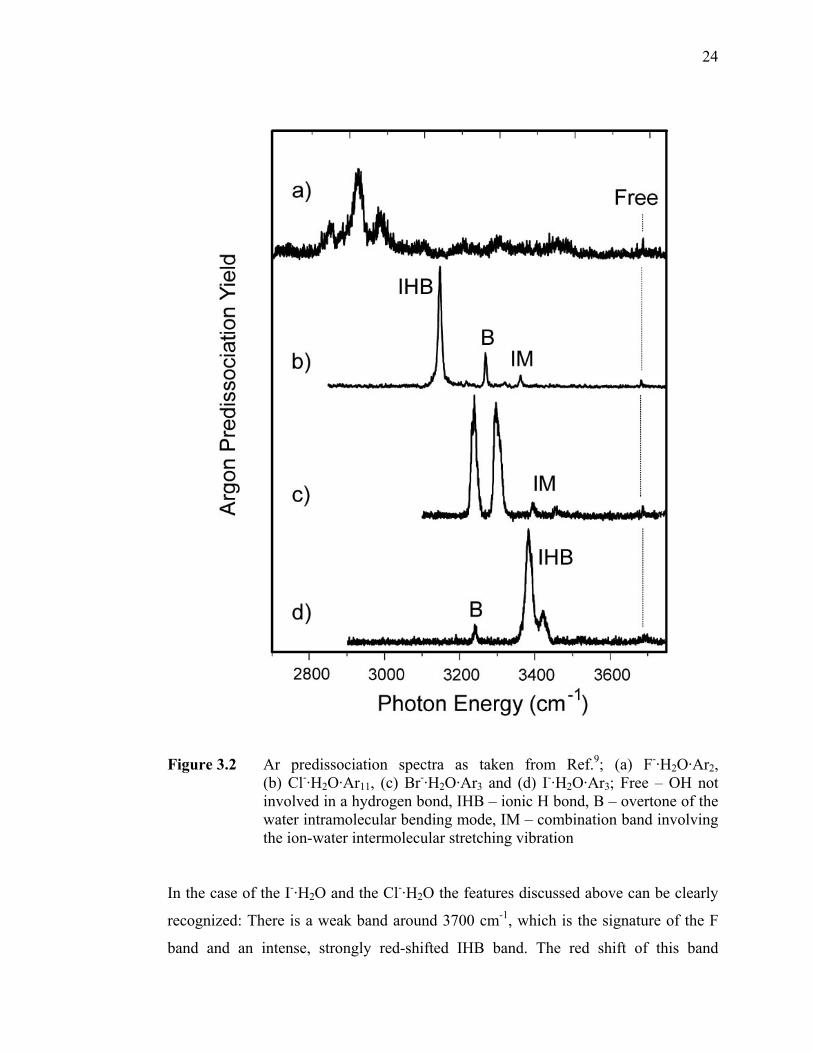
closer look at some of these results. Figure 3.2 shows the IR spectra of the
X-·H2O·Arn (X = F, Cl, Br, I) clusters as taken from Ref.9
24
Figure 3.2 Ar predissociation spectra as taken from Ref.9; (a) F-·H2O·Ar2, (b) Cl-·H2O·Ar11, (c) Br-·H2O·Ar3 and (d) I-·H2O·Ar3; Free – OH not involved in a hydrogen bond, IHB – ionic H bond, B – overtone of the water intramolecular bending mode, IM – combination band involving the ion-water intermolecular stretching vibration
In the case of the I-·H2O and the Cl-·H2O the features discussed above can be clearly
recognized: There is a weak band around 3700 cm-1, which is the signature of the F
band and an intense, strongly red-shifted IHB band. The red shift of this band
25
increases with the proton affinity of the anion,11 leading to an increasingly elongated
OHIHB bond and to a more pronounced anharmonicity of the OH stretching potential.
Moreover, both spectra display an additional band denoted as “B”, which is attributed
to the overtone of the water intramolecular bending mode, gaining intensity through a
Fermi resonance with the strong IHB band. Interestingly, in the spectrum of the
Br-·H2O complex a strong doublet appears instead of the IHB band. This can be
attributed to the same Fermi resonance (matrix element for the interaction is about
30 cm-1 in this case7), as the frequency of the IHB band is tuned to lower
wavenumbers going from Cl- to I- and coincides with the position of the unperturbed
bend overtone for Br-. Finally, there is an additional weak band denoted as “IM”,
which stems from a combination band of the IHB band with the ion-molecule stretch
vibration. The spectrum of the F-·H2O complex falls out of this scheme, as the red
shift of the IHB band is so strong that only the 2 ← 0 overtone can be recorded in the
energy range shown in Figure 3.2. This can be rationalized based on the high proton
affinity of the F- anion, which leads to a low-lying proton transfer channel showing up
as a distinct shelf in the potential energy surface along the hydrogen displacement
coordinate.9,12 While this shelf is much less pronounced for the heavier halides and
lies comparatively high in energy, in the case of F-·H2O it can be explored already by
the first overtone of the OH stretching vibration, leading effectively to the complex
sampling the proton transfer region of the potential energy surface following the
1 ← 0 excitation. This is even more pronounced to the point of delocalizing the
proton between “donor” and “acceptor” if the proton affinity of the two
corresponding bases is exactly the same such as in the OH-·H2O system.13 It has been
shown that it is crucial to include charge-transfer from the anion to the OH stretch
antibonding orbital in order to arrive at models which describe the observed red shifts
accurately,14 and in line with the experimental findings outlined above it was found
that the importance of charge transfer decreases on moving down the group of
halogens (F > Cl > Br > I).14 Qualitative trends, however, can be understood on the
basis of the electrostatic effects involved.15 In anions where the negative charge is
delocalized over several centers, a water molecule can form two hydrogen bonds to
the ion, a binding motif which is therefore referred to as DIHB motif (“double ionic H
26
bond”, see Figure 3.1 (B)). A class of molecules in which this motif frequently occurs
are anions where the negative charge is distributed over triatomic domains, such as in
CH3NO2-, or if the anion itself is triatomic, as is the case for SO2
- (Ref.16) or OCS-
(Ref.11), therefore offering a template for docking a water ligand via two hydrogen
bonds. This binding motif is only avoided if the DIHB geometry puts too much strain
on the water molecule. For this reason, NO2- shows a SIHB motif:11 due to the shorter
distance between the oxygen atoms the bending angle of the water ligand would have
to be lowered significantly, which makes the DIHB motif energetically unfavorable.
Since the symmetry of the water molecule (C2v) is at least approximately conserved in
the DIHB motif, the IR spectra of the respective complexes are expected to show the
same vibrational signatures as the bare water molecule itself, namely a symmetric (νs)
and an antisymmetric (νas) OH stretching mode. The former is usually more intense
and the splitting between the two is often somewhat smaller than in free water
(~ 99 cm-1). Both of them are red shifted as compared to their positions in free water
due to the hydrogen bonding interaction, but to a considerably lesser extent than the
IHB band in the case of the complexes displaying an SIHB binding motif. However,
the red shift of the bands involved in the hydrogen bonding increases in both cases
with the proton affinity of the anion. The signatures discussed above are observed
An increase of the number of water molecules solvating the core anion raises new
complications, as not only the binding motifs between the anion and its water ligands
have to be considered, but also the interactions of the water molecules with each other
will be of crucial importance for determining the overall structural motif. An
interesting question, which arises with increasing cluster size in that context is
whether the anions are eventually bound to the surface of a water cluster via hydrogen
bonds (“surface solvated”), or if they reside inside such a cluster (“internal
solvation”).17 This depends very much on the chemical nature of the respective anion.
Considering the halide anions again as prototypes for the hydration of small atomic
27
anions, increasing the degree of solvation to two water molecules surrounding the
respective anion leads to the observation of the binding motifs18,19 and vibrational
spectra displayed in Figure 3.3 (taken from Ref.9).
Figure 3.3 Spectra of X-·(H2O)2 clusters as taken from Ref.9; (a) F-·(H2O)2·Ar3 (structure shown in inset) (b) Cl-·(H2O)2·Ar3 (c) Br-·(H2O)2·Ar3 (d) I-·(H2O)2·Ar3 (structure of species (b) – (d) depicted in inset); arrow: position of H bonded OH stretch in the neutral water dimer, F – position of free OH stretch; IHBAD – ionic H bond of a water molecule acting as a hydrogen bond donor to the ion and acceptor to the neighboring water; IHBDD – ionic H bond of a water molecule acting as a hydrogen bond donor to both the ion and the neighboring water; IW – signature of the OH stretch involved in the hydrogen bond between the two water molecules
28
The X-·(H2O)2 (X = Cl, Br, I) clusters adopt an asymmetric geometry, where the
anion is bound to a water dimer via one hydrogen bond to each water molecule. The
remaining OH group of one of the water ligands (referred to as “DD” for “double-
donor”) is involved in the hydrogen bonding interaction with the second water
molecule. The hydrogen bond of this ligand to the ion is therefore weaker than for a
single water molecule in the ion-water complex. The second OH group of the other
water ligand is essentially free. It is referred to as “AD” (“acceptor-donor”). The
oxygen atom of this water molecule serves as a docking point for the hydrogen atom
of the interwater hydrogen bond and a small part of its electron density is shifted into
the antibonding orbital of the corresponding OH bond. This leads in turn to a
strengthening of the hydrogen bond of the AD water molecule to the anion. Overall,
this geometry can be viewed as a “surface solvated” anion. The binding motif gives
rise to a four-band spectral pattern which can be interpreted based on the spectra of
the monohydrates, taking the cooperative effects in the hydrogen bonding interactions
just described into account. The most red shifted IHB band and the F band (compare
Figure 3.3) can be attributed to the water molecule which serves as an acceptor for the
hydrogen from the neighboring water (IHBAD), while a second less red shifted IHB
band is the signature of the OH stretching mode involved in the hydrogen bond of the
second water molecule in the ion. The band marked as “IW” (for “interwater”) in
Figure 3.3 is assigned to the stretching mode of the OH group involved in the
interwater hydrogen bond, as its position is close to the hydrogen bonded OH
stretching mode in the neutral water dimer.20 Finally, the F band marks the signature
of the dangling OH group of the AD water ligand. Obviously, for these ion-water
complexes, the formation of an interwater hydrogen bond energetically outweighs the
loss in linearity in the hydrogen bonding to the anion, which is a consequence of the
formation of the water dimer. However, if the interaction strength between anion and
water ligands is increased, it is expected that the formation of the most favorable (i.e.
linear) hydrogen bond between anion and ligands prevails over the formation of
interwater networks, leading to a cluster geometry which can be described an
“internally solvated”. Interestingly, the spectral position of the IW band is slightly
blue shifted with increasing proton affinity of the anion, showing that the
29
intermolecular water-water interaction is reduced as the binding interaction to the
anion becomes stronger. The vibrational spectrum of the fluoride dihydrate (Figure
3.3) differs completely from the spectra of the other halide water clusters described so
far, which means that the local environment of the two water molecules must be
different in that case. This can be rationalized in view of the higher proton affinity of
the fluorine anion, leading to a strong enough hydrogen bonding interaction to its
water ligands to break the interwater hydrogen bond. The spectrum shows a strong,
red shifted IHB band (which falls into the energy range displayed in Figure 3.3 in
contrast to the IHB signature in the fluoride monohydrate, since the red shift of the
bands decreases with an increasing number of ligands). The F band is present as well,
while there is no signature in the spectral region where the IW band would be
expected. Thus, the fluoride anion is the only halide anion which can be viewed as
“internally solvated”, but the same is true for other anions exhibiting a strong
hydrogen bond to their water ligands, such as the OH-·(H2O)2 system.21 However, the
formation of hydrogen bonding interactions between the water ligands upon addition
of a second water molecule has been found to take place in the hydration of most
anions and even for extended charge distributions, such as the naphthalene anion.22 It
is worth noting that the most important features described for the X-·(H2O)2 systems
are also observed upon increasing the degree of hydration further to the trihydrates.23
While the fluoride anion in the F-·(H2O)3 cluster (as well as the hydroxide anion in
OH-·(H2O)3) still binds every water ligand via a single hydrogen bond (internal
solvation),21,24 all heavier halides display geometries where the water molecules form
hydrogen bonds among each other (surface solvation) (see Ref.9 and references
therein). In the IR spectrum, this motif can again be recognized by the signature of the
OH stretches involved in the intermolecular water bonds. They form “ring modes”
similar to (H2O)320 for the X-·(H2O)3 clusters (X = Cl, Br, I) and result from the
highly symmetric motif these systems adopt. Each water molecule is involved in one
H bond to its neighbor and another one to the anion. The formation of intermolecular
hydrogen bonds for the trihydrates has been found also for anions, which exhibit a
DIHB motif for the monohydrate such as Cl2-·(H2O)n.25 For the internally solvated
30
anions, it takes up to four (OH-·(H2O)n) and five (F-·(H2O)n) water ligands,21
respectively, before the onset of water network formation is observed.
Despite these well-established results on the hydration of atomic and small molecular
anions, not much is known about the binding behavior between water molecules and
larger anions, where the negative charge is not necessarily localized in a well defined
place but can be smeared out over the whole molecule. One exception is a pioneering
paper on the hydration of naphthalene.22 Also, there is not much information about
complexes of negatively charged metal atoms with water, although there is some
experimental and theoretical work on Cu-·H2O26-29 and Au-·H2O.26 In the present
work, we studied the hydration of the coinage metal anions with one water ligand.
Moreover, we investigated the C6F6-nHn-·(H2O)m (n = 0 - 2, m = 1,2) and SF6
-·(H2O)m
(m = 1 - 3) complexes as prototypes for the hydration of more extended charge
distributions.
31
3.2. Binary complexes of coinage metal anions with water
3.2.1. Introduction
There has been great interest in studying the intrinsic interaction of metal ions with
their environment, due to the crucial role they play in catalytic processes in chemistry.
While most infrared investigations in the gas phase have been performed on metal
cations with various ligands,30 negatively charged supported metallic clusters have
been proven to be catalytically active as well.31,32 Especially gold has received a lot of
attention33,34 and it was shown that small gold clusters are catalytically active if
deposited on defect sites on metallic surfaces.32,34,35 In this context, it is interesting to
gain some deeper insight into the interaction behavior of metal anions with their
chemical environment. Therefore, we performed an infrared spectroscopy study of the
coinage metal anions in a complex with one water ligand. In light of the above
discussion, M-·H2O complexes (M = Au, Ag, Cu) are expected to show a similar
hydration behavior as the halide anions, as they also constitute closed-shell, atomic
anions. The elucidation of their properties has triggered a growing number of
computational and experimental studies, the latter mainly employing photoelectron
spectroscopy (including imaging techniques and time-resolved
experiments).26,28,29,36,37 The similarity of their structural motifs to the halide-water
complexes has been supported by calculations carried out employing second-order
Møller-Plesset perturbation theory (MP2) and density functional theory26 (DFT, with
a B3-LYP functional). However, recent investigations of the Cu-·H2O complex28,37
have shown that the situation might be more complicated: although the minimum
energy structure displays the expected SIHB motif (CS symmetry), the barrier
corresponding to the C2v transition state between the two equivalent CS structures
along the potential energy surface lies rather low in energy (0.02 eV28), challenging
the idea of the robust SIHB motif found for the halide-water clusters. Moreover,
earlier theoretical investigations have suggested a C2v minimum energy structure for
the Cu-·H2O complex.27 Infrared spectra in combination with high level quantum
32
chemical calculations are ideally suited to resolve the issue of the hydration motif in
the M-·H2O complexes.
3.2.2. Calculations
Two routes have been applied to elucidate the structural motifs and the vibrational
signatures of the species under consideration. First, structure optimizations have been
performed using density-functional theory38 (DFT) on the B3-LYP level39 with
TZVPP basis sets for all atoms,40 as implemented in the TURBOMOLE program
suite.41 On top of that, higher-level calculations have been carried out by Boese et
al.42 on both a DFT/B97-1 and a CCSD(T) level of theory. The anharmonicity of the
potential energy curves has been accounted for in these calculations in order to get an
improved description of the vibrational patterns found experimentally and to include
effects anharmonic in nature, such as Fermi resonances. The computational details
can be found in Ref.42 (and references therein). The findings of the calculations are
summarized in Table 3.1 (energetic and geometric properties of the respective
structures of the complexes) and Table 3.2 (vibrational frequencies) and discussed in
comparison to the experimental results in the following section.
3.2.3. Results and discussion
The mid-infrared spectra of the M-·H2O·Ar2 clusters, recorded via the loss of two Ar
atoms are presented in Figure 3.4.42 The Au-·H2O complex displays a spectrum which
is reminiscent of the SIHB motif of the heavier halide-water systems described in the
preceding section. An intense, strongly red-shifted band (IHB band, evolved from the
symmetric stretching mode of the free water molecule, νs) around 3145 cm-1 is the
signature of the OH group involved in the hydrogen bond between metal anion and
water ligand. It is accompanied at higher energies by a band which can be assigned to
the bending mode overtone gaining intensity through a Fermi resonance with the IHB
band. Both of them form combination bands ~ 150 cm-1 higher in energy involving
33
the ion-water intermolecular stretch vibration, which even resemble the line shapes of
the “parent” bands (IHB and B respectively, see Figure 3.4) they build on.
3000 3100 3200 3300 3400 3500 3600 3700
νas
Ag
CuνB
νs
νas
νs
νB
photon energy [cm-1]
phot
ofra
gmen
t act
ion
[arb
. uni
ts]
νB
νs (SIHB)
νas (F)
Au
Figure 3.4 Infrared spectra of the M-·(H2O) complexes (M = Cu, Ag, Au; see inset of respective spectra); νB – bending overtone, νs – symmetric OH stretching mode; νas – antisymmetric OH stretching mode; (IHB – IHB band; F – (quasi) free OH stretch, see Figure 3.2)
34
The final proof that the structural motif is indeed of CS symmetry is delivered by the
weak band at 3671 cm-1, which is the signature of the free OH oscillator (F band,
evolved from the antisymmetric stretching mode of the free water molecule, νas).
However, the situation is less clear in the case of the Ag-·H2O and the Cu-·H2O
complexes, although both of them do display an intense symmetric stretching band
and an antisymmetric stretching band, similar to the Au-·H2O complex. It is
instructive at this point to put these findings into context with the well-understood
behavior of the halide-water complexes, where it has been established that the red
shift of the IHB band increases monotonically with the proton affinities of the
respective anions. This is due to the increased stretching of the OH bond involved in
the hydrogen bonding interaction, as the proton transfer channel is lowered
progressively in energy.11 Interestingly, the red shift of the symmetric stretching band
of the anionic silver and copper complexes (situated at 3366 cm-1 for Ag-·H2O and at
3271 cm-1 for Cu-·H2O, respectively) is much less pronounced than for the gold
anion-water complex (displaying a clear, strongly red shifted IHB band). However,
the proton affinity of the anions increases from gold to copper, which should lead to
the opposite behavior (within the same binding motif, see Figure 3.5). In contrast, the
position of the feature identified as antisymmetric stretching mode (3575 cm-1 for
Ag-·H2O and 3520 cm-1 for Cu-·H2O, respectively) is considerably more red shifted
and intense than should be the case for a clear-cut SIHB motif, and it was not possible
to find any spectral feature above 3600 cm-1, where the F band would be expected to
show up in such a case. This demonstrates that the two OH groups cannot be
considered to be completely uncoupled in the copper and silver complex. The red
shifts of the IHB bands of some known water-anion complexes against the proton
affinities of the respective anions are shown in Figure 3.5.11,43 It can be seen that the
anionic gold water complex is positioned along the line connecting complexes with
an SIHB motif, further corroborating its structural assignment.
35
13,5 14,0 14,5 15,0 15,5 16,0 16,5 17,0
200
400
600
8001000
2000
4000
red
shift
[cm
-1]
proton affinity [eV]
I
Br
ClNO2
O2
FOH
OCSSO2
Au
Ag
Cu
Figure 3.5 IHB band positions for the known anion-water complexes as a function of the proton affinities of the ions (from Ref.11,43); open squares – known SIHB complexes; open triangles – known DIHB complexes; full squares – coinage metal-water complexes; in the case of (suspected) DIHB configurations the lower energy (i.e. symmetric stretch) IHB band is listed
In contrast, Ag- and Cu- fall onto a line with anions binding the water ligand in a
DIHB motif, pointing towards the earlier theoretical findings which ascribed C2v
symmetry at least to the Cu-·H2O complex.27 At this point, it is instructive to compare
the experimental findings discussed so far to the results of the calculations. They are
summarized in Table 3.1 for the different structural motifs and their energetic and
geometric properties.
36
Table 3.1 Theoretical results for some of the energetic and geometric properties of the M-·H2O complexes (M = Au, Ag, Cu)
aValues in parentheses are zero-point corrected (harmonically for the B3-LYP results and anharmonically (CCSD(T) + B97-1) for the CCSD(T) results) bCalculated using CCSD(T)//pVQZ/MCDF It can be seen that on all levels of theory the CS symmetry motif is calculated to be
the minimum, in line with earlier theoretical results26,28 and showing that none of the
three complexes under consideration displays a DIHB motif (C2v symmetry).
However, the energy barrier between the CS and the C2v geometries turns out to be
low compared to e.g. the Cl-·H2O complex (~ 56 meV4), which displays a clear-cut
SIHB motif, especially for the Ag-·H2O (16 meV on a zero-point corrected CCSD(T)
level) and the Cu-·H2O complex (17 meV, same level of theory), while it is higher for
Au-·H2O (42 meV). The barrier between the two equivalent CS binding motifs has
been determined for the Cu-·H2O complex before to 20 meV, which compares
reasonably well with the value presented above.28 The situation is visualized in
Figure 3.6, where the potential energy curves of the three M-·H2O complexes are
plotted against the M-H-O angle (again employing CCSD(T), but without taking
zero-point corrections into account).
37
110 120 130 140 150 160 170 180-5
0
5
10
15
20
25
30
35
Au Ag Cu
EC
CSD
(T) [m
eV]
M-H-O angle [°]
Figure 3.6 Calculated potential energy curves (CCSD(T) without zero-point corrections) from Ref.42 for the M-·H2O complexes (M = Au, Ag, Cu, see inset) along the M-H-O angle
While all calculated curves show a minimum for the singly hydrogen bonded CS
structure, Au-·H2O is the only case for which the two minima seem to be separated by
a substantial barrier, indicating the possibility of a robust SIHB motif. In contrast, the
positions of the minima are at smaller angles and the barrier between them is low for
Ag-·H2O and Cu-·H2O, leading to a very shallow potential. As a consequence, the
wave function of the zero-point motion of these species has its maximum value close
to the transition state. The frequencies of the OH stretching bands, as calculated for
all complexes and symmetry species under consideration, are summarized in Table
3.2, together with the experimentally determined values.
38
Table 3.2 Experimental and calculated IR band positions of the M-·H2O complexes (M = Au, Ag, Cu)
aCentroids as measured for M-·H2O·Ar2 bCalculated using DFT (B3-LYP//TZVPP), frequencies have been scaled by 0.9476 (CS) and 0.9602 (C2v) to account for anharmonicity and match the known IHB frequency in free H2O molecules, respectively cCalculated using CCSD(T)/DFT (CCSD(T)//cc-pVQZ/MCDF and B97-1//aug-pc-2/MWB) dF band not measured eBand affected by Fermi resonance Clearly, for Au-·H2O there is a reasonably good agreement between theory and
experiment for the anharmonic frequency values based on the SIHB binding motif
(CS symmetry), supporting the earlier assumptions and proving that this species
behaves in an analogous way to the halide-water complexes. Unfortunately, the
situation is less clear for the other two complexes: For both Cu-·H2O and Ag-·H2O
none of the frequency pairs determined for either of the two possible “robust” binding
motifs are in satisfactory agreement with the experimental values. Therefore, it seems
to be the case that neither of the two motifs (DIHB or SIHB) truely represents the
actual structure of these complexes. Their zero-point motion samples different
geometries, also exploring structures towards the C2v transition state geometry, in the
39
vicinity of which the ground state wave function probably has its maximum. The
situation may be best described as a dynamic DIHB motif with two different
hydrogen bonds. Compared to a clear-cut SIHB motif, the OH stretching modes in the
Cu-·H2O and Ag-·H2O complexes will come closer in energy, as the formerly strong
ionic hydrogen bond is weakened by substantial deviation from the linear hydrogen
bonding configuration (shifting the lower energy band to the blue), while the formerly
free OH group is bound to the ion (shifting its oscillation frequency to the red). This
situation is reflected in the recorded mid-infrared spectra42 shown in Figure 3.4, as
has been outlined before. In a situation characterized by such shallow potential energy
surfaces, the influence of the Ar messenger atoms on the binding motif is expected to
increase as compared to a clear-cut SIHB or DIHB case. The binding energy of an Ar
atom to e.g. Cl- is ~ 523 cm-1,44 which means it could possibly exceed the barrier
height for all three complexes, assuming the dissociation energy of the M-·Ar
(M = Au, Ag, Cu) lies in a similar range. It does not seem unlikely therefore that the
attachment of Ar atoms has a profound influence on the structural motifs. This
problem has been tackled by recording the spectra of the systems of interest with a
varying degree of Ar solvation. The spectra of the bare complexes are inaccessible in
the experiment, as the binding energies of Au-, Ag- and Cu- to a water molecule
amount to 616 meV, 636 meV and 894 meV,26 above the available mid-infrared
excitation energies. Only hot complexes already carrying a significant amount of
internal energy prior to excitation could be probed that way, which would not be
representative for the ground state minimum structures one is interested in. However,
it is possible to record the spectra for different levels of Ar solvation, enabling
extrapolation to the properties of the bare systems. All bands are red shifted upon
addition of the second Ar atom, with the red shifts being more pronounced for the
IHB band and ranging from 19 cm-1 (Au-·H2O·Ar2) to 33 cm-1 (Ag-·H2O·Ar2).
Moreover, while the overall appearance of the spectrum remains the same for the two
different degrees of Ar solvation, comparison of the spectra for one and two Ar
ligands (as displayed in Figure 3.7) shows subtle changes in the structure of the IHB
bands.
40
3300 3400 3500 3200 3300 34003100 3200 3300
Ar p
redi
ssoc
iatio
n yi
eld
[arb
. uni
ts]
n = 2n = 2
n = 1n = 1
n = 1
n = 2
Au Cu
photon energy [cm-1]
Ag
Figure 3.7 IR spectra of the M-·H2O·Arn complexes (M = Au, Ag, Cu; n = 1,2)
First of all, while the IHB bands for the complexes solvated with one Ar atom are
mostly symmetric, addition of a second Ar atom leads to enhancement of the
low-energy side of the peak and therefore to a more asymmetric band shape. This
means that Ar atom addition favors formation of the asymmetric CS motif, increasing
the barrier between the two identical minimum structures. In addition, the IHB bands
of the Ag-·H2O·Ar and the Cu-·H2O·Ar clusters show an interesting substructure
absent in the Au-·H2O·Ar system. One explanation could be formation of several Ar
isomers in the molecular beam absorbing at slightly different frequencies, as has been
observed earlier in the Cl-·H2O·Arn system.45 However, a similar behavior has been
described before for the I-·ROH46 clusters and also for species where a water ligand is
attached to an anion with a negatively charged triatomic domain such as
CH3CO2-·H2O or CH3NO2
-·H2O.11 These species have a DIHB geometry in their
41
ground states, but the potential energy curve along the water rocking motion is
shallow. As a consequence, their spectra show unexpected features in the OH
stretching region. The substructure of these broad bands has been attributed to
simultaneous excitation of the water rocking motion with the OH stretch bands and
can be understood on the basis of a Franck-Condon like behavior. The high-frequency
OH stretching motion can be thought of being decoupled from the low-frequency
water rocking motion. One can therefore first calculate the potential energy curve
along the water-rocking motion, constructing a Born-Oppenheimer (BO) surface.
Subsequently, the harmonic frequencies for the OH stretch bands at each angle Φ are
determined and added to the BO surface, delivering a zero-point corrected BO (ZP-
BO) surface and vibrationally adiabatic surfaces according to:11,47
( ) ( ) ( ) ( )φνφνφφν 2211 21
21
⋅⋅⎟⎠⎞
⎜⎝⎛ ++⋅⋅⎟
⎠⎞
⎜⎝⎛ ++= hnhnUU BO
ad (3.1)
where ν corresponds to the symmetric and antisymmetric stretching modes at the
DIHB configuration and to the OHIHB and free OH stretching modes in the SIHB
configuration, respectively, Φ is the angle M-O-H, see Figure 3.8, and n is the
number of vibrational quanta in the OH stretching modes (n1 = 0 and n2 = 0 for the
zero-point corrected Born-Oppenheimer surface; n1 = 1 and n2 = 0 for the trace
labeled “s” and n1 = 0 and n2 = 1 for the trace labeled “as” in Figure 3.8). This has
been accomplished for one of the M-·H2O complexes, namely Ag-·H2O as shown in
Figure 3.8. All potential energy curves have been calculated according to (3.1). The
transitions between the zero-point corrected Born-Oppenheimer surface and the
vibrationally adiabatic surfaces are assumed to happen “vertically” in a Franck-
Condon-like behavior. The symmetric OH stretch vibration features a large red shift
at low and high values for Φ (corresponding to a binding motif of CS symmetry) as it
evolves into the hydrogen bonded IHB band of the SIHB motif.
42
0 20 40 60 80 100
0
10
20
30
40
50
60
0
10
20
30
40
50
60
zero pointcorrected
BO-surface
vibr. adiabaticsurfaces
M-O-H angle [°]
s
as
rela
tive
pote
ntia
l ene
rgy
[meV
]
Figure 3.8 Calculated OH Born-Oppenheimer surface and OH stretching fundamentals along the water-rocking motion, measured as angle Φ(M-O-H) between water and metal (see sketch on top of graph). The symmetric OH stretching mode undergoes a considerable red shift as it develops into the H-bonded IHB band at high and low angles. All values are determined via equation (3.1), with n1 = n2 = 0 for the lower trace and n1/2 = 1 for the upper trace. The two dashed lines mark the minimum energy positions of the ground-state BO surface.
Consequently, on the adiabatic surface of the vibrationally excited state, the SIHB
motif is preferentially stabilized relative to the DIHB motif as compared to the
ground-state BO surface, where it only constitutes a shallow minimum. Hence, an
offset in the position of the maximum of the wave function is expected, as the
potential energy curve of the vibrationally excited surface resembles more explicitly a
clear-cut SIHB motif, meaning its minima lie further away from the C2v structure.
This behavior is visualized in Figure 3.8 by the two dashed lines, marking the
43
positions of the minima on the ground-state BO surface. Excitation of the OH stretch
vibration should therefore trigger a structural change of the binding motif along the
water-rocking motion, abetting a more asymmetric binding motif. Thus, strong
activity of this soft mode is expected in combination with the excitation of the OH
stretch modes, following a Franck-Condon-like mechanism. It seems plausible that
the pronounced substructure of the IHB bands in the M-·H2O complexes (M = Ag,
Cu) stems from such a combined excitation of the soft water-rocking and the OH
stretching motion.
3.2.4. Summary and conclusions
The binding motifs of the coinage metal anions in complexes with one water
molecule have been investigated. In spite of their seeming similarity to the
monohydrates of the heavier halide anions (closed-shell anions, comparable proton
affinities), Au-·H2O is the only one of the three complexes which displays the
clear-cut SIHB motif expected for these systems. In contrast, although the potential
energy curves of both the Ag-·H2O and Cu-·H2O complexes still display a minimum
for CS symmetry, their IR spectra prevent an unambiguous assignment to either an
SIHB or a DIHB binding motif. Rather, the positions found for the OH stretch bands
seem to be situated between the ones expected for the two different distinct structural
motifs, indicating that the potential energy surface is flat enough to allow the
complexes to explore structures close to the transition state through the zero-point
motion in their ground state. This situation is reminiscent of the case of certain
molecular anions with negatively charged triatomic domains, which show strong
excitation of the water rocking motion upon excitation of an OH stretch band, as the
minimum energy structure changes on the ground state and vibrationally excited
surface. Even if the asymmetric SIHB motif seems still to be favored for all of the
M-·H2O complexes, they therefore do introduce a new binding behavior for atomic
anions. However, the reasons for the different binding behavior of a water molecule
to the three coinage metal anions have not been understood at this point.
44
3.3. Anionic hydrated fluorobenzenes
3.3.1. Background
The hydration behavior of small atomic anions such as the halides is well understood,
as has been described in detail in the preceding sections. Also, the interaction of
anionic molecules with triatomic templates has been investigated in depth and the
occurring binding motifs have been unveiled. At the same time, there is a paucity of
experimental data on the hydration of extended charge distributions where the
negative charge is not localized in a certain area within a molecule but delocalized
over all of its constituents. One exception is an infrared study on the dihydrated
naphthalene anion.22 We have chosen to investigate the hydration of negatively
charged fluorobenzene molecules, as they represent prototypes for anions with
spatially large charge distributions. Interestingly, neutral fluorinated benzenes lose the
ability to hydrogen bond for fluorination degrees higher than four. This has been
demonstrated in a study on complexes of fluorosubstituted benzenes with ammonia.48
The binding behavior has been attributed to a continuously decreasing electron
density on the fluorine atoms with increasing fluorination. Instead, for
hexafluorobenzene it has been shown that a water ligand is bound on top of the
molecular plane with the lone pairs of the oxygen pointing towards it.49 The binding
has been characterized as primarily electrostatic, with a favorable interaction between
the dipole moment of the water ligand and the quadrupole moment of the
hexafluorobenzene molecule.49 Therefore, it will be interesting to see if “charging up”
the target molecule will again reverse the binding motifs. In addition, varying the
number of fluorine atoms around the ring offers yet another intriguing route for
investigation of this class of molecules. There is some disagreement about the exact
value of the electron affinity of hexafluorobenzene in the literature. Literature values
lie between 0.53 (±0.05) eV as determined in a flowing afterglow study by Miller et
al.50 and 0.72 eV, resulting from a recent experiment applying photoelectron
spectroscopy performed by Eustis et al.,51 but it clearly forms a thermodynamically
stable anion. Pentafluorobenzene has an electron affinity smaller than 0.434 eV,52 and
45
the electron affinity of tetrafluorobenzene is unknown. At the other extreme, the bare
benzene molecule will certainly not form a stable anion, as its electron affinity has
been determined to be ~ -1.17eV.53 However, it is well known that molecules such as
benzene or naphthalene are able to accommodate an electron if stabilized by an
appropriate number of ligands in clusters or condensed phase environments.
Nakajima and coworkers established that about 25 molecules are necessary in order to
observe strongly bound excess electron states in (C6H6)n- and (C6H5CH3)n
- clusters.54
In the case of Nphm-·(H2O)n clusters, the free naphthalene anion has not been
observed in a molecular beam and its electron affinity has been measured to be
-0.20±0.01 eV.55 However, it can be stabilized already with one water molecule,
which was rationalized in light of the stabilization energy inherent to the attachment
of a water ligand to the negative transient anion (~ 0.3 eV and therefore just enough
to pull the system into a thermodynamically stable region). On this basis, it was
explained why Nph-·H2O showed up only as a very small peak in the mass spectrum,
while the cluster with two water ligands was the most abundant by far.22,55 Moreover,
it was argued that the similarity of the anion-water (~ 0.2 - 0.3 eV) and the water-
water (~ 0.25 eV56) binding energies should give rise to the maximization of
interwater hydrogen bonding, thereby leading to a one-sided hydration motif of the
anions, reminiscent of the situation in the heavier halide-water clusters. Indeed, this
assumption has been confirmed by an infrared predissociation study of the
Nph-·(H2O)2 clusters,22 where the absence of a free OH band signature signaled the
involvement of all H atoms in hydrogen bonds. Moreover, a signature assigned to an
OH group involved in the formation of an interwater hydrogen bond clearly proved
the one-sided binding motif. The fluorobenzenes C6FnH6-n constitute ideal prototypes
for this kind of diffuse anion, as they offer the opportunity to slowly tune the electron
affinity from positive to negative values by stepwise reduction of the number of
fluorine atoms around the ring one at a time. It will be of great interest to determine
how this will influence the binding motif of a water molecule to the aromatic ring and
to what extent the water ligand is actually able to stabilize the negative charge on
such a transient anion. In this study, the focus is the C6FnH6-n-·(H2O)n cluster system
with n = 4 - 6. We recorded the IR spectra of these species in the region of the OH
46
stretch bands of the water molecule, as they should sensitively mirror any change in
the binding motif between anion and ligand. We also provide some exploratory
calculations on the equilibrium structures of the systems of interest in order to
examine possible isomers occurring in our experiment.57
3.3.2. Theoretical and mass spectrometric results
In order to elucidate the structural motifs of the anionic complexes under
investigation, density-functional theory38 has been employed as implemented in the
TURBOMOLE program package,41 using the B3-LYP functional39 and applying a
TZVPP basis set40 to all atoms. In this manner, we calculated the minimum energy
structures for the three anions under investigation, namely C6F6-, C6F5H- and
1,2,3,4-C6F4H2-.
3.3.2.1. C6F6-
For C6F6- we find the structure to be strongly distorted from the planar D6h geometry
of the corresponding neutral C6F6 into a geometry of C2v symmetry, with two
opposite fluorine atoms strongly angled up (~ 23° with respect to the carbon ring)
while the other four are slightly angled in the opposite direction. (~ 8° with respect to
the carbon ring). The result of the calculation is pictured in Figure 3.9 (A); all
relevant bond lengths and angles are given in Table 3.3.
47
Table 3.3 Relevant geometric values for the C6F6- anion as calculated by
DFT/B3-LYP/TZVPP (for labeling of atoms compare Figure 3.9)
Although weaker in signal intensity, the C6F6-·H2O·Arn progression can still be grown
out to high Ar solvation numbers. A magic number occurs for n = 24, just one below
the n = 25 observed in the C6F6-·Arn progression. This likely means that the water
molecule is replacing one of the Ar atoms, a behavior which has been observed before
for Cl-·H2O·Arn clusters,45 where the water ligand takes the place of one Ar atom in
the icosahedral solvation shell. The mass spectrum of the C6F5H-·H2O·Arn
progression is displayed in Figure 3.13 (together with the C6F5H-·Arn progression,
which also occurs). Stable local minimum structures have been determined for the
C6F6-·H2O (see Figure 3.15) and C6F5H-·H2O (see Figure 3.17) complexes, and the
respective harmonic frequencies have been calculated numerically for the
interpretation of the experimental infrared spectra.
54
200 250 300 350 400 450 500 550 600
1 2 3 4 5 6C6F6
-·H2O·Arn
abun
danc
e [a
rb. u
nits
]
mass [u]
C6F6-·Arn
1 2 3 4 5 6
Figure 3.12 Mass spectra of the Ar progressions of C6F6-·H2O·Arn and C6F6
-·Arn, produced by entrainment of small amounts of C6F6 and H2O vapor into an expansion of neat Ar
Anharmonic calculations of the frequency values have been up to now beyond our
computational capacities. However, it is possible to account for the intrinsic
anharmonic nature of the calculated values in the harmonic approximation by scaling
them with an appropriate factor. One way to obtain a reasonable value for the latter
factor is to calculate the harmonic frequency values of the respective neutral molecule
with the chosen computational method and then determine their ratio to the known
experimental values.
55
200 300 400 500 600
abun
danc
e [a
rb. u
nits
]
mass [a.u.]
0 1 2 3 4 5 C6F5H-·Arn
C6F5H-·H2O·Arn
0 1 2 3
Figure 3.13 Mass Spectrum of C6F5H-·H2O·Arn and C6F5H-·Arn progressions, produced by entrainment of small amounts of C6F5H and H2O vapor into an expansion of neat Ar
However, the quality of this approximation naturally only mirrors the difference in
anharmonicity for the vibrational frequency values of the neutral, so that when
applied to the respective anion-molecule complex it depends heavily on the extent the
ligands are distorted upon interaction with the anion. For this reason, we chose in the
present case to refer to a scenario more closely related to the systems we wanted to
investigate: The frequency values of the CS2-·H2O complex (which has been found to
exhibit a DIHB motif) have been experimentally determined11 and fall relatively close
56
to the absorptions of the C6FnH6-n-·(H2O)n complexes in our study, so that they were
ideally suited to reference our calculations. In this manner, we extracted a value of
ks = 0.959 for the symmetric and kas = 0.963 for the antisymmetric OH stretching
frequency, respectively.
3.3.3. Results and discussion
3.3.3.1. C6F6-·H2O
The binding energy of the water molecule to the anion has been experimentally
determined to be 0.32 eV.51 It is therefore comparable to the mid-infrared excitation
energies, making the loss of Ar atoms the preferential experimental route to record
the desired infrared spectra of the cold complexes. All spectra were recorded via loss
of all Ar atoms from the parent ion cluster (three in the case of C6F6-·H2O and two for
the other two species, C6F5H-·H2O and 1,2,3,4-C6F4H2-·H2O). The spectrum of the
C6F6-·H2O complex is displayed in the range between 3200 and 3800 cm-1 for n = 1
(Figure 3.14), as the OH oscillators of the water ligand are expected to be active in
that region of the infrared spectrum. The two sharp bands in the spectrum at 3620 and
3686 cm-1 can be identified as the symmetric and antisymmetric OH stretching
vibration of the water molecule bound to the hexafluorobenzene anion in a clear-cut
DIHB motif. Varying the number of Ar atoms attached to the anionic chromophore
has only negligible influence on the position of the observed vibrational resonances,
which change by less than 1 cm-1 on using C6F6-·H2O·Ar2 instead of C6F6
-·H2O·Ar3.
There is no signature of a free OH oscillator (which would be a clear indication for an
SIHB motif), and the spectral features of the water molecule are conserved but red
shifted as should be the case for a DIHB motif according to the discussion in section
3.1.2.1. Also, the splitting between the two bands (δν = 66 cm-1) is smaller than for
bare water (δν = 101 cm-1). One of the features which has been frequently observed
before in the infrared spectra of anion-water clusters but is missing in the spectrum
shown in Figure 3.14 is the bend overtone of the water molecule.
57
3200 3300 3400 3500 3600 3700 3800
Pho
tofra
gmen
t Sig
nal [
arb.
uni
ts]
Photon Energy [arb. units]
νs
νas
Figure 3.14 Infrared spectrum of C6F6-·H2O·Ar3 (recorded via registering loss of all
three Ar atoms); νs – symmetric OH stretching mode of the water ligand; νas – antisymmetric OH stretching mode of the water ligand
This mode, which appears around 3300 cm-1, usually gains intensity through a Fermi
interaction with the symmetric OH stretching mode of the water molecule. This could
explain its absence in the present case, as the red shifts of the symmetric and
asymmetric OH bands are rather small compared to the cases where the bending
overtone has been observed. This increases the energetic gap between the latter and
the symmetric OH stretch (from which the intensity is usually “stolen”), therefore
effectively suppressing the Fermi resonance interaction to an extent where the
intensity of the bending overtone is too low to be resolved in this experiment. The
58
narrow line width of the two bands observed in the experimental spectrum (~ 4 cm-1)
suggests that only one structural isomer is populated in the molecular beam. In order
to shed more light on the specific structure the complex adopts in the gas phase, DFT
calculations have been carried out employing the B3-LYP functional and a TZVPP
basis set for all atoms, although one can empirically assign a DIHB binding motif to
the structures based on the recorded infrared spectrum as discussed above. The
symmetry lowering from D6h (C6F6) to C2v (C6F6-) entails a significant increase in the
number of possible different binding sites of the water ligand to the anion. Within the
range of 100 meV we find six structural isomers, which are displayed in Figure 3.15
(isomers higher in energy will not be considered since the probability for them to be
the dominating fraction of the ensemble of anionic complexes in the molecular beam
drops sharply). The two lowest-lying isomers form a DIHB binding motif via
hydrogen bonds to two fluorine atoms of the ring, so that the water molecule and the
aromatic ring come to lie in the same geometric plane. Isomer 4 (34 meV above the
calculated ground state) is the only one constituting an SIHB motif, with the water
molecule binding to one of the fluorine atoms while the other OH group points
towards the ring, leading approximately to a 90° angle between the planes of the
carbon ring and the water ligand. Isomer 3 displays a structure somewhat intermediate
between these two motifs. The two high energy isomers 5 and 6 show again a DIHB
motif, but with the hydrogen bonds formed to the top of the aromatic ring rather than
to the fluorine atoms in the plane of the ring. In order to be able to judge which of
these local minimum structures is predominant, the vibrational energy levels for each
of the isomers have been calculated numerically. Unfortunately, anharmonic
calculations are beyond our computational capabilities, so we confined ourselves to
harmonic approximations, which were adjusted with an appropriate scaling factor as
described in section 3.3.2.4 in order to roughly account for anharmonicity. The results
are shown in Table 3.6 together with the experimental values for direct comparison. It
can be seen that with the exception of isomers 3 and 4 all of the considered structures
are roughly in agreement with the experiment. However, isomer 1 fits best, which
together with the fact that it constitutes the calculated global minimum gives us
confidence that this is the dominating structural motif in the ion beam, bearing in
59
mind that the sharpness of the observed spectral features is a strong hint that only one
of the possible isomers is significantly populated.
Isomer 1
Isomer 5 Isomer 6
Isomer 4Isomer 3
Isomer 2
0 meV
82 meV60 meV
34 meV 34 meV
29 meV
Figure 3.15 Calculated structures (DFT/B3-LYP/TZVPP) of the six isomers within 100 meV above the global energy minimum (isomer 1)
60
Table 3.6 Experimental and calculated (DFT, B3-LYP, TZVPP, scaled for anharmonicity) positions of the symmetric (νs) and antisymmetric (νas) OH stretching bands of the water molecule in the C6F6
-·H2O complex for the six lowest lying isomers; ∆νs / ∆νas – corresponding band widths; δν - splitting between these two bands; the numbers in the first row refer to the respective isomer as labeled in Figure 3.15
Expt. 1 2 3 4 5 6
νs [cm-1] 3617±2 3618 3634 3557 3564 3594 3613
∆νs [cm-1] 4.0±0.2
νas [cm-1] 3686±2 3691 3715 3690 3718 3667 3693
∆νas [cm-1] 4.0±0.2
δν [cm-1] 69±3 73 82 133 154 73 80
Our structural assessment is in agreement with the findings of Eustis et al. with a
DFT (MPW1PW91/6-311++G(d,p)) level of theory. They as well assigned a DIHB
motif to the C6F6-·H2O anion, with the water ligand hydrogen bonded to two fluorine
atoms of the ring. An interesting aspect arising in that context is the question how
easy it is for the different isomers to interconvert into one another. Isomer 1 and 2 are
of particular interest in that respect, as first of all they are most relevant to our
experiment being the lowest energy structures and secondly interconversion would
not require a major rearrangement in terms of the binding motif. However, either one
of the hydrogen bonds would have to be broken or the hexafluorobenzene ring would
have to rearrange, effectively exchanging a strongly angled CF bond (with respect to
the carbon ring) against one that is more weakly angled. A rough estimate for the
barrier involved in the second process with the above level of theory
(DFT/B3-LYP/TZVPP) amounts to ~ 80 meV, which is too high to be easily
overcome, further corroborating our assumption that isomer 1 is the only one present
in the experiment.
61
3.3.3.2. C6F5H-·H2O and 1,2,3,4-C6F4H2-·H2O
The spectra of the penta- and 1,2,3,4-tetrafluorobenzene anions solvated with one
water ligand are shown in Figure 3.16, together with that for the C6F6-·H2O complex
for comparison.
νas
νs
νs
νas
Pho
tofra
gmen
t Sig
nal [
arb.
uni
ts]
νs
νas
νs
νas
3200 3300 3400 3500 3600 3700
Photon Energy [cm-1]
νs
νas
3500 3550 3600 3650 3700
Photon Energy [cm-1]
νs
νas
Figure 3.16 Infrared spectra of C6F6
-·H2O·Ar3 (top), C6F5H-·H2O·Ar2 (center) and 1,2,3,4-C6F4H2
-·H2O·Ar3 (bottom) measured via the loss of all Ar atoms both over the entire covered spectral range (left column) and zoomed in around the symmetric (νs) and antisymmetric (νas) OH stretching vibration (right column)
At first glance, all of them look very similar, as they all display two sharp peaks
which have already been assigned for the hydrated hexafluorobenzene to the
symmetric and antisymmetric OH stretching vibration of the water molecule, bound
62
to the anion in a DIHB motif. As expected in this scenario, there is no sign of any
vibrational feature at lower energies (spectra recorded down to 3200 cm-1 are shown
in the left column of Figure 3.16), which could be indicative of some population of an
isomer in an SIHB geometry. However, taking a closer look at the symmetric and
antisymmetric OH stretching bands (compare right column of Figure 3.16) reveals
some subtle differences: First, the red shift of both features increases upon decreasing
the number of fluorine atoms around the ring, with the red shift being more
pronounced for the symmetric stretch vibration. Hence, the splitting between the two
bands increases from 69 cm-1 in the case of C6F6-·H2O complex to 98 cm-1 for 1,2,3,4-
C6F4H2-·H2O. The experimental band positions, widths and splittings for all species
are listed in Table 3.7.
Table 3.7 Experimental band positions (νs for the symmetric, νas for the antisymmetric OH stretching band), widths (∆νs and ∆νas respectively) and splittings (δν) for the C6F6
-·H2O·Ar3, C6F5H-·H2O·Ar2 and 1,2,3,4-C6F4H2
-·H2O·Ar3 clusters
Hexafluorobenzene
(n = 3) Pentafluorobenzene
(n = 2) 1,2,3,4-Tetrafluorobenzene
(n = 3)
νs [cm-1] 3617±2 3591±2 3579±2
∆νs [cm-1] 4.0±0.2 6±0.1 8±0.4
νas [cm-1] 3686±2 3683±2 3677±2
∆νas [cm-1] 4.0±0.2 3±0.4 5±1
δν [cm-1] 69±3 92±3 98±3
The difference between the anions with respect to their chemical nature delivers a
possible explanation for this behavior: As the number of electron withdrawing
substituents around the carbon ring is decreased, the negative charge is increasingly
63
concentrated in a smaller region, therefore leading to stronger interaction between the
anion and the water ligand. This would explain the stronger red shift with decreasing
degree of fluorination of both the symmetric and asymmetric OH stretching bands.
However, the binding energy of the water ligand to the anion decreases in the same
direction, contradicting the assertion invoked above somewhat as one would expect
the binding energy to increase proportionally to the interaction strength. It is also
conceivable that an increasing accumulation of the negative charge leads to a less
diffuse distribution over the aromatic ring. This should favor a switching of the
binding motif from the observed DIHB towards an SIHB motif, being the preferred
structure for the halide anions which constitute an extreme case of a negative charge
concentrated on one atom. Consequentially, the symmetric stretching band should
gradually turn into a localized IHB band while the nature of the asymmetric stretching
vibration should slowly become more like the free OH band. This would explain why
the red shift of the former turns out to be more pronounced than for the latter, while
the splitting between the two features increases. As the symmetry of the
pentafluorobenzene anion is reduced in comparison to the case of the
hexafluorobenzene anion, there is an even greater multitude of possible isomers upon
attaching a water ligand. An exploratory search for minimum energy structures was
performed using the calculated local minimum energy structures found for the
C6F6-·H2O complex (DFT/B3-LYP/TZVPP basis set for all atoms) and permutating
the positions of the hydrogen and fluorine atoms through all possible relative
positions, leading to a considerable number of isomers relatively close in energy. Due
to the large number of calculations necessary following this approach and the
otherwise high computational cost, a smaller basis set (TZVP) was chosen for this
class of complexes. The experimental spectrum still shows only two sharp features,
however, allowing for the conclusion that only one of these isomers is considerably
populated (although in the case of the tetrafluorobenzene anion our signal to noise
ratio is not good enough to completely exclude some contribution from different
isomers). For this reason, isomers lying higher in energy than 100 meV above the
(calculated) global energy minimum have not been considered as suitable candidates
to be present in the molecular beam. The six most stable isomers are displayed in
64
Figure 3.17, and some of their calculated relevant energetic properties and vibrational
features are summarized in Table 3.8.
Isomer 1
Isomer 5Isomer 6
Isomer 4Isomer 3
Isomer 2
0 meV
102 meV90 meV
43 meV56 meV
34 meV
Figure 3.17 Calculated structures (DFT/B3-LYP/TZVPP) of the six isomers within 100 meV above the global energy minimum (isomer 1)
65
Table 3.8 Experimental and calculated (DFT, B3-LYP, TZVP, scaled for anharmonicity) positions of the symmetric (νs) and antisymmetric (νas) OH stretching bands of the water molecule in the C6F5H-·H2O complex for the six lowest lying isomers; ∆νs / ∆νas – corresponding band widths; δν - splitting between these two bands; the numbers in the first row refer to the respective isomer as labeled in Figure 3.17
Expt. 1 2 3 4 5 6
νs [cm-1] 3591±2 3551 3517 3462 3521 3618 3406
∆νs [cm-1] 6.0±0.1
νas [cm-1] 3683±2 3689 3696 3670 3704 3704 3705
∆νas [cm-1] 3.0±0.4
δν [cm-1] 92±3 138 179 208 182 85 298
It can be seen that on this theoretical basis a structure with an DIHB motif is
predicted to be the global minimum as expected from the experimental results.
Moreover, this structure is reminiscent of the global energy minimum geometry found
for the C6F6-·H2O complex and it reproduces the experimentally determined splitting
between symmetric and asymmetric OH stretching vibration best (with the exception
of isomer 5, which is already 90 meV higher in energy). We tentatively assign
therefore isomer 1 to be the dominant isomer found in the experiment. We caution
however, that the next three isomers calculated to be close in energy all display more
of an SIHB than a DIHB motif. It would therefore be desirable to perform more
expensive calculations on this system on a higher level of theory including better
anharmonic corrections. The calculated harmonic frequencies were scaled employing
the same scaling factor that was chosen for the C6F6-·H2O complexes (ks = 0.959 for
the symmetric and kas = 0.963 for the antisymmetric OH stretching frequency,
respectively, see section 3.3.2.4). The 1,2,3,4-C6F4H2-·H2O turned out to be the last
66
species in this row we were able to record the infrared spectrum for in the same way.
We refrained from performing an extensive search for minimum energy structures for
this species based on calculations, as the symmetry is even further lowered, leading to
a prohibitively high number of possible isomers. As the signal-to-noise ratio of the
spectrum gets worse too, it would become more difficult to assign a specific structure
from this perspective as well. Hence, we restrict ourselves to the empirical
interpretation given above based on the similarities among all recorded spectra. We
were not able to push our investigations of the hydrated fluorobenzene anions further
to even lower degrees of fluorination: while 1,2,3-C6F3H3-·H2O complexes could be
produced, no charged fragment ions could be registered following exposure of this
species to the infrared light. We suggest that from this degree of fluorination onwards
the stabilization of the negative charge by the water ligand drops far enough to turn
the ejection of an electron via vibrational autodetachement into a faster process than
the concurrent Ar loss channel, effectively shutting down the latter. This kind of
behavior has been observed before by Weber et al. for the CH3NO2-·Arn system,66
where as many as three Ar atoms are necessary to make the Ar loss channel prevail
over vibrational autodetachment of the electron. Use of this phenomenon as an
experimental technique has been first made by Lineberger and coworkers to record
very high-resolution spectra of NH-,67 exploiting the fact the vibrational features show
up as resonances embedded in the autodetachment continuum. We were able to
follow the same route to record the spectrum of the bare pentaflurobenzene both via
electron autodetachment and loss of Ar atoms as is discussed in the next section.
67
3.3.3.3. Bare C6F5H-
The spectra of the bare pentafluorobenzene anion recorded both via loss of Ar atoms
and vibrational autodetachment of the electron are shown in Figure 3.18.
2700 2800 2900 3000 3100 3200 3300
4
5
23
n=3, VP
n=2, VP
n=1, AD
Inte
nsity
[arb
. uni
ts]
Photon Energy [cm-1]
n=0, AD1
Simulated Spectrum
Figure 3.18 Electron autodetachment (AD) and vibrational predissociation (VP) spectra of the C6F5H-·Arn (n = 0 - 3) anions. (The VP spectra are recorded via loss of the attached argon atoms). The lowest spectrum is a simulation using the scaled calculated harmonic value for the CH stretching vibration of the bare pentafluorobenzene anion using a Gaussian fit with 6 cm-1 half width.
68
The most recent literature value for the electron affinity (EA) of the neutral
molecule52 is given as an upper limit of 0.43 eV, while our calculated value amounts
to 0.17 eV (DFT, B3-LYP, TZVPP). Thus, the EA could fall into or even below the
photon energy range of our spectra. Interestingly, the autodetachment spectra do not
show any or only negligible background from direct electron emission following
vertical electronic excitations. This may mean that electron emission by
autodetachment is much more likely than direct vertical bound-to-free transitions. The
structural deviations between the planar neutral molecule (D6h symmetry) and the
valence-bound anion, in which some of the fluorine atoms are strongly bent out of the
plane of the carbon ring (as described in section 3.3.2.2), are quite large, as can be
seen from the optimized anionic structure in Figure 3.9 (DFT, B3-LYP, TZVPP).
Based on that, it is plausible that the vertical electron detachment energies lie
considerably above the adiabatic EA and therefore out of the range of our OPO,
suggesting very small Franck-Condon factors for detachment into low lying
vibrational states of the neutral. However, since we observe vibrational
autodetachment, we tentatively correct the upper limit of the EA of the
pentafluorobenzene molecule to < 0.35 eV (= 2800 cm-1), which is the lowest
excitation energy of the vibrational feature observed in the experimental spectrum
(see Figure 3.18). In light of the fact that our calculated value (0.17 eV) for the EA
may not be very accurate (for comparison, a calculation at the same level of theory
underestimates the EA of hexafluorobenzene by ~ 85 meV with respect to the
experimental value of 0.53 eV), the energy of an infrared photon used may be just
higher than the energy necessary to detach an electron. Therefore, one could explain
the observation of vibrational autodetachment in the absence of direct detachment by
Wigner’s threshold law:68 near threshold, the cross section will be dominated by ℓ = 0
(angular momentum of the photoelectron) and the photodetachment cross section σ is
proportional to the square root of the energy above the detachment threshold ∆E:
E∆∝σ
Since the cross section goes to zero for excitation energies close to the threshold
energies, direct detachment of a pentafluorobenzene anion may be unfavorable on the
interaction timescale between photon and anion. However, resonant excitation of a
69
vibrational transition deposits the energy in the molecule, considerably extending the
timescale available for reaction. Therefore, it might happen on the experimental
timescale (~ tens of µs) despite a low cross section for direct detachment. We caution,
however, that our experiment does not allow us to distinguish between any of the
suggested mechanisms. It would be desirable therefore to perform either more
sophisticated calculations or photoelectron spectroscopy experiments on the C6F5H-
anion in order to get a more reliable value for its EA. Attempts to record vibrational
predissociation spectra of the pentafluorobenzene anion solvated with one argon atom
failed, although there should be no energetic constraint preventing this reaction to
occur. This suggests that electron autodetachment is the dominating reaction channel
for both the bare and the singly argon-solvated pentafluorobenzene anion following
vibrational excitation. Finally, for the anion solvated with two argon atoms the
vibrational predissociation channel becomes accessible as the anion becomes more
stabilized upon increasing argon solvation. The energy gap between neutral and
anionic species therefore grows, slowing down the autodetachment and favoring the
competing predissociation channel. This behavior has been observed before for the
nitromethane anion, where autodetachment is dominating for the bare and singly
argon-solvated anion.66 In that case, the doubly argon-solvated species decays with a
roughly equal ratio into both channels before predissociation takes over for three or
more attached argon atoms. Unfortunately, we are not set up to unambiguously
determine how many argon atoms are necessary to close down the autodetachment
channel for the pentafluorobenzene anion, as we cannot register the ejected electrons
independently but only the neutral products on the linear detector of the time-of-flight
mass spectrometer. Argon solvation does not seem to affect the spectra at all, the
main feature at ~ 3079 cm-1 remains exactly at the same position in all spectra. The
minor bands show the same behavior or at least no noticeable trend correlating the
band shifts to the degree of argon solvation. Our harmonic calculations result in only
one band in the frequency range of interest, which represents the CH stretch vibration
of the pentafluorobenzene anion. After scaling this harmonic value with an
appropriate correction factor accounting for anharmonicity (with the scaling factor
being the ratio of the known value for the CH stretch vibration of the neutral
70
molecule69 and the calculated value (DFT/B3-LYP/TZVPP basis set for all atoms);
see Figure 3.18), it nicely fits to the strongest band in all spectra, even if it
overestimates its position by about 10 cm-1. We can therefore clearly assign the
strongest spectral feature to the CH stretching vibration of the pentafluorobenzene
anion. The less intense bands 1 - 4 are more difficult to interpret, as they cannot stem
from excitation of fundamental transitions and are not reflected in our harmonic
frequency calculations. We can therefore only tentatively assign them to overtone
excitation and combination bands of symmetric and asymmetric CH/CF bending
vibrations, the harmonic intensities of which are calculated to be fairly high. For a
more rigorous assignment of these bands higher level calculations would be needed,
taking the anharmonicity of the vibrations explicitly into account. It is interesting to
note that there is no strong feature around the position where the CH stretch vibration
would be expected in the spectrum of the C6F5H-·H2O complex. We do observe a
small peak at 3092 cm-1, which could be tentatively assigned to this feature. However,
we caution that our signal-to-noise ratio is not good enough to make a specific
assignment. Again, the lowest energy isomer with a DIHB motif shows the best
agreement with the experimental result, both depicting a slight frequency blue shift of
the band as compared to the bare anion and a diminished intensity. However, we
refrain from a specific assessment of the problem on the grounds of our theoretical
capabilities at this point.
3.3.3.4. Higher degrees of solvation: C6F6-·(H2O)2 and
C6F5H-·(H2O)2
The infrared spectra of the dihydrated hexa- and pentafluorobenzene anions have
been recorded as well, in order to gain a better understanding about how the binding
motifs will be influenced with increasing numbers of ligand molecules and the
potential onset of water network formation. All spectra are displayed in Figure 3.19.
71
3200 3300 3400 3500 3600 3700 3800
Photon Energy [cm-1]
Phot
ofra
gmen
t Sig
nal [
arb.
uni
ts]
Figure 3.19 Infrared Spectra of C6F6-·(H2O)2·Ar2 (top trace) and C6F5H-·(H2O)2·Ar2
(bottom trace) measured by monitoring loss of the two Ar atoms upon irradiation
The number of peaks and the overall spectral pattern of the two different cluster
species are very similar, even if the exact positioning of the bands and the relative
intensities differ, as is to be expected. Also, the bands in the spectrum of the hydrated
pentafluorobenzene trimer seem to be somewhat narrower than in the C6F6-·(H2O)2
spectrum, although both parent clusters are tagged with two Ar atoms and should
therefore have similar amounts of internal energy, given that they are the same size.
In both cases, there are five intense bands, exceeding the number of OH stretching
modes (four). Hence, there must be at least two different isomers present in the
72
molecular beam, which is conceivable with regard to the multitude of isomers already
theoretically possible for the monohydrates, and their number should increase upon
introducing more water molecules into the solvation shell around the anion.
Differences in the relative populations between several isomers might also contribute
to the difference in the band widths of the two species. Determining the most stable
structure by means of calculations would involve a search for these different
structures on a complicated potential energy surface and at the same time require
more elaborate theoretical methods, which is why no specific assignments can be
made at this point. However, it should be noted that the infrared spectra of both
cluster species display intense features at lower wavelengths than was the case for the
monohydrates, which seems to be counterintuitive at first glance, as the interaction
strength between anion and water ligand is expected to decrease with the number of
molecules in the solvation shell increasing. An explanation for this kind of behavior
could involve a change in the binding interactions concomitant with the change in the
number of ligands. Either the second water molecules binds to the anion in a different
motif than the first one, basically adopting an SIHB motif, which seems to be
unlikely. Another explanation involves the onset of hydrogen bonding interactions
between the two water molecules attached to the anion. In that case, the water
molecules are no longer equivalent, but one of them acts as a double hydrogen donor
(DD), donating one hydrogen atom to the interwater-hydrogen bond, while the other
one plays the role of a hydrogen donor and acceptor (AD), being involved in a
hydrogen bonding to the anion and serving at the same time as a docking point for the
hydrogen bond from the neighboring water molecule. This kind of behavior has been
observed before (see section 3.1.2.2), and the corresponding infrared spectra of the
respective anion-water clusters clearly proved that this kind of cooperative hydrogen
bonding interactions can lead to significant lowering in the energy of the vibrational
signatures of the hydrogen bonds involved.19,70 Here, this means that water networks
start to form already upon addition of a second water ligand to the respective
fluorobenzene anion, although there are still open binding sites available in such an
extended charge distribution. It also shows that there is strong competition between
ion-water and water-water bonding interactions, which is conceivable in the light of
73
the fact that the binding energy between anion and ligand drops from 0.32 eV for the
first water molecule to 0.22 eV for the second,51 therefore lowering it into the range
of typical interwater hydrogen bonding interactions. As mentioned earlier in section
3.3.1, interwater bonding has been found to take place in the Nph-·(H2O)222 as well,
corroborating our interpretation for the hydrated fluorobenzene trimers. We note that
Eustis et al.51 postulate based on calculations a structure for the C6F6-·(H2O)2 trimer in
which the two water molecules are bound to the anion on opposite ends. Their
calculated value for the vertical detachment energy of this species is only in rough
agreement with their experimental finding though, while our infrared experiment
strongly suggests that both water ligands cannot be bound to the anion in a DIHB
motif. We caution however that we likely have several isomers populated in our
experiment (one of which could display the structure postulated by Eustis et al.) and
we cannot assign specific structures based on the level of our calculations.
3.3.4. Summary and conclusions
Infrared predissociation spectra and mass spectra of the hydrated fluorobenzene
anions C6FxH6-x-·(H2O)m·Arn (x = 4 - 6; m = 1,2; n = 2,3) have been monitored in
order to elucidate the structural motifs occurring upon solvation of an anion with an
extended negative charge distribution. These experimental efforts have been
accompanied by calculations on a DFT/B3-LYP/TZVPP level of theory to aid the
assignment of specific structures to the experimental spectra, which was unfortunately
only possible in the case of C6F6-·H2O and C6F5H-·H2O: for all other species under
study the number of isomers was prohibitively high and the level of theory not
sophisticated enough. However, it was possible to unambiguously assign the
structures of the bare anions C6F6-, C6F5H- and 1,2,3,4-C6F4H2
-. The mass
spectrometric results show that the electron affinity of this class of molecules drops
from positive in the case of hexafluorobenzene to around zero for tetrafluorobenzene
and that it is moreover dependent on the distribution of the fluorine atoms around the
aromatic ring. For C6F5H- we were able to record the infrared spectra both of the bare
anion via vibrational autodetachment and by recording the loss of attached Ar atoms.
74
From the infrared spectra it can be clearly concluded that water undergoes rather
weak interactions with the fluorobenzene anions. All investigated dimers display a
DIHB motif and in the case of the C6F6-·H2O and C6F5H-·H2O complexes a specific
structure could be tentatively assigned based on calculations. Comparison of the
spectra of the three fluorobenzene anions under investigation show that upon
reduction of the number of fluorine atoms around the ring either charge localization
or a gradual change in the binding motif from a clear-cut DIHB towards a more
SIHB-like structure takes place. Moreover, in order to gain insight into the further
hydration process, the spectra of C6F6-·(H2O)2·Ar2 and C6F5H-·(H2O)2·Ar2 were
recorded and the onset of water network formation was found upon addition of the
second water molecule to the respective anion: however, in these cases there have
been several different isomers present under the experimental conditions and no
specific structural assignments could be made based on the calculations. In order to
do so, a more refined theoretical study would be desirable, based on more
sophisticated methods and specifically taking into account the anharmonic nature of
reaction and delayed onset of water network formation
3.4.1. Introduction
Similar to the case of the fluorobenzene anions described in section 3.3, the sulfur
hexafluoride anion constitutes another example of a highly delocalized excess charge
distribution. SF6- retains octahedral (Oh) geometry upon electron attachment, with the
SF bonds evenly lengthened (from 157.2 pm in the neutral molecule to 171.4 pm in
the anion, RI-MP2/TZVPP level of theory) because the negative charge is equally
distributed over the respective antibonding σ* orbitals. Apart from this interest in the
SF6-·(H2O)n system as a representative for a certain class of anion-molecule
complexes, it is desirable to gain more information about the interaction of the SF6-
anion with surrounding molecules in light of some other aspects. Neutral SF6 has
recently been discovered to represent a potent greenhouse gas with ~ 22200 times the
global warming potential of carbon dioxide and it is one of the greenhouse gases
listed in the Kyoto protocol.71 Although its atmospheric concentrations are low, it is
of almost exclusively anthropogenic origin and it can accumulate over a long time
with a lifetime in the atmosphere of ~ 3200 years72 due to its chemical inertness. It is
therefore a concern to learn more about the potential reactions of this molecule under
atmospheric conditions. In addition, SF6 is used in several industrial application, e.g.
as a plasma etching gas and as a high voltage gaseous dielectric. At the same time,
under the conditions in electrical discharges it is found that in the presence of traces
of oxygen or water vapor reactions occur, leading to a variety of both neutral products
such as SOF2, SOF4, SO2F2, SO2 and HF73 and also ionic species, including
H3O+(H2O)n, SF5+(H2O)n, SOF3
+(H2O)n, SOFx-, F-(HF)n, OH-(H2O)n, SF6
-(HF)n and
SF6-(H2O)n. While not much is known about the exact reaction pathways leading to
these products, it has been suggested that the SF6- anion is involved at least in some
of them, either reacting with the trace impurities present or the reaction products of
preceding reactions. Moreover, Huey et al. studied the reaction yields and rate
constants of the sulfur hexafluoride anion with atmospheric trace gases, among them
76
the acids HCl, HNO3 and HOCl.74 These findings triggered a study by Arnold et al. in
which they investigated the reaction behaviour of the SF6- anion with protic solvents
such as water and alcohols with short aliphatic chains in an ion flow tube
experiment.75 Although they were not able to account for all of the above-mentioned
reaction products, the following reaction channel
SF6-·H2O + H2O → SOF4
- + 2HF + H2O
could be established to be dominant, while a second reaction pathway leads to a
F-·(HF)2 product ion. Interestingly, they could confirm earlier reports by Knighton et
al.,76 that the reaction of the sulfur hexafluoride anion with small protic ligands is in
fact cluster-mediated, meaning that at first an association complex (i.e. SF6-·H2O) is
formed in equilibrium with the reactants, followed by a bimolecular reaction (shown
in the reaction equation above) of this intermediate cluster with another solvent
molecule leading to the final products of the overall reaction. This proves the
importance of cluster formation for the reaction to proceed at least along this
pathway. In this context, it is interesting to study the hydration behavior of SF6-
starting with one water molecule and increasing the number of ligands stepwise one at
a time from there. Changes in the structures and binding motifs might hint at the onset
and mechanism of the reactions described above. We recorded infrared spectra of
SF6-·(H2O)n (n = 1 - 3) complexes accompanied by calculations and find interesting
changes in the SF6 scaffold upon hydration which indicate possible reaction
mechanisms as described in detail in the following sections.77
3.4.2. Calculations
The sulfur hexafluoride anion is known to pose significant difficulties to its
theoretical treatment by density functional theory. For instance, in a recent study
Brinkmann et al. managed to arrive at a calculated value of 1.48 eV for its electron
affinity employing a KMLYP functional.78 This result still overestimates the
experimental value (1.07 eV ± 0.01 eV79) considerably. In comparison, employing
77
density functional theory (DFT)38 using the B3-LYP functional39 and applying a
TZVPP basis set40 (as implemented in the TURBOMOLE program package41) to all
atoms we arrive at a value for the electron affinity of 2.10 eV, which is considerably
worse. However, using second order Møller-Plesset perturbation theory including the
resolution-of-identity approximation (RI-MP2)80 and a TZVPP basis set40 for all
atoms as included in the TURBOMOLE program package,41 we calculate a value of
0.70 eV, which in spite of underestimating the experimental result seems to
approximate it much better. For this reason, we chose the RI-MP2 method for the
treatment of complexes involving the SF6- anion. For the bare SF6
- and its complex
with one water molecule we performed two sets of calculations for two different basis
sets, one using a TZVPP basis set for all atoms to enable comparison with larger
clusters and another one employing a TZVPP basis set only for sulfur but the larger
aug-cc-pVTZ basis set for all other atoms. In contrast to the TZVPP basis set, the
latter augmented Dunning basis set takes diffuse functions into account and should
therefore lead to an improved theoretical description for an anionic system with a
rather diffuse electron cloud such as SF6-, where this potentially plays a role. For
larger cluster systems with an increased number of water ligands we restricted
ourselves to the computationally less expensive TZVPP basis set due to the otherwise
prohibitively high computational cost. In order to be able to judge the accuracy of our
calculations, they can be compared to the results of Gutsev and Bartlett,81 who
performed a high level coupled-cluster calculation for the SF6- anion among others.
Relevant geometrical parameters, energies and the harmonic vibrational energies of
both our calculations and theirs are summarized in Table 3.9.
78
Table 3.9 Calculated geometric properties, electronic energies and harmonic vibrational frequencies (in cm-1) of SF6
- from this work and Ref.81 Note that experimental values for the high frequency t1u mode are 619 cm-1 [from Ar matrix isolation studies82] and 683(5) cm-1 [from Ar predissociation spectrosocopy83]
It can be seen that the SF bond lengths differ only by ~ 0.25 pm and that the largest
deviation in the harmonic vibrational levels amounts to < 20 cm-1 for the mixed
TZVPP/aug-ccpVTZ and < 35 cm-1 for the all-TZVPP basis set approach, suggesting
that this is an appropriate level of theory for the treatment of this anion. Although the
infrared spectra were all monitored by loss of Ar atoms from the parent clusters
SF6-·(H2O)n·Ar (n = 1 - 3), the Ar atoms were not taken into account in the
calculations. The vibrational energy levels were determined for each stationary point
identified in the harmonic approximation. All spectra were calculated numerically. In
order to account for anharmonic effects and to facilitate comparison with the
experimental results we scaled the calculated harmonic frequency values by an
appropriate scaling factor as was described for the fluorobenzene-water clusters in
section 3.3.2.4. A scaling factor of k = 0.947 was applied to all frequencies.
79
3.4.3. Results and discussion
3.4.3.1. SF6-·H2O
The spectra of the SF6
-·H2O·Ar2 (n = 1,2) clusters, monitored via loss of the attached
Ar atom, are shown in Figure 3.20.
2800 3000 3200 3400 3600 3800
Photon Energy [cm-1]
n=2
νas
Pho
tofra
gmen
t Sig
nal [
arb.
uni
ts]
n=1νs
2B
νas
νs
2B
Figure 3.20 Infrared spectra of SF6-·H2O·Arn (n = 1,2) monitored by Ar loss; νs –
symmetric OH stretching mode of the water ligand; νas – antisymmetric OH stretching mode of the water ligand, 2B – bending overtone of the water ligand; dotted lines mark combinations bands of the bending overtone and the IHB band (νs) with the water rocking mode
80
Just as for the hydrated metal and fluorobenzene anions described in the previous
sections, it is useful first of all to compare the experimental spectra to the infrared
signatures of the well-known SIHB and DIHB binding motifs. It turns out upon
inspection, that the spectrum of the sulfur hexafluoride monohydrate displayed in
Figure 3.20 is very similar to that of I-·H2O. All main features can be explained along
the lines of the interpretation given by Ayotte et al. and Bailey et al.:6,18,84 The intense
main band at 3430 cm-1 (labeled νs in Figure 3.20) is the signature of an OH group
hydrogen bonded to the anion (IHB band), while the weaker feature at 3676 cm-1
(labeled νas in Figure 3.20) is the signature of the remaining dangling OH group (F
band). A band at 3305 cm-1 has been attributed to the bend overtone of the water
molecule (labeled 2B in Figure 3.20), gaining intensity through a Fermi interaction
with the strong IHB band. Two weaker features building upon the bend overtone and
the IHB band (~ 60 - 70 cm-1 higher in energy, respectively) are assigned to
combination levels of these two bands with the water rocking motion (marked with a
dotted line in Figure 3.20). The SF6-·H2O complex therefore shows all spectral
signatures of an SIHB motif. We note that this is very different from the case of
hydrated C6F6-,57 indicating that not all large charge distributions behave similarly
upon hydration. Hence, although both molecules represent anionic entities with an
extended, delocalized charge distribution and even offer “docking points” for
hydrogen bonding of the same chemical nature in form of the fluorine atoms, they
display the distinct spectral signatures of two different binding motifs. Moreover, it
should be noted that the number of Ar atoms exerts only a negligible influence on the
spectra as can be seen in Figure 3.20, where the band positions of the monohydrate
basically remain the same both for solvation with one and two Ar messenger atoms.
Bearing in mind this unambiguous empirical assessment of the complex geometries
with respect to the binding motifs of the water ligand, we performed calculations (at
the level of theory described in section 3.4.2) in order to resolve the structures
adopted by the complexes under investigation. Surprisingly, in spite of the
experimental data pointing towards one clear, dominant structural motif, the
calculations turn out to yield several close-lying isomers, the structures of which are
shown in Figure 3.21.
81
(a)E = 0 meV
(c)E = 88 meV
(b)E = 4 meV
Figure 3.21 Structures of the three isomers lowest in energy of the SF6-·H2O
complex. Dotted lines indicate hydrogen bonds. Relative energies are based on MP2 calculations (zero-point corrected) with a TZVPP basis set for all atoms.
82
The isomer lowest in energy (isomer (a), both employing a TZVPP and an
aug-cc-pVTZ basis set) indeed displays an SIHB motif with one hydrogen atom
involved in a stronger interaction with the anion (FHO angle ~ 166°) than the other
one, which is only weakly tethered to a neighboring fluorine atom in a more acute
FHO angle (~ 130°). The isomer next higher in energy (isomer (b)) lies only 4 meV
(TZVPP basis set, zero-point-corrected) above this global energy minimum, which
would not allow for a clear identification of one of those two structures as the
minimum energy isomer based on the accuracy of our theoretical approach.
Moreover, this structure turns out to be a transition state with an imaginary frequency
of ~ i130 cm-1. The structure next higher in energy is found to represent an SIHB
motif again with one of the hydrogen atoms involved in an even more linear hydrogen
bond than is the case in isomer (a), while the other one is completely free. This
structure lies 88 meV above the ground state and constitutes a transition state, which
is why it is discarded for further interpretation of the spectra.
Table 3.10 Experimental and calculated (MP2, TZVPP and aug-cc-pVTZ basis set, respectively, scaled for anharmonicity) positions of the symmetric (νs) and antisymmetric (νas) OH stretching bands of the water molecule in the SF6
-·H2O complex for the two lowest lying isomers (SIHB ground state and DIHB transition state); the numbering of the isomers in the first row refers to the respective geometry as labeled in Figure 3.21.
Mode Expt. Isomer a Isomer b TZVPP aug-cc-pVTZ TZVPP aug-cc-pVTZ
In order to enable comparison between theory and experiment we calculated again the
vibrational spectra for the two remaining isomers under consideration in the harmonic
approximation, scaling our results with a factor of k = 0.947 to roughly account for
anharmonicity. The results are summarized in Table 3.10 together with the
experimental findings. Also, in order to facilitate comparison, the theoretical spectra
for both isomer (a) and (b) were simulated (see Figure 3.22), assuming a Gaussian
peak shape for the bands with a FWHM (full width at half maximum) of 6 cm-1.
νas
SF6-·H2O·Ar νs
2B
νas
νs
Isomer (a)
Phot
ofra
gmen
t Sig
nal
[arb
. uni
ts]
2800 3000 3200 3400 3600 3800
νas
νs
Isomer (b)
Cal
c. In
tens
ity
[arb
. uni
ts]
Photon Energy [arb. units]
Figure 3.22 Experimental spectrum of the SF6-·H2O (monitored by the loss of
one Ar atom, see top trace) as compared to the simulated spectra (MP2/TZVPP, scaled for anharmonicity, see text) of isomer (a) and isomer (b), Figure 3.21. Simulations assume a Gaussian peak shape and a FWHM of 6 cm-1.
84
It can be easily seen that these simulations confirm our earlier empirical assignment
of binding motifs to the recorded infrared spectra: while the simulated spectrum of
isomer (a) resembles the experimental spectrum reasonably well, this is not at all true
for the simulation based on isomer (b). This leads to the conclusion that the relative
energy of the symmetric isomer is underestimated in our calculations. The
observation of an SIHB binding motif in the SF6-·H2O complex is surprising also in
light of an empirical rule established earlier by Robertson et al.11 after studying
complexes of a water molecule with polyatomic anions in which the negative charge
was distributed over a triatomic domain. They found that there exists a connection
between the length of this domain and the stability of the DIHB motif. Stable ground
state structures with a DIHB motif have been found in a region between ~ 230 pm up
to ~ 313 pm. Given that the distance between two neighboring fluorine atoms in the
SF6- anion amounts to ~ 270 pm, it would fall right into this region of stability for a
DIHB binding motif and therefore obviously constitutes an exception to this rule.
3.4.3.2. SF6-·(H2O)2
The infrared spectra of both the SF6-·H2O and the SF6
-·(H2O)2 complexes are shown
in Figure 3.23 and comparison shows that both species display the same overall
spectral pattern with only some minor differences. Consequently, the general binding
motif of the water ligands to the anionic moiety and their local environments cannot
change significantly upon addition of a second water molecule. More specifically, the
spectrum of the monohydrate has been assigned to a geometry in which the water
molecule is bound to the anion via one strong and a second weaker hydrogen bonding
interaction to two neighboring fluorine atoms as was explained in the previous
paragraph. Hence, the second water ligand is expected to bind to the SF6- anion in the
same manner, so the only structural issue that remains to be resolved is the relative
position to the first ligand. This result is surprising in its own right, because most
anions solvated by two water ligands showed the onset of interwater bonding
interactions due to the strong propensity of the water molecule to from hydrogen
bonded networks.
85
2800 3000 3200 3400 3600 3800
Photon Energy [cm-1]
n = 2
Pho
tofra
gmen
t Sig
nal [
arb.
uni
ts.]
n = 1
2B
νs
Figure 3.23 Infrared spectra of SF6-·(H2O)n·Ar (n = 1,2) monitored by Ar loss; νs –
symmetric OH stretching mode of the water ligand; νas – antisymmetric OH stretching mode of the water ligand, 2B – bending overtone of the water ligand; dotted lines mark combination bands of the bending overtone and the IHB band (νs) with the water rocking mode
This is true even for extended charge distributions such as the hexafluorobenzene
anion as has been described in chapter 3.3, and this binding behavior usually
accompanies drastic changes in the infrared spectral pattern (see e.g. Ref.9 and
references therein). There are some known exceptions to this bonding behavior,
including anions such as F-19 and OH-.21 However, in these cases the responsible
mechanism is the formation of very strong hydrogen bonds, which outweigh the
water-water interactions and favor linear binding motifs. This scenario is unlikely to
86
be at play in the SF6-·(H2O)2 cluster. It seems to be more favorable for the OH groups
of the water ligands to seek interaction with the charge distribution of the core anion
than interwater binding. This could be understood in terms of electrostatic
interactions dominating in this case over chemical bonding. In order to determine the
geometry of the dihydrate, we performed an exploratory computational search for
stable isomers. Only a TZVPP basis set was employed in this case due to the
otherwise extensively long computation times. The five isomers lowest in energy are
shown in Figure 3.24. It can be seen that the first three isomers are very close in
energy, lying within an interval of 8 meV, which is certainly too small to make a
definitive assignment based on the accuracy of our calculations. Interestingly, in the
first two geometries the two water molecules share the one fluorine atom to which
both of them undergo strong hydrogen bonding interaction. Only the third isomer,
placed 8 meV above the ground state, displays a hydrogen bond between the two
water ligands. Anionic structures in which the water molecules do not share any
single fluorine atom of the SF6- core anion are found to lie considerably higher in
energy (> 130 meV). Two representatives of this class are shown in Figure 3.24 but
are not considered further for the interpretation of the experimental spectrum due to
the large energy difference. Moreover, they constitute saddle points along several
normal coordinates. In order to shed more light on the question which of the three
lowest-lying isomers contributes significantly to the measured spectrum, we
simulated the vibrational spectra of all three candidates, using a harmonic
approximation but scaling with an appropriate factor to take anharmonic effects into
account in an approximate manner. All simulations are shown in Figure 3.25 together
with the experimental infrared spectrum to facilitate comparison. It is obvious that the
simulated spectra of the two lowest-lying isomers which do not exhibit any interwater
bonding describe the measured spectrum reasonably well, whereas the agreement
with the simulation for the third isomer with an interwater hydrogen bond is rather
poor. First of all, there is no appreciable intensity in the spectrum where the signature
of an interwater interaction would be expected to be. The simulations predict an
intense band at 3491 cm-1 for isomer (c), in the spectral region where water-water
hydrogen bonding signatures usually occur.
87
(a)E = 0 meV
(b)E = 6 meV
(c)E = 8 meV
(d)E = 132 meV
(e)E = 142 meV
Figure 3.24 Structures of the isomers lowest in energy of the SF6-·(H2O)2 complex.
Dotted lines indicate hydrogen bonds. Relative energies are based on MP2 calculations with a TZVPP basis set for all atoms. Geometries (d) and (e) are saddle points along several coordinates.
88
SF6-·(H2O)2·Ar2
Pho
tofra
gmen
t Sig
nal
[arb
. uni
ts]
Cal
c. In
tens
ity[a
rb. u
nits
]
2800 3000 3200 3400 3600 3800
a
c
b
Photon Energy [cm-1]
Figure 3.25 Experimental spectrum of the SF6-·(H2O)2 complex (monitored by the
loss of one Ar atom, see top trace) as compared to the simulated spectra (MP2/TZVPP, scaled for anharmonicity, see text) of isomer (a), (b) and (c), Figure 3.24. (Simulations assume a Gaussian peak shape and a FWHM of 6 cm-1)
One could argue that there is some small intensity in that frequency region and that
also the intense peak at 3290 cm-1 could be ascribed to the occurrence of isomer (c) in
the ion beam. However, this seems highly unlikely since we observe a similar feature
also in the spectrum of the monohydrate at 3305 cm-1, which could be unambiguously
assigned to the overtone of the bending mode of the water ligand. This mode is
expected to appear in the spectrum of the dihydrate as well, which should either lead
89
to the occurrence of several bands in this frequency region (which is not observed) or
a broadening of the peak in question due to the overlap of the two bands of different
origin. Given the sharpness of this feature and the absence of an intense signature of a
water-water hydrogen bond, it seems to be justified to exclude isomer (c) from the list
of possible candidates. It is more difficult, however, to decide which of the two
isomers (a) or (b) is dominant in the molecular beam, as both their simulated spectra
match the experimental one fairly well and the calculated energy difference (6 meV)
does not allow for exclusion of isomer (b) from our experiment based on the accuracy
of the performed calculations. More refined theoretical investigations would be
desirable to resolve this issue employing more sophisticated computational methods.
3.4.3.3. SF6-·(H2O)3
As the onset of water-water bonding interactions could not be observed in the
dihydrate, the trihydrate was also studied in order to determine the minimal amount
necessary to start water networks. The spectrum of the trihydrate is shown in Figure
3.26. A comparison of the three spectra reveals a drastic change in the vibrational
pattern, proving the bonding interactions of the water molecules must change
dramatically. Specifically, two broad peaks are observed ~ 3270 cm-1 and
~ 3347 cm-1, which are assigned to the overlapping bands of the bend overtones of the
water ligands and the IHB bands (ionic H bonds, signatures of the OH groups
hydrogen bonded to the anion), respectively, following the interpretation of the
similar bands in the mono- and dihydrate. The IHB bands are red shifted upon
attaching a water molecule to the SF6-·(H2O)2 due to cooperative hydrogen bonding
effects by about ~ 77 cm-1. This has been observed in similar cases before, e.g. for
the hydration of iodide.9,23 The broadness of these bands as compared to the
analogous features in the spectra of the mono- and dihydrate may be due to the
presence of several isomers in the ion beam. Moreover, the appearance of two sharp
bands at ~ 3529 cm-1 and at ~ 3574 cm-1 in the frequency region characteristic for the
spectral signatures of interwater hydrogen bonds suggests the onset of a hydrogen
bonded water network.
90
2800 3000 3200 3400 3600 3800
Photon Energy [cm-1]
n=3
Pho
tofra
gmen
t Sig
nal [
arb.
uni
ts]
n=2
νas
n=1νs
2B
Figure 3.26 Infrared spectra of SF6-·(H2O)n·Ar (n = 1 - 3) monitored by Ar loss;
νs – symmetric OH stretching mode of the water ligand; νas – antisymmetric OH stretching mode of the water ligand, 2B – bending overtone of the water ligand; dotted lines mark combinations bands of the bending overtone and the IHB band (νs) with the water rocking mode
A sharp feature at 3685 cm-1 indicates the presence of at least one free OH group. In
order to get a more detailed idea about the structure of the cluster anion beyond this
empirical assessment, we performed again an exploratory search for minimum energy
structures on the potential energy surface. However, due to the flatness of the latter
and the large number of possible isomers we restricted ourselves to geometries based
on obvious expectations for the ground state structure, for instance the existence of
some water-water hydrogen bonds. Specifically, Figure 3.27 shows two isomers.
91
(a)E = 0 meV
(b)E = 37 meV
Figure 3.27 Structures of the isomers lowest in energy of the SF6-·(H2O)3 complex.
Dotted lines indicate hydrogen bonds. Relative energies are based on MP2 calculations with a TZVPP basis set for all atoms.
Isomer (a) displays a “ring-like” water sub-cluster, in which all three water molecules
are attached to one another and to the anion in hydrogen bonds at the same time. This
motif has been found to be the most stable structure in the halide trihydrates, e.g.
I-·(H2O)3. It should be noted though, that the water molecules in this case are not all
equivalent as two of them are rather weakly tethered to the anion, while only one is
involved in a strong hydrogen bond to the SF6-. The SF bond involved in this
interaction is significantly lengthened to ~ 194 pm as compared to the approximately
92
undisturbed ~ 173 pm of the other two SF bonds. This kind of distortion of the
geometry of the SF6- core anion occurs similarly in the mono- and dihydrate (compare
preceding paragraphs) and will be rediscussed in terms of the reactivity of the SF6-
moiety in the next section. The second structure in Figure 3.27 is based on the isomer
found to be lowest in energy for the SF6-·(H2O)2 (isomer (a) in Figure 3.24), meaning
that two water molecules are bound to one fluorine atom in a shared attack, while the
third one is attached both to the SF6- anion and to one of the other water ligands via
hydrogen bonds. It is calculated to be higher in energy than the ring-like structure by
37 meV. The spectra of the two species under consideration have been simulated on
the same footing as in the case of the dihydrates in the preceding section (harmonic
approximation, but scaled with a uniform scaling factor k = 0.947 to account for
anharmonicity in an approximate way) and the result is shown in Figure 3.28 along
with the experimental spectrum of the trihydrate as monitored by loss of one Ar atom
to demonstrate the relative accordance. The spectrum of isomer (b) seems to be a
better match to the experimental spectrum as it mirrors the free OH, the IHB and the
interwater bands rather well (the bend overtone is an anharmonic effect and therefore
not recovered by our harmonic simulations). This may mean that isomer (b) is the
dominating isomer in the molecular beam, despite the fact that it is placed higher in
energy than the ring isomer by the calculations. However, we stress again that the
spectrum does not at all exclude the existence of several isomers at the same time
under the experimental conditions and that the calculations performed are by no
means an exhaustive search for minimum structures but rather educated guesses of
the most likely structures.
93
Pho
tofra
gmen
t Sig
nal
[arb
. uni
ts] SF6
-·(H2O)3·Ar
b
2800 3000 3200 3400 3600 3800
a
Cal
c. In
tens
ity
[arb
. uni
ts]
Photon Energy [cm-1]
Figure 3.28 Experimental spectrum of the SF6-·(H2O)3 (monitored by the loss of
one Ar atom, see top trace) as compared to the simulated spectra (MP2/TZVPP, scaled for anharmonicity, see text) of isomer (a) and (b), Figure 3.27. The simulation for isomer (b) fits the experimental spectrum better, although it is higher in energy than isomer (a) (Simulations assume a Gaussian peak shape and a FWHM of 6 cm-1)
3.4.3.4. Structures of the SF6-·(H2O)n (n = 1 - 3) clusters and
implications for their reactivity
In spite of our intense efforts, we were unsuccessful in triggering any reaction within
the SF6-·(H2O)n (n = 1 - 3) complexes upon excitation with a mid-IR photon.
However, Arnold et al. have reported reactions between the SF6- anion and water in
an ion flow tube experiment at room temperature,75 with formation of SOF4- as the
94
main reaction channel. The structures which have been determined to represent the
ground states of the respective clusters in accordance with the experimentally
monitored infrared spectra are still useful in order to elucidate the reaction
mechanisms involved. The SF bond involved in the strong hydrogen bonding
interaction with one or several of the water ligands is significantly stretched from
~ 171 pm in the bare SF6- anion to ~ 196 pm in the monohydrate. This implies that
attachment of a water molecule leads to localization of electron density in the
antibonding σ* orbital of the respective SF group, diminishing it consequentially in
other parts of the molecule. This can be illustrated in a plot of the highest occupied
molecular orbital (HOMO) of the SF6-·(H2O) complex, shown in Figure 3.29.
Figure 3.29 Highest occupied molecular orbital (HOMO) of the SF6-·(H2O)
complex. The localization of negative charge by the presence of the water ligand is clearly visible.
The latter effect manifests itself as a contraction of the SF bond opposite to the
“bonding” SF group down to ~ 160 pm from the ~ 171 pm in bare SF6-. These
findings help to understand the first steps in the reactions of the SF6- moiety with
protic solvents as described by Arnold et al., attachment of a water molecule seems
95
to lead to a significant weakening of the SF bond which serves as “anchor” for the
ligand, thereby lowering the reaction barrier in collisions of the ion-molecule
complex with additional water molecules. It is interesting to note in that context, that
the kinetics of these reactions revealed that two solvent molecules were necessary to
initiate a reaction leading to products other than the association complex:75,76
SF6- + H2O → SF6
-·H2O (3.1)
SF6-·H2O + H2O → SOF4
- + 2HF + H2O (3.2)
The structures at higher hydration levels possess some interesting properties in line
with these findings. In the dihydrates, the SF bond involved in the hydrogen bond to
the water ligand is stretched even further (~ 206 pm) than in the monohydrate
(~ 196 pm), implying that the dissociation threshold is approached upon increasing
the number of ligands in the solvation shell. This trend is consistent for both low
energy isomers (isomer (a) and (b) in Figure 3.24) determined before to be
appropriate candidates for matching the experimental infrared spectrum. Increasing
the hydration to the trihydrate, the calculations indicate that the SF bond length is
only marginally further increased to ~ 207 pm in isomer (b), while it even shrinks
slightly in the case of isomer (a). The special role the attachment of the first two water
molecules play in this system is further corroborated by taking a closer look at the
binding energies between anion and ligands: for the monohydrate, it is calculated
(MP2 level of theory) to amount to ~ 0.45 eV and increases for the second water
molecule to ~ 0.48 eV: this is counterintuitive behavior at first glance, as the binding
energy of solvent molecules to an anion is usually expected to drop monotonically
upon increasing their number. This is compatible with the cooperative behavior in the
binding mechanism of the first two water molecules to the SF6- anion. Contrary to this
behavior, the binding energy drops again for the third water molecule to ~ 0.43 eV,
below the value for both the first and the second ligand. Unfortunately, there are no
experimental values available for the binding energies to verify these computational
results, and it must be cautioned that the level of theory applied in the presented
calculations might not be high enough to provide a detailed and reliable background
96
for further interpretation, particularly in the limit of dissociation and reaction of the
systems under consideration. The difference in the values presented above is therefore
probably within the error bars of the employed methods. However, they might serve
at least as a guideline, in light of the fact that the trend that water molecules promote
SF bond breaking seems to be clear. Moreover, they support the assumption that the
attachment of the first two water molecules happens in a cooperative fashion,
eventually leading to the observation of a cluster-mediated reaction, while the third
one does not. However, no reactions could be triggered upon excitation of the
SF6-·(H2O)n (n = 1 - 3) clusters, implying the reaction barrier is not low enough that
absorption of one photon in this frequency range would deposit sufficient energy into
the cluster to enable the previously observed reaction products. This implies that the
reaction barrier must be higher than ~ 0.40 - 0.45 eV (3200 – 3600 cm-1). In order to
understand the energetic requirements we calculated the reaction enthalpies of some
candidate reactions. The reaction channel observed experimentally by Arnold et al.75
is calculated to be endothermic by ~ 1.6 eV. However, it may be overly simplistic to
focus on proton transfer as the crucial step alone. In order to arrive at the
experimentally observed reaction products more steps need to be involved, and the
nature of the potential energy surface along the reaction path is presently unclear. It is
interesting in this context to exchange the solvent molecule for one with a higher
97
acidity in order to shed more light on the reaction channels and the energetic barriers
involved. A very suitable candidate is formic acid, as its acidity is noticeably higher
than those of water or alcohols. The results of an infrared study on the SF6-·HCOOH
complex as compared to the water clusters described here are presented in the next
chapter.
3.4.3.5. Summary and conclusions
The mid-infrared spectra of the SF6-·(H2O)n (n = 1 - 3) clusters have been measured.
The structures of the ground state geometries could be identified with the aid of
accompanying calculations at the MP2 level of theory. The monohydrate was found
to display a rather distinct SHB motif, with the water molecule strongly hydrogen
bonded to one SF group, the bond length of which is in turn considerably increased,
while the remaining OH group is only weakly tethered to one of the neighboring
fluorine atoms. Surprisingly, the dihydrate shows the same overall spectral pattern,
and indeed the isomers lowest in energy are found to have the two water ligands
bound in a shared attack on one SF group in a cooperative manner, even further
lengthening its bond. This is unusual in light of the fact that most anions solvated
with two water molecules already show the onset of water-water hydrogen bonding
interactions, with the exception of some small anions with a strong proton affinity
such as F-. Only for the trihydrate (and presumably for larger clusters) the formation
of water networks is found. No reactions could be triggered upon absorption of one
infrared photon by the respective cluster chromophores, despite an active search for
fragment ion products. However, the cooperative effects in the binding behavior of
the first two water molecules are in line with some earlier findings that the reactions
between the SF6- anion and protic solvent molecules proceed via a cluster-mediated
pathway.75,76 The fact that protic molecules seem to react readily with the anionic
moiety and that attachment of water molecules to the SF6- anion leads to a
considerable weakening of one of the SF groups points towards a reaction mechanism
in which at least one of the initial steps involves proton transfer from one of the
ligand molecules.
98
3.5. References for Chapter III 1 D. H. Powell, G. W. Neilson, and J. E. Enderby, Journal of Physics-
Condensed Matter 5 (32), 5723 (1993); G. W. Neilson, P. E. Mason, S. Ramos, and D. Sullivan, Philosophical Transactions of the Royal Society of London Series a-Mathematical Physical and Engineering Sciences 359 (1785), 1575 (2001).
2 G. A. Krestov, Ionic Solvation. (Prentice Hall, 1994); I. S. Perelygin and N. R.
Safiullina, Zh. Strukt. Khim. 8, 205 (1967). 3 G. E. Walrafen, Journal of Chemical Physics 47 (1), 114 (1967). 4 S. S. Xantheas, Journal of Physical Chemistry 100 (23), 9703 (1996). 5 C. Bassmann, U. Boesl, D. Yang, G. Drechsler, and E. W. Schlag,
International Journal of Mass Spectrometry and Ion Processes 159, 153 (1996).
6 P. Ayotte, G. H. Weddle, J. Kim, J. Kelley, and M. A. Johnson, Journal of
Physical Chemistry A 103 (4), 443 (1999). 7 P. Ayotte, G. H. Weddle, J. Kim, and M. A. Johnson, Journal of the American
Chemical Society 120 (47), 12361 (1998). 8 P. Ayotte, J. A. Kelley, S. B. Nielsen, and M. A. Johnson, Chemical Physics
Letters 316 (5-6), 455 (2000). 9 W. H. Robertson and M. A. Johnson, Annual Review of Physical Chemistry
54, 173 (2003). 10 S. S. Xantheas and T. H. Dunning, Journal of Physical Chemistry 98 (51),
13489 (1994). 11 W. H. Robertson, E. A. Price, J. M. Weber, J. W. Shin, G. H. Weddle, and M.
A. Johnson, J. Phys. Chem. A 107 (34), 6527 (2003). 12 B. F. Yates, H. F. Schaefer, T. J. Lee, and J. E. Rice, Journal of the American
Chemical Society 110 (19), 6327 (1988). 13 E. A. Price, W. H. Robertson, E. G. Diken, G. H. Weddle, and M. A. Johnson,
Chemical Physics Letters 366 (3-4), 412 (2002). 14 W. H. Thompson and J. T. Hynes, Journal of the American Chemical Society
122 (26), 6278 (2000).
99
15 K. Hermansson, Journal of Chemical Physics 99 (2), 861 (1993). 16 E. A. Woronowicz, W. H. Robertson, G. H. Weddle, M. A. Johnson, E. M.
Myshakin, and K. D. Jordan, Journal of Physical Chemistry A 106 (31), 7086 (2002).
17 P. Jungwirth and D. J. Tobias, Chemical Reviews 106 (4), 1259 (2006); P.
Jungwirth and D. J. Tobias, Journal of Physical Chemistry A 106 (2), 379 (2002); P. Jungwirth and D. J. Tobias, Journal of Physical Chemistry B 105 (43), 10468 (2001); P. Jungwirth and D. J. Tobias, Journal of Physical Chemistry B 106 (25), 6361 (2002).
18 P. Ayotte, G. H. Weddle, J. Kim, and M. A. Johnson, Chemical Physics 239
(1-3), 485 (1998). 19 P. Ayotte, S. B. Nielsen, G. H. Weddle, M. A. Johnson, and S. S. Xantheas, J.
Phys. Chem. A 103 (50), 10665 (1999). 20 F. Huisken, M. Kaloudis, and A. Kulcke, Journal of Chemical Physics 104
(1), 17 (1996); G. P. Ayers and A. D. E. Pullin, Spectrochimica Acta Part a-Molecular and Biomolecular Spectroscopy 32 (10), 1629 (1976).
21 W. H. Robertson, E. G. Diken, E. A. Price, J. W. Shin, and M. A. Johnson,
Science 299 (5611), 1367 (2003). 22 H. Kawamata, T. Maeyama, and N. Mikami, Chemical Physics Letters 370 (3-
4), 535 (2003). 23 P. Ayotte, G. H. Weddle, and M. A. Johnson, J. Chem. Phys. 110 (15), 7129
(1999). 24 O. M. Cabarcos, C. J. Weinheimer, J. M. Lisy, and S. S. Xantheas, Journal of
Chemical Physics 110 (1), 5 (1999). 25 E. A. Price, N. I. Hammer, and M. A. Johnson, Journal of Physical Chemistry
A 108 (18), 3910 (2004). 26 D. Y. Wu, S. Duani, X. M. Liu, Y. C. Xu, Y. X. Jiang, B. Ren, X. Xu, S. H.
Lin, and Z. Q. Tian, Journal of Physical Chemistry A 112 (6), 1313 (2008). 27 C. G. Zhan and S. Iwata, Chemical Physics Letters 232 (1-2), 72 (1995). 28 M. S. Taylor, F. Muntean, W. C. Lineberger, and A. B. McCoy, Journal of
Chemical Physics 121 (12), 5688 (2004).
100
29 F. Misaizu, K. Tsukamato, M. Sanekata, and K. Fuke, Laser Chemistry 15 (2-4), 195 (1995); G. J. Rathbone, T. Sanford, D. Andrews, and W. C. Lineberger, Chemical Physics Letters 401 (4-6), 570 (2005).
30 D. van Heijnsbergen, G. von Helden, G. Meijer, P. Maitre, and M. A. Duncan,
Journal of the American Chemical Society 124 (8), 1562 (2002); T. D. Jaeger, D. van Heijnsbergen, S. J. Klippenstein, G. von Helden, G. Meijer, and M. A. Duncan, Journal of the American Chemical Society 126 (35), 10981 (2004); M. A. Duncan, International Reviews in Physical Chemistry 22 (2), 407 (2003); B. M. Reinhard, A. Lagutschenkov, J. Lemaire, P. Maitre, P. Boissel, and G. Niedner-Schatteburg, J. Phys. Chem. A 108 (16), 3350 (2004); J. M. Lisy, International Reviews in Physical Chemistry 16 (3), 267 (1997); T. D. Vaden, C. J. Weinheimer, and J. M. Lisy, Journal of Chemical Physics 121 (7), 3102 (2004); D. van Heijnsbergen, G. von Helden, M. A. Duncan, A. J. A. van Roij, and G. Meijer, Physical Review Letters 83 (24), 4983 (1999); M. A. Duncan, International Journal of Mass Spectrometry 200 (1-3), 545 (2000); A. Fielicke, G. Meijer, and G. von Helden, Journal of the American Chemical Society 125 (12), 3659 (2003).
31 M. L. Kimble and A. W. Castleman, International Journal of Mass
Spectrometry 233 (1-3), 99 (2004); U. Heiz and E. L. Bullock, Journal of Materials Chemistry 14 (4), 564 (2004); L. D. Socaciu, J. Hagen, T. M. Bernhardt, L. Woste, U. Heiz, H. Hakkinen, and U. Landman, Journal of the American Chemical Society 125 (34), 10437 (2003); H. Häkkinen, W. Abbet, A. Sanchez, U. Heiz, and U. Landman, Angewandte Chemie-International Edition 42 (11), 1297 (2003); A. Sanchez, S. Abbet, U. Heiz, W. D. Schneider, H. Häkkinen, R. N. Barnett, and U. Landman, J. Phys. Chem. A 103 (48), 9573 (1999).
32 B. Yoon, H. Hakkinen, U. Landman, A. S. Worz, J. M. Antonietti, S. Abbet,
K. Judai, and U. Heiz, Science 307 (5708), 403 (2005). 33 M. L. Kimble, A. W. Castleman, R. Mitric, C. Burgel, and V. Bonacic-
Koutecky, Journal of the American Chemical Society 126 (8), 2526 (2004); A. S. K. Hashmi and G. J. Hutchings, Angewandte Chemie-International Edition 45 (47), 7896 (2006); S. Chretien, S. K. Buratto, and H. Metiu, Current Opinion in Solid State & Materials Science 11 (5-6), 62 (2007).
34 M. S. Chen and D. W. Goodman, Chemical Society Reviews 37 (9), 1860
(2008). 35 A. S. Worz, U. Heiz, F. Cinquini, and G. Pacchioni, Journal of Physical
Chemistry B 109 (39), 18418 (2005). 36 E. S. Kryachko, Journal of Molecular Structure 880 (1-3), 23 (2008); W.
Zheng, X. Li, S. Eustis, A. Grubisic, O. Thomas, H. de Clercq, and K. Bowen,
101
Chemical Physics Letters 444 (4-6), 232 (2007); M. S. Taylor, J. Barbera, C. P. Schulz, F. Muntean, A. B. McCoy, and W. C. Lineberger, Journal of Chemical Physics 122 (5) (2005); F. Misaizu, K. Tsukamoto, M. Sanekata, and K. Fuke, Surface Review and Letters 3 (1), 405 (1996).
37 F. Muntean, M. S. Taylor, A. B. McCoy, and W. C. Lineberger, Journal of
Chemical Physics 121 (12), 5676 (2004). 38 R. G. Parr and W. Yang, Density-Functional Theory of Atoms and Molecules.
(Oxford University Press, New York, 1989). 39 A. D. Becke, Physical Review A 38 (6), 3098 (1988); C. T. Lee, W. T. Yang,
and R. G. Parr, Physical Review B 37 (2), 785 (1988). 40 A. Schäfer, C. Huber, and R. Ahlrichs, J. Chem. Phys. 100 (8), 5829 (1994). 41 R. Ahlrichs, M. Bär, M. Häser, H. Horn, and C. Kölmel, Chemical Physics
Letters 162 (3), 165 (1989). 42 H. Schneider, A. D. Boese, and J. M. Weber, J. Chem. Phys. 123, 084307
(2005). 43 R. C. Bilodeau, M. Scheer, and H. K. Haugen, Journal of Physics B-Atomic
Molecular and Optical Physics 31 (17), 3885 (1998); H. Hotop and W. C. Lineberger, Journal of Physical and Chemical Reference Data 14 (3), 731 (1985); D. G. Leopold, J. Ho, and W. C. Lineberger, Journal of Chemical Physics 86 (4), 1715 (1987).
44 T. Lenzer, I. Yourshaw, M. R. Furlanetto, G. Reiser, and D. M. Neumark,
Journal of Chemical Physics 110 (19), 9578 (1999). 45 S. A. Corcelli, J. A. Kelley, J. C. Tully, and M. A. Johnson, J. Phys. Chem. A
106 (19), 4872 (2002). 46 S. B. Nielsen, P. Ayotte, J. A. Kelley, and M. A. Johnson, Journal of
Chemical Physics 111 (21), 9593 (1999). 47 E. M. Myshakin, K. D. Jordan, E. L. Sibert, and M. A. Johnson, Journal of
Chemical Physics 119 (19), 10138 (2003). 48 P. C. Singh and G. N. Patwari, Journal of Physical Chemistry A 111 (16),
3178 (2007). 49 J. P. Gallivan and D. A. Dougherty, Organic Letters 1 (1), 103 (1999); Y.
Danten, T. Tassaing, and M. Besnard, Journal of Physical Chemistry A 103 (18), 3530 (1999).
102
50 T. M. Miller, J. M. Van Doren, and A. A. Viggiano, International Journal of Mass Spectrometry 233 (1-3), 67 (2004).
51 S. N. Eustis, D. Wang, K. H. Bowen, and G. N. Patwari, Journal of Chemical
Physics 127 (11) (2007). 52 G. W. Dillow and P. Kebarle, Journal of the American Chemical Society 111
(15), 5592 (1989). 53 R. J. Gulley, S. L. Lunt, J. P. Ziesel, and D. Field, Journal of Physics B-
Atomic Molecular and Optical Physics 31 (12), 2735 (1998). 54 M. Mitsui, A. Nakajima, and K. Kaya, Journal of Chemical Physics 117 (21),
9740 (2002); M. Mitsui, A. Nakajima, K. Kaya, and U. Even, Journal of Chemical Physics 115 (13), 5707 (2001).
55 S. A. Lyapustina, S. K. Xu, J. M. Nilles, and K. H. Bowen, J. Chem. Phys.
112 (15), 6643 (2000); J. Schiedt, W. J. Knott, K. Le Barbu, E. W. Schlag, and R. Weinkauf, J. Chem. Phys. 113 (21), 9470 (2000).
56 J. R. Reimers, R. O. Watts, and M. L. Klein, Chemical Physics 64 (1), 95
(1982). 57 H. Schneider, K. M. Vogelhuber, and J. M. Weber, J. Chem. Phys. 127,
114311 (2007). 58 I. V. Beregovaya and L. N. Shchegoleva, International Journal of Quantum
Chemistry 88 (4), 481 (2002). 59 F. Volatron and C. Roche, Chemical Physics Letters 446 (4-6), 243 (2007). 60 Y. M. Xie, H. F. Schaefer, and F. A. Cotton, Chemical Communications (1),
102 (2003). 61 T. Lenzer, I. Yourshaw, M. R. Furlanetto, N. L. Pivonka, and D. M. Neumark,
Journal of Chemical Physics 115 (8), 3578 (2001). 62 I. Becker and O. Cheshnovsky, Journal of Chemical Physics 110 (13), 6288
(1999). 63 S. T. Arnold, J. H. Hendricks, and K. H. Bowen, Journal of Chemical Physics
102 (1), 39 (1995). 64 M. Onda, H. Yamada, M. Mori, H. Miyazaki, and I. Yamaguchi, Journal of
Molecular Structure 319, 297 (1994).
103
65 W. R. Garrett, Physical Review A 3 (3), 961 (1971). 66 J. M. Weber, W. H. Robertson, and M. A. Johnson, Journal of Chemical
Physics 115 (23), 10718 (2001). 67 D. M. Neumark, K. R. Lykke, T. Andersen, and W. C. Lineberger, Journal of
Chemical Physics 83 (9), 4364 (1985). 68 E. P. Wigner, Physical Review 73 (9), 1002 (1948). 69 S. G. Frankiss and D. J. Harrison, Spectrochimica Acta Part a-Molecular and
Biomolecular Spectroscopy 31 (12), 1839 (1975). 70 J. M. Weber, J. A. Kelley, S. B. Nielsen, P. Ayotte, and M. A. Johnson,
Science 287 (5462), 2461 (2000). 71 W. T. Sturges, T. J. Wallington, M. D. Hurley, K. P. Shine, K. Sihra, A.
Engel, D. E. Oram, S. A. Penkett, R. Mulvaney, and C. A. M. Brenninkmeijer, Science 289 (5479), 611 (2000).
72 A. R. Ravishankara, S. Solomon, A. A. Turnipseed, and R. F. Warren, Science
259 (5092), 194 (1993). 73 R. J. Vanbrunt and J. T. Herron, Ieee Transactions on Electrical Insulation 25
(1), 75 (1990). 74 L. G. Huey, D. R. Hanson, and C. J. Howard, Journal of Physical Chemistry
99 (14), 5001 (1995). 75 S. T. Arnold and A. A. Viggiano, Journal of Physical Chemistry A 105 (14),
3527 (2001). 76 W. B. Knighton, D. R. Zook, and E. P. Grimsrud, Journal of the American
Society for Mass Spectrometry 1 (5), 372 (1990). 77 H. Schneider and J. M. Weber, J. Chem. Phys. 127, 244310 (2007). 78 N. R. Brinkmann and H. F. Schaefer, Chemical Physics Letters 381 (1-2), 123
(2003). 79 E. C. M. Chen, J. R. Wiley, C. F. Batten, and W. E. Wentworth, Journal of
Physical Chemistry 98 (1), 88 (1994). 80 F. Weigend and M. Häser, Theoretical Chemistry Accounts 97 (1-4), 331
(1997); F. Weigend, M. Häser, H. Patzelt, and R. Ahlrichs, Chemical Physics Letters 294 (1-3), 143 (1998).
104
81 G. L. Gutsev and R. J. Bartlett, Molecular Physics 94 (1), 121 (1998). 82 C. L. Lugez, M. E. Jacox, R. A. King, and H. F. Schaefer, Journal of
Chemical Physics 108 (23), 9639 (1998). 83 J. C. Bopp, J. R. Roscioli, M. A. Johnson, T. M. Miller, A. A. Viggiano, S. M.
Villano, S. W. Wren, and W. C. Lineberger, Journal of Physical Chemistry A 111 (7), 1214 (2007).
84 C. G. Bailey, J. Kim, C. E. H. Dessent, and M. A. Johnson, Chemical Physics
Letters 269 (1-2), 122 (1997).
105
4. Infrared-Triggered Reactions
4.1. Some general remarks on ion-molecule reactions Elucidation of the state-resolved dynamics of chemical reactions is one of the basic
problems of chemistry and necessary for a detailed understanding of the mechanisms
by which reactions are governed. Reactions involving anions are of particular interest,
as they play crucial roles in some of the most common reactions in organic chemistry,
e.g. substitutions, eliminations and reactions involving organometallic compounds
such as Grignard reactions, aldol condensations and many others.1 Moreover, anions
offer the advantage that they only rarely rearrange, in contrast to cations, for which
this is a frequently observed complication. Most of the reactions cited above are
extremely important in chemical synthesis and, of course, take place then in some sort
of solvent. When it comes to shedding light on ion-molecule reaction mechanisms, it
can be advantageous in many cases to study them in the gas phase despite some
differences which are inherently involved in removing the solvent molecules from the
reactants. However, the interpretation of most experiments conducted in solution
suffer from complications such as transport phenomena, cage effects, the presence of
counter ions and other solvation effects. Many of these problems can be circumvented
by studying the reactions of interest in the gas phase. In addition, experiments in the
gas phase have direct implications for photochemical reactions under atmospheric
conditions. Examples include dissociation of ground electronic state molecules
relevant in the atmosphere by vibrational overtone pumping.2 The influence of
solvent molecules on ion-molecule reactions may be investigated by attaching them to
the ions prior to reaction and stepwise increasing their number one at a time. This can
be easily achieved in experiments featuring mass selection, thereby offering another
advantage over condensed phase experiments. It is worthwhile to point out some
important differences between ion-molecule reactions proceeding in the condensed
phase versus gas phase. First, in the gas phase the reactions may take place at
substantial collisional energies due to the long range ion-dipole potential between the
106
reaction partners. This interaction will be effectively absorbed by the solvent
molecules in liquid phase, influencing orientation and reactivity of the reacting
molecules. Moreover, the reaction can be drastically influenced by differential
solvation effects, leading to considerable changes in the relative energy of reactants,
products and transition state. This can be illustrated by the example of the SN2
reaction. It is well-established that in liquid phase, the reaction displays a barrier
higher in energy than both reactants and products (the transition state corresponds to a
Walden inversion state [Y···R···X]-, compare Figure 4.1).3 In the gas phase, however,
a different pictures arises4,5 and a double-well shape for the potential energy surface
along this reaction has been established by Brauman and coworkers.6 The explanation
for the differences compared to the liquid phase can be found in the relative solvation
energies of the species involved: the reactant and product ions which display a
relatively localized negative charge are effectively solvated, resulting in considerable
stabilization. This is less true for the intermediate entrance and exit channel
complexes, and the comparatively diffuse transition state profits least from the
solvent stabilization effect, which is why the barrier height is increased in solution
relative to reactants and products.7 A schematic of the potential energy profile for the
reaction is shown in Figure 4.1 (from Ref.8). The multitude of fundamental problems
inherent even to such a relatively simple chemical reaction is reflected in the long-
standing interest, both experimentally and theoretically (compare Ref.4,5 and
references therein). Important questions related to nucleophilic substitutions range
from measurements of the thermal rate constants,9 reaction cross-sections and product
distributions at different translational energies10 to studies in variable temperature-
selected ion flow drift tube experiments11 and investigations on the complex
formation and attack mechanisms4 and time-resolved photoelectron spectroscopy
experiments,12 to name a few. Crossed molecular beam imaging experiments reveal
new subtle details on the mechanisms involved.8,13 Moreover, this reaction has been
studied by means of infrared predissociation spectroscopy.14
107
Figure 4.1 One-dimensional potential energy profile for a nucleophilic substitution (SN2) both in the gas phase and in solution (from Ref.8)
This approach offers several interesting features. First, it provides the opportunity to
study reactive intermediates “trapped” in their complex structures and thereby to
unambiguously identify their geometries. For example, it could be shown that the
entrance channel complex for the reaction
Cl- + CH3Br → Br- + CH3Cl (4.1)
108
adopts C3v symmetry, with the chloride ion attached to the hydrogen atoms of the
methyl group in a “pocket-like” conformation, resembling a backside attack of the
chloride anion (representing the nucleophile in this case). Another example for
elucidation of the structure of a trapped reactive intermediate using infrared
predissociation spectroscopy is the characterization of the OH-·HCH2· intermediate in
the O·- + CH4 reaction.15 In addition, Ar tagging offers the possibility of subtly tuning
the internal energy of the complexes under investigation. This was exploited in the
study on the reaction between the chloride anion and methylbromide, where Ar
tagging of the Cl-·CH3Br·Ar3 cluster allowed for the spectroscopic investigation of
this cold species, while in the case of the bare complex the reaction could be triggered
upon excitation with an infrared photon.
In this work, infrared predissociation spectra of the SF6-·HCOOH·Arn (n = 0 - 2) are
recorded. The complexes are investigated both with respect to their geometries and
their reaction behavior. The obtained results and interpretations are presented in the
next section.
4.2. Infrared Spectra of SF6-·HCOOH·Arn (n = 0 - 2):
Infrared-Triggered Reaction and Ar-Induced Inhibition
4.2.1. Introduction
The importance of the sulfur hexafluoride molecule in industrial applications and in
the atmosphere has already been pointed out in section 3.4. It has been described
there, too, that in some of the reactions involving SF6, its anion is thought to occur as
an intermediate, e.g. in electrical discharges. Moreover, it has been shown that the
SF6- anion does react with atmospheric trace gases16 and in ion flow tube experiments
at room temperature readily undergoes reaction with a number of protic ligands such
as water and alcohols with short aliphatic chains.17 These reactions are cluster-
mediated, which means they proceed through a stable anion-ligand complex that is
activated in subsequent collisions.17,18 The infrared predissociation spectra and the
109
structures of the SF6-·(H2O)n (n = 1 - 3) clusters have been described in detail in
section 3.4. For these species, no reactions were triggered by infrared absorption in
the region of the OH stretching fundamentals, presumably because the barrier
associated with this reaction is greater than the photon energy. However, the
calculations suggested a cooperative binding mechanism between the SF6- anion and
the first two water molecules, weakening the SF bond involved in the hydrogen
bonding to the water ligands considerably.19 In anion-molecule reactions, proton
transfer often dictates the shape of the potential energy surface governing the
behavior of the relevant particles.20 In the case of SF6-, dissociative proton transfer
could lead to the formation of HF molecules. Consequently, an increase in the acidity
of the ligand could lower the barrier to infrared photoactivation. Here, we present
infrared studies on complexes of SF6- with one formic acid molecule.
4.2.2. Calculations
Calculations on the SF6-·HCOOH complex have been performed by Skodje and
Takahashi.21 Briefly, both ab initio calculations employing second order Møller-
Plesset perturbation theory (MP2) and calculations based on density functional theory
(DFT) have been carried out. Two stable geometries were obtained (shown in Figure
4.2). The OH group is strongly hydrogen bonded to the SF6 moiety in both
geometries. The counterpoise corrected difference in energy between the isomers
(based on second order Møller-Plesset perturbation theory) is 168 meV, with isomer 1
being more stable. The vibrational frequencies of both isomers have been calculated
in the harmonic approximation. Moreover, for six selected modes of the formic acid
moiety anharmonicity was taken into account in a one-dimensional model (namely for
the C-H stretch, the O-H stretch, the C=O stretch, the O-H bend, the C-H bend, and
the C-O stretch).
110
Figure 4.2 Structures of the two lowest lying isomers of SF6-·HCOOH, isomer 1 is
the global minimum
To obtain an understanding of the effect of mode coupling, four three-dimensional
vibrational calculations were performed for isomer 1. Since the O-H and C-H
stretching modes have the strongest intensity in the relevant spectral region, the mode
coupling of the remaining four coordinates to those two stretching modes was
determined in the three-dimensional calculations. The calculation for the transition
state only converged at the DFT level of theory. Thus, all the tunneling analysis on
the reaction was performed using this method. The details of the theoretical methods
applied are to be published in Ref.22
111
4.2.3. Results and discussion
4.2.3.1. Structure and vibrational assignments
Figure 4.3 shows the infrared Ar predissociation spectra of the SF6-·HCOOH·Ar2,
SF6-·HCOOD·Ar2, and SF6
-·DCOOH·Ar2 complexes (no reactions other than Ar
evaporation have been found for these parent ions).
0
1
9
8
76543
SF6-·HCOOH·Ar2
2
0
Pho
tofra
gmen
t Sig
nal [
arb.
uni
ts]
SF6-·DCOOH·Ar2
2200 2400 2600 2800 3000 32000
SF6-·HCOOD·Ar2
Photon Energy [cm-1]
Figure 4.3 Vibrational Ar predissociation spectra of SF6-·HCOOH·Ar2,
SF6-·DCOOH·Ar2 and SF6
-·HCOOD·Ar2
112
The spectrum of SF6-·HCOOH·Ar2 displays two sharp, intense bands at 2710 and
2822 cm-1 (bands 7 and 9 in Figure 4.3), respectively, and several overlapping bands
between 2200 and 2500 cm-1. In order to guide the interpretation, it is instructive to
compare the present spectrum to the case of I-·HCOOH. Robertson et al.23 showed
earlier for this complex that the OH stretching vibration is shifted by ca. 800 cm-1 to
lower energies upon complexation. The CH stretching fundamental on the other hand
is red shifted by only ca. 100 cm-1 to 2845 cm-1, resulting in a change of the energetic
ordering of the two modes. In addition, they observed a strong band at 2740 cm-1
which they assigned to the CH bend overtone, gaining intensity through a Fermi
resonance with the close-lying OH stretching fundamental. It seems therefore
conceivable that the two strong, sharp bands in the spectrum of SF6-·HCOOH·Ar2 are
due to the CH bending overtone and the CH stretching fundamental, while the many
bands at lower energies result from Fermi resonances involving the OH stretching
fundamental. Assuming that Ar solvation does not significantly affect the vibrational
spectra, the experimental results can be compared to the vibrational calculations on
the bare SF6-·HCOOH complex. In Table 4.1, the vibrational frequencies and
intensities of both the fundamental and the first overtone of six important modes are
presented, calculated by the one-dimensional model (see section 4.2.2). It can be
clearly seen that the OH stretching fundamental is calculated to be strongly red
shifted by ~ 1100 cm-1 compared to the bare acid in both isomers. As a result of this
pronounced red shift, it falls into the spectral region where the broad multiplet of
bands is observed in the experimental spectrum. Moreover, the first overtone of the
C-O stretching vibration seems to be a suitable candidate for one of the peaks
observed in this region, interacting through a Fermi resonance with the OH stretching
fundamental. These findings corroborate the empirical assignment made above.
Moreover, only two sharp bands are observed in the CH stretching region (bands 7
and 9 in Figure 4.3) but the calculated frequencies for the two isomers found differ by
about 40 cm-1 for this mode, which means that the existence of several isomers in the
ion beam is very unlikely. One could argue that the two bands are the signatures of
two CH stretching bands of two different isomers themselves, however this seems to
be highly unlikely as well given that the experimental splitting is ~ 110 cm-1.
113
Table 4.1 Fundamental and overtone frequencies and intensities calculated by the one-dimensional model (see section 4.2.2) for the two isomers of SF6
This assumption is further supported by the fact that the spectrum is very similar for
the bare SF6-·HCOOH complex. If several isomers were at play, the relative
intensities of the bands should change upon Ar solvation due to different thermal
populations, which is not the case (see Figure 4.5). For more refined, anharmonic
calculations only the energetically more stable isomer 1 was treated. If we assume
that one of these two sharp bands is the signature of the CH stretching mode, then the
first two overtones of the CH and the OH bend mode are suitable candidates for the
second one, based on the calculations. However, the calculated intensities of these
two modes are ~ 100 times weaker than that of the CH stretching mode, which
directly shows the importance of mode coupling for the understanding of the
spectrum. The results of the three-dimensional calculations taking mode coupling into
account are shown in Table 4.2.
114
Table 4.2 Fundamental and overtone frequencies and intensities calculated by the three-dimensional model for isomer 1
Mode ∆v ω (cm-1) I (km/mol)
C-O str 1 1245 121.2 2 2477 2.0
CH bend 1 1414 5.6 2 2804 6.9
OH bend 1 1484 268.7 2 2975 75.2
C=O str 1 1770 595.3 2 3529 5.0
OH str 1 2465a, 2463b, 2433c, 2447d
3097.6a, 3119.9b, 3009.9c, 3018.5d
CH str 1 2949a, 2951b, 2949c, 2950d
58.7a, 52.5b, 39.7c, 55.2d
a: Calculated using the CH stretch, OH stretch, and C-O stretch modes. b: Calculated using the CH stretch, OH stretch, and the CH bend modes. c: Calculated using the CH stretch, OH stretch, and the OH bend modes. d: Calculated using the CH stretch, OH stretch, and the C=O stretch modes.
It can be seen that taking mode coupling into consideration causes the CH and OH
bend overtones to red shift by ~ 100 cm-1 and an increase in their intensities by an
order of magnitude, as it effectively enables them to borrow intensity from the strong
OH and CH fundamental transitions. Comparing the other modes it can be seen that
the mode coupling does not affect their peak positions; thus the simpler
one-dimensional model will be used for the deuterated species. As the intensities are
very sensitive to small coupling values, fully anharmonic vibrational calculations may
be needed to get the theoretical band positions and intensities to better match the
experimentally observed spectra. In order to unambiguously assign some of the
individual bands and to gain further insight into the interaction between them
115
especially in the lower frequency region, the Ar loss spectra of selectively deuterated
species have been measured as well. The spectra for both the complex deuterated in
the formyl position (SF6-·DCOOH·Ar2) and for the complex deuterated on the
carboxylic group (SF6-·HCOOD·Ar2) are shown in Figure 4.3. The results of the one-
dimensional vibrational calculations for the deuterated species are given in Table 4.3.
Table 4.3 Fundamental and overtone frequencies and intensities calculated by the one-dimensional model for SF6
Figure 4.6 Adiabatic potential energy curve along the intrinsic reaction coordinate (calculated at the DFT level of theory)
Figure 4.7 Evolution of relevant bond lengths along the reaction coordinate, see Figure 4.6 for the labeling of the atoms
122
Surprisingly, even the lowest calculated value for the reaction barrier (0.78 eV on the
DFT level) is much greater than the energy content of the complex after absorption of
an infrared photon (perturbation theory and coupled cluster based calculations using
the geometries given by the DFT method gave a much higher barrier of 1.82 and
1.25 eV, repectively). Hence, there is no direct way for the reactants to cross the
barrier and the only possibility for the reaction to proceed seems to be via tunneling
through the barrier close to the transition state. Since the reaction is a double
hydrogen transfer, the tunneling contribution is expected to be large. Based on the
experimental detection time of τ ~ 20µs the dependence of the effective quantum
yield on the internal vibrational energy can be calculated.21,22 It turns out that even
differences of a few hundred wavenumbers lead to drastic changes in the effective
quantum yield. This explains the difference in the relative intensities of the SF4- yield
in the OH stretching and CH stretching regions in the spectra of the SF6-·HCOOH·Arn
complexes for different n. For n = 0, there is no specificity of the reaction yield with
respect to the photon energy. In other words, the reaction efficiency is uniform over
the whole frequency region under study, according to the comparison of the SF4-
action spectrum for n = 0 with the Ar loss action spectrum for n = 2 (where the
evaporation efficiency is unity). The situation changes dramatically with Ar solvation.
The time scale for Ar evaporation (likely on the 10 – 100 ps time scale, see Ref.26 and
references therein) is probably much shorter than that for tunneling through the
reaction barrier in atomic rearrangement. This implies that the energy usable for SF6-
activation for n > 0 is lower than for n = 0 because of Ar evaporation upon IR
absorption. Consequently, we observe a photon energy dependence of the reaction
efficiency for n = 1, leading to inhibition of the reaction at lower photon energies
(i.e., in the OH stretching region). For n = 2, no SF4- formation was detectable,
implying a complete suppression of the reaction. The final result according to the PES
displayed in Figure 4.6 is formation of the [SF4···CO2···(HF)2]- complex. Due to the
excess energy available in this product complex, it will dissociate into the
experimentally observed [CO2···(HF)2]- product and SF4. A long-range electron
transfer may cause the electron on the CO2- to migrate to the SF4, resulting
predominantly in the SF4- production. However, to prove this hypothesis, a high level
123
multi-reference ab initio treatment would be needed, which at present was beyond the
available computational resources.
4.2.4. Summary and conclusions
The structures of the SF6-·HCOOH·Arn (n = 0 - 2) complex ions have been
investigated using infrared spectroscopy and ab initio calculations. It could be shown
that the formic acid ligand attaches to the SF6- anion via a hydrogen bond involving
the acidic proton, while the CH group is weakly tethered to a neighboring fluorine
atom. Complexes which are solvated by less than two Ar atoms undergo reactions
upon excitation with a mid-infrared photon, leading to three different fragmentation
products, namely SF4-, CO2
-·(HF)2 and CO2-·HF. A possible reaction pathway leading
to the SF4·CO2-·(HF)2 product channel was mapped out computationally and it could
be shown that the reaction proceeds predominantly via tunneling through the reaction
barrier. This assumption could be corroborated experimentally by studying the effects
of differential solvation with Ar atoms on the monitored infrared spectra, thereby
effectively varying the internal energy content of the respective anionic complex. No
mode specificity is observed for any of the fragmentation channels, meaning that
there exists probably no direct coupling between any of the excited modes and the
reaction coordinate. This study represents one of the few examples so far, where a
reaction in a cluster could be triggered directly upon excitation with one infrared
photon exciting fundamental vibrational transitions.
124
4.3. References for Chapter IV 1 C. H. DePuy, International Journal of Mass Spectrometry 200 (1-3), 79
(2000). 2 D. J. Donaldson, A. F. Tuck, and V. Vaida, Chemical Reviews 103 (12), 4717
(2003); V. Vaida, International Journal of Photoenergy 7 (2), 61 (2005); V. Vaida, K. J. Feierabend, N. Rontu, and K. Takahashi, International Journal of Photoenergy (2008); M. E. Dunn, G. C. Shields, K. Takahashi, R. T. Skodje, and V. Vaida, Journal of Physical Chemistry A 112 (41), 10226 (2008); K. Takahashi, K. L. Plath, R. T. Skodje, and V. Vaida, Journal of Physical Chemistry A 112 (32), 7321 (2008).
3 J. L. Gleave, E. D. Hughes, and C. K. Ingold, Journal of the Chemical Society,
236 (1935); C. K. Ingold, Structure and Reactivity in Organic Chemistry, 2nd ed. (Cornell University Press, Ithaca, NY, 1969).
4 B. Bogdanov and T. B. McMahon, Journal of Physical Chemistry A 110 (4),
1350 (2006). 5 J. K. Laerdahl and E. Uggerud, International Journal of Mass Spectrometry
214 (3), 277 (2002); S. Schmatz, Chemphyschem 5 (5), 600 (2004). 6 W. N. Olmstead and J. I. Brauman, Journal of the American Chemical Society
99 (13), 4219 (1977); J. I. Brauman, Journal of Mass Spectrometry 30 (12), 1649 (1995).
7 J. Chandrasekhar, S. F. Smith, and W. L. Jorgensen, Journal of the American
Chemical Society 107 (1), 154 (1985). 8 J. I. Brauman, Science 319 (5860), 168 (2008). 9 S. E. Barlow, J. M. Vandoren, and V. M. Bierbaum, Journal of the American
Chemical Society 110 (21), 7240 (1988). 10 L. A. Angel and K. M. Ervin, Journal of the American Chemical Society 125
(4), 1014 (2003). 11 A. A. Viggiano, R. A. Morris, J. S. Paschkewitz, and J. F. Paulson, Journal of
the American Chemical Society 114 (26), 10477 (1992). 12 R. Wester, A. E. Bragg, A. V. Davis, and D. M. Neumark, Journal of
Chemical Physics 119 (19), 10032 (2003).
125
13 J. Mikosch, S. Trippel, C. Eichhorn, R. Otto, U. Lourderaj, J. X. Zhang, W. L. Hase, M. Weidemuller, and R. Wester, Science 319 (5860), 183 (2008); S. Feil, Chemie in Unserer Zeit 42 (2), 67 (2008).
14 P. Ayotte, J. Kim, J. A. Kelley, S. B. Nielsen, and M. A. Johnson, Journal of
the American Chemical Society 121 (29), 6950 (1999). 15 E. G. Diken, G. H. Weddle, J. M. Headrick, J. M. Weber, and M. A. Johnson,
J. Phys. Chem. A 108 (46), 10116 (2004). 16 L. G. Huey, D. R. Hanson, and C. J. Howard, Journal of Physical Chemistry
99 (14), 5001 (1995). 17 S. T. Arnold and A. A. Viggiano, Journal of Physical Chemistry A 105 (14),
3527 (2001). 18 W. B. Knighton, D. R. Zook, and E. P. Grimsrud, Journal of the American
Society for Mass Spectrometry 1 (5), 372 (1990). 19 H. Schneider and J. M. Weber, J. Chem. Phys. 127, 244310 (2007). 20 E. A. Price, W. H. Robertson, E. G. Diken, G. H. Weddle, and M. A. Johnson,
Chemical Physics Letters 366 (3-4), 412 (2002); J. M. Weber, J. A. Kelley, W. H. Robertson, and M. A. Johnson, Journal of Chemical Physics 114 (6), 2698 (2001); P. Ayotte, J. A. Kelley, S. B. Nielsen, and M. A. Johnson, Chemical Physics Letters 316 (5-6), 455 (2000); K. Kawaguchi and E. Hirota, Journal of Chemical Physics 84 (6), 2953 (1986).
21 K. Takahashi, private communication. 22 H. Schneider, Takahashi, K., Skodje, R.T., Weber, J.M., in preparation
(2009). 23 W. H. Robertson, J. A. Kelley, and M. A. Johnson, Journal of Chemical
Physics 113 (18), 7879 (2000). 24 J. Almlof, A. Lund, and K. A. Thuomas, Chemical Physics Letters 28 (2), 179
(1974); M. E. Jacox and D. E. Milligan, Chemical Physics Letters 28 (2), 163 (1974); D. W. Ovenall and D. H. Whiffen, Molecular Physics 4 (2), 135 (1961); J. W. Shin, N. I. Hammer, M. A. Johnson, H. Schneider, A. Glöss, and J. M. Weber, J. Phys. Chem. A 109 (14), 3146 (2005).
25 M. Knapp, O. Echt, D. Kreisle, T. D. Mark, and E. Recknagel, Chemical
Physics Letters 126 (3-4), 225 (1986).
126
26 H. Schneider, K. M. Vogelhuber, F. Schinle, J. F. Stanton, and J. M. Weber, Journal of Physical Chemistry A 112 (33), 7498 (2008); X. Y. Hong, S. Chen, and D. D. Dlott, Journal of Physical Chemistry 99 (22), 9102 (1995); S. Shigeto, Y. Pang, Y. Fang, and D. D. Dlott, Journal of Physical Chemistry B 112 (2), 232 (2008); T. Maeyama, I. Yagi, Y. Murota, A. Fujii, and N. Mikami, Journal of Physical Chemistry A 110 (51), 13712 (2006); Y. Yamada, J. Okano, N. Mikami, and T. Ebata, Chemical Physics Letters 432 (4-6), 421 (2006).
coordination to a metal ion) and, of course, combinations of all these possibilities.
The role of aromatic molecules in anion recognition is described in the next section.
129
5.2. Aromatic molecules in anion recognition
The coordination of ions to aromatic molecules offers a new route towards the design
of a new versatile class of host molecules. The interactions between cations and
aromatic molecules is well understood.11 They constitute relatively strong
non-covalent interactions, with the main contributions stemming from electrostatics,
such as interaction of partial charges and charge-induced polarization.12 The
supramolecular chemistry of anions in general and their interaction with aromatic
units specifically is far less developed. This is partially due to the counterintuitive
nature of these interactions, as anions are expected to exhibit repulsive interactions
with the negative π electron clouds of aromatic molecules, but also to the
experimental challenges involved with the coordination chemistry of anions, as has
been outlined in section 5.1.5,13,14 Based on the knowledge about cation-π interactions,
the question arose if similar binding motifs could be possible for anions, if the
electrostatic potential of the aromatic unit was reversed by introduction of appropriate
electron-withdrawing substituents. Moreover, it has been well-known that benzene
and hexafluorobenzene adopt a “face-to-face” stacking motif in the case of a 1:1
mixture15 (accompanied by a substantial increase in the melting point as compared to
each compound). This behavior can be rationalized in view of the favorable
quadrupole-quadrupole interaction between the two molecules, since they both
possess a quadrupole moment which is approximately the same with respect to
magnitude, but opposite in sign, due to the fact that an sp2 carbon atom is more
electronegative than a hydrogen, but less electronegative than a fluorine atom.16 The
calculated (electrostatic) potential energy surfaces of these two species are shown in
Figure 5.1. The sign and magnitude of the quadrupole moments are expected to exert
a strong influence on the binding motifs between these aromatic molecules and
anions. A schematic representation, including the expected binding motifs between an
anion and benzene and hexafluorobenzene, respectively, are displayed in Figure 5.2.
130
Figure 5.1 Illustration of the electrostatic potential around C6H6 (left) and C6F6 (right) (calculated with Gaussian03W, HF/3-21G* level17). The color coding from blue to red represents positive to negative electrostatic potentials.
Figure 5.2 Schematic representations of the quadrupole moments of benzene (left) and hexafluorobenzene (right) and their suggested interaction motifs with an anionic moiety
131
This triggered several theoretical studies,18-24 e.g. an investigation of the interaction
between hexafluorobenzene and a number of small anions.24 It was found that in all
cases under consideration the interactions are favorable, meaning that stable
complexes of this kind should exist. However, the ground state geometries
determined differed for the various anions considered, with the expected binding
motif where the anion is bound to the top of the aromatic ring in a so called anion-π
interaction being the most stable one for the Cl- and Br- anions. In contrast, in the case
of F- and CO32- anions the minimum energy structures were found to be reminiscent
of a nucleophilic attack of the respective anions on one of the carbon atoms of the
aromatic ring. It could also be established that the non-covalent interactions (coined
“anion-π interactions”24) are dominated by the interaction between the anion and the
quadrupole moment of the electron-deficient aromatic unit and polarization
contributions, with the latter dominating for systems with only small positive
quadrupole moments.13,24 Crystallographic data from a search of the Cambridge
Structural Database (CSD) provided evidence for the occurrence of such anion-π
interactions in crystal structures. Further studies showed similar results for a number
of other modified benzene molecules, such as 1,3,5-trinitrobenzene,
1,3,5-trifluorobenzene,23 hexazine, s-triazine, trifluoro-1,3,5-triazine21 and derivatives
of those species with differing substituents.13 Additionally, larger anions such as
[BF4]- and [PF6]-, which are commonly used as counterions in organometallic
chemistry, show favorable anion-π interactions as well, as has been demonstrated for
the case of trifluoro-s-triazine.25 Moreover, it could be shown that even aromatic rings
which are not per se electron-deficient can be modified to make the interaction with
anions still favorable by complexing them with a metallic cationic atom on the
opposite side of the aromatic ring with respect to the anion,26 showing that strong
synergistic effects are involved in the interplay between cation-π and anion-π
interactions.22,27 Also, it has been demonstrated that these anion-π interactions are
approximately additive,20 offering potentially the possibility of designing appropriate
host molecules to bind anions selectively even in the presence of other, competing
interactions (e.g. with the solvent). In spite of these theoretical studies which proved
anion-π interactions to be energetically favorable (with their strengths typically
132
varying between 10 - 50 kJ/mol),28 there is still a paucity of experimental data
available. Relatively few crystal structures with this kind of binding motif for
complexation of free halides could be clearly identified,29,30 although there is an
increasing amount of experimental results which support the attractive interaction
between anions and electron-deficient arenes, mainly based on crystallographic
studies (see Ref.14 and references therein). However, solution studies providing data
on anion-π interactions are even more scarce,30,31 and recent experiments on the
solution behavior of halide anions with some highly electron-deficient arenes such as
tetracyanobenzene, trinitrotoluene, tetracyanopyrazine and others yielded data which
were not in accordance with a non-covalent interaction between anions and aromatic
molecules.32 This suggests that in many cases several possible binding motifs
compete with one another, preventing anion-π interactions to occur abundantly
despite their favorable energetics, although they might still contribute to the overall
stability and geometric appearance of these complexes. Intense color changes were
observed upon adding the tetraalkyammonium salts of Cl-, Br- or I- to solutions
containing these electron-deficient arenes, indicating that charge-transfer (CT) takes
place in the complexes, which would be incompatible with weak anion-π interactions,
as by definition they exclude considerable amounts of charge transfer.32 These
discoveries prompted further investigations of the nature of the binding of halide
anions to electron-deficient arenes, revealing eventually that the halide ions are
commonly found in geometries deviating considerably from the structural motif
suggested by pure anion-π interactions (for which the anion is expected to be bound
to the top of the aromatic ring with a 90° angle between the axis connecting the halide
ion to the center of the aromatic ring and the plane defined by the carbon atoms of the
latter).28,33 In fact, four different binding motifs were identified to dominate the
interactions between aromatic molecules and anions, with the anion-π interaction
described above being just one of them: strongly covalent σ-complexes (with a short
distance between anion and carbon atom, which ultimately adopts an sp3 hybridized
Figure 5.3 Illustration of possible binding motifs for the interaction of anions with electron-deficient arenes on the example of MP2/aug-cc-pVDZ optimized geometries for Cl- complexes with tetracyanobenzene (from Ref.28)
Strongly covalent σ-complexes correspond to a nucleophilic attack of the respective
anion on one of the carbon atoms of the aromatic ring. The result is a strong, covalent
σ bond between the two reaction partners, with the attacked carbon atom taking on a
sp3 hybridized, tetrahedral local geometry and the aromaticity of the arene ring being
lost. This binding motif is the only stable structural motif for the fluorine anion
placed on top of electron-deficient aromatic rings, as has been mentioned already
above.24 In fact, this is the structure of the so-called “Meisenheimer-complex” or
“σ-complex”,34 long known to be a reactive intermediate in the aromatic nucleophilic
134
substitution reaction, which is the analogue to the electrophilic substitution reaction
for electron-deficient aromatic systems. Examples in which strongly bound
σ-complexes have been determined computationally to represent the most stable
structures include complexes of CN- and CO32- with hexafluorobenzene24 and of CN-,
NC- and CO32- with triazine.18 Weakly covalent donor π-acceptor complexes display
less charge-transfer from the anion to the ring and consequently the covalent bonding
interaction is weaker, the anion-carbon distance larger and the aromatic ring still close
to planar. However, the charge transfer is still finite, explaining the behavior found
for mixtures of halide anions with some electron-deficient aromatic systems in
solution.32 The structural motif characterizing these complexes places the anion not
on top of the center of the aromatic ring but rather outside the ring perimeter and is
widely found both in solid and in solution phase,32 indicating that this is one of the
preferred binding motifs for (less nucleophilic) halide anions to electron-deficient
arenes. Finally, also non-covalent anion-π interactions are possible for less
nucleophilic halide anions. They are characterized by negligible charge-transfer of
less than 0.01 e and a comparatively highly symmetric geometry in which the halide
is ideally placed on top of the aromatic ring along the axis perpendicular to the center
of the plane defined by the carbon atoms. As mentioned above, although this motif
has been established in numerous computational studies to be energetically quite
favorable, there is only a limited data set for which this binding motif is actually
found experimentally. Summarizing, it can be stated that strongly bound σ-complexes
are likely to display the ground state structure for nucleophilic anions such as RO-,
CN- and F-, while more weakly bound anion-π complexes are more likely for more
diffuse, less nucleophilic anions such as ClO4-, BF4
- and PF6- and aromatic units of
moderate electron affinity. For anions of intermediate nucleopilicity (e.g. Cl-, Br- or
NO3-) anion-π complexes are still possible in complexes with arenes with
intermediate electron affinity, while as the latter one increases eventually weakly
bound σ-complexes start to prevail.33 However, whenever aryl C-H groups are
present, there is the possibility of hydrogen bond formation to the anion in
concurrence to π-system binding.33 Generally, one can classify hydrogen bonds
quantitatively by the magnitude of their gas phase binding energies, ∆E (provided by
135
electronic structure calculations). Hydrogen bonds with ∆E values < 17 kJ/mol are
considered to be weak, those between 17 - 63 kJ/mol moderate, and eventually values
> 63 kJ/mol are considered strong35,36 (in aqueous solution these strong interactions
can be considerably attenuated). An important feature of hydrogen bonding
interactions is their high degree of directionality, with the “ideal” hydrogen bond
displaying an angle < (XHY) close to 180°. While at first glance it can be argued that
the interaction strength between an anion and aryl C-H groups should be weak,
studies on the enthalpies of formation for the chloride-benzene complex resulted in a
value of ~ -40 kJ/mol,37,38 while theoretical investigations of benzene complexes with
the Cl-, NO3- and ClO4
- anions yielded values in the range of -32 kJ/mol to
-39 kJ/mol,35 providing further evidence that in fact hydrogen bonding interactions in
these species are of moderate strength. Moreover, it is possible to subtly tune the
acidity of the aryl C-H group over a considerably broad range by introduction of
electron-withdrawing substituents into the aromatic ring system. This trend could be
established already in early mass-spectrometric studies39 and more recently, the gas
phase binding energies of the highly electron-deficient 1,2,4,5-tetracyanobenzene for
complex formation with a chloride anion through hydrogen bonding has been
determined to be -113 kJ/mol, establishing that these complexes do display strong
hydrogen bonds.28 In fact, searching the Cambridge Structural Data Base yields far
more examples for interactions between anions and arenes via hydrogen bonding as
compared to anion-π interactions.33 The aforementioned examples highlight that the
binding motifs between anions and electron-deficient arenes are dominated by several
interaction forces of comparable strength competing with one another. The final
structural motif will depend on the properties of the respective system and can
possibly be influenced e.g. by changing the substituents and therefore the electron
density and affinity of the aromatic unit. As most studies so far are theoretical and
experimental data are still lacking, it is clear that much more experimental work is
necessary in order to improve the understanding of the subtle interplay of the these
binding forces. In the following paragraph, an infrared predissociation study on
Cl-·C6FnH6-n complexes in the gas phase is presented, aimed to contribute to the
clarification of this problem.
136
5.3. Cl-·C6FnH6-n complexes as prototypes for the investigation of the binding behavior between anions and aromatic molecules
5.3.1. Introduction
In the previous section, it has been pointed out that experimental data on the
interactions and geometries of complexes between anions and electron-deficient
aromatic molecules are still rather scarce. Infrared predissociation spectroscopy
applied in combination with electronic structure calculations has been very successful
in the past in elucidating the structural motifs of ion-molecule complexes in the gas
phase. Cl-·C6FnH6-n complexes have been chosen as prototypes for the investigation of
the binding behavior between an anion and aromatic molecules40 for several reasons.
First, fluorinated organic compounds are an interesting class of molecules, as they
play an important role in pharmaceutical and crop production products.41 They offer
the opportunity to subtly tune their properties depending on the number of fluorine
atoms chosen to be introduced in the respective parent molecular structure. This
behavior can be exploited in the case of the fluorinated benzenes to modify their
electronic properties and the two limiting cases benzene and hexafluorobenzene
possess quadrupole moments of similar magnitude but opposite sign, leading to their
unique interaction and binding behavior upon mixing, as has been detailed in the
previous paragraphs. At the same time, fluorinated benzene molecules possess aryl
C-H groups up to pentafluorobenzene. In complexes with anions they offer therefore,
at least for the higher fluorinated (electron-deficient) representatives, in principle all
of the binding motifs mentioned above. The structural motifs adopted for the two
limiting cases are already known: complexes of hexafluorobenzene with various
anions have been described and specifically the chlorine atom is thought to bind in an
anion-π interaction to the top of the fully fluorinated ring.24 The geometries of the
halide-benzene complexes on the other hand have been established in pioneering
experiments by Bieske and co-workers in a study combining infrared experiments and
calculations.42,43 Interestingly, they find that the ground state structures of these
137
complexes are all characterized by bifurcated hydrogen bonds of the respective halide
anion to two neighboring CH groups in the plane of the aromatic ring. However, the
binding behavior of anions to the arenes of intermediate fluorination degree is
unknown. The questions to be addressed in this study were specifically (i) how many
fluorine atoms are necessary to make the binding motif switch from coordination in
the plane of the ring to the top of the ring and (ii) how the distribution of the fluorine
atoms around the ring (i.e. the structural isomers resulting from the permutation of the
respective ligand positions around the ring) will influence the binding motif. Infrared
predissociation spectroscopy is applied to Ar solvated clusters A-·C6FnH6-n·Arm
(n = 0 - 5, A- = Cl-, I-, SF6-). This enables the simultaneous study of both the influence
of the electronic nature of the aromatic ring (varied by changing the number of
fluorine atoms attached to it) and the Lewis acidity of the respective anion by going
from the small atomic chloride anion to the more diffuse negative charge distribution
in the sulfur hexafluoride anion. Results are presented for the fluorobenzene
molecules up to pentafluorobenzene, as hexafluorobenzene has no infrared signature
active in the mid-infrared range available in the experiment (represented by the aryl
CH groups in the cases of the benzene and the fluorobenzene molecules). The use of
Ar solvation ensures that the infrared spectra result from irradiation of cold clusters,
as fragment ions are monitored following the evaporation of the weakly bound Ar
atom (bond energy of the Cl-···Ar bond: D0 = 523 cm-1).44
5.3.2. Calculations
As in the studies described in the previous chapters, the minimum energy structures
of the complexes under consideration and their harmonically approximated
vibrational frequencies have been calculated in order to aid the interpretation of the
experimentally obtained data and to be able to assign the appropriate geometrical
motifs to the systems under study. Both DFT (density functional theory,45 employing
the B3-LYP functional46 in all cases considered here) and ab initio RI-MP247
(second-order Møller-Plesset perturbation theory applying the resolution-of-identity
approximation for the evaluation of two-electron integrals) calculations have been
138
performed as implemented in the TURBOMOLE program package.48 Due to the
relatively large size of the systems investigated and the large number of complexes
considered, only a TZVP basis set49 has been applied in all cases. The vibrational
frequencies (in the harmonic approximation) have been calculated on the DFT level
of theory. In order to ease the comparison with the experimentally measured values
and to obtain a physically more realistic picture, all calculated values have been
scaled with an anharmonic correction factor of k = 0.960, as determined by the ratio
of the calculated value for the frequency of the normal mode mostly due to the CH
group of pentafluorobenzene and its well-known experimentally measured value.50
All calculations have been performed without taking the Ar atoms attached to the ion-
molecule complex into account. However, the interaction strength between an Ar
atom and a benzene molecule (D0 = 314±7 cm-1)51 is comparable to the Cl-···Ar
interaction energy (see above), and it has been shown in a theoretical study on the
Cl-·C6H6 ·Ar cluster that the Ar atom is bound half way between the chloride anion
and the benzene ring in order to maximize the interaction energy with both entities.52
5.3.3. The Cl-·C6H6 complex dimer
It is instructive to take at first a close look at the infrared spectrum of the Cl-·C6H6
complex dimer (shown in Figure 5.4), as it constitutes the first representative of the
Cl-·C6FnH6-n complexes under investigation and also the one of highest symmetry.
The interpretation of its spectrum and the conclusions which can be drawn from it
concerning its minimum energy structure should therefore be valuable for the
evaluation of the experimentally obtained data of the other species. Bieske and
co-workers were able to derive in pioneering experiments42,43 the structures of the
halide-benzene complexes from their infrared spectra (with the exception of the
fluoride-benzene complex due to its high binding energy).
139
2700 2800 2900 3000 3100 3200 3300
Photon Energy [cm-1]
Cl-·C6H6·Ar3
Pho
tofra
gmen
t Sig
nal [
arb.
uni
ts]
Cl-·C6H6·Ar1 2
3
Figure 5.4 Ar predissociation spectra for Cl-·C6H6·Ar (top trace) and Cl-·C6H6·Ar3 (bottom trace)
However, before following their arguments, it is worth discussing the infrared
spectrum of the free benzene molecule. Although it has only one infrared active mode
ν20 (e1u) (following the Wilson numbering53 of the modes of benzene) in the CH
stretching region between 3040 cm-1 to 3100 cm-1, it shows a characteristic “triad” of
absorption bands (namely at 3048 cm-1, 3079 cm-1 and 3101 cm-1) which actually is
an unresolved tetrad due to Fermi resonances of the infrared active ν20 mode with the
energetically near degenerate modes [ν1 + ν6 + ν19], [ν8 + ν19] and [ν3 + ν6 + ν15].54-56
The exact interaction scheme resulting in the Fermi tetrad is shown in Figure 5.5
(from Ref.54).
140
3101 cm-1
3048 cm-1
3079 cm-1
3101 cm-1
3083 cm-1
3080 cm-1
3065 cm-1
ν ν’’ ’’3 15 + + ν’’
6
ν ν’’ ’’1 19 + + ν’’
6
ν ν’’ ’’8 19 +
ν’’ ’’1 19 + + ν’’
20
C’’1,2
A’’
B’’
Deperturbed Observed
Figure 5.5 Benzene CH stretching tetrad (according to Ref.54,56)
Comparison to the spectrum of the chloride-benzene complex in Figure 5.4
immediately shows that the spectrum changes appreciably, with two intense bands at
3028 cm-1 and 3046 cm-1 being red-shifted with regard to the band positions of the
Fermi tetrad of the free benzene molecule. This leads directly to the conclusion that
the chloride anion is not bonded to the top of the aromatic ring, as in this case (in
spite of the symmetry lowering from D6h to C6v) almost no alteration of the
frequencies of benzene was to be expected,42 while ionic hydrogen bonds result in the
observed red shift of the CH stretching bands. This is in line with the structural
expectations from an electrostatic point of view, as the negative charge of the chloride
anion and the π electron cloud of the benzene molecule should result in a repulsive
mutual interaction. The calculations performed by Bieske and co-workers42,43
converged to two stable minimum structures, namely one displaying a bifurcated
double hydrogen bond between the chloride anion and the benzene molecule
141
(geometry 1 in Figure 5.6) and a second one in which the chloride anion is bound to
the benzene ligand by one linear hydrogen bond to one of the CH groups (geometry 2
in Figure 5.6).
2 1
Figure 5.6 Calculated minimum energy structures for the chloride-benzene complex
Structure 1 is calculated to be slightly more stable. Based on the simulation of the
vibrational spectra for both species (in the harmonic approximation, scaled with an
appropriate factor to account for anharmonicity) they were able to exclude the linear
structure in line with the calculated trend for the relative stabilities of the two binding
motifs. The most important argument is the absence of a strongly red-shifted band
which would be expected from the hydrogen bonded CH group in the linear motif.
These findings were in contradiction to an earlier study of these clusters, which
predicted the bifurcated motif to be the most stable one only for the iodide-benzene
complex, while all other halide-benzene complexes were expected to display the
linear motif.37 However, this difference could be attributed to the different level of
theory applied, with the higher level calculations of Bieske and co-workers being in
142
line with the experimental findings. The exact assignment of the experimentally
obtained bands to the appropriate modes of the complex is difficult due to the
expected occurrence of Fermi resonances already at play in the free benzene
molecule. For the chloride-benzene complex, due to the symmetry lowering from D6h
to C2v, even more modes should be theoretically allowed to interact at least arguing
from a symmetry based point of view. Most of the observed bands could be
tentatively assigned based on spectra of cold Cl-·C6H6·Arn (n = 1,2)43 and an equally
well resolved spectrum of the bare Cl-·C6H6 complex.57 The three main bands could
be assigned in the following way (labeling of the peaks is given in Figure 5.4): band 1
is an overlap of the ν20 mode (the only one also active in the free benzene) and the ν7
band, band 2 is the only pure one as only the ν2 mode contributes (which explains the
sharpness of this feature), and finally band 3 is the result of Fermi interactions of the
ν20 mode with several combination bands of lower frequency. The remaining smaller
bands can be assigned to combination bands and features of the benzene ligand
becoming infrared active due to the symmetry lowering as compared to the free
molecule. It is important to keep the following points in mind from this discussion for
the interpretation of the spectra of the chloride-fluorobenzene complexes which is to
follow: the most intense features in the infrared spectrum of a hydrogen bonded
complex usually stem from ionic hydrogen bonds (which means for the systems under
consideration between the aryl CH groups and the anion). As mentioned above and as
is obviously the case for the free benzene molecule, other modes may possibly
borrow intensity from these intense features through Fermi resonances, e.g. through
mixing of the intense CH bands with overtones and combination bands of CC/CF
stretching modes, thereby greatly complicating the observed spectra. However, the
centroid frequencies will encode the structural properties of the complexes as detailed
above, and their elucidation is at the heart of the study presented.
143
5.3.4. Spectra and structures of the Cl-·C6FnH6-n complexes
The spectra of all Cl-·C6FnH6-n complexes (monitored via the loss of weakly bound Ar
messenger atoms) are displayed in Figure 5.7 and Figure 5.8.
Figure 5.7 Ar predissociation spectra for all isomers at all fluorination levels (each row corresponds to a certain number of fluorine atoms - marked as green in the sketches of the ligand structures - in the ligand, starting with benzene on top) of Cl-·C6FnH6-n·Arm clusters. Horizontal axis: photon energy in cm-1; Vertical axis: photofragment yield in arbitrary units. The arrows indicate the calculated scaled harmonic frequencies of the most intense CH stretching bands
2400 2600 2800 3000 3200 3400 3600
Cl-·C6F5H
1,2,3,5-Cl-·C6F4H2
1,2,3,4-Cl-·C6F4H2
1,2,4,5-Cl-·C6F4H2
1,2,4-Cl-·C6F3H3
1,2,3-Cl-·C6F3H3
1,3,5-Cl-·C6F3H3
1,3-Cl-·C6F2H4
1,2-Cl-·C6F2H4
1,4-Cl-·C6F2H4
Cl-·C6FH5
Phot
ofra
gmen
t Sig
nal [
arb.
uni
ts]
Photon Energy [cm-1]
Cl-·C6H6
Figure 5.8 Ar predissociation spectra for all isomers at all fluorination levels
(complexes with equal number of fluorine atoms in the ligand are marked by the same color) of Cl-·C6FnH6-n·Arm clusters (monitored by the loss of the Ar messenger atoms)
145
The spectra are complicated, each consisting of a multitude of bands. The
identification of every single one of these would clearly require a major effort using
high level anharmonic calculations. However, as has been pointed out above, the
main structural information, the clarification of which is the aim of this study, is
encoded in the centroid of the bands for each spectrum. As can be clearly seen, these
bands fall into different classes, allowing for differentiation between two distinct
spectral motifs: (i) a high-energy motif, characterized by absorption bands with a
centroid around 3000 cm-1 and (ii) a low-energy motif, with the centroid of the
absorption bands shifted to frequencies around 2400 - 2600 cm-1. The signature in the
spectrum of the chloride-benzene complex (centroid of the absorption bands
~ 3030 cm-1; shown in the top trace of both Figure 5.7 and Figure 5.8) is only weakly
shifted in comparison to the free benzene molecule and fully consistent with the
spectrum of this complex reported previously by Bieske and co-workers,42,43 who
were able to assign the spectral features to a bifurcated hydrogen bonding motif, as
has been detailed in the previous section. Figure 5.8 illustrates that the spectral motif
observed does not purely depend on the number of fluorine atoms in the arene ligand,
but also on their specific distribution around the ring. Out of the twelve complexes
investigated, only four display the low-energy vibrational signature, namely 1,3,5-
trifluorobenzene, 1,2,4,5- and 1,2,3,5-tetrafluorobenzene and pentafluorobenzene.
These four molecules are the only ones which are restricted to bind the chloride anion
by one CH aryl group, thereby enforcing on the complex a linear hydrogen bonding
motif. As has been discussed before, the characteristic spectral feature of a singly
hydrogen bonded CH group is a strongly red-shifted band as compared to the free
molecule, which is exactly what is found for the complexes of the chloride anion with
these four fluorobenzene molecules. All other molecules under consideration have at
least two neighboring CH groups, thereby always offering the possibility to
coordinate to the anion via the bifurcated motif, which has been proved to be
dominant in the chloride-benzene complex. Although the appearance of the spectra
differs considerably between the individual complexes (as is to be expected due to the
differences in the overall symmetry and exact chemical nature of the ligands), the
centroids of the absorption bands of all complexes offering the bifurcated binding
146
motif are placed around ~ 3000 cm-1 in the spectra, only slightly red shifted from the
values of the free benzene molecule. Therefore, one can empirically assign the high-
energy spectral features to the bifurcated structural motifs. This interpretation is
corroborated by our DFT calculations, which converge into the geometries displaying
the bifurcated binding motif whenever possible and yield the linearly bound complex
as the ground state structure only for the four ligands that have only isolated CH aryl
groups. Even if the frequency calculations performed in the harmonic approximation
are incapable of recovering the exact spectra (as features such as Fermi resonances
are anharmonic in nature), the most intense calculated features are roughly consistent
with the centroids of the absorption bands found experimentally. One can therefore
generally conclude that the chloride anion prefers bifurcated bonding to two
neighboring CH groups over linear bonding. 1,2,4-trifluorobenzene constitutes an
interesting case in that respect, as within one ligand, it offers simultaneously the
opportunity for linear and bifurcated docking of the chloride anion. As can be seen
from the spectrum though, only the high energy motif is observed, consistent with the
DFT calculations, which place the linear structure ~ 160 meV higher in energy than
the bifurcated motif, corroborating the statements made above.
5.3.5. Vibrational spectrum and binding motif for the Cl-·C6F5H complex
It is interesting at this point to take a closer look at the spectrum of the chloride-
pentafluorobenzene complex as compared to the case of the chloride-benzene
complex (see Figure 5.9), as these two species constitute the two “extreme ends” with
respect to the fluorination degree of the ligand of the complex series under
investigation in this study. The infrared signatures of the chloride-pentafluorobenzene
complex are centered around ~ 2540 cm-1, strongly red-shifted in comparison to the
typical CH stretching region and also to the signatures of the bifurcated motif as
displayed by the spectrum of the chloride-benzene complex. This implies a linearly
hydrogen bonded structure.
147
2400 2600 2800 3000 3200
Photon Energy [cm-1]
Pho
tofra
gmen
t Sig
nal [
arb.
uni
ts]
Figure 5.9 Ar predissociation spectra for Cl-·C6H6·Ar (top trace) and Cl-·C6F5H·Ar (bottom trace)
In addition, no vibrational bands are found around 3103 cm-1 (the CH stretching band
of the free pentafluorobenzene molecule),50 where the spectroscopic signature of a
ring-bound geometry is expected (scaled harmonic calculation: 3095 cm-1), as in this
case the structure and therefore also the spectral features of the ligand should be only
weakly perturbed. The DFT calculations predict the frequency of the CH stretching
vibration corresponding to a linear hydrogen bond between the remaining aryl CH
group and the chloride anion to be at 2548 cm-1, in reasonable agreement with the
experimentally determined centroid of the absorption bands. However, the spectrum
148
is quite complicated given that in a harmonic picture one would expect only one
normal mode in this frequency range, namely the vibrational signature of the CH
group. This can be rationalized though by bearing in mind that already the spectrum
of the free benzene molecule shows an unresolved tetrad in the frequency region of
the CH stretching modes due to Fermi resonances with energetically closely spaced
combination bands. Given that the symmetry of the complex is even lower, it seems
reasonable that Fermi interactions with energetically almost degenerate CC/CF
combination bands and/or overtones, “borrowing” intensity from the very intense CH
stretching modes, lead to the observed cluster of bands around 2540 cm-1. Clearly,
these Fermi interactions are not the same as in benzene due to the different mode
structure. An exact assignment of the individual bands is not possible on the basis of
the harmonic approximation frequency calculations. However, several modes based
on CC stretching and CF stretching modes that are likely candidates for causing the
observed bands through combination bands and overtones can be identified (see
Table 5.1).
Table 5.1 Candidates for Fermi interaction responsible for the group of bands around 2540 cm-1 in the spectrum of the Cl-·C6F5H complex
Combination band modes 31 + 26 2461 cm-1CH wagging, ring deformation,
CC/CF stretching
Overtone of mode 34 2801 cm-1ring deformation, CC/CF stretching
149
The observation of this strongly red shifted signature of the aryl CH group in the
infrared spectrum indicates that the chloride anion is bound to its fluorobenzene
ligand via a hydrogen bond in the plane of the ring even in the case of a highly
fluorinated arene such as the pentafluorobenzene, which is electron-deficient and
should offer favorable binding interactions to the top of the ring. Indeed, the DFT
calculations find a local minimum energy structure in this geometry, which is placed
~ 300 meV higher in energy than the hydrogen bonded ground state (see Figure 5.10).
Figure 5.10 Calculated structure for the Cl-·C6F5H complex (DFT/B3-LYP/TZVP) via ring bonding
More precisely, local minima are calculated to exist above every carbon atom except
that belonging to the CH group, with the minimum above the carbon para to the CH
group being lowest in energy, followed by the meta and ortho positions. The
calculated energies of these ring-bound isomers all fall within 10 meV. The fact that
hydrogen bonds constitute a binding motif in anion complexes with highly electron-
deficient aromatics competitive to the binding to the top of the ring has been
discussed in the previous sections and has been described in more detail by Berryman
et al.28 (although they did not study anion-arene complexes with only one aryl CH
150
group in the aromatic unit). This behavior is not too surprising in light of the fact that
introducing strongly electron-withdrawing groups into the aromatic ring is expected
to significantly raise the acidity of the remaining CH groups, thereby strengthening
the interaction even with a proton acceptor of rather moderate strength such as the
chloride anion.58 As has been detailed in the first chapter on anion hydration, the
energy position of the OH infrared absorption band decreases with increasing proton
affinity of the anion.59 This implies at the same time that the infrared absorption band
in an ionic hydrogen bond will decrease in frequency with increasing acidity of the
proton in complexes involving the same anion and consequently low CH stretching
frequencies should suggest hydrogen bonds involving a rather acidic proton. In order
to verify this kind of behavior on a more quantitative basis, MP2 calculations have
been performed in order to characterize the CH stretching potential energy surface for
the acidic proton in the Cl-·C6F5H complex. A low-lying proton transfer channel can
be identified, resulting in a C6F5-···HCl state (which shows up as a shelf in the
potential energy surface, see Figure 5.11) ~ 1.5 eV above the C6F5H···Cl- ground
state. This explains in turn the strong anharmonicity of the potential around the
minimum energy structure, resulting in the huge observed red shift of the vibrational
signature of the CH group. There is yet another issue which deserves further
consideration in view of the relative acidities of the hydrogen atoms in the aryl CH
groups: As the lower-energy absorption band exlusively occurs in the case of the
complexes in which the chloride anion is forced to bind to isolated CH groups, one
could arrive at the conclusion that the hydrogen atom in a CH group surrounded by
two CF groups is more acidic than a hydrogen atom belonging to one of two
neighboring CH groups. Investigations of the thermochemistry of the species
involved, however,60 revealed that the acidity of fluorobenzenes always increases
with increasing fluorination level, with one of the largest changes occurring from
n = 0 to n = 1. As the complexes with bifurcated bonding show only a weak
dependence of the CH stretching frequencies on the fluorination level, it can be
assumed that the bifurcated binding motif effectively shuts down the proton-transfer
channel. Qualitatively this can be rationalized through the fact that the anion interacts
with two hydrogen atoms instead of one, thereby weakening the exerted force on
151
every single one. In the linear motif, however, the increasing acidity is clearly
observed, as the much stronger dependence of the CH stretching position on the
number of fluorine atoms shows (see Figure 5.12).
1,5 2,0 2,5 3,0 3,5 4,0
0
1
2
3
4
5
C6F5-·HCl
E [e
V]
dist C-H [a.u.]
C6F5H·Cl-
Figure 5.11 Calculated potential energy surface along the CH stretching coordinate in [C6F5···H···Cl]- (MP2/TZVP). The squares are single-point energies at various C-H distances, with fixed C-Cl distance, whereas the rest of the coordinates were relaxed but constrained to C2v symmetry.
152
0 1 2 3 4 5
2500
2600
2700
2800
2900
3000
3100
cent
roid
freq
uenc
y [c
m-1]
number of F atoms
Figure 5.12 Centroid frequency as a function of the number of fluorine atoms.
Open squares denote complexes with bifurcated hydrogen bonds, while data corresponding to hydrogen bonds involving isolated CH groups are shown as full squares.
5.3.6. Role of the anion
The conclusions drawn in the previous section have all been based on the variations
in the chemical nature of the ligand (tuned by the degree of fluorination) bound to the
chloride anion. However, the binding interaction between the two entities must be
influenced by the anion, too, and it has been pointed out before, that diffuse, less
nucleophilic anions (such as e.g. BF4-) can lead to a preference in the binding motif
towards the anion-π complexes.33 Therefore, anions other than chloride might differ
from the observed preference of binding to the last remaining hydrogen atom in the
pentafluorobenzene ligand in the presence of a competing positive electrostatic
153
potential above the carbon ring. In order to choose an anion to bias binding to the top
of the aromatic ring, it helps to consider the nature of the two interacting charge
distributions in view of Pearson’s HSAB (hard and soft acid and base) principle.61
The positive charge in the ring certainly constitutes a softer Lewis acid than the
hydrogen atom in the ring, implying that the right strategy should be switching to
anions representing softer bases than chloride. Just moving down in the periodic
table, this condition is necessarily fulfilled by one of the heavier halides, e.g. the
iodide anion, and the sulfur hexafluoride anion should be even softer, given its large
size and its highly symmetric charge distribution. In order to test these ideas and the
influence of the anion, infrared spectroscopy has been performed on the I-·C6F5H and
the SF6-·C6F5H complexes. However, neither of the two spectra shows evidence of a
ring-bound complex, as can be seen in Figure 5.13.
2600 2800 3000 3200
I-·C6F5H·Ar3
Photon Energy [cm-1]
Pho
tofra
gmen
t Sig
nal [
arb.
uni
ts]
SF6-·C6F5H·Ar3
Figure 5.13 Infrared predissociation spectra of X-·C6F5H·Ar3 with X = SF6 (top
trace) and I (bottom trace)
154
Rather, they both display a complex series of intense bands, the centroid of which is
red shifted as compared to the CH stretching positions of the aryl CH groups in the
free benzene molecule. This indicates that the complexes are both still hydrogen
bonded, with the centroid frequency shifting with the increasing ion radius (and
essentially inversely with the decreasing proton affinity) from Cl- (2546 cm-1) to I-
(2818 cm-1) and SF6- (2912 cm-1).
5.3.7. Summary and conclusions
Mass selected complexes A-·C6FnH6-n·Arm (n = 0 - 5, A- = Cl-, I-, SF6-) have been
studied by infrared predissociation spectroscopy, accompanied by (DFT and MP2)
calculations to shed light on the interaction between negative ions and aromatic
molecules. Fluorobenzene molecules have been chosen as model systems, as their
charge distributions can be tuned by varying the degree of fluorination. It could be
demonstrated that full fluorination around the ring is needed to force the anions to
bind to the aromatic ring. At all lower levels of fluorination, anion-fluorobenzene
complexes are bound via ionic hydrogen bonds. Investigating the influence of the size
of the anion revealed that it does play a role with respect to the distortion of the
hydrogen bonded CH groups. However, the preferred binding motif always remains
hydrogen- rather than ring-bonded. The analysis of the Cl-·C6FnH6-n complexes
revealed that bifurcated hydrogen bonds with two neighboring CH groups are
preferred over binding to a single CH group in a linear hydrogen bond, a finding
which had been established before by Bieske and co-workers in the case of the
Cl-·C6H6 complex.42,43 Overall, it has been shown that infrared predissociation
spectroscopy on anionic complexes in the gas phase is a powerful tool to investigate
the interaction between anions and electron-deficient arenes and can yield valuable
results at least partially filling the experimental gap in this field. In the study
presented here no complexes displaying an anion-π binding motif could be found, but
other experimental data clearly prove that these interactions do exist. One could
envision the investigation of other molecular systems which would be designed in a
way to favor the respective geometries. For instance, other electron-deficient aromatic
155
units which have been theoretically suggested to display very favorable interactions
with anions such as cyanuric acids could be studied. Even more promising, species
could be chosen which would still allow for the obviously preferred hydrogen
bonding, but in which the anion-π interaction would be used to influence the
conformation. One possibility would be to replace the hydrogen atom in the
pentafluorobenzene molecule by an aliphatic chain with an appropriate anion binding
site at the end (e.g. a CH2OH group), thereby introducing a flexible lariat which
would enable the anion to be hydrogen bonded and attached to the aromatic unit at the
same time. Comparison to electron rich aromats such as benzene would then reveal
the influence of the electron density in the arene ring on the overall binding motif of
the system under investigation.
156
5.4. References for Chapter V 1 C. J. Pedersen, Journal of the American Chemical Society 89 (26), 7017
(1967). 2 B. Dietrich, J. M. Lehn, and J. P. Sauvage, Tetrahedron Letters (34), 2885
(1969); B. Dietrich, J. M. Lehn, and J. P. Sauvage, Tetrahedron Letters (34), 2889 (1969).
3 C. H. Park and H. E. Simmons, Journal of the American Chemical Society 90
(9), 2431 (1968). 4 P. D. Beer and P. A. Gale, Angewandte Chemie-International Edition 40 (3),
486 (2001). 5 A. Bianchi, Bowman-James, E., Garcia-Espana, E., Supramolecular
Chemistry of Anions. (WILEY-VCH, New York, 1997). 6 P. D. Beer, Gale, P.A., Smith, D.K., Supramolecular Chemistry. (New York,
1999). 7 P. A. Gale, Coordination Chemistry Reviews 213, 79 (2001); P. A. Gale,
Coordination Chemistry Reviews 199, 181 (2000). 8 J. L. Atwood, Steed, J.W., Encyclopedia of Supramolecular Chemistry. (CRC
Press, Boca Raton, FL, 2004). 9 M. Aoyagi, K. Biradha, and M. Fujita, Journal of the American Chemical
Society 121 (32), 7457 (1999). 10 C. Reuter, W. Wienand, G. M. Hubner, C. Seel, and F. Vogtle, Chemistry-a
European Journal 5 (9), 2692 (1999); G. M. Hubner, J. Glaser, C. Seel, and F. Vogtle, Angewandte Chemie-International Edition 38 (3), 383 (1999).
11 J. C. Ma and D. A. Dougherty, Chemical Reviews 97 (5), 1303 (1997); D. A.
Dougherty, Science 271 (5246), 163 (1996). 12 E. Cubero, F. J. Luque, and M. Orozco, Proceedings of the National Academy
of Sciences of the United States of America 95 (11), 5976 (1998). 13 C. Garau, A. Frontera, D. Quinonero, P. Ballester, A. Costa, and P. M. Deya,
Chemphyschem 4 (12), 1344 (2003). 14 B. L. Schottel, H. T. Chifotides, and K. R. Dunbar, Chemical Society Reviews
37 (1), 68 (2008).
157
15 J. H. Williams, J. K. Cockcroft, and A. N. Fitch, Angewandte Chemie-
International Edition in English 31 (12), 1655 (1992). 16 E. V. Anslyn, Dougherty, D.A., Modern Physical Organic Chemistry.
(University Science Books, Sausalito, CA, 2006). 17 M. J. Frisch, G. W. Trucks, H. B. Schlegel, G. E. Scuseria, M. A. Robb, J. R.
Cheeseman, J. A. Montgomery, J. Vreven, T. , K. N. Kudin, J. C. Burant, J. M. Millam, S. S. Iyengar, J. Tomasi, V. Barone, B. Mennucci, M. Cossi, G. Scalmani, N. Rega, G. A. Petersson, H. Nakatsuji, M. Hada, M. Ehara, K. Toyota, R. Fukuda, J. Hasegawa, M. Ishida, T. Nakajima, Y. Honda, O. Kitao, H. Nakai, M. Klene, X. Li, J. E. Knox, H. P. Hratchian, J. B. Cross, V. Bakken, C. Adamo, J. Jaramillo, R. Gomperts, R. E. Stratmann, O. Yazyev, A. J. Austin, R. Cammi, C. Pomelli, J. W. Ochterski, P. Y. Ayala, K. Morokuma, G. A. Voth, P. Salvador, J. J. Dannenberg, V. G. Zakrzewski, S. Dapprich, A. D. Daniels, M. C. Strain, O. Farkas, D. K. Malick, A. D. Rabuck, K. Raghavachari, J. B. Foresman, J. V. Ortiz, Q. Cui, A. G. Baboul, S. Clifford, J. Cioslowski, B. B. Stefanov, G. Liu, A. Liashenko, P. Piskorz, I. Komaromi, R. L. Martin, D. J. Fox, T. Keith, M. A. Al-Laham, C. Y. Peng, A. Nanayakkara, M. Challacombe, P. M. W. Gill, B. Johnson, W. Chen, M. W. Wong, C. Gonzalez, and J. A. Pople, Gaussian 03 (Gaussian, Inc, Wallingford CT, 2004).
18 I. Alkorta, I. Rozas, and J. Elguero, Journal of the American Chemical Society
124 (29), 8593 (2002); D. Kim, P. Tarakeshwar, and K. S. Kim, Journal of Physical Chemistry A 108 (7), 1250 (2004).
19 A. Frontera, F. Saczewski, M. Gdaniec, E. Dziemidowicz-Borys, A. Kurland,
P. M. Deya, D. Quinonero, and C. Garau, Chemistry-a European Journal 11 (22), 6560 (2005); C. Garau, A. Frontera, D. Quinonero, P. Ballester, A. Costa, and P. M. Deya, Journal of Physical Chemistry A 108 (43), 9423 (2004); C. Garau, A. Frontera, D. Quinonero, P. Ballester, A. Costa, and P. M. Deya, Chemical Physics Letters 392 (1-3), 85 (2004).
20 C. Garau, D. Quinonero, A. Frontera, P. Ballester, A. Costa, and P. M. Deya,
Journal of Physical Chemistry A 109 (41), 9341 (2005). 21 M. Mascal, A. Armstrong, and M. D. Bartberger, Journal of the American
Chemical Society 124 (22), 6274 (2002). 22 D. Quinonero, A. Frontera, C. Garau, P. Ballester, A. Costa, and P. M. Deya,
Chemphyschem 7 (12), 2487 (2006). 23 D. Quinonero, C. Garau, A. Frontera, P. Ballester, A. Costa, and P. M. Deya,
Chemical Physics Letters 359 (5-6), 486 (2002).
158
24 D. Quinonero, C. Garau, C. Rotger, A. Frontera, P. Ballester, A. Costa, and P.
M. Deya, Angewandte Chemie-International Edition 41 (18), 3389 (2002). 25 C. Garau, D. Quinonero, A. Frontera, D. Escudero, P. Ballester, A. Costa, and
P. M. Deya, Chemical Physics Letters 438, 104 (2007). 26 C. Garau, D. Quinonero, A. Frontera, P. Ballester, A. Costa, and P. M. Deya,
New Journal of Chemistry 27 (2), 211 (2003). 27 I. Alkorta, D. Quinonero, C. Garau, A. Frontera, J. Elguero, and P. M. Deya,
Journal of Physical Chemistry A 111 (16), 3137 (2007). 28 O. B. Berryman, V. S. Bryantsev, D. P. Stay, D. W. Johnson, and B. P. Hay,
Journal of the American Chemical Society 129 (1), 48 (2007). 29 S. Demeshko, S. Dechert, and F. Meyer, Journal of the American Chemical
Society 126 (14), 4508 (2004). 30 P. de Hoog, P. Gamez, H. Mutikainen, U. Turpeinen, and J. Reedijk,
Angewandte Chemie-International Edition 43 (43), 5815 (2004). 31 H. Maeda and H. Furuta, Journal of Porphyrins and Phthalocyanines 8 (1-3),
67 (2004); H. Maeda, A. Osuka, and H. Furuta, Journal of Inclusion Phenomena and Macrocyclic Chemistry 49 (1-2), 33 (2004).
32 Y. S. Rosokha, S. V. Lindeman, S. V. Rosokha, and J. K. Kochi, Angewandte
Chemie-International Edition 43 (35), 4650 (2004). 33 B. P. Hay and V. S. Bryantsev, Chemical Communications (21), 2417 (2008). 34 C. J. Jackson, Gazzolo, F.H., Journal of the American Chemical Society 23,
376 (1900); J. Meisenheimer, Justus Liebigs Annalen Der Chemie 323 (1/3), 205 (1902); M. J. Strauss, Chemical Reviews 70 (6), 667 (1970); M. J. Strauss, Accounts of Chemical Research 7 (6), 181 (1974); C. F. Bernasconi, Accounts of Chemical Research 11 (4), 147 (1978).
35 V. S. Bryantsev and B. P. Hay, Journal of the American Chemical Society 127
(23), 8282 (2005). 36 G. A. Jeffrey, An Introduction to Hydrogen Bonding. (Oxford University
Press, New York, 1997). 37 K. Hiraoka, S. Mizuse, and S. Yamabe, Chemical Physics Letters 147 (2-3),
174 (1988).
159
38 J. W. Larson and T. B. McMahon, Journal of the American Chemical Society 106 (3), 517 (1984).
39 P. Kebarle and S. Chowdhury, Chemical Reviews 87 (3), 513 (1987); G. J. C.
Paul and P. Kebarle, Journal of the American Chemical Society 113 (4), 1148 (1991); M. A. French, S. Ikuta, and P. Kebarle, Canadian Journal of Chemistry-Revue Canadienne De Chimie 60 (15), 1907 (1982).
40 H. Schneider, K. M. Vogelhuber, F. Schinle, and J. M. Weber, J. Am. Chem.
Soc. 129, 13022 (2007). 41 P. Maienfisch and R. G. Hall, Chimia 58 (3), 93 (2004). 42 Z. M. Loh, R. L. Wilson, D. A. Wild, E. J. Bieske, and A. Zehnacker, J.
Chem. Phys. 119 (18), 9559 (2003). 43 C. D. Thompson, B. L. J. Poad, C. Emmeluth, and E. Bieske, Chemical
Physics Letters 428 (1-3), 18 (2006). 44 T. Lenzer, I. Yourshaw, M. R. Furlanetto, G. Reiser, and D. M. Neumark,
Journal of Chemical Physics 110 (19), 9578 (1999). 45 R. G. Parr and W. Yang, Density-Functional Theory of Atoms and Molecules.
(Oxford University Press, New York, 1989). 46 A. D. Becke, Physical Review A 38 (6), 3098 (1988); C. T. Lee, W. T. Yang,
and R. G. Parr, Physical Review B 37 (2), 785 (1988). 47 F. Weigend and M. Häser, Theoretical Chemistry Accounts 97 (1-4), 331
(1997); F. Weigend, M. Häser, H. Patzelt, and R. Ahlrichs, Chemical Physics Letters 294 (1-3), 143 (1998).
48 R. Ahlrichs, M. Bär, M. Häser, H. Horn, and C. Kölmel, Chemical Physics
Letters 162 (3), 165 (1989). 49 A. Schäfer, C. Huber, and R. Ahlrichs, J. Chem. Phys. 100 (8), 5829 (1994). 50 S. G. Frankiss and D. J. Harrison, Spectrochimica Acta Part a-Molecular and
Biomolecular Spectroscopy 31 (12), 1839 (1975). 51 R. K. Sampson and W. D. Lawrance, Australian Journal of Chemistry 56 (4),
275 (2003). 52 M. Alberti, A. Castro, A. Lagana, M. Moix, F. Pirani, and D. Cappelletti,
European Physical Journal D 38 (1), 185 (2006).
160
53 E. B. Wilson, Physical Review 45 (10), 0706 (1934). 54 R. H. Page, Y. R. Shen, and Y. T. Lee, Journal of Chemical Physics 88 (9),
5362 (1988). 55 R. H. Page, Y. R. Shen, and Y. T. Lee, Journal of Chemical Physics 88 (8),
4621 (1988). 56 J. Pliva and A. S. Pine, Journal of Molecular Spectroscopy 126 (1), 82 (1987). 57 M. Tschurl, C. Ueberfluss, and U. Boesl, Chemical Physics Letters 439 (1-3),
23 (2007). 58 I. Alkorta, I. Rozas, and J. Elguero, Journal of Fluorine Chemistry 101 (2),
233 (2000). 59 W. H. Robertson, E. A. Price, J. M. Weber, J. W. Shin, G. H. Weddle, and M.
A. Johnson, J. Phys. Chem. A 107 (34), 6527 (2003); H. Schneider, A. D. Boese, and J. M. Weber, J. Chem. Phys. 123, 084307 (2005).
60 H. H. Buker, N. M. M. Nibbering, D. Espinosa, F. Mongin, and M. Schlosser,
Tetrahedron Letters 38 (49), 8519 (1997). 61 R. G. Pearson, Journal of the American Chemical Society 85 (22), 3533
(1963).
161
Bibliography
Ahlrichs, R., M. Bär, et al. (1989). Chemical Physics Letters 162(3): 165-169. Alberti, M., A. Castro, et al. (2006). European Physical Journal D 38(1): 185-191. Alkorta, I., D. Quinonero, et al. (2007). Journal of Physical Chemistry A 111(16):
3137-3142. Alkorta, I., I. Rozas, et al. (2000). Journal of Fluorine Chemistry 101(2): 233-238. Alkorta, I., I. Rozas, et al. (2002). Journal of the American Chemical Society 124(29):
8593-8598. Almlof, J., A. Lund, et al. (1974). Chemical Physics Letters 28(2): 179-181. Angel, L. A. and K. M. Ervin (2003). Journal of the American Chemical Society
125(4): 1014-1027. Anslyn, E. V., Dougherty, D.A. (2006). Modern Physical Organic Chemistry.
Sausalito, CA, University Science Books. Aoyagi, M., K. Biradha, et al. (1999). Journal of the American Chemical Society
121(32): 7457-7458. Armentrout, P. B. (2000). International Journal of Mass Spectrometry 200(1-3):
219-241. Armentrout, P. B. (2001). Annual Review of Physical Chemistry 52: 423-461.
162
Armentrout, P. B. (2003). International Journal of Mass Spectrometry 227(3): 289-302.
Armentrout, P. B. and T. Baer (1996). Journal of Physical Chemistry 100(31):
12866-12877. Arnold, S. T., J. H. Hendricks, et al. (1995). Journal of Chemical Physics 102(1):
39-47. Arnold, S. T. and A. A. Viggiano (2001). Journal of Physical Chemistry A 105(14):
3527-3531. Atwood, J. L., Steed, J.W. (2004). Encyclopedia of Supramolecular Chemistry. Boca
Raton, FL, CRC Press. Ayers, G. P. and A. D. E. Pullin (1976). Spectrochimica Acta Part a-Molecular and
Biomolecular Spectroscopy 32(10): 1629-1639. Ayotte, P., J. A. Kelley, et al. (2000). Chemical Physics Letters 316(5-6): 455-459. Ayotte, P., J. Kim, et al. (1999). Journal of the American Chemical Society 121(29):
6950-6951. Ayotte, P., S. B. Nielsen, et al. (1999). Journal of Physical Chemistry 103(50):
10665-10669. Ayotte, P., G. H. Weddle, et al. (1999). Journal of Physical Chemistry 110(15):
7129-7132. Ayotte, P., G. H. Weddle, et al. (1998). Chemical Physics 239(1-3): 485-491. Ayotte, P., G. H. Weddle, et al. (1998). Journal of the American Chemical Society
120(47): 12361-12362.
163
Ayotte, P., G. H. Weddle, et al. (1999). Journal of Physical Chemistry A 103(4): 443-447.
Bailey, C. G., J. Kim, et al. (1997). Chemical Physics Letters 269(1-2): 122-127. Barlow, S. E., J. M. Vandoren, et al. (1988). Journal of the American Chemical
Society 110(21): 7240-7242. Bassmann, C., U. Boesl, et al. (1996). International Journal of Mass Spectrometry and
Ion Processes 159: 153-167. Becke, A. D. (1988). Physical Review A 38(6): 3098-3100. Becker, I. and O. Cheshnovsky (1999). Journal of Chemical Physics 110(13):
6288-6297. Beer, P. D. and P. A. Gale (2001). Angewandte Chemie-International Edition 40(3):
486-516. Beer, P. D., Gale, P.A., Smith, D.K. (1999). Supramolecular Chemistry. New York. Beregovaya, I. V. and L. N. Shchegoleva (2002). International Journal of Quantum
Chemistry 88(4): 481-488. Bernasconi, C. F. (1978). Accounts of Chemical Research 11(4): 147-152. Berryman, O. B., V. S. Bryantsev, et al. (2007). Journal of the American Chemical
Society 129(1): 48-58. Beyer, M. K. (2007). Mass Spectrometry Reviews 26(4): 517-541. Bianchi, A., Bowman-James, E., Garcia-Espana, E. (1997). Supramolecular
Chemistry of Anions. New York, WILEY-VCH.
164
Bieske, E. J. (2003). Chemical Society Reviews 32(4): 231-237. Bieske, E. J. and O. Dopfer (2000). Chemical Reviews 100(11): 3963-3998. Bieske, E. J. and J. P. Maier (1993). Chemical Reviews 93(8): 2603-2621. Bilodeau, R. C., M. Scheer, et al. (1998). Journal of Physics B-Atomic Molecular and
Optical Physics 31(17): 3885-3891. Boesl, U. and W. J. Knott (1998). Mass Spectrometry Reviews 17(4): 275-305. Boesl, U., R. Weinkauf, et al. (1992). International Journal of Mass Spectrometry and
Ion Processes 112(2-3): 121-166. Bogdanov, B. and T. B. McMahon (2006). Journal of Physical Chemistry A 110(4):
1350-1363. Böhme, D. K. and H. Schwarz (2005). Angewandte Chemie-International Edition
44(16): 2336-2354. Bondybey, V. E. and M. K. Beyer (2002). International Reviews in Physical
Chemistry 21(2): 277-306. Bopp, J. C., J. R. Roscioli, et al. (2007). Journal of Physical Chemistry A 111(7):
1214-1221. Bowers, M. T., Ed. (1979). Gas Phase Ion Chemistry. New York, Academic Press. Bowers, M. T., A. G. Marshall, et al. (1996). J. Phys. Chem. 100(31): 12897-12910. Brauman, J. I. (1995). Journal of Mass Spectrometry 30(12): 1649-1651.
165
Brauman, J. I. (2008). Science 319(5860): 168-168. Braun, J. E., T. Mehnert, et al. (2000). International Journal of Mass Spectrometry
203(1-3): 1-18. Brinkmann, N. R. and H. F. Schaefer (2003Chemical Physics Letters 381(1-2):
123-128. Brutschy, B. (1992). Chemical Reviews 92(7): 1567-1587. Bryantsev, V. S. and B. P. Hay (2005). Journal of the American Chemical Society
127(23): 8282-8283. Buker, H. H., N. M. M. Nibbering, et al. (1997). Tetrahedron Letters 38(49):
8519-8522. Cabarcos, O. M., C. J. Weinheimer, et al. (1999). Journal of Chemical Physics
110(1): 5-8. Campargue, R. (1970). Journal of Chemical Physics 52(4): 1795. Castleman, A. W. and K. H. Bowen (1996). Journal of Physical Chemistry 100(31):
12911-12944. Chandrasekhar, J., S. F. Smith, et al. (1985). Journal of the American Chemical
Society 107(1): 154-163. Chen, E. C. M., J. R. Wiley, et al. (1994). Journal of Physical Chemistry 98(1): 88-94. Chen, M. S. and D. W. Goodman (2008). Chemical Society Reviews 37(9):
1860-1870. Cheshnovsky, O., S. H. Yang, et al. (1987). Review of Scientific Instruments 58(11):
2131-2137.
166
Chretien, S., S. K. Buratto, et al. (2007). Current Opinion in Solid State & Materials Science 11(5-6): 62-75.
Clemmer, D. E. and M. F. Jarrold (1997). Journal of Mass Spectrometry 32(6):
577-592. Collings, B. A., K. Athanassenas, et al. (1994). Journal of Chemical Physics 101(5):
3506-3513. Continetti, R. E. (1998). International Reviews in Physical Chemistry 17(2): 227-260. Corcelli, S. A., J. A. Kelley, et al. (2002). J. Phys. Chem. A 106(19): 4872-4879. Crim, F. F. (1993). Annual Review of Physical Chemistry 44: 397-428. Cubero, E., F. J. Luque, et al. (1998). Proceedings of the National Academy of
Sciences of the United States of America 95(11): 5976-5980. Danten, Y., T. Tassaing, et al. (1999). Journal of Physical Chemistry A 103(18):
3530-3534. de Hoog, P., P. Gamez, et al. (2004). Angewandte Chemie-International Edition
43(43): 5815-5817. Demeshko, S., S. Dechert, et al. (2004). Journal of the American Chemical Society
126(14): 4508-4509. DePuy, C. H. (2000). International Journal of Mass Spectrometry 200(1-3): 79-96. Dessent, C. E. H., M. A. Johnson, et al. (1999). Electron transfer and charge
separation in clusters. Electron Transfer-from Isolated Molecules to Biomolecules, Pt 1. 106: 265-302.
167
Dessent, C. E. H., J. Kim, et al. (1998). Accounts of Chemical Research 31(9): 527-534.
Diederich, T., J. Tiggesbäumker, et al. (2002). Journal of Chemical Physics 116(8):
3263-3269. Dietrich, B., J. M. Lehn, et al. (1969). Tetrahedron Letters(34): 2889-&. Dietrich, B., J. M. Lehn, et al. (1969). Tetrahedron Letters(34): 2885-&. Diken, E. G., G. H. Weddle, et al. (2004). J. Phys. Chem. A 108(46): 10116-10121. Dillow, G. W. and P. Kebarle (1989). Journal of the American Chemical Society
111(15): 5592-5596. Djafari, S., G. Lembach, et al. (1996). Zeitschrift Fur Physikalische Chemie-
International Journal of Research in Physical Chemistry & Chemical Physics 195: 253-272.
Donaldson, D. J., A. F. Tuck, et al. (2003). Chemical Reviews 103(12): 4717-4729. Dopfer, O. (2003). International Reviews in Physical Chemistry 22(3): 437-495. Dopfer, O. (2005). Zeitschrift Fur Physikalische Chemie-International Journal of
Research in Physical Chemistry & Chemical Physics 219(2): 125-168. Dougherty, D. A. (1996). Science 271(5246): 163-168. Dunbar, R. C. (2000). International Journal of Mass Spectrometry 200(1-3): 571-589. Duncan, M. A. (1997). Annual Review of Physical Chemistry 48: 69-93.
168
Duncan, M. A. (2000). International Journal of Mass Spectrometry 200(1-3): 545-569.
Duncan, M. A. (2003). International Reviews in Physical Chemistry 22(2): 407-435. Dunn, M. E., G. C. Shields, et al. (2008). Journal of Physical Chemistry A 112(41):
10226-10235. Ebata, T., A. Fujii, et al. (1998). International Reviews in Physical Chemistry 17(3):
331-361. Elles, C. G. and F. F. Crim (2006). Annual Review of Physical Chemistry 57:
273-302. Eustis, S. N., D. Wang, et al. (2007). Journal of Chemical Physics 127(11). Farrar, J. M. (2003). International Reviews in Physical Chemistry 22(4): 593-640. Federmann, F., K. Hoffmann, et al. (1999). European Physical Journal D 9(1-4):
11-14. Feil, S. (2008). Chemie in Unserer Zeit 42(2): 67-67. Fielicke, A., G. Meijer, et al. (2003). Journal of the American Chemical Society
125(12): 3659-3667. Frankiss, S. G. and D. J. Harrison (1975). Spectrochimica Acta Part a-Molecular and
Biomolecular Spectroscopy 31(12): 1839-1864. Freiser, B. S. (1996). Journal of Mass Spectrometry 31(7): 703-715. French, M. A., S. Ikuta, et al. (1982). Canadian Journal of Chemistry-Revue
Canadienne De Chimie 60(15): 1907-1918.
169
Frisch, M. J., G. W. Trucks, et al. (2004). Gaussian 03. Wallingford CT, Gaussian,
Inc. Frontera, A., F. Saczewski, et al. (2005). Chemistry-a European Journal 11(22):
6560-6567. Fujii, A., T. Sawamura, et al. (1994). Chemical Physics Letters 225(1-3): 104-107. Gale, P. A. (2000). Coordination Chemistry Reviews 199: 181-233. Gale, P. A. (2001). Coordination Chemistry Reviews 213: 79-128. Gallivan, J. P. and D. A. Dougherty (1999). Organic Letters 1(1): 103-105. Gantefor, G., G. S. IckingKonert, et al. (1996). International Journal of Mass
Spectrometry and Ion Processes 159: 81-109. Garau, C., A. Frontera, et al. (2003). Chemphyschem 4(12): 1344-1348. Garau, C., A. Frontera, et al. (2004). Chemical Physics Letters 392(1-3): 85-89. Garau, C., A. Frontera, et al. (2004). Journal of Physical Chemistry A 108(43):
9423-9427. Garau, C., D. Quinonero, et al. (2003). New Journal of Chemistry 27(2): 211-214. Garau, C., D. Quinonero, et al. (2005). Journal of Physical Chemistry A 109(41):
9341-9345. Garau, C., D. Quinonero, et al. (2007). Chemical Physics Letters 438: 104-108. Garrett, W. R. (1971). Physical Review A 3(3): 961-&.
170
Gleave, J. L., E. D. Hughes, et al. (1935). Journal of the Chemical Society: 236-244. Grebenev, S., E. Lugovoi, et al. (2001). Faraday Discussions 118: 19-32. Gulley, R. J., S. L. Lunt, et al. (1998). Journal of Physics B-Atomic Molecular and
Optical Physics 31(12): 2735-2751. Gutsev, G. L. and R. J. Bartlett (1998). Molecular Physics 94(1): 121-125. Häkkinen, H., W. Abbet, et al. (2003). Angewandte Chemie-International Edition
42(11): 1297-1300. Hashmi, A. S. K. and G. J. Hutchings (2006). Angewandte Chemie-International
Edition 45(47): 7896-7936. Hay, B. P. and V. S. Bryantsev (2008). Chemical Communications(21): 2417-2428. Heiz, U. and E. L. Bullock (2004). Journal of Materials Chemistry 14(4): 564-577. Hendricks, J. H., H. L. de Clercq, et al. (2002). Journal of Chemical Physics 116(18):
7926-7938. Hermansson, K. (1993). Journal of Chemical Physics 99(2): 861-868. Hiraoka, K., S. Mizuse, et al. (1988). Chemical Physics Letters 147(2-3): 174-178. Hong, X. Y., S. Chen, et al. (1995). Journal of Physical Chemistry 99(22):
9102-9109. Hotop, H. and W. C. Lineberger (1985). Journal of Physical and Chemical Reference
Data 14(3): 731-750.
171
Hubner, G. M., J. Glaser, et al. (1999). Angewandte Chemie-International Edition 38(3): 383-386.
Huey, L. G., D. R. Hanson, et al. (1995). Journal of Physical Chemistry 99(14):
5001-5008. Huisken, F., M. Kaloudis, et al. (1996). Journal of Chemical Physics 104(1): 17-25. Ingold, C. K. (1969). Structure and Reactivity in Organic Chemistry. Ithaca, NY,
Cornell University Press. Irion, M. P. (1992). International Journal of Mass Spectrometry and Ion Processes
121(1-2): 1-47. Jackson, C. J., Gazzolo, F.H. (1900). Journal of the American Chemical Society 23:
376. Jacox, M. E. and D. E. Milligan (1974). Chemical Physics Letters 28(2): 163-168. Jaeger, T. D., D. van Heijnsbergen, et al. (2004). Journal of the American Chemical
Society 126(35): 10981-10991. Jeffrey, G. A. (1997). An Introduction to Hydrogen Bonding. New York, Oxford
University Press. Johnson, M. A. and W. C. Lineberger (1988). Techniques for the Study of Gas-Phase
Ion Molecule Reactions. J. M. Farrar and W. Saunders. New York, Wiley: 591.
Jungwirth, P. and D. J. Tobias (2001). Journal of Physical Chemistry B 105(43):
10468-10472. Jungwirth, P. and D. J. Tobias (2002). Journal of Physical Chemistry A 106(2):
379-383.
172
Jungwirth, P. and D. J. Tobias (2002). Journal of Physical Chemistry B 106(25): 6361-6373.
Jungwirth, P. and D. J. Tobias (2006). Chemical Reviews 106(4): 1259-1281. Kawaguchi, K. and E. Hirota (1986). Journal of Chemical Physics 84(6): 2953-2960. Kawamata, H., T. Maeyama, et al. (2003). Chemical Physics Letters 370(3-4):
535-541. Kebarle, P. and S. Chowdhury (1987). Chemical Reviews 87(3): 513-534. Kim, D., P. Tarakeshwar, et al. (2004). Journal of Physical Chemistry A 108(7):
1250-1258. Kimble, M. L. and A. W. Castleman (2004). International Journal of Mass
Spectrometry 233(1-3): 99-101. Kimble, M. L., A. W. Castleman, et al. (2004). Journal of the American Chemical
Society 126(8): 2526-2535. Klots, C. E. (1985). Journal of Chemical Physics 83(11): 5854-5860. Knapp, M., O. Echt, et al. (1986). Chemical Physics Letters 126(3-4): 225-231. Knickelbein, M. B. (1999). Philosophical Magazine B-Physics of Condensed Matter
Statistical Mechanics Electronic Optical and Magnetic Properties 79(9): 1379-1400.
Knighton, W. B., D. R. Zook, et al. (1990). Journal of the American Society for Mass
Spectrometry 1(5): 372-381. Krestov, G. A. (1994). Ionic Solvation, Prentice Hall.
173
Kryachko, E. S. (2008). Journal of Molecular Structure 880(1-3): 23-30. Laerdahl, J. K. and E. Uggerud (2002). International Journal of Mass Spectrometry
214(3): 277-314. Larson, J. W. and T. B. McMahon (1984). Journal of the American Chemical Society
106(3): 517-521. Lee, C. T., W. T. Yang, et al. (1988). Physical Review B 37(2): 785-789. Lenzer, T., I. Yourshaw, et al. (2001). Journal of Chemical Physics 115(8):
3578-3589. Lenzer, T., I. Yourshaw, et al. (1999). Journal of Chemical Physics 110(19): 9578-
9586. Leopold, D. G., J. Ho, et al. (1987). Journal of Chemical Physics 86(4): 1715-1726. Lisy, J. M. (1997). International Reviews in Physical Chemistry 16(3): 267-289. Lisy, J. M. (2006). Journal of Chemical Physics 125(13). Loh, Z. M., R. L. Wilson, et al. (2003). J. Chem. Phys. 119(18): 9559-9567. Lugez, C. L., M. E. Jacox, et al. (1998). Journal of Chemical Physics 108(23):
9639-9650. Lyapustina, S. A., S. K. Xu, et al. (2000). J. Chem. Phys. 112(15): 6643-6648. Ma, J. C. and D. A. Dougherty (1997). Chemical Reviews 97(5): 1303-1324. Maeda, H. and H. Furuta (2004). Journal of Porphyrins and Phthalocyanines 8(1-3):
67-75.
174
Maeda, H., A. Osuka, et al. (2004). Journal of Inclusion Phenomena and Macrocyclic Chemistry 49(1-2): 33-36.
Maeyama, T., I. Yagi, et al. (2006). Journal of Physical Chemistry A 110(51):
13712-13716. Maienfisch, P. and R. G. Hall (2004). Chimia 58(3): 93-99. Marshall, A. G. and L. Schweikhard (1992). International Journal of Mass
Spectrometry and Ion Processes 118: 37-70. Mascal, M., A. Armstrong, et al. (2002). Journal of the American Chemical Society
124(22): 6274-6276. Meisenheimer, J. (1902). Justus Liebigs Annalen Der Chemie 323(1/3): 205-246. Metz, R. B. (2004). International Reviews in Physical Chemistry 23(1): 79-108. Mikosch, J., S. Trippel, et al. (2008). Science 319(5860): 183-186. Miller, T. M., J. M. Van Doren, et al. (2004). International Journal of Mass
Spectrometry 233(1-3): 67-73. Misaizu, F., K. Tsukamato, et al. (1995). Laser Chemistry 15(2-4): 195-207. Misaizu, F., K. Tsukamoto, et al. (1996). Surface Review and Letters 3(1): 405-410. Mitsui, M., A. Nakajima, et al. (2002). Journal of Chemical Physics 117(21):
9740-9749. Mitsui, M., A. Nakajima, et al. (2001). Journal of Chemical Physics 115(13):
5707-5710.
175
Müller-Dethlefs, K., O. Dopfer, et al. (1994). Chemical Reviews 94(7): 1845-1871. Müller-Dethlefs, K. and E. W. Schlag (1998). Angewandte Chemie-International
Edition 37(10): 1346-1374. Muntean, F., M. S. Taylor, et al. (2004). Journal of Chemical Physics 121(12):
5676-5687. Myshakin, E. M., K. D. Jordan, et al. (2003). Journal of Chemical Physics 119(19):
10138-10145. Neilson, G. W., P. E. Mason, et al. (2001). Philosophical Transactions of the Royal
Society of London Series a-Mathematical Physical and Engineering Sciences 359(1785): 1575-1591.
Nesbitt, D. J. and R. W. Field (1996). Journal of Physical Chemistry 100(31):
12735-12756. Neumark, D. M. (2001). Annual Review of Physical Chemistry 52: 255-277. Neumark, D. M. (2005). Physical Chemistry Chemical Physics 7(3): 433-442. Neumark, D. M., K. R. Lykke, et al. (1985). Journal of Chemical Physics 83(9):
4364-4373. Niedner-Schatteburg, G. and V. E. Bondybey (2000). "FT-ICR studies of solvation
effects in ionic water cluster reactions." Chemical Reviews 100(11): 4059-4086.
Nielsen, S. B., P. Ayotte, et al. (1999). Journal of Chemical Physics 111(21):
9593-9599. Oepts, D., A. F. G. Vandermeer, et al. (1995). Infrared Physics & Technology 36(1):
297-308.
176
Olkhov, R. V., S. A. Nizkorodov, et al. (1998). Journal of Chemical Physics 108(24):
10046-10060. Olmstead, W. N. and J. I. Brauman (1977). Journal of the American Chemical Society
99(13): 4219-4228. Onda, M., H. Yamada, et al. (1994). Journal of Molecular Structure 319: 297-299. Oomens, J., D. T. Moore, et al. (2004). Physical Chemistry Chemical Physics 6(4):
710-718. Oomens, J., B. G. Sartakov, et al. (2006). International Journal of Mass Spectrometry
254(1-2): 1-19. Ovenall, D. W. and D. H. Whiffen (1961). Molecular Physics 4(2): 135-144. Page, R. H., Y. R. Shen, et al. (1988). Journal of Chemical Physics 88(9): 5362-5376. Page, R. H., Y. R. Shen, et al. (1988). Journal of Chemical Physics 88(8): 4621-4636. Parent, D. C. and S. L. Anderson (1992). Chemical Reviews 92(7): 1541-1565. Park, C. H. and H. E. Simmons (1968). Journal of the American Chemical Society
90(9): 2431-&. Parr, R. G. and W. Yang (1989). Density-Functional Theory of Atoms and Molecules.
New York, Oxford University Press. Paul, G. J. C. and P. Kebarle (1991). Journal of the American Chemical Society
113(4): 1148-1154. Pearson, R. G. (1963). Journal of the American Chemical Society 85(22): 3533 - 3539.
177
Pedersen, C. J. (1967). Journal of the American Chemical Society 89(26): 7017-&. Perelygin, I. S. and N. R. Safiullina (1967). Zh. Strukt. Khim. 8: 205. Pliva, J. and A. S. Pine (1987). Journal of Molecular Spectroscopy 126(1): 82-98. Powell, D. H., G. W. Neilson, et al. (1993). Journal of Physics-Condensed Matter
5(32): 5723-5730. Price, E. A., N. I. Hammer, et al. (2004). Journal of Physical Chemistry A 108(18):
3910-3915. Price, E. A., W. H. Robertson, et al. (2002). Chemical Physics Letters 366(3-4):
412-416. Quinonero, D., A. Frontera, et al. (2006). Chemphyschem 7(12): 2487-2491. Quinonero, D., C. Garau, et al. (2002). Chemical Physics Letters 359(5-6): 486-492. Quinonero, D., C. Garau, et al. (2002). Angewandte Chemie-International Edition
41(18): 3389-3392. Rathbone, G. J., T. Sanford, et al. (2005). Chemical Physics Letters 401(4-6):
570-574. Ravishankara, A. R., S. Solomon, et al. (1993). Science 259(5092): 194-199. Reimers, J. R., R. O. Watts, et al. (1982). Chemical Physics 64(1): 95-114. Reinhard, B. M., A. Lagutschenkov, et al. (2004). J. Phys. Chem. A 108(16):
3350-3355.
178
Reuter, C., W. Wienand, et al. (1999). Chemistry-a European Journal 5(9): 2692-2697.
Riehn, C., K. Buchhold, et al. (2000). Journal of Chemical Physics 112(3):
1170-1177. Robertson, W. H., E. G. Diken, et al. (2003). Science 299(5611): 1367-1372. Robertson, W. H. and M. A. Johnson (2003). Annual Review of Physical Chemistry
54: 173-213. Robertson, W. H., J. A. Kelley, et al. (2000). Journal of Chemical Physics 113(18):
7879-7884. Robertson, W. H., J. A. Kelley, et al. (2000). Review of Scientific Instruments
71(12): 4431-4434. Robertson, W. H., E. A. Price, et al. (2003). J. Phys. Chem. A 107(34): 6527-6532. Rodgers, M. T. and P. B. Armentrout (2000). Mass Spectrometry Reviews 19(4):
215-247. Rosokha, Y. S., S. V. Lindeman, et al. (2004). Angewandte Chemie-International
Edition 43(35): 4650-4652. Sampson, R. K. and W. D. Lawrance (2003). Australian Journal of Chemistry 56(4):
275-277. Sanchez, A., S. Abbet, et al. (1999). J. Phys. Chem. A 103(48): 9573-9578. Sanov, A. and W. C. Lineberger (2004). Physical Chemistry Chemical Physics 6(9):
2018-2032. Schäfer, A., C. Huber, et al. (1994). Journal of Chemical Physics 100(8): 5829-5835.
179
Schiedt, J., W. J. Knott, et al. (2000). Journal of Chemical Physics 113(21): 9470-9478.
Schmatz, S. (2004). Chemphyschem 5(5): 600-617. Schneider, H., A. D. Boese, et al. (2005). Journal of Chemical Physics 123: 084307. Schneider, H., Takahashi, K., Skodje, R.T., Weber, J.M. (2009). in preparation. Schneider, H., K. M. Vogelhuber, et al. (2008). Journal of Physical Chemistry A
112(33): 7498-7506. Schneider, H., K. M. Vogelhuber, et al. (2007). Journal of the American Chemical
Society 129: 13022. Schneider, H., K. M. Vogelhuber, et al. (2007). Journal of Chemical Physics 127:
114311. Schneider, H. and J. M. Weber (2007). Journal of Chemical Physics 127: 244310. Schooss, D. (1999). Dissertation, Universität Karlsruhe (TH). Schooss, D., S. Gilb, et al. (2000). Journal of Chemical Physics 113(13): 5361-5371. Schottel, B. L., H. T. Chifotides, et al. (2008). Chemical Society Reviews 37(1):
68-83. Schröder, D. and H. Schwarz (2003). Modern Mass Spectrometry. 225: 133-152. Schwarz, H. (2003). Angewandte Chemie-International Edition 42(37): 4442-4454. Schwarz, H. (2004). International Journal of Mass Spectrometry 237(1): 75-105.
180
Shigeto, S., Y. Pang, et al. (2008). Journal of Physical Chemistry B 112(2): 232-241. Shin, J. W., N. I. Hammer, et al. (2005). J. Phys. Chem. A 109(14): 3146-3152. Shvartsburg, A. A., R. R. Hudgins, et al. (2001). Chemical Society Reviews 30(1):
26-35. Simard, B., S. Denommee, et al. (2002). Chemical Physics Letters 357(3-4): 195-203. Singh, P. C. and G. N. Patwari (2007). Journal of Physical Chemistry A 111(16):
3178-3183. Socaciu, L. D., J. Hagen, et al. (2003). Journal of the American Chemical Society
125(34): 10437-10445. Solca, N. and O. Dopfer (2000). Chemical Physics Letters 325(4): 354-359. Stoermer, C. W., S. Gilb, et al. (1998). Review of Scientific Instruments 69(4):
1661-1664. Stolow, A., A. E. Bragg, et al. (2004). Chemical Reviews 104(4): 1719-1757. Strauss, M. J. (1970). Chemical Reviews 70(6): 667-&. Strauss, M. J. (1974). Accounts of Chemical Research 7(6): 181-188. Sturges, W. T., T. J. Wallington, et al. (2000). Science 289(5479): 611-613. Takahashi, K., Skodje R.T., private communication. Takahashi, K., K. L. Plath, et al. (2008). Journal of Physical Chemistry A 112(32):
7321-7331.
181
Taylor, M. S., J. Barbera, et al. (2005). Journal of Chemical Physics 122(5). Taylor, M. S., F. Muntean, et al. (2004). Journal of Chemical Physics 121(12):
5688-5699. Terasaki, A., S. Minemoto, et al. (1999). European Physical Journal D 9(1-4):
163-168. Thompson, C. D., B. L. J. Poad, et al. (2006). Chemical Physics Letters 428(1-3):
18-22. Thompson, W. H. and J. T. Hynes (2000). Journal of the American Chemical Society
122(26): 6278-6286. Tschurl, M., C. Ueberfluss, et al. (2007). Chemical Physics Letters 439(1-3): 23-28. Vaden, T. D., C. J. Weinheimer, et al. (2004). Journal of Chemical Physics 121(7):
3102-3107. Vaida, V. (2005). International Journal of Photoenergy 7(2): 61-70. Vaida, V., K. J. Feierabend, et al. (2008). International Journal of Photoenergy. van Heijnsbergen, D., G. von Helden, et al. (1999). Physical Review Letters 83(24):
4983-4986. van Heijnsbergen, D., G. von Helden, et al. (2002). Journal of the American Chemical
Society 124(8): 1562-1563. Vanbrunt, R. J. and J. T. Herron (1990). Ieee Transactions on Electrical Insulation
25(1): 75-94. Viggiano, A. A., S. T. Arnold, et al. (1998). International Reviews in Physical
Chemistry 17(2): 147-184.
182
Viggiano, A. A., R. A. Morris, et al. (1992). Journal of the American Chemical Society 114(26): 10477-10482.
Volatron, F. and C. Roche (2007). Chemical Physics Letters 446(4-6): 243-249. Walrafen, G. E. (1967). Journal of Chemical Physics 47(1): 114-&. Wang, X. B., X. Yang, et al. (2002). International Reviews in Physical Chemistry
21(3): 473-498. Weber, J. M. (2005). Review of Scientific Instruments 76: 043301. Weber, J. M., J. A. Kelley, et al. (2000). Science 287(5462): 2461-2463. Weber, J. M., J. A. Kelley, et al. (2001). Journal of Chemical Physics 114(6):
2698-2706. Weber, J. M., W. H. Robertson, et al. (2001). Journal of Chemical Physics 115(23):
10718-10723. Weigend, F. and M. Häser (1997). Theoretical Chemistry Accounts 97(1-4): 331-340. Weigend, F., M. Häser, et al. (1998). Chemical Physics Letters 294(1-3): 143-152. Weinkauf, R., K. Walter, et al. (1989). Zeitschrift Fur Naturforschung Section a-a
Journal of Physical Sciences 44(12): 1219-1225. Weis, P., S. Gilb, et al. (2002). International Journal of Mass Spectrometry 216(1):
59-73. Wester, R., A. E. Bragg, et al. (2003). Journal of Chemical Physics 119(19):
10032-10039.
183
Wigner, E. P. (1948). Physical Review 73(9): 1002-1009. Wiley, W. C. and I. H. McLaren (1955). Review of Scientific Instruments 26(12):
1150-1157. Williams, J. H., J. K. Cockcroft, et al. (1992). Angewandte Chemie-International
Edition in English 31(12): 1655-1657. Wilson, E. B. (1934). Physical Review 45(10): 0706-0714. Woronowicz, E. A., W. H. Robertson, et al. (2002). Journal of Physical Chemistry A
106(31): 7086-7089. Worz, A. S., U. Heiz, et al. (2005). Journal of Physical Chemistry B 109(39):
18418-18426. Wu, D. Y., S. Duani, et al. (2008). Journal of Physical Chemistry A 112(6):
1313-1321. Wyttenbach, T. and M. T. Bowers (2003). Modern Mass Spectrometry. 225: 207-232. Xantheas, S. S. (1996). Journal of Physical Chemistry 100(23): 9703-9713. Xantheas, S. S. and T. H. Dunning (1994). Journal of Physical Chemistry 98(51):
13489-13497. Xie, Y. M., H. F. Schaefer, et al. (2003). Chemical Communications(1): 102-103. Yamada, Y., J. Okano, et al. (2006). Chemical Physics Letters 432(4-6): 421-425. Yates, B. F., H. F. Schaefer, et al. (1988). Journal of the American Chemical Society
110(19): 6327-6332.
184
Yoon, B., H. Hakkinen, et al. (2005). Science 307(5708): 403-407. Zhan, C. G. and S. Iwata (1995). Chemical Physics Letters 232(1-2): 72-78. Zheng, W., X. Li, et al. (2007). Chemical Physics Letters 444(4-6): 232-236.