INFRARED THERMOGRAPHY 1. INTRODUCTION Infrared thermography (IR/T) as a condition monitoring technique is used to remotely gather thermal information for monitoring the condition of virtually all of the electrical components on an entire system and from generation to end user. When equipments operating under regular conditions, has a normal operating thermal signature which is typical of the specific component being inspected. Infrared thermography presents this normal signature or baseline to us. Once the baseline is established, IR/T will reveal the thermal variances deviating from the norm this localized thermal deviation can either be caused by an overheated condition or absence of heat. The information is reviewed and decisions are made for repair or to plot the temperature change over time and repair the component at a more opportune time. The information can be stored and fully analyzed at a later date providing complete computer aided predictive maintenance capabilities and trending. Infrared Thermography is currently experiencing rapid growth as more and more electric utilities and industrial sectors are embracing the technology. The reason for this growth is company personnel understand the benefits of this non-contact, nondestructive method. The main benefit being,to find deteriorating components prior to catastrophic failure. Thermography provides another set of eyes allowing a whole new DEPT. OF EEE. KLEIT, HUBLI 1
Transcript
INFRARED THERMOGRAPHY
1. INTRODUCTION
Infrared thermography (IR/T) as a condition monitoring technique is used to remotely
gather thermal information for monitoring the condition of virtually all of the electrical
components on an entire system and from generation to end user. When equipments operating
under regular conditions, has a normal operating thermal signature which is typical of the
specific component being inspected. Infrared thermography presents this normal signature or
baseline to us. Once the baseline is established, IR/T will reveal the thermal variances
deviating from the norm this localized thermal deviation can either be caused by an
overheated condition or absence of heat. The information is reviewed and decisions are made
for repair or to plot the temperature change over time and repair the component at a more
opportune time. The information can be stored and fully analyzed at a later date providing
complete computer aided predictive maintenance capabilities and trending.
Infrared Thermography is currently experiencing rapid growth as more and more
electric utilities and industrial sectors are embracing the technology. The reason for this
growth is company personnel understand the benefits of this non-contact, nondestructive
method. The main benefit being,to find deteriorating components prior to catastrophic failure.
Thermography provides another set of eyes allowing a whole new level of diagnostic aid and
problem solving.
Infrared Thermography is simply a picture of heat, when you consider our natural
environment; everything is radiating a particular intensity of thermal energy. Our eyes are
unable to see this infrared energy unless the temperature of the object goes beyond 5000C.
With an infrared imaging instrument the thermal energy surrounding us can be detected,
imaged, measured and stored for analysis.Temperature and the resulting thermal behavior of
electric power generation and distribution equipment and industrial electrical systems and
processes are the most critical factors in the reliability of any operation or facility.
Temperature is by far the most measured quantity in any industrial environment. For
these reasons, monitoring the thermal operating condition of electrical and electromechanical
equipment is considered to be key to increasing operational reliability.
DEPT. OF EEE. KLEIT, HUBLI 1
INFRARED THERMOGRAPHY
In 1800, astronomer Sir William Herschel discovered infrared, and thus began the
exploration .of the science of thermography In 1800, astronomer Sir William Herschel
discovered infrared, and thus began the exploration of the science of thermography. Sir
William designed and created his owntelescopes – becoming very familiar with lenses,
mirrors and light refraction. His thermography research began with the knowledge that
sunlight was made up of all the colors of the spectrum, and that it was also a source ofheat, so
he set out to determine which color(s) were responsible for heating objects. The first
thermography experiment utilized a prism, paperboard, and thermometers with blackened
bulbs where the temperatures of the different colors were measured. As sunlight passed
through the prism, Sir William observed an increase in temperature as he moved the
thermometer from violet to red in the rainbow created by the light.Herschel noted that the
hottest temperature was actually beyond red light, and that the radiation causing this heating
was invisible. He called this invisible radiation "calorific rays." Today, we refer to the
light/energy as
Infrared, and the measuring of the heat emitted as thermal thermography Temperature
is one of the important parameters to tell the condition of internal Process, material and even
quality of the desired output. A qualitative but accurate conclusion can be drawn by observing
the temperature profile of any surface. On the other hand higher temperature also indicates
obvious loss of energy in the form of heat. Therefore temperature monitoring would give
ample indication of the condition of the material, process quality and explore the possibility of
energy conservation avenues. In recent years, many temperature monitoring techniques have
been in use in our industries. These techniques find their application based on the measurable
temperature range, sensitivity and ease in application. A comparison of various typical
techniques has been given in table no. 1. With the on-line condition monitoring technology
becoming an inevitable part of maintenance strategy in today’s scenario, non-contact type
temperature monitoring methods have become more popular. Infrared Thermography is such
a non-contact type technique which provides a fast, reliable and accurate temperature profile
of any material surface.
DEPT. OF EEE. KLEIT, HUBLI 2
INFRARED THERMOGRAPHY
2. What is Infrared Thermography
Thermography is nothing but the temperature profiling of a surface or point. As the
Name suggests, infrared thermography is based on Infrared (IR) technique. The principle
underlying t his technique is that every object emits certain amount of IR energy and the
Intensity of this IR radiation is a function of temperature. In an electromagnetic spectrum the IR
region appears between 0.8 micron to 1000 micron wavelength (See Figure 1).This wavelength
of IR spectrum is more than that of a visible spectrum. The IR energy which can directly
represent the surface temperature can be detected and quantified by the help of IR scanning
system.
DEPT. OF EEE, KLEIT, HUBLI 3
INFRARED THERMOGRAPHY
2.1 The Thermography Instrument
A thermography instrument can be a thermal pointer or a thermal scanner. The thermal
pointer reads the temperature of a specific dimensional point where as a scanner maps the
thermal profile of an area surface.
The basic IR system consists of an “IR energy detector” and a “Monitor”. The scanner is
an opt mechanical device which converts the IR energy received from an object surface to an
electrical signal. These signals are further fed into the monitor where it is processed and
presented in many forms like simple digital display to indicate temperature level and a video
display for thermal profile (See Figure 2).
DEPT. OF EEE, KLEIT, HUBLI 4
INFRARED THERMOGRAPHY
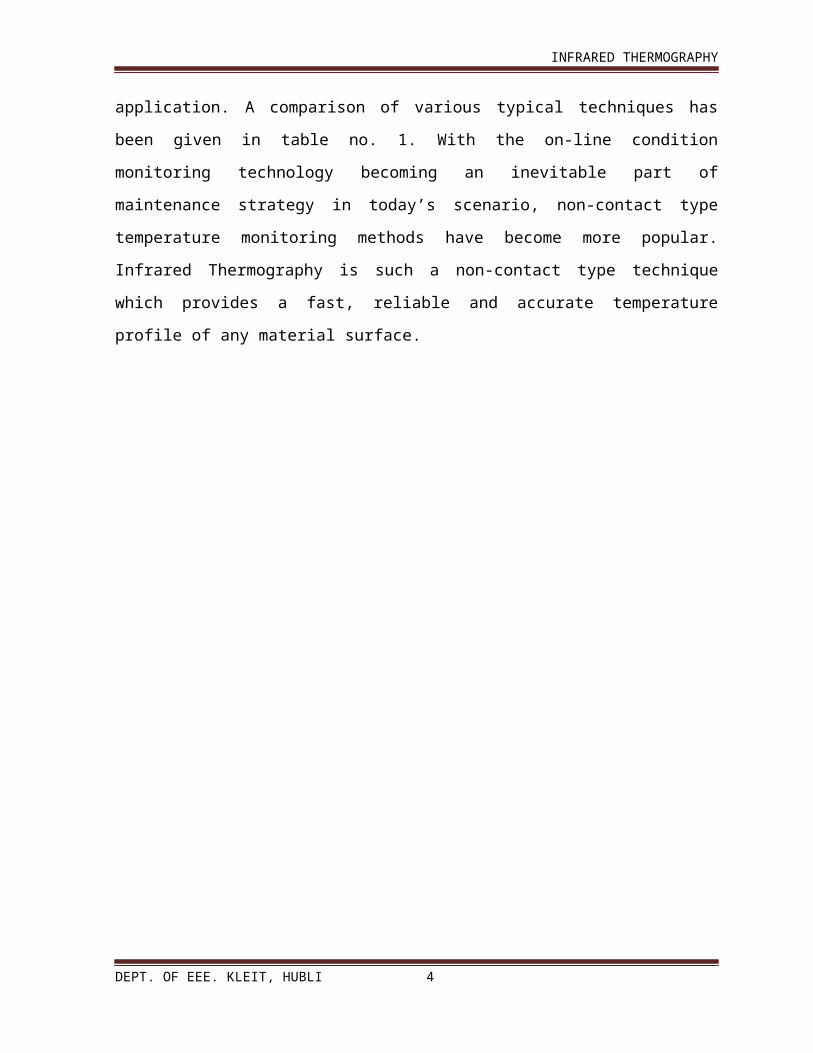
2.2 Test Equipment
Hand held portable camera
I. Battery Powered
II. Operating at correct wavelength
III. Range…..-20°c to +1500°c
IV. Sensitivity…..0.1°c at 30°c
V. Real time display
VI. Image Recording capability
DEPT. OF EEE, KLEIT, HUBLI 5
INFRARED THERMOGRAPHY
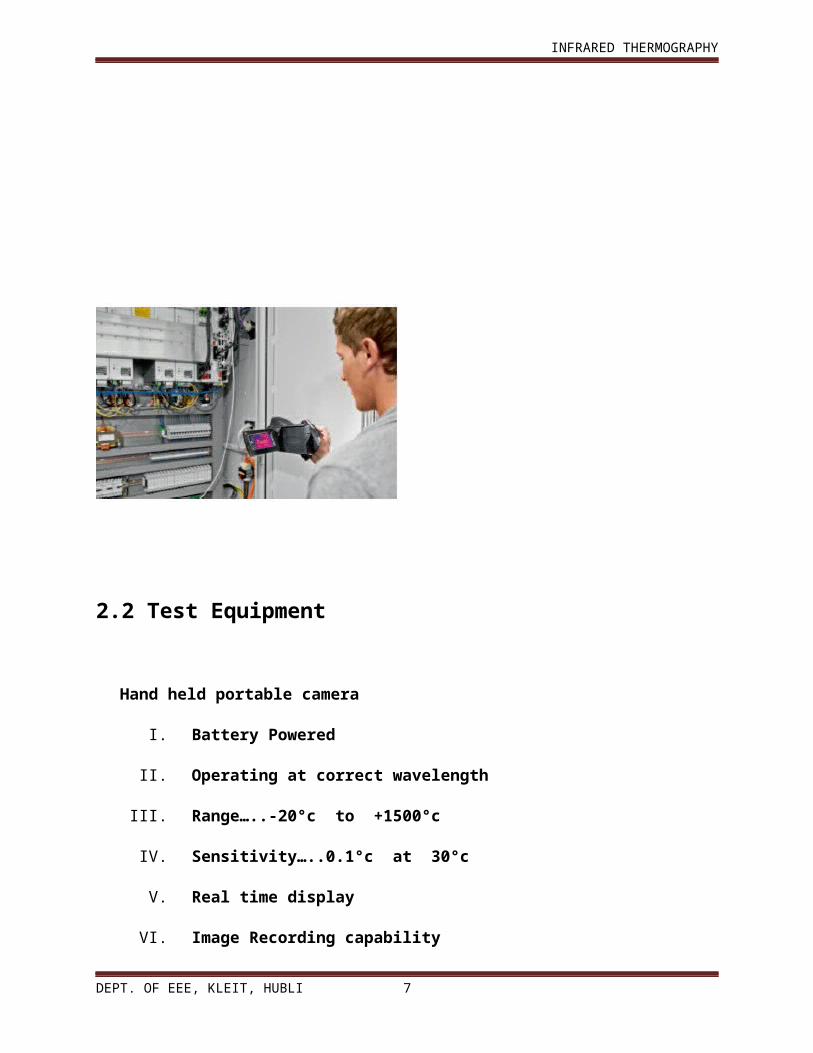
3. Electrical Thermography
Infrared Thermography is simply a picture of heat. All the bodies emit energy from their
surface as electromagnetic waves, which magnitude is directly related to their temperature. The
hotter the object is, the more energy it tends to radiate. Such temperature settles the wavelength
of the emitted energy; the colder the object is, the higher its wavelength will be, whereas the
hotter it is, the lower its wavelength will be. This last case, is the one of the infrared energy, non
visible to the human eye, but visible by means of an infrared camera. The radiation measured by
the infrared camera depends not only on the temperature of the object but also on its emissivity.
The radiation coming from the surrounding area and reflected on the object also influences the
measuring. Therefore, to measure the temperature accurately, besides the effects of different
sources of radiation that interact with the object, other variables such as emissivity, distance
between the camera and the object scanned, environment temperature and humidity, must also be
considered. In addition, due to the characteristics of the infrared radiation, to detect any
overheating by IR scans, the heat generated must be “directly” in sight of the thermographer. .
All electrical maintenance personnel know as soon as new electrical components are installed
they begin to deteriorate. With fluctuating and continual loads, vibration, fatigue, age, and other
things like operating environment, all of these will increase the probability of faults in electrical
components. These faults, if not found and taken care of, will lead to catastrophic failures,
unplanned shutdowns
3.1. Typical faults in electrical componentsAll electrical devices are usually rated for power, which indicates the amount of energy
that the devices can conduct without being damaged. If the device is operated at a power above
its speciecations, the excess power can reduce the device's life cycle and efficiency. Basically,
faults in electrical power system can be classified into few categories, i.e., poor connection, short
circuit, overloading, load imbalance and improper component installation. In most cases, the
major cause of overheating in utility components is the change in resistance due to lose
connection. The loose connection causes electricity to use smaller area of the defective
connection than required for proper current °o w and therefore, increases the resistance and
DEPT. OF EEE, KLEIT, HUBLI 6
INFRARED THERMOGRAPHY
temperature of the connection. Any problem, which accompanies a change in resistance of the
equipment, causes it to consume more power than the intended load.
According to a thermographic survey conducted during the period of 1999 it was found
that 48% of the problems were found in conductor connection accessories and bolted
connections. This is mainly resulted from the loose connection, corrosion, rust and non-adequate
use of inhibitory grease. On the other hand, 45% of the thermal anomalies appear in
disconnections contacts.
Most of the anomalies are due to deformations, decent pressure of contact, incorrect
alignment of arms and dirtiness. Only 7% of the problems were found in electrical equipments.
Another major cause of overheating in electrical components within the structure is overloading. Through IRT camera, the sign of overloading can be seen clearly even if the cable was located
deep into the concrete
• Transformer
– Pad Mount
– Dry
– Overhead
• Service Entrance
• Distribution Panels
• Control Panels
• Rectifiers
• Drives
• Capacitor Banks
• Any Electrical Connection
• Main Switchgear
• Motor Control Centers Disconnects
Bus Duct
3.2 Electrical Inspection Items
4. Infrared Condition Monitoring
DEPT. OF EEE, KLEIT, HUBLI 7
INFRARED THERMOGRAPHY
Temperature is one of the first observable parameters that can indicate the condition of
operating electrical equipment. Heat is a byproduct of all work whether is it electrical,
mechanical or chemical. All industrial processes operate with mechanical, chemical and
electrical energy being converted from one form to another. The natural byproduct of the
conversion process is heat. Heat generated either intentionally or unintentionally is transferred,
contained and otherwise being controlled to suit specific requirements. Thermal energy not in
control will cause problems
Universally, the electric industry understands that temperature is an excellent indicator to
the operating condition and hence the reliability and longevity of an electrical component.
Associations like IEEE, ANSI, IEC and manufacturers all publish standards and temperature
ratings for electrical components. It is well understood that the life of electrical components and
materials is drastically reduced as temperatures are increased. It is logical, then, that evaluating
the thermal signature of electrical systems with Infrared Thermography will provide the
maintenance department, from generation to the end user, with valuable information directly
related to operational conditions of virtually every item through which electric current passes.
Infrared condition monitoring is the technique capable of revealing the presence of an anomaly
by virtue of the thermal distribution profile that the defect produces on the surface of the
component. The defect will normally alter the thermal signature of the surface due to the change
in the amount of heat generated and the heat transfer properties of the component.
To determine an adverse operating temperature of a component it is necessary to first
determine a baseline. For electrical systems the baseline is established when the system is
operating under normal load and operating conditions. Once a clear understanding is obtained on
what the normal thermal signature is for the many electrical apparatuses and components, the
thermography technician will be able to quickly identify a thermal anomaly. On larger more
critical components such as transformers, circuit breakers, capacitors etc., the baseline images
and data will be stored and compared to new data collected from each inspection interval. It is
the job of the thermographer to identify record, analyze and diagnose indications of abnormal
heat transfer in the electrical equipment or components. It is important that the data collected is
DEPT. OF EEE, KLEIT, HUBLI 8
INFRARED THERMOGRAPHY
accurate, repeatable and is properly analyzed. This depends on many variables, the main being
the thermographers level of understanding of infrared instrumentation, background theories and
the level of field experience.
For the classification of thermal abnormalities,
Three critical levels and their corresponding recommended maintenance actions were defined
I -Overheating ≥ 130°C (Serious): immediate outage of the equipment affected for the repairing
of the anomaly.
II - Overheating between 100°C and 130ºC (Priority): repairing of the anomaly as soon as
possible.
III - Overheating between 75°C and 100º C (Programmed): repairing of the anomaly when
possible Correction factors considering the effects of variables such as emissivity, environment
temperature and relative humidity, wind influence and distance to the object were established to
be considered in the measuring. Maximum admitted load ability for the whole facilities to be
scanned were set and tabulated (for instance identifying the equipment with the lowest load
capability of the bay). Therefore, the overheating measured at any level of load could be referred
to such maximum admitted loading level, so as to consider the most unfavorable conditions that
could be present during their operation. Thermographic Reports provide information that
identifies with certainty the item on which a thermal abnormality has been detected, together
with a picture and a thermographic image of the abnormality detected, to facilitate the repairing
tasks for the maintenance personnel. Besides, they add additional information, such as over
temperature registered and temperatures of reference, load level at the time of the scan and
maximum admitted load, overheating above the environment temperature referred to the
maximum admitted load and the real classification of the abnormality


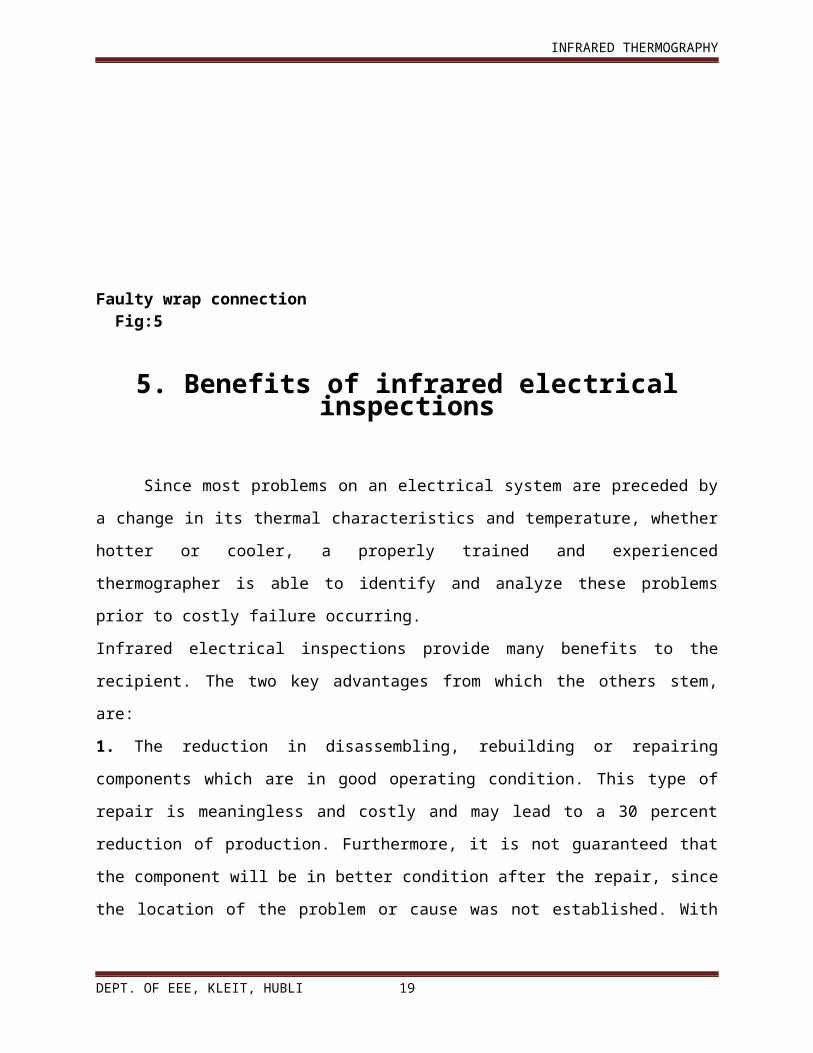


![[INFRARED THERMOGRAPHY] - AOST thermography - Industrial... · Page 2 of 14 1.0 INFRARED THERMOGRAPHY Galea Curmi Engineering is a dynamic organisation providing complete solutions](https://static.documents.pub/doc/80x56/5ac535e47f8b9a57528d8bf8/infrared-thermography-thermography-industrialpage-2-of-14-10-infrared.jpg)


