29
INFRASTRUCTURE FAILURE AND SHORTFALL A guide for corporates to overcome Asia-Pacific’s challenge Risk in Focus
INFRASTRUCTURE FAILURE AND SHORTFALL A guide for corporates to overcome Asia-Pacific’s challenge
Risk in Focus
TA BLE OF CONTE NT S
INTRODUCTION
CRITICAL INFRASTRUCTURE FAILURE/SHORTFALL
Transportation infrastructure
Energy infrastructure
ICT infrastructure
FUTURE COMPLICATIONS: HOW ONGOING TRENDS EXACERBATE INFRASTRUCTURE FAILURE/SHORTFALL
Growing demand from economic, population and urbanization growth
Increasing frequency and unpredictability of climate change events
Cyber dependency and the increased frequency and sophistication of cyber-attacks
BUSINESS IMPLICATIONS
Damages to companies’ operations: congestions, outages and price shocks
Addressing critical infrastructure failure/shortfall: operational and strategic responses
BIBLIOGRAPHY
3
4
10
16
23
INTRODUC TIONAging and outdated infrastructure amplifies our
exposure to major global risks such as natural
catastrophe and cyberattacks. According to the
results of this year’s Global Risks Perception Survey,
which underpins the Global Risks Report 2019, the
failure of critical infrastructure and infrastructure
investment feature prominently among longer-
term concerns. Yet, level of investments often
does not meet what is needed to have resilient
critical infrastructure that will meet our current
and future needs.
Given current investment trends, the Global
Infrastructure Outlook estimates that there will be
a shortfall of $18 trillion dollars in infrastructure
investments by 2040.1 Rising geopolitical and
global economic uncertainties are also placing
pressures on funding that are crucial for new
infrastructure development.
The Asia-Pacific region dominates over half of
the global infrastructure investment needs.
The region has been developing incredibly fast
economically, but the continuation of such growth
will require matching developments in the region’s
infrastructure. However, underinvestment in
critical infrastructure development in Asia-Pacific
is a problem. Whilst some economies such as the
Philippines and Indonesia are pushing ahead with
massive infrastructure programs, many people
in the region continue to suffer from the impacts
of critical infrastructure failure and/or shortfall
such as prolonged traffic congestions and power
outages. Population growth, climate change
and extreme weather events, and growing cyber
dependency in the region will also exacerbate the
shortage of resilient infrastructure while exposing
the vulnerability of existing infrastructure.
This risk-in-focus report is thus dedicated to
discussing the risks of critical infrastructure
failure or shortfall in Asia-Pacific. This report is
an extension of our 2018 edition of the Evolving
Risk Concerns in Asia-Pacific publication which
identifies critical infrastructure failure or shortfall
as a significant long-term threat to doing business
in the region.2 This report begins with an overview
of the critical infrastructure issues in the region and
is followed by an analysis of the ongoing trends
that will influence them, and how businesses can
respond to these threats effectively. Through the
report, we hope to provide vivid illustrations of
how independent risks continue to be enveloped
in mega trends that significantly impact how they
will evolve. While the discussion is primarily from
a business perspective, it also carries relevance to
governments and policymakers.
3Copyright © 2019 Marsh & McLennan Companies
CRITIC A L INFR A S TRUC TURE FA ILURE/S HORTFA LL
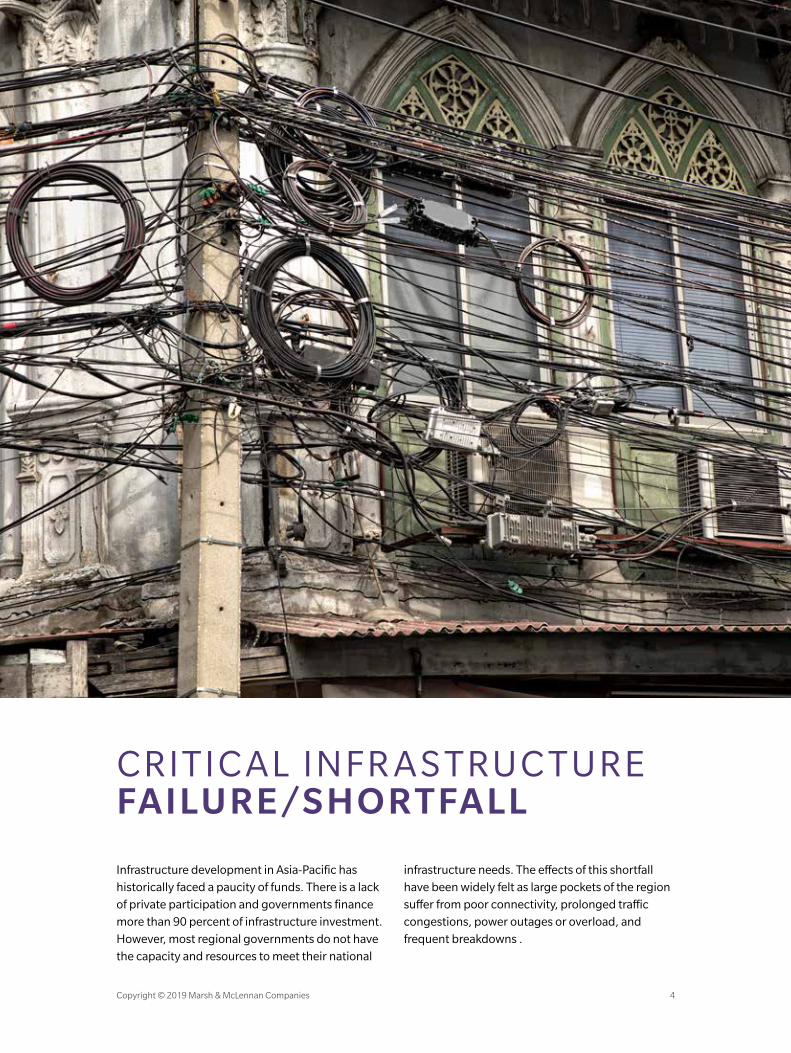
Infrastructure development in Asia-Pacific has
historically faced a paucity of funds. There is a lack
of private participation and governments finance
more than 90 percent of infrastructure investment.
However, most regional governments do not have
the capacity and resources to meet their national
infrastructure needs. The effects of this shortfall
have been widely felt as large pockets of the region
suffer from poor connectivity, prolonged traffic
congestions, power outages or overload, and
frequent breakdowns .
Copyright © 2019 Marsh & McLennan Companies 4

Failure to adequately invest in, upgrade
and/or secure infrastructure networks
(for example, energy, transportation and
communications), leading to pressure or a
breakdown with system-wide implications
World Economic Forum’s definition of “A failure/shortfall in critical infrastructure”
Table 1 shows various indicators for the state
of transportation, energy and information and
communication technology (ICT) infrastructure
for selected countries in Asia-Pacific taken from
the WEF’s Global Competitiveness Index 2017–
2018, the World Energy Council’s (WEC) Energy
Trilemma Index 2018, and World Development
Indicators database.3–5 Advanced economies
in the region are included as benchmarks of
infrastructure development.
An examination of these indicators suggests
that the quality of infrastructure in transportation,
energy and ICT in emerging markets in Asia-
Pacific is at a relatively low level compared to
their advanced counterparts in the region.
Current development in infrastructure is already
unable to keep up with rapid economic growth,
a burgeoning population and rapid rates of
urbanization.6 However, as will be discussed below,
this does not mean advanced economies do not
have their share of problems.
TRANSPORTATION INFRASTRUCTURE
Business perception of the quality of transportation
infrastructure in Asia-Pacific varies significantly
across emerging markets and specific subsectors.
While the quality of infrastructure in Malaysia is
perceived to be nearly at par with that in developed
markets, other countries such as Vietnam and
the Philippines trail significantly behind. A recent
report from the World Bank looked into data from
the Asian Highway Network (AHN),7 a regional
system of priority highways that connects Asian
countries with each other and with Europe, and
found that a significant portion of the AHN in
major emerging markets such as Indonesia and
the Philippines needs restoration.
The poor quality of transportation infrastructure
across the region has resulted in significant
economic costs and continues to do so. The Asian
Development Bank (ADB) estimates that lost time
and increased transportation costs due to road
congestion together cost Asian economies 2–5
percent of GDP every year.8 In the Philippines,
it is estimated that congestion will cost Metro
Manila an astonishing $155 million a day by 2030.9
Research has also pointed to the importance
of transportation to trade flows and economic
growth, suggesting that poor transportation
infrastructure, particularly ports, can result
in significant opportunity cost resulting from
unrealized economic growth.10 In fact, there are
serious concerns over whether markets such as
the Philippines and Vietnam can sustain their
outstanding economic growth rates if weaknesses
in transport infrastructure persist.
5Copyright © 2019 Marsh & McLennan Companies

ENERGY INFRASTRUCTURE
According to the Energy Trilemma Index, which
tracks economies’ performance across the
parameters of energy security, energy equity
and environmental sustainability,11 Asia overall
is underperforming across all three pillars
(Exhibit 1). As with transportation infrastructure,
the substantial increase in energy demand from
economic growth will require substantial additional
development and improvement to the region’s
energy infrastructure.
Exhibit 1: Asia's performance in the World Energy Trilemma 2018
ENERGYSECURITY
ENERGYEQUITY
ENVIRONMENTALSUSTAINABILITY
The three pillars of the Energy Trilemma Indexare defined as followed:
ENERGY SECURITYE�ective management of primary energy supply from domestic and external sources, reliability of energy infrastructure, and ability of energy providers to meet current and future demand.
ENERGY EQUITYAccessibility and a�ordability of energy supply across the population.
ENERGY SUSTAINABILITYEncompasses achievement of supply- and demand-side energy e�ciencies and develop-ment of energy supply from renewable and other low-carbon sources.
Source: Oliver Wyman and World Energy Council
While emerging markets in Asia-Pacific have come
a long way in terms of energy equity, with access
to electricity generally above 90 percent across
much of Asia, an urban-rural access divide remains
a significant challenge to universal electrification in
several countries such as Cambodia and Laos.
In terms of energy security, a major ongoing
challenge in the region is unreliable energy supply.
A key contributing factor is the significant loss
in transmission and distribution (T&D), which
comprises both technical loss due to poor or
inadequate infrastructure, and commercial loss
from theft, non-metered consumption, or errors in
estimations. Emerging markets in Asia-Pacific have
trailed significantly behind advanced economies’
standards for T&D loss. An extreme case is India,
where loss from T&D is a staggering 20 percent
of all electricity consumption. Poor quality and
insufficient energy supply has led to frequent
electric outages that affect companies’ operations.
In particular, uneven and unreliable access to
electricity in South Asia means it suffers from
power outages more frequently than any other
world region (Exhibit 2).11 While less severe in other
growth markets such as Vietnam and Indonesia,
electricity outage remains a major problem in these
countries, where around 25 percent of companies
reported experiencing outages in 2015.
Copyright © 2019 Marsh & McLennan Companies 6

CRITICAL INFRASTRUCTURE FAILURE/SHORFALL
Exhibit 2: Reliability of power supply globally
East Asia and Pacific
Europe and Central Asia
Latin America and the Caribbean
Middle East and North Africa
South Asia
Sub-Saharan Africa
Afghanistan
Bengladesh
Bhutan
India
Nepal
Pakistan
Sri Lanka
0 10 20 30 40 50 60 70 80
Electrical outages in a typical month (NUMBER)
Duration of a typical outage (HOURS)
Firms identifying electricity as a major constraint (PERCENT)
BY SELECTED REGIONS
BY SELECTED COUNTRIES
Source: Zhang, In the Dark: How Much do Power Sector Distortions Cost South Asia? (2018) and World Bank Enterprise Surveys in Afghanistan (2014), Bangladesh (2013), Bhutan (2015), India (2014), Nepal (2013), Pakistan (2013) and Sri Lanka (2011).
Finally, ambitious renewable energy development
plans have been put forward across the region
to improve environmental sustainability. The
Association of Southeast Asian Nations (ASEAN),
for example, has agreed to increase the renewable
energy component of its primary energy supply
from 10 percent in 2015 to 23 percent by 2025.12
According to a report from the International
Renewable Energy Agency, however, ASEAN is
likely to fall short of its target by 6 percent unless
regulators do more in terms of developing the
renewable energy industry (Exhibit 3).13 A key
question, then, is how stakeholders can pursue
environmental sustainability while ensuring the
energy supply necessary for equitable access and
economic development.
7Copyright © 2019 Marsh & McLennan Companies

Exhibit 3: Renewable energy share in ASEAN total primary energy supply (TPES) in 2025 and 2030
0%2014
RENEWABLE ENERGYSHARE IN TPES
5%
10%
15%
20%
25%
2020 2025
THE “GAP”
23%
9.4%
17%
ASEAN TARGET
2014 Reference case REmap
Source: International Renewable Energy Agency (IRENA), Renewable energy market analysis: Southeast Asia, 2018.
ICT INFRASTRUCTURE
Asia-Pacific has been a major site for technological
adoption, exemplified by the rapid penetration and
proliferation of mobile internet devices. Mobile
subscription rates in many countries in the region
are at par, if not already greater than penetration
rates in their more developed counterparts.
However, this has not been the case in other areas
of ICT. Notably, the percentage of the population
using Internet and fixed broadband subscriptions
in emerging markets are both well below that in
advanced economies. The indicators also reveal
inadequacies in ICT security infrastructure and
practices. Only a few companies in emerging
markets conduct encrypted transactions over
the Internet, as shown by the number of secured
internet servers. The number is also markedly low
for several advanced economies, notably South
Korea and Japan.
Limited access to ICT suggests a dearth in
infrastructure despite more investment being
dedicated to the sector in Asia-Pacific. The
demand for infrastructure in this space will
undoubtedly increase substantially with the
growth of online markets and services – and failure
to meet this growing demand will significantly
hamper growth in emerging countries, and
contribute to a widening digital gap domestically
and internationally.14 At the same time, more and
improved ICT infrastructure is also needed from
a cybersecurity perspective. Despite the rise in
cyber dependency and the growth in quantity
and sophistication of cyberattacks in recent years,
there is a basic lack of investment in appropriate
cybersecurity measures, leaving many critical
infrastructure exposed.15 For example, Singapore
topped the UN ranking on cybersecurity strategies,
but has not been immune to cyber incidents – it
was very recently the victim of a serious cyberattack
on its healthcare institutions in which personal
information of about 1.5 million patients, including
the Prime Minister’s, was stolen.16
Copyright © 2019 Marsh & McLennan Companies 8

Table 1: Selected indicators for the state of transportation, energy and ICT infrastructure across different economies in Asia-Pacific
SECTORQUALITY OF
TRANSPORTATION ENERGY ICT
Road Railroad PortAir
transport
Quality of energy
supplyAccess to electricity
Loss from Transmission
& Distribution
Mobile subscription
Individuals using the internet
Fixed broadband
subscription
Secured internet servers
UNIT 1–7, best
1–7, best
1–7, best
1–7, best
1–7, best
% of population
% of electricity
consumption
Per 100 people*1
% of population
Per 100 people
Per one million people
YEAR 2017 2017 2017 2017 2017 2016 2017 2016 2016*2 2017 2018
EMERGING ECONOMIES
INDONESIA 4.1 4.2 4 4.8 4.4 97 9.8 148 25.3 2 1,284
MALAYSIA 5.3 5 5.4 5.7 5.9 100 6.1 141 78.8 8.7 4,837
PHILIPPINES 3.1 1.9 2.9 2.9 4.2 89 9.7 109 55.5 5.5 88
THAILAND 4.3 2.6 4.3 5.2 5.2 100 5.9 174 48 10.5 580
VIETNAM 3.4 3 3.7 3.8 4.3 99 9.2 128 47 9.6 1,335
CHINA 4.6 4.8 4.6 4.9 5 100 5.8 97 53.2 23 209
INDIA 4.3 4.4 4.6 4.6 4.7 79 19.9 85 29.5 1.4 123
ADVANCED ECONOMIES
AUSTRALIA 4.8 4.1 4.9 5.2 5.7 100 5.1 110 88.2 30.6 21,547
NEW ZEALAND 4.7 3.5 5.5 5.6 6.5 100 6.6 124.4 88.5 32.8 14,980
KOREA 5.6 5.7 5.2 5.9 6.4 100 3.5 120.7 92.8 40.5 1,196
HONG KONG 6.2 6.3 6.5 6.6 6.8 100 9.4 240.8 87.5 36.0 10,484
JAPAN 6.1 6.6 5.3 5.6 6.7 100 4.6 131 93.1 31.2 5,980
SINGAPORE 6.3 5.9 6.7 6.9 6.9 100 1.7 150 81 26 58,690
*1 A Subscription rate of more than 100 subscriptions per 100 people implies that on average, every person has more than one subscription.
*2 Or latest available year.
Source: Global Competitiveness Index 2017–2018, Energy Trilemma Index 2018, and the World Bank's Development Indicators.
CRITICAL INFRASTRUCTURE FAILURE/SHORFALL
9Copyright © 2019 Marsh & McLennan Companies

FUTURE COMPLIC ATIONSHOW ONGOING TRENDS E X ACERBATE INFR A S TRUCTURE FAILURE/SHORTFALL
The existing infrastructure failure/shortfall in Asia-
Pacific will be exacerbated by three ongoing trends
in the region (Exhibit 4). These trends heighten the
shortage of infrastructure, the vulnerability of
existing infrastructure, and highlight the need to
bolster critical infrastructure quantity and quality
in the region.
Copyright © 2019 Marsh & McLennan Companies 10
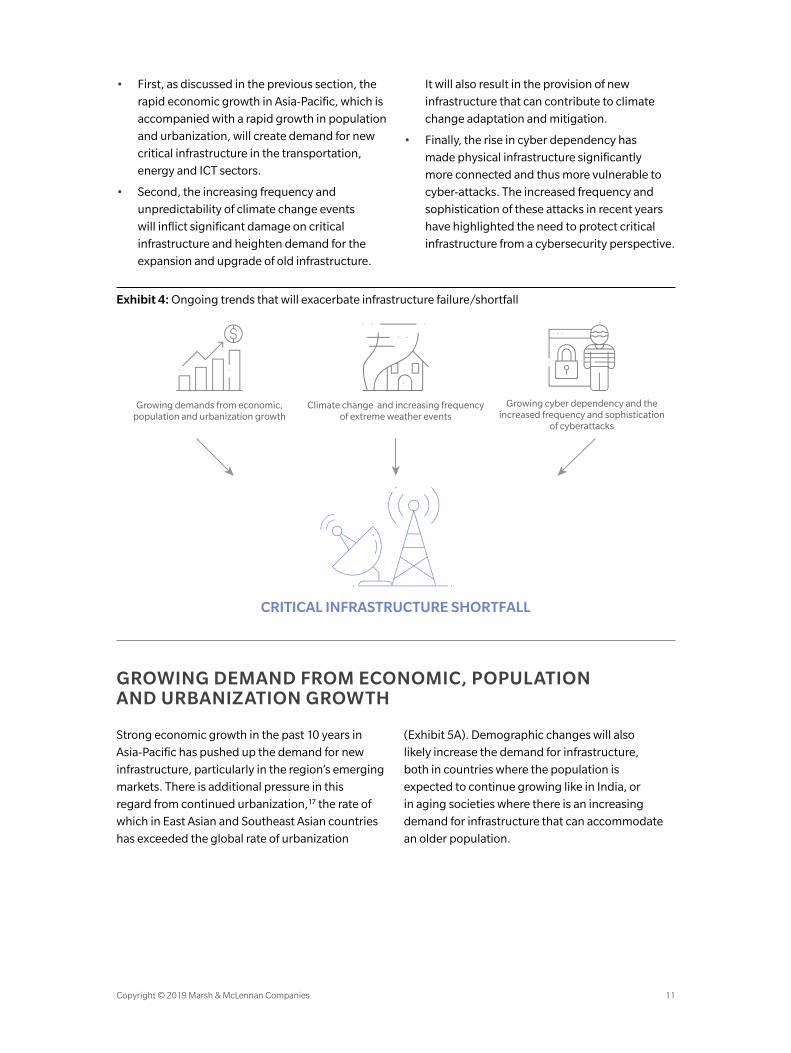
• First, as discussed in the previous section, the
rapid economic growth in Asia-Pacific, which is
accompanied with a rapid growth in population
and urbanization, will create demand for new
critical infrastructure in the transportation,
energy and ICT sectors.
• Second, the increasing frequency and
unpredictability of climate change events
will inflict significant damage on critical
infrastructure and heighten demand for the
expansion and upgrade of old infrastructure.
It will also result in the provision of new
infrastructure that can contribute to climate
change adaptation and mitigation.
• Finally, the rise in cyber dependency has
made physical infrastructure significantly
more connected and thus more vulnerable to
cyber-attacks. The increased frequency and
sophistication of these attacks in recent years
have highlighted the need to protect critical
infrastructure from a cybersecurity perspective.
Exhibit 4: Ongoing trends that will exacerbate infrastructure failure/shortfall
Growing demands from economic, population and urbanization growth
Climate change and increasing frequencyof extreme weather events
Growing cyber dependency and the increased frequency and sophistication
of cyberattacks
CRITICAL INFRASTRUCTURE SHORTFALL
GROWING DEMAND FROM ECONOMIC, POPULATION AND URBANIZATION GROWTH
Strong economic growth in the past 10 years in
Asia-Pacific has pushed up the demand for new
infrastructure, particularly in the region’s emerging
markets. There is additional pressure in this
regard from continued urbanization,17 the rate of
which in East Asian and Southeast Asian countries
has exceeded the global rate of urbanization
(Exhibit 5A). Demographic changes will also
likely increase the demand for infrastructure,
both in countries where the population is
expected to continue growing like in India, or
in aging societies where there is an increasing
demand for infrastructure that can accommodate
an older population.
11Copyright © 2019 Marsh & McLennan Companies

Exhibit 5
5A PERCENTAGE OF URBAN POPULATIONACROSS REGIONS
100
0
20
40
60
80
1950 204020252010199519801965
East Asia Southeast AsiaWorld South Asia
753
SelectedSouth Asian
economies*1
ChinaSelectedSoutheast Asian
economies*2
Annual needsCurrent investment (2015)
686
147
55
294
134
800
0
200
400
600
2055
5B INFRASTRUCTURE GAP IN ASIA(2016–2030)
2015 $BILLION
*1 South Asian economies studied in the ADB report are Afghanistan, Bangladesh, Bhutan, India, Pakistan, Sri Lank, Maldives, Nepal
*2 Southeast Asian economies studied in the ADB report are Brunei, Indonesia, Cambodia, Laos, Myanmar, Malaysia, the Philippines, Singapore, Thailand, Vietnam
Source: UN World Urbanization Prospects, 2018; Asian Development Bank, 2015
According a recent report by the ADB, 45
developing countries in Asia (including Asia-
Pacific and central Asia) will require an additional
$22 trillion for infrastructure development to
maintain economic growth and eradicate poverty
between 2015 and 2030 (Exhibit 5B). As China
has already been investing heavily in domestic
infrastructure projects and the Belt and Road
Initiative (BRI), the gap is presently a bigger
concern in other countries in the region.18
In terms of sectors, investment needs are the
highest in energy and transportation infrastructure.
Together, the investment gap in these sectors
constitutes more than 86 percent of the total
infrastructure gap in Asia-Pacific. This is consistent
with a previous ADB estimation,19 according to
which, the largest infrastructure gap is in the
electricity sector at 3.17 percent of estimated
regional GDP, followed by transportation
(2.3 percent) and telecommunications
(0.82 percent). It should be noted, however,
that the composition of this gap varies widely
across regions and countries. For example, the
transportation infrastructure gap is significantly
more acute in South Asia than in East and
Southeast Asia, where investment needs are more
concentrated in electricity infrastructure.
INCREASING FREQUENCY AND UNPREDICTABILITY OF CLIMATE CHANGE EVENTS
In the past few decades, we have witnessed a
pronounced increase in the frequency of extreme
weather events around the world. Economic
losses from severe weather have been rising in
tandem, and Asia-Pacific is perhaps most adversely
affected – between 1997 and 2016, six of the
10 countries most affected by natural disasters
were in the region.20 From 2006–2015, economic
Copyright © 2019 Marsh & McLennan Companies 12

FUTURE COMPLICATIONS
losses from natural disasters in Asia amounted to
$126 million a day,21 and this figure is projected to
increase (Exhibit 6A).22 Climate change is expected
to severely impact all types of infrastructure and
threatens the reliability and efficiency of energy,
transport and water networks.23 In July 2018, for
instance, Typhoon Maria caused over 55,000
households in Taipei to be left without power
for hours. In addition to direct losses, natural
disasters also often delay repair and maintenance
operations, hindering the emergency response
needed for a prompt recovery. The in-focus section
lays out four key climate risks and their effects
on infrastructure.
Exhibit 6
6A ESTIMATED ANNUAL AVERAGE FUTURE LOSS*1
Power Water &Sanitation
Tele-communication
0.800.79
2.282.28
Transportation
8.357.80
14.73
11.69
6B INFRASTRUCTURE GAP IN ASIA (2016–2030)
0 20 40 60
Japan
Pakistan
Philippines
India
Rep. of Korea
China
Australia
Bangladesh
Indonesia
Iran (Islamic Rep. of)
Russian Federation
Myanmar
Vietnam
Turkey
Thailand
Climate adjusted estimatesBaseline estimates
2012 $BILLION 2012 $BILLION
*1 Average annual loss (AAL) refers to the estimated average loss annualized over a long time period considering the full range of loss scenarios relating to different return periods
Source: UNESCAP, 2017; Asian Development Bank, 2015
Climate change events will likely exacerbate
the shortfall of critical infrastructure. The
already substantial infrastructure gap increases
significantly when taking into account the
investment needed to prepare new and existing
infrastructure against the effects of climate change.
Above the estimated baseline $22 trillion addition
investment needed, countries in Asia-Pacific will
require an extra $4 trillion over the next 15 years
for this endeavor, mostly concentrated in the
power sector, according to the ADB (Exhibit 6B).
As indicated by the United Nations Development
Programme, the development of climate-resilient
infrastructure requires the deployment of both
structural and non-structural risk mitigation
strategies.24 The former involves any physical
intervention on infrastructure aiming at reducing
or avoiding the impact of catastrophic events.
A new class of “sustainable infrastructure” (SI),
which entails the building of sustainable, low-
carbon and climate resilient infrastructure, has
recently received more attention, and efforts are
underway to promote and support SI investment
opportunities.25 However, there are significant
barriers to this endeavor, including a lack of formal
frameworks, investor conviction and effective
initiatives that investors can be on board with.26
This is where non-structural measures, which
encompass the adoption of policies and laws such
as building codes and land use planning, and also
training, education and public communication
initiatives, are required.
13Copyright © 2019 Marsh & McLennan Companies
| I N F O C U S |
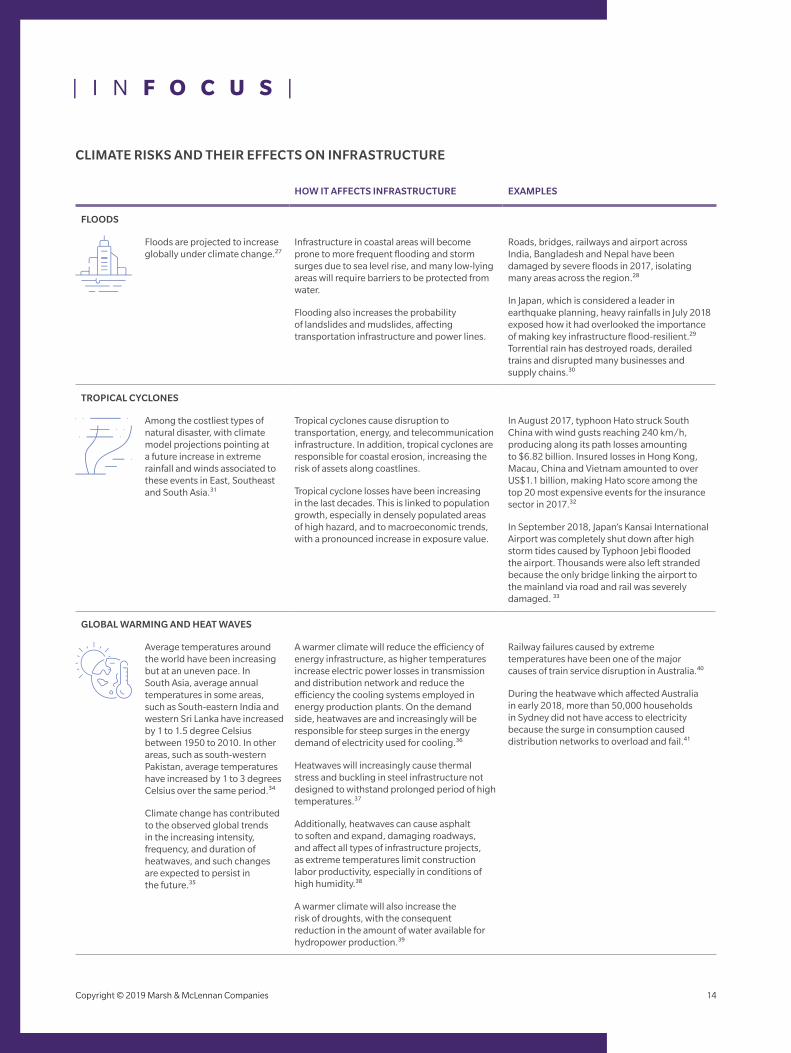
CLIMATE RISKS AND THEIR EFFECTS ON INFRASTRUCTURE
HOW IT AFFECTS INFRASTRUCTURE EXAMPLES
FLOODS
Floods are projected to increase globally under climate change.27
Infrastructure in coastal areas will become prone to more frequent flooding and storm surges due to sea level rise, and many low-lying areas will require barriers to be protected from water.
Flooding also increases the probability of landslides and mudslides, affecting transportation infrastructure and power lines.
Roads, bridges, railways and airport across India, Bangladesh and Nepal have been damaged by severe floods in 2017, isolating many areas across the region.28
In Japan, which is considered a leader in earthquake planning, heavy rainfalls in July 2018 exposed how it had overlooked the importance of making key infrastructure flood-resilient.29 Torrential rain has destroyed roads, derailed trains and disrupted many businesses and supply chains.30
TROPICAL CYCLONES
Among the costliest types of natural disaster, with climate model projections pointing at a future increase in extreme rainfall and winds associated to these events in East, Southeast and South Asia.31
Tropical cyclones cause disruption to transportation, energy, and telecommunication infrastructure. In addition, tropical cyclones are responsible for coastal erosion, increasing the risk of assets along coastlines.
Tropical cyclone losses have been increasing in the last decades. This is linked to population growth, especially in densely populated areas of high hazard, and to macroeconomic trends, with a pronounced increase in exposure value.
In August 2017, typhoon Hato struck South China with wind gusts reaching 240 km/h, producing along its path losses amounting to $6.82 billion. Insured losses in Hong Kong, Macau, China and Vietnam amounted to over US$1.1 billion, making Hato score among the top 20 most expensive events for the insurance sector in 2017.32
In September 2018, Japan’s Kansai International Airport was completely shut down after high storm tides caused by Typhoon Jebi flooded the airport. Thousands were also left stranded because the only bridge linking the airport to the mainland via road and rail was severely damaged. 33
GLOBAL WARMING AND HEAT WAVES
Average temperatures around the world have been increasing but at an uneven pace. In South Asia, average annual temperatures in some areas, such as South-eastern India and western Sri Lanka have increased by 1 to 1.5 degree Celsius between 1950 to 2010. In other areas, such as south-western Pakistan, average temperatures have increased by 1 to 3 degrees Celsius over the same period.34
Climate change has contributed to the observed global trends in the increasing intensity, frequency, and duration of heatwaves, and such changes are expected to persist in the future.35
A warmer climate will reduce the efficiency of energy infrastructure, as higher temperatures increase electric power losses in transmission and distribution network and reduce the efficiency the cooling systems employed in energy production plants. On the demand side, heatwaves are and increasingly will be responsible for steep surges in the energy demand of electricity used for cooling.36
Heatwaves will increasingly cause thermal stress and buckling in steel infrastructure not designed to withstand prolonged period of high temperatures.37
Additionally, heatwaves can cause asphalt to soften and expand, damaging roadways, and affect all types of infrastructure projects, as extreme temperatures limit construction labor productivity, especially in conditions of high humidity.38
A warmer climate will also increase the risk of droughts, with the consequent reduction in the amount of water available for hydropower production.39
Railway failures caused by extreme temperatures have been one of the major causes of train service disruption in Australia.40
During the heatwave which affected Australia in early 2018, more than 50,000 households in Sydney did not have access to electricity because the surge in consumption caused distribution networks to overload and fail.41
Copyright © 2019 Marsh & McLennan Companies 14

CYBER DEPENDENCY AND THE INCREASED FREQUENCY AND SOPHISTICATION OF CYBER-ATTACKS
Cities and businesses in Asia-Pacific are
increasingly dependent on technology for their
everyday operations (Exhibit 7B). This growing
cyber dependency has two major implications for
infrastructure development. On the one hand, it
will lead to a growing demand for ICT infrastructure
that is currently already not being met. On the
other, it also means that cities and businesses in
the region are progressively under the threat of a
systemic breakdown from a cyber-attack.
Exhibit 7
APAC GlobalEMEA
20172016
Americas
10199
175
10676
99
498
172
7A MEDIAN DWELL TIME*1 (DAYS), BY REGION
500
0
100
200
300
400
7B GROWTH IN GLOBAL DIGITAL TRANSFORMATION BY THE YEAR 2020 WILL BE LED BY APAC, LEADING TO HIGHER THREAT POTENTIALS
Connections among 4G devices, from 1 billion in 20154.7 billion
Internet users, from 3.7 billion in 2016
4.2 billion
35 EB/month*2
Mobile network tra�c, from 7EB/mth in 2016
*1 Dwell time is the time between an attacker compromising a secured network and the breach being detected
*2 Exabyte (EB) is equal to 1012 megabytes
Source: 2018 M-Trends, FireEye
Countries across Asia-Pacific have similarly
experienced cyber-attacks on what they
considered critical infrastructure. For example,
last year, reports in Australia showed a rise in
cyber-attacks on the health, finance and transport
sectors.42 The government has responded by
updating the sabotage law to include major critical
infrastructure such as utilities, key transport
facilities and healthcare facilities, among others.43
The government has also passed the Critical
Infrastructure Bill to establish guidelines to
better monitor critical infrastructure.44 Similarly,
Singapore also passed a Cybersecurity Act in
early 2018, with the strengthening of critical
infrastructure as one of its key priorities.45
This dual effect of cyber dependency means
that the shortfall in ICT infrastructure in the
region should be considered not only in terms
of infrastructure quantity but also in terms of
security and resilience. There is already a serious
dearth in investment in the security aspect of ICT
infrastructure in Asia-Pacific, as exemplified by
the lack of secured Internet servers in the region.
FireEye’s annual M-Trends reports have consistently
found that dwell times are higher in Asia-Pacific
than in any other region globally, suggesting
that the cyber security architecture in the region
is significantly slower to pick up breaches
(Exhibit 7A).15,46 The increased frequency and
sophistication of cyber-attacks in Asia-Pacific will
only worsen the current shortfall, and it highlights
the need for governments and businesses alike
to make new and existing infrastructure resilient
against potential cyber threats.
FUTURE COMPLICATIONS
15Copyright © 2019 Marsh & McLennan Companies

BUS INE S S IMPLIC ATIONS
Critical infrastructure failure/shortfall can have
adverse effects that directly impact businesses’
operations. Companies may see their operations
disrupted due to sudden power outages, while
in the long run, they may face a significant
decrease in productivity and increase in costs.
These effects are delved into in more detail in the
following discussion.
Copyright © 2019 Marsh & McLennan Companies 16

While the studies cited below mostly reference
the manufacturing sector, it is important to stress
that the impact of critical infrastructure failure/
shortfall extends to various areas. Healthcare
delivery, for example, can be severely hampered
by a lack of basic transportation infrastructure,
notwithstanding additional shortage of social
infrastructure such as hospitals. The efficiency of
service delivery can also be impacted by a lack of
energy infrastructure. For instance, the WHO has
cited poor infrastructure as one of the key factors
contributing to the spread of Ebola in several
African countries in 2014.47
DAMAGES TO COMPANIES’ OPERATIONS: CONGESTIONS, OUTAGES AND PRICE SHOCKS
A sizable proportion of companies in the Asia-
Pacific region cite transportation and electricity as
major operational constraints, but these problems
are significantly more severe in South Asia
and dominate business leaders’ concern there
(Table 2).48
Table 2: Damage to companies from critical infrastructure failure/shortfall
EAST ASIA AND THE PACIFIC SOUTH ASIA
Percent of companies identifying transportation as a major constraint
14.8 21.1
Percent of companies identifying electricity as a major constraint
15.5 46.1
Average losses due to electrical outages when outages occur (% of annual sales)
03.2 10.9
Source: World Bank Enterprise Surveys
POTENTIAL BUSINESS DISRUPTION DUE TO CRITICAL INFRASTRUCTURE BREAKDOWN
Electricity outage is a major source of disruption
for companies, particularly in South Asia where the
average company experiences nearly one outage
per day, with each lasting on average 5.3 hours. In
India, despite the recent projected surplus, several
cities, as well as an estimated 45 million rural
households, are still under the threat of regular
blackouts. Similarly, neighboring Pakistan is also
facing gaping electricity shortages, contributed by
an upstream gas shortfall and a dearth in renewable
energy infrastructure despite the country’s
substantial hydro, wind and solar potential.49
For businesses in these countries – particularly
in the manufacturing sector – the unreliable
electricity supply results in loss in output when
unanticipated outages happen, and results in
them being forced to move away from investing in
energy-intensive capital.50 Across South Asia, for
example, average loss in annual revenue due to
power outages is estimated at an astonishing 10.9
percent of annual sales, the highest globally .51
In Pakistan, which suffers the largest average losses
due to electrical outages globally, a 10 percent
increase in outage durations is expected to cause
a 0.14 to 0.28 percent decrease in total revenue
and a 0.36 percent decrease in value added at the
company level.50
Blackouts and associated costs to businesses,
however, are not exclusive to emerging markets or
South Asia. For instance, in August 2017, a power
outage in Taiwan resulted in a $3 million loss for 151
affected companies.52 Blackouts have also occurred
in other advanced economies such as Australia
in 2016 due to high demand and the inability of
renewable sources to fill the gap.53
Separately, poor transportation and ICT
infrastructure quality make these infrastructures
more vulnerable to external disruption such as
extreme weather events, cyber incidents, or
terrorist attacks. This will, in turn, have significant
impacts on companies. In a recent report on the
cost of cyberattacks to the healthcare industry,
Marsh & McLennan Insights found that the
potential loss from cyberattacks for infrastructure-
17Copyright © 2019 Marsh & McLennan Companies
related sectors such as manufacturing,
transportation and rail, and energy are among
the highest across different industries.54
For example, a cyberattack on several ports run
by Maersk, in India in 2017, left the complex
global supply chain heavily disrupted, especially
as ports these days are increasingly reliant on
communication systems for normal operations.55
A recent report also documented the substantial
costs of Internet shutdown in India, which amounts
to approximately $3 billion from 2012 to 2017.56
While these shutdowns had originated from
government censorship, the report provides
a glimpse into the potential size of damage
companies may face.
RISING OPERATIONAL COSTS
Poor transportation infrastructure results in a
substantial increase in companies’ operational
costs. The cost of moving goods in Indonesia, for
example, was estimated at around a whopping
26 percent of GDP in 2016. 57 This is significantly
higher than the 13 percent in Malaysia and
8 percent in Singapore, where the quality of
transportation infrastructure is markedly better.
Increased costs of moving are primarily a result
of delays in shipments due to severe congestion.
In some instances, however, such delays can also
impact operating costs through wider market
distortions. For example, severe congestions at key
ports in China and Indonesia from late 2017 to early
2018 have caused a short term coal price spike and
increased costs for related companies.58
Inadequate energy infrastructure can also have a
longer-term cost impact, as a shortage in energy
supply may push energy prices up significantly. In
Australia, businesses experienced a near doubling
of their electricity bills in 2017,59 directly impacting
their bottom line and prompting companies to
consider layoffs or reconsider their business
viability.60 The surge in price was mainly due to a
supply and demand mismatch, in which an unclear
strategy on the renewable energy transition at
the national level led to an uncoordinated close-
down of coal-fired plants even though renewable
energy sources were not able to match adequate
capacity, and exacerbated by high network
costs – it is estimated that 41 percent of the
increase in electricity price over the last decade
in Australia can be attributed to transmission and
distribution costs.61
LONG-TERM DECREASE IN PRODUCTIVITY
Research has pointed to the role played by
transportation infrastructure in fostering market
access and contributing to companies’ productivity
and production. A recent paper shows that for
the Chinese manufacturing sector, the expansion
of highway networks played a significant role in
increasing companies’ productivity and output.62
Elsewhere, in Australia, congestion has been
estimated to cost Australian companies in the
country’s major cities around $2.6 billion every
year in lost working hours.63
Inadequate transportation has also impacted
productivity in less direct ways. One example
is pollution, a side effect of congestion. Recent
research focused on China has shown that daily
air pollution levels have a negative impact on
workers’ health and productivity.64 These findings
suggest that workers’ getting stuck in congestion
will not only cost companies lost working time, but
prolonged exposure to pollution in traffic will also
likely have a longer-term impact on employees’
health and subsequently their productivity levels.
Separately, ICT infrastructure is also playing an
increasingly critical role in company productivity
and in facilitating trade. The dramatic growth
of ICT in India, for instance, has significantly
contributed to increase in total factor productivity
in the manufacturing sector.65 Conversely, the
lack of ICT infrastructure can be a major barrier to
productivity – slow Internet speed and the lack of
affordable high-speed options have been quoted as
among the key issues for businesses in Asia-Pacific,
forcing them to develop separate offline/online
options to get around the problem where telecom
infrastructure is poor.66
Copyright © 2019 Marsh & McLennan Companies 18

BUSINESS IMPLICATIONS
ADDRESSING CRITICAL INFRASTRUCTURE FAILURE/SHORTFALL: OPERATIONAL AND STRATEGIC RESPONSES
Given the far-reaching impact of critical
infrastructure failure/shortfall, how can companies
realistically respond to this threat, particularly
because infrastructure development traditionally
falls outside the purview of the private sector
in Asia-Pacific?
A longer-term, strategic approach is important.
Here, the focus is on critical strategic decisions,
such as where to locate a company’s manufacturing
center, or whether a company should take an
active part in the development of infrastructure
in the region to help close the infrastructure
gap. Simultaneously, businesses will also have
to consider the impact of critical infrastructure
failure/shortfall at an operational level. This entails
employing risk mitigation strategies such as
risk transference through insurance, employing
business continuity management solutions,
and wider restructuring of their operations to
bolster resilience.
FACTORING IN INFRASTRUCTURE FAILURE/SHORTFALL IN STRATEGIC CONSIDERATIONS
Infrastructure is a major factor contributing to a
country’s competitiveness and constitutes the
second pillar in the World Economic Forum’s annual
Global Competitiveness Index. Correspondingly,
for companies and particularly international
businesses, the state of critical infrastructure in the
country of operation features prominently in their
strategic considerations. International businesses
looking to set up operations in countries with less
developed infrastructure must weigh between the
potential trade-off from accessing these markets
and the risks of disruption due to infrastructure
failure/shortfall. Domestic companies in these
countries too will have to factor inadequate
infrastructure in their business development and
risk management plans.
That said, governments in the region are investing
heavily in infrastructure development, with some
(such as China, India and Vietnam) spending a
significant portion of their national budgets on this.
In the long run, this will lessen the risks associated
with inadequate infrastructure for companies in
the region.
In the short- to medium-term, the current
infrastructure investment wave led by Asia-Pacific
governments also presents ample opportunities
for businesses and other stakeholders to take an
active part in infrastructure development. Apart
from public-private partnership (PPP) ventures,
governments in the region are also implementing
other programs to attract private capital into
infrastructure, such as asset recycling, notably in
the case of Australia.67 Public assets are privatized
(sold or leased out long-term), with the proceeds
reinvested in new infrastructure. Programs like
this provide private businesses with the chance to
take up and operate relatively low-risk brownfield
assets, as opposed to taking on more risk when
participating in a greenfield type deal.
In general, one of the key criteria for consideration
from a private business and investor perspective
when entering this space is whether projects
are bankable. Marsh & McLennan Insights’
recent report on closing the financing gap for
infrastructure projects in Asia-Pacific identified six
levers for project bankability (Exhibit 8).68
19Copyright © 2019 Marsh & McLennan Companies

Exhibit 8: Levers of infrastructure project bankability
Appropriate covenantsand funding structure
Thorough duediligence
Proper documentationand deal structure
Well-structuredconcession rights
Presence of legaland economic recourse
Robust rightsto payment
KeySuccessLevers
Source: “Closing the financing gap: Infrastructure project bankability in Asia”, Marsh & McLennan Insights, 2017
Efforts to institutionalize these levers in Asia-
Pacific are still relatively nascent. For example,
findings from the World Bank’s PPP Benchmark
report showed that while South Asian countries
are at par with the global average, countries in
East Asia and the Pacific have largely fallen short
in PPP preparation and procurement processes.69
Despite the fact that risks are inevitable, businesses
looking to enter this space will be supported
by governments’ continued efforts to improve
institutional frameworks as well as incentives
provided for PPP projects. These opportunities
are also extended to other industries that are not
directly tied to infrastructure development. For
example, investment in infrastructure can be a
stable source of cash yield for financial institutions
such as commercial banks, insurance companies
and investment funds.
BOLSTERING OPERATIONAL RESILIENCE
It is important that companies evaluate the role of
critical infrastructure failure/shortfall in relation
to climate change events as well as cyber-attacks.
These events not only directly impact company
facilities and operations which the company has
control over, they can also lead to the breakdown of
critical infrastructure such as outages and damaged
bridges that are not under the companies’ purview,
but nevertheless have an impact on its operations.
For example, even when a company’s production
lines are not affected by a climate event (such as
a flood), the supply chain may still be disrupted
from transport infrastructure being damaged or
rendered unusable.
Where critical infrastructure is not built to be
resilient against such threats, damages to
businesses can be greatly exacerbated. For
instance, the lack of investment and planning
in urban infrastructure has greatly amplified the
risk and damage of floods in cities in India.70 In
this case, companies located in urban areas with
poor drainage and sanitation may suffer the same
substantial damages as those with operations
located on low-lying flood plains.71 Solely focusing
on the direct damage to companies’ properties
from weather events and cyber incidents can lead
to second order damage due to infrastructure
failure being overlooked and total damage
being underestimated.
Addressing the problem of critical infrastructure
failure/shortfall with a mind for climate change and
cyber-attacks may require companies to rethink the
organization as a whole. Possible solutions such as
operational reengineering, or the establishment
of spare capacity/backup production capabilities
can also be considered as longer-term
strategic responses.
Copyright © 2019 Marsh & McLennan Companies 20
BUSINESS IMPLICATIONS
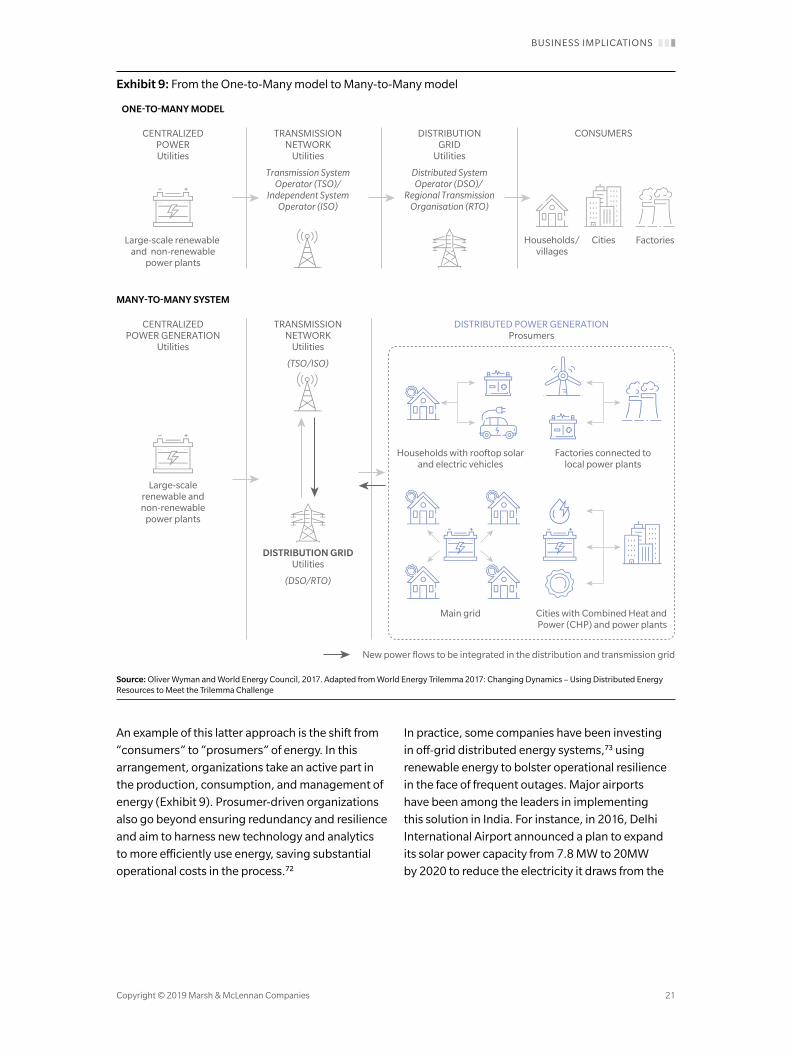
Exhibit 9: From the One-to-Many model to Many-to-Many model
CENTRALIZEDPOWERUtilities
DISTRIBUTED POWER GENERATIONProsumers
TRANSMISSION NETWORK
Utilities
Transmission System Operator (TSO)/
Independent System Operator (ISO)
TRANSMISSIONNETWORK
Utilities
(TSO/ISO)
DISTRIBUTIONGRID
Utilities
Distributed SystemOperator (DSO)/
Regional TransmissionOrganisation (RTO)
CONSUMERS
Households/villages
Cities Factories
ONE-TO-MANY MODEL
New power flows to be integrated in the distribution and transmission grid
CENTRALIZEDPOWER GENERATION
Utilities
MANY-TO-MANY SYSTEM
Large-scale renewable and non-renewable
power plants
Large-scalerenewable and non-renewable
power plants
Factories connected tolocal power plants
Cities with Combined Heat and Power (CHP) and power plants
Households with rooftop solarand electric vehicles
Main grid
DISTRIBUTION GRIDUtilities
(DSO/RTO)
Source: Oliver Wyman and World Energy Council, 2017. Adapted from World Energy Trilemma 2017: Changing Dynamics – Using Distributed Energy Resources to Meet the Trilemma Challenge
An example of this latter approach is the shift from
“consumers” to “prosumers” of energy. In this
arrangement, organizations take an active part in
the production, consumption, and management of
energy (Exhibit 9). Prosumer-driven organizations
also go beyond ensuring redundancy and resilience
and aim to harness new technology and analytics
to more efficiently use energy, saving substantial
operational costs in the process.72
In practice, some companies have been investing
in off-grid distributed energy systems,73 using
renewable energy to bolster operational resilience
in the face of frequent outages. Major airports
have been among the leaders in implementing
this solution in India. For instance, in 2016, Delhi
International Airport announced a plan to expand
its solar power capacity from 7.8 MW to 20MW
by 2020 to reduce the electricity it draws from the
21Copyright © 2019 Marsh & McLennan Companies
grid.74 Elsewhere, Cochin International Airport has
already achieved self-sufficiency on solar power
since 2015. These successful cases provide a viable
model for businesses in India and across the region.
Finally, an important consideration for companies
is to insure against loss associated with critical
infrastructure failure/shortfall. For example,
disruptions can be considered as Business
Interruption (BI) incidents, and can thus be
covered by traditional BI risk transfer approaches.
However, it is important to note that traditional
transactional insurance is not always enough
to maintain shareholder value, prevent loss of
market share, or protect against other adverse
risks in the case of BIs. There are a variety of
additional solutions that companies can employ
in this regard, including:75
• Business recovery planning
• Introduction of backup single suppliers
• Outsourcing of critical functions to spread
the risk
• Adjustment of inventory control strategies
Ultimately, companies will need to employ
a combination of strategies to adequately
bolster resilience against the risk of critical
infrastructure failure/shortfall.
Copyright © 2019 Marsh & McLennan Companies 22
BIBLIOGRAPHY
1 Global Infrastructure Outlook. Available at: https://outlook.gihub.org/ (Accessed: 14th February 2019).
2 Marsh & McLennan Insights, From Threats To Impact: Evolving Risk Concerns in Asia-Pacific (Marsh & Mclennan Companies, 2018).
3 The World Bank, World Development Indicators (World Bank, 2018).
4 World Energy Council, World Energy Trilemma Index 2018 (2018).
5 The Global Competitiveness Report 2017–2018 (World Economic Forum, 2017).
6 Mitchell, T. & Peel, M., “Asia’s $26tn infrastructure gap threatens growth, ADB warns”, Financial Times (FT.Com) (2017).
7 The World Bank, The Status of Infrastructure Services in East Asia and the Pacific (World Bank, 2017).
8 Asian Development Bank. Urban Transport, Asian Development Bank (2014). Available at: https://www.adb.org/sectors/transport/key-priorities/urban-transport (Accessed: 3rd August 2018).
9 Guilbert, K., “In the rush to develop, Asia’s cities advised to think green”, Reuters (2018).
10 Ismail, N. W. & Mahyideen, J. M., “The Impact of Infrastructure on Trade and Economic Growth in Selected Economies in Asia”, Asian Dev. Bank Inst. (2015), doi:10.2139/ssrn.2709294.
11 Zhang, F., In the Dark: How much do power sector distortions cost South Asia? (World Bank, 2018).
12 ASEAN Centre for Energy, Renewable Energy. (2018). Available at: http://www.aseanenergy.org/programme-area/re/. (Accessed: 7th August 2018).
13 International Renewable Energy Agency, Renewable Energy Market Analysis: Southeast Asia (International Renewable Energy Agency, 2018).
14 United Nations ESCAP, State of ICT in Asia and the Pacific 2016: Uncovering the Widening Broadband Divide (United Nations ESCAP, 2016).
15 Marsh & McLennan Companies’ Asia Pacific Risk Center & FireEye, Cyber Evolution: En Route to Strengthening Resilience in Asia Pacific (Marsh & McLennan Companies, 2018).
16 Hio, L., “S’pore takes top spot in UN cyber security index”, The Straits Times (2017).
17 United Nations, World Population Prospect 2017 (2017). Available at: https://esa.un.org/unpd/wup/ (Accessed: 3rd August 2018).
18 Asian Development Bank, Meeting Asia’s Infrastructure Needs (Asian Development Bank, 2017), doi:10.22617/FLS168388-2.
19 Bhattacharyay, B., Estimating Demand for Infrastructure in Energy, Transport, Telecommunications, Water, and Sanitation in Asia and the Pacific: 2010–2020 (2010).
20 Eckstein, D., Künzel, V. & Schäfer, L., Global Climate Risk Index 2018 (Germanwatch, 2017).
21 Asian Development Bank, Disaster Risk in Asia and the Pacific: Assessment, Management, and Finance (Asian Development Bank, 2016).
22 Guy Carpenter, Asia-Pacific Catastrophe Report 2017 (Guy Carpenter, 2017).
23 Vallejo, L. & Mullan, M., Climate-resilient infrastructure: Getting the policies right, 74 (2017).
24 United Nations Development Programme, Paving the Way for Climate-resilient Infrastructure: Guidance for Practioners and Planners (United Nations Development Programme, 2011).
25 Mercer & Inter-American Development Bank (IDB), Building a Bridge to Sustainable Infrastructure Investing (2017).
26 Mercer & Inter-American Development Bank (IDB), Crossing the Bridge to Sustainable Infrastructure Investing (2017).
27 Hirabayashi, Y. et al., “Global flood risk under climate change”, Nat. Clim. Change 3.816 (2013).
28 Farand, C., “While the West watches Texas, 41 million people are being affected by floods in south Asia”, The Independent (2017). Available at: http://www.independent.co.uk/news/world/asia/india-floods-bangladesh-nepal-millions-affected-says-un-a7920721.html. (Accessed: 3rd August 2018).
23Copyright © 2019 Marsh & McLennan Companies

29 Nikkei Asian Review, “Flood exposes blind spots in Japan’s disaster preparations”, Nikkei Asian Review (2018).
30 The Japan Times, “Scenes of chaos after floods and landslides wreak havoc in western Japan”, The Japan Times Online (2018).
31 Intergovernmental Panel on Climate Change, Contribution of Working Group I to the Fourth Assessment Report of the Intergovernmental Panel on Climate Change (2007).
32 Swiss Re. Sigma 1/2018, Natural catastrophes and man-made disasters in 2017: a year of record-breaking losses. Available at: https://www.swissre.com/institute/research/sigma-research/sigma-2018-01.html. (Accessed: 14th February 2019)
33 The Japan Times, Typhoon Jebi highlights vulnerability of offshore Kansai airport (2018). Available at: https://www.japantimes.co.jp/news/2018/09/06/national/typhoon-jebi-highlights-vulnerability-offshore-kansai-airport/#.XGU-514zY2w. (Accessed: 14th February 2019).
34 Mani, M., Bandyopadhyay, S., Chonabayashi, S., Markandya, A. & Mosier, T., South Asia’s Hotspots: The Impact of Temperature and Precipitation Changes on Living Standards (The World Bank, 2018). doi:10.1596/978-1-4648-1155-5.
35 Intergovernmental Panel on Climate Change, Contribution of Working Group II to the Thrid Assessment Report of the Intergovernmental Panel on Climate Change (2001).
36 Energy Networks Australia & Australian Energy Council, Factsheet: Heatwaves and Electricity Supply (2019). Available at: https://www.energynetworks.com.au/sites/default/files/heatwaves_and_energy_supply_explained_-_ena_and_aec_fact_sheet_0.pdf (Accessed: 4th March 2019)
37 Nguyen, M., Wang, X. & Chen, D., An investigation of extreme heatwave events and their effects on building and infrastructure, 122 (2011).
38 Coffel, E. D., Horton, R. M. & Sherbinin, A. de, “Temperature and humidity based projections of a rapid rise in global heat stress exposure during the 21st century” Environ. Res. Lett., 13 (2017).
39 Wetherald, R. T., “Simulation of hydrologic changes associated with global warming”, J. Geophys. Res., 107 (2002).
40 Nguyen, M., Wang, X. & Wang, C.-H., A reliability assessment of railway track buckling during an extreme heatwave, 226 (Part F: Journal of Rail and Rapid Transit, 2012).
41 Sonali, P. & Gloystein, H., “Heat wave leaves thousands of Australian homes without power”, Reuters (2018).
42 Chester, R., “Hackers break deep into Australia’s vital cyber networks”, news.com.au (2017).
43 Wroe, D., “New sabotage laws for cyber attacks on Australia’s critical infrastructure”, The Sydney Morning Herald (2017).
44 Parliament of Australia, Security of Critical Infrastructure Bill 2018 (2018).
45 Cyber Security Agency of Singapore. Cybersecurity Act, Cyber Security Agency (2018). Available at: http://www.csa.gov.sg/legislation/cybersecurity-act. (Accessed: 6th August 2018)
46 Fireeye, M-Trends 2018 (Fireeye, 2018).
47 World Health Organisation, Factors that contributed to undetected spread of the Ebola virus and impeded rapid containment (2015). Available at: http://www.who.int/entity/csr/disease/ebola/one-year-report/factors/en/index.html (Accessed: 6th August 2018).
48 The World Bank, Infrastructure. Enterprise Surveys (2018). Available at: http://www.enterprisesurveys.org/data/exploretopics/infrastructure#--1 (Accessed: 6th August 2018).
49 Upadhyay, A. & Singh, R. K., “India’s Power Surplus Might Not Be a Good Thing”, Bloomberg (2017).
50 Grainger, C. A. & Zhang, F., The Impact of Electricity Shortages on Firm Productivity: Evidence from Pakistan (The World Bank, 2017) doi:10.1596/1813-9450-8130.
51 The World Bank. Infrastructure, Enterprise Surveys. Available at: http://www.enterprisesurveys.org/data/exploretopics/infrastructure#--1 (Accessed: 6th August 2018).
52 Yu, J. M., Taiwan power outage affected 151 companies, caused $3 million in...”, Reuters (2017).
53 Murphy, K. & Knaus, C., “South Australian blackout blamed on thermal and wind generator failures, plus high demand”, The Guardian (2017).
Copyright © 2019 Marsh & McLennan Companies 24
54 Marsh & McLennan Companies’ Asia Pacific Risk Center, Holding healthcare to ransom: Industry perspectives on cyber risks, 20 (Marsh & Mclennan Companies, 2018).
55 Saul, J., “Global shipping feels fallout from Maersk cyber attack”, Reuters (2017).
56 BRINK Asia, “The Costs of Rising Internet Shutdowns in India”, Brink – The Edge of Risk (2018). Available at: http://www.brinknews.com/asia/the-costs-of-rising-internet-shutdowns-in-india/ (Accessed: 6th August 2018).
57 Susanty, F. & Ribka, S., “RI losing logistics battle”, The Jakarta Post (2016). Available at: https://www.thejakartapost.com/news/2016/07/01/ri-losing-logistics-battle.html (Accessed: 14th February 2019).
58 Gloystein, H., “Asian coal prices hit late 2016 high amid huge shipping congestion”, Reuters (2018).
59 Macdonald-Smith, A., Ludlow, M. & Potter, B., “High power costs floor business”, The Australian Financial Review, 1 (2017).
60 SBS NEWS, “Power prices ‘put jobs at risk’: AiGroup”, SBS News (2018).
61 Verrender, I., “The truth about soaring power prices: wind and solar not to blame”, ABC News (2017).
62 Huang, Y. & Xiong, W., “Geographic Distribution of Firm Productivity and Production: A “Market Access” Approach (Job Market Paper)”, Havard Univ., 58 (2018).
63 Nambiar, R., “Traffic congestion costs Australian firms more than $2.6 billion annually, report says”, CNBC (2017).
64 Chang, T. Y., Zivin, J. G., Gross, T. & Neidell, M., “Air Pollution Is Making Office Workers Less Productive”, Harvard Business Review (2016).
65 Mitra, A., Sharma, C. & Veganzones-Varoudakis, M.-A., Infrastructure, ICT and Firms’ Productivity and Efficiency: An Application to the Indian Manufacturing (HAL, 2015).
66 Roberts, F., Poor IT infrastructure impacts business in Southeast Asia (2017). Available at: https://asia.businesschief.com/technology/593/Poor-IT-infrastructure-impacts-business-in-Southeast-Asia. (Accessed: 6th August 2018)
67 Marsh & McLennan Companies’ Asia Pacific Risk Center, Infrastructure Asset Recycling: Insights for governments and investors, 33 (Marsh & Mclennan Companies, 2018).
68 Marsh & McLennan Companies’ Asia Pacific Risk Center. Closing the financing gap: Infrastructure project bankability in Asia, 60 (Marsh & Mclennan Companies, 2017).
69 The World Bank, Procuring infrastructure public-private partnerships report 2018: Assessing government capability to prepare, procure, and manage PPPs (World Bank, 2018).
70 Biswas, A., Saklani, U. & Tortajada, C., “India’s rising problem: Urban floods”, The Straits Times (2017).
71 Chaudhary, A. & Pradhan, B., “Floods May Cost South Asia $215 Billion a Year by 2030”, Bloomberg (2017).
72 Mouat, S., “A New Paradigm for Utilities: The Rise of the Prosumer – Schneider Electric Blog”, Schneider Electric (2016). Available at: https://blog.schneider-electric.com/energy-management-energy-efficiency/2016/11/17/new-paradigm-utilities-rise-prosumer/ (Accessed: 6th August 2018)
73 Han, P., “Electrifying emerging ASEAN through off-grid distributed renewable energy systems”, Asian Development Blog (2017).
74 Shaw, N., “Energy ‘prosumers’ helping India’s Modi harness the sun”, Nikkei Asian Review (2016).
75 Marsh. Business Interruption Services, Marsh Risk Consulting (2018). Available at: https://www.marsh.com/us/services/marsh-risk-consulting/business-interruption.html (Accessed: 6th August 2018)
25Copyright © 2019 Marsh & McLennan Companies

14 SHADES OF RISK IN ASIA-PACIFICEvolving Risk Concerns in Asia-Pacific | Volume 3 | Part 2
FROM THREATS TO IMPACTEvolving Risk Concerns in Asia-Pacific Volume 3
THE GLOBAL RISKS REPORT 2019The World Economic Forum highlights the issue that will exacerbate volatility and uncertainty in the next decade – while also presenting opportunities for government and businesses to build resilience and deliver sustainable growth. Marsh and McLennan Companies has been a strategic partner of the report since 2006.
FROM THREATS TO IMPACT: EVOLVING RISK CONCERNS IN ASIA-PACIFIC 2018Leveraging the 2018 Global Risks Report, the report builds on previous iterations by providing insights regarding the risk landscape for businesses operating in Asia-Pacific. It also drills down into the risks of critical infrastructure failure/shortage and talent shortage, before exploring several options to mitigate such risks going forward.
14 SHADES OF RISK IN ASIA-PACIFIC: EVOLVING RISK CONCERNS IN ASIA-PACIFIC 2018 PART 2This report is the second part of the From Threat to Impact publication and provides a more nuanced analysis by delving in the region’s diversity. It presents snapshots of 14 key countries/territories across Asia-Pacific by leveraging on the results of the WEF’s Executive Opinion Survey (EOS) 2018 as well as the perspectives of experts across Marsh & McLennan Companies. The report also provide business leaders with high-level takeaways for each economy.
CLOSING THE FINANCING GAPThe report analyzes the boom in infrastructure demand in Asia, going into the drivers and challenges associated with infrastructure financing in the region and illustrates the recommended set of guidelines in enabling infrastructure project bankability
NAVIGATING THE NEW SILK ROADThis compendium collates knowledge and expertise from the world’s leading experts to examine critical issues surrounding China’s Belt and Road Initiative (BRI), namely the initiative’s economic impacts, both domestically and abroad, as well as its geopolitical implications. In many ways, the BRI represents China’s vision as a global leader alongside the US
INFRASTRUCTURE INVESTMENT POLICY BLUEPRINTGlobal investors are looking for risk-adjusted returns. For governments, this means improved risk allocation and mitigation, improved understanding of counter-party needs, and a transparent transaction environment
EMERGING RISKS IN CONSTRUCTIONThe articles contained in this publication examine some of these crucial issues and aim to provide critical insight into the risks and opportunities facing construction companies as they navigate through the profound transformation that is under way
CROSSING THE BRIDGE TO SUSTAINABLE INFRASTRUCTURE INVESTINGTo better understand what is happening on the ground, review the barriers and identify tangible next steps to address the funding gap for sustainable infrastructure. The Inter-American Development Bank (IDB) commissioned Mercer to undertake a multiphase project beginning in mid-2016
CLOSING THE FINANCING GAPINFRASTRUCTURE PROJECT BANKABILITY IN ASIA
GLOBAL CONSTRUCTION PRACTICE
EMERGING RISKS IN CONSTRUCTIONEXPERT PERSPECTIVES ON THE CONSTRUCTION INDUSTRY
January 2015
Infrastructure Investment Policy Blueprint: Country Performance AssessmentPrepared in collaboration with Oliver Wyman
RECENT PUBLICATIONS FROM MARSH & MCLENNAN COMPANIES
In partnership with Marsh & McLennan Companies and Zurich Insurance Group
The Global Risks Report 201914th Edition
Insight Report
Navigating the New Silk Road Expert Perspectives onChina’s Belt and Road Initiative
Copyright © 2019 Marsh & McLennan Companies 26

ACKNOWLEDGEMENTS
To read the digital version of Infrastructure failure and shortfall, please visit
www.mmc/insights.html
AUTHORS
WOLFRAM HEDRICH
Executive Director, Marsh & McLennan Insights
BLAIR CHALMERS
Director, Marsh & McLennan Insights
PHAN HOANG VIET
Research Analyst, Marsh & McLennan Insights
JESSICA KOH
Research Analyst, Marsh & McLennan Insights
MARSH & MCLENNAN COMPANIES CONTRIBUTORS
Marsh & McLennan Insights: Leslie Chacko, Lucy Nottingham,
Richard Smith-Bingham, Alex Wittenberg, Jaclyn Yeo, Meghna Basu;
Marsh: James Addington-Smith, Rohan Bhappu, Shimoyama Hirofumi,
Jonathan James, Larry Liu, Lionel Mintz, Svein Tyldum, Douglas Ure,
Paul Wilkins; Mercer: Liana Attard, Lewis Garrad, Vidisha Mehta,
Rahul Mudgal; Guy Carpenter: Andre Eisele, Edward Fenton,
Tony Gallagher, David Lightfoot, James Nash, Michael Owen,
Claudio Saffioti; Oliver Wyman: Abhimanyu Bhuchar, Timothy Colyer,
Edward Emanuel, David Howard-Jones, Aarti Nihalani, Christian Pedersen,
Peter Reynolds, Sumit Sharma, Seo Young Lee
The design work of this report was led by
Mike Tveskov and Jean-Guy Vezeau, Oliver Wyman
27Copyright © 2019 Marsh & McLennan Companies
ABOUT MARSH & MCLENNAN COMPANIES
MARSH & McLENNAN COMPANIES (NYSE: MMC) is a global professional services firm offering clients advice and
solutions in the areas of risk, strategy and people. Marsh is a leader in insurance broking and risk management; Guy
Carpenter is a leader in providing risk and reinsurance intermediary services; Mercer is a leader in talent, health,
retirement and investment consulting; and Oliver Wyman is a leader in management consulting. With annual revenue
of $13 billion and approximately 60,000 colleagues worldwide, Marsh & McLennan Companies provides analysis, advice
and transactional capabilities to clients in more than 130 countries. The Company is committed to being a responsible
corporate citizen and making a positive impact in the communities in which it operates. Visit www.mmc.com for more
information and follow us on LinkedIn and Twitter @MMC_Global.
For more information, please email the team at [email protected].
INF
RA
ST
RU
CT
UR
E FA
ILUR
E A
ND
SH
OR
TFA
LL
ABOUT MARSH & McLENNAN INSIGHTS
MARSH & McLENNAN INSIGHTS uses the unique expertise of our firm and its networks to identify breakthrough perspectives and
solutions to society’s most complex challenges. Marsh & McLennan Insights plays a critical role in delivering the MMC Advantage –
Marsh & McLennan’s unique approach to harnessing the collective strength of our businesses to help clients address their greatest
risk, strategy and people challenges.
For more information, visit www.mmc.com/insights.html.
Copyright © 2019 Marsh & McLennan Companies, Inc. All rights reserved.
This report may not be sold, reproduced or redistributed, in whole or in part, without the prior written permission of Marsh & McLennan Companies, Inc.
This report and any recommendations, analysis or advice provided herein (i) are based on our experience as insurance and reinsurance brokers or as consultants, as applicable, (ii) are not intended to be taken as advice or recommendations regarding any individual situation, (iii) should not be relied upon as investment, tax, accounting, actuarial, regulatory or legal advice regarding any individual situation or as a substitute for consultation with professional consultants or accountants or with professional tax, legal, actuarial or financial advisors, and (iv) do not provide an opinion regarding the fairness of any transaction to any party. The opinions expressed herein are valid only for the purpose stated herein and as of the date hereof. We are not responsible for the consequences of any unauthorized use of this report. Its content may not be modified or incorporated into or used in other material, or sold or otherwise provided, in whole or in part, to any other person or entity, without our written permission. No obligation is assumed to revise this report to reflect changes, events or conditions, which occur subsequent to the date hereof. Information furnished by others, as well as public information and industry and statistical data, upon which all or portions of this report may be based, are believed to be reliable but have not been verified. Any modeling, analytics or projections are subject to inherent uncertainty, and any opinions, recommendations, analysis or advice provided herein could be materially affected if any underlying assumptions, conditions, information, or factors are inaccurate or incomplete or should change. We have used what we believe are reliable, up-to-date and comprehensive information and analysis, but all information is provided without warranty of any kind, express or implied, and we disclaim any responsibility for such information or analysis or to update the information or analysis in this report. We accept no liability for any loss arising from any action taken or refrained from, or any decision made, as a result of or reliance upon anything contained in this report or any reports or sources of information referred to herein, or for actual results or future events or any damages of any kind, including without limitation direct, indirect, consequential, exemplary, special or other damages, even if advised of the possibility of such damages. This report is not an offer to buy or sell securities or a solicitation of an offer to buy or sell securities. No responsibility is taken for changes in market conditions or laws or regulations which occur subsequent to the date hereof.


