“Infrastructure Financing Strategies for Sustainable Development in South-East Asia” Sub-Regional Study / Paper This version: 12 July 2017 The study was developed under a United Nations Development Account project entitled “Financing strategies for inclusive, equitable and sustainable development in Asia and the Pacific”, implemented by the Macroeconomic Policy and Financing for Development Division, ESCAP. The study was developed by Mathieu Verougstraete (UNESCAP) and Tran Duy Hung (Monitor Consulting). The views expressed in this document are those of the authors and do not necessarily reflect the views of the United Nations Secretariat. The study has been issued without formal editing.
Transcript
“Infrastructure Financing Strategies for
Sustainable Development in South-East Asia”
Sub-Regional Study / Paper
This version: 12 July 2017
The study was developed under a United Nations Development Account project entitled “Financing
strategies for inclusive, equitable and sustainable development in Asia and the Pacific”, implemented by
the Macroeconomic Policy and Financing for Development Division, ESCAP. The study was developed by
Mathieu Verougstraete (UNESCAP) and Tran Duy Hung (Monitor Consulting). The views expressed in
this document are those of the authors and do not necessarily reflect the views of the United Nations
Secretariat. The study has been issued without formal editing.
Box 1- Tax Incentives in selected SEA countries ......................................................................... 23 Box 2- PPP Experiences in SEA ................................................................................................... 31
List of Figures
Figure 1- Infrastructure Investment in Selected Countries in SEA (% of GDP), 1992-2011 ......... 9 Figure 2- Breakdown of Infrastructure Investment Needs in Asia, 2016-2030 ............................ 10 Figure 3- Yearly Infrastructure Needs in selected SEA countries and breakdown by sector and
type of investment ......................................................................................................................... 11 Figure 4- Breakdown of Public and Private Infrastructure Investment in SEA, 2010-2014 ........ 12
Figure 5-Construction Permits in SEA ......................................................................................... 14
Figure 6- Quality of the Land Administration Index (0-30) ......................................................... 15
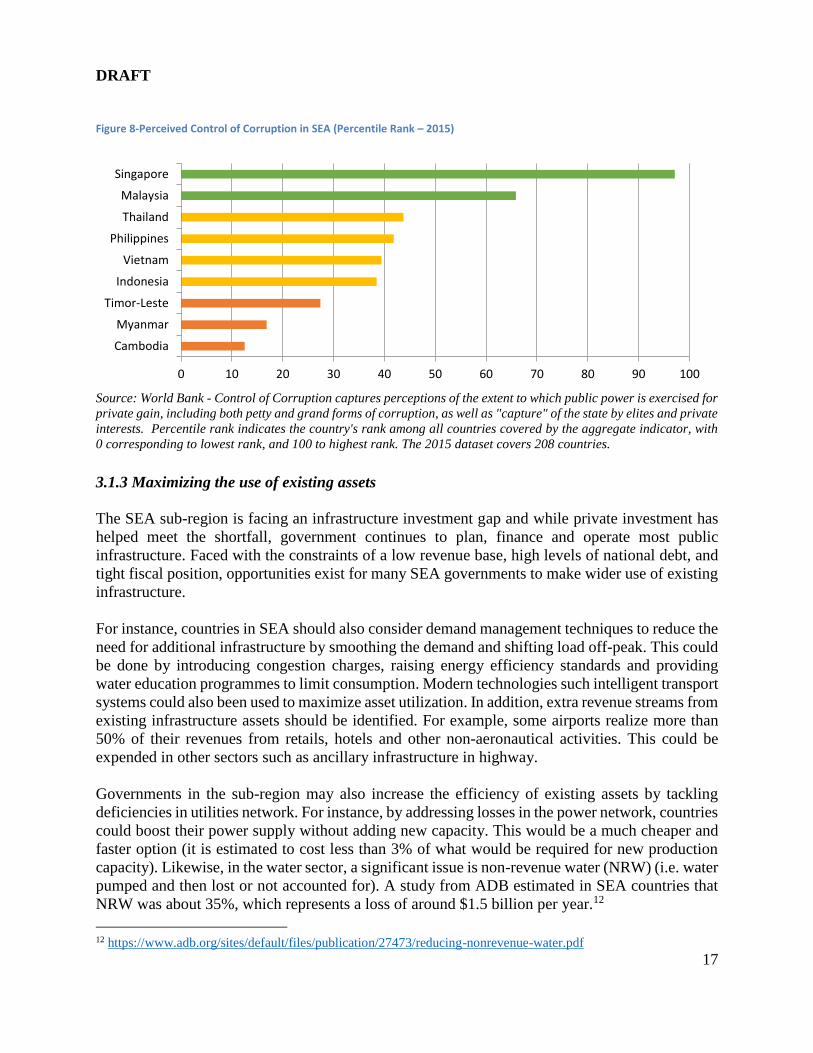
Figure 7-Benchmarking Public Procurement in SEA ................................................................... 16 Figure 8-Perceived Control of Corruption in SEA (Percentile Rank – 2015) .............................. 17
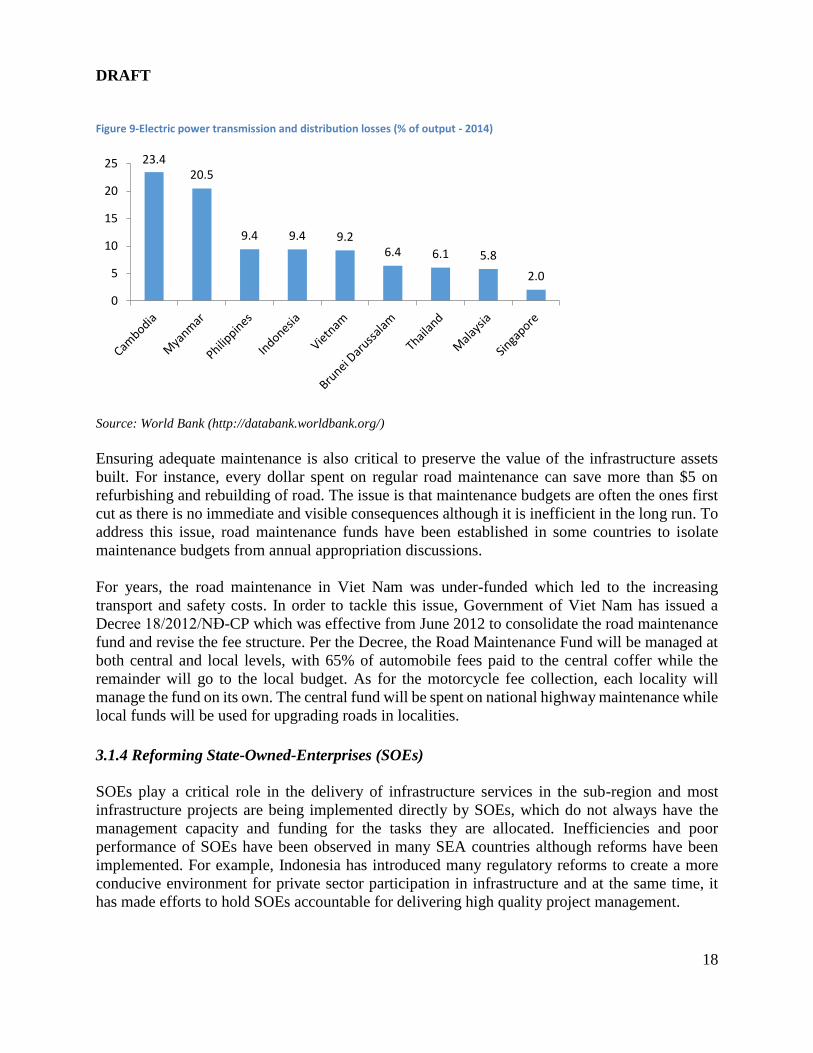
Figure 9-Electric power transmission and distribution losses (% of output - 2014) .................... 18 Figure 10- Government Budget Balance and Debt in selected SEA countries, 2007-2015 (% of
Figure 11- Tax to GDP ratio across SEA countries ...................................................................... 21 Figure 12- Tax mix in selected SEA countries ............................................................................. 22
Figure 13- Direct to indirect tax ration, change since 1990s ........................................................ 23 Figure 14- Private Infrastructure Investment in SEA, 2000-2016 ................................................ 27 Figure 15- Private Infrastructure Investment by Sector in SEA, 2000-2016 ................................ 28
Figure 16- PPP Units in SEA countries ........................................................................................ 30
to selected SEA countries ............................................................................................................. 25 Table 8- World Bank- Cumulative Grant, Credit and Concessional Loan Commitment ($ million)
to selected SEA countries ............................................................................................................. 25 Table 9- Private Infrastructure Investment in SEA, 2000-2016 ................................................... 27 Table 10- PPP Regulatory Framework in SEA countries ............................................................. 29 Table 11- PPP Benchmarking in SEA .......................................................................................... 29
Table 12- Financial Support Mechanisms .................................................................................... 30 Table 13 - Stock of Capital in SEA .............................................................................................. 34
DRAFT
3
Abbreviations
ABF Asian Bond Fund
ABMI Asian Bond Market Initiative
ADB Asian Development Bank
AIF Asia Infrastructure Fund
AIIB Asian Infrastructure Investment Bank
ASEAN Association of Southeast Asian Nations
BOT Build- Operate & Transfer
CIF Climate Investment Fund
CRA Credit Rating Agency
CTF Clean Technology Fund
ECA Export Credit Agency
ERIA Economic Research Institute for Asean and East Asia
GDP Gross Domestic Product
ESCAP Economic and Social Commission for Asia and Pacific
IIGF Infrastructure Investment Guarantee Fund
IMF International Monetary Fund
LCY Local currency
MDB Multilateral Development Bank
ODA Official Development Assistance
OECD The Organisation for Economic Co-operation and Development
OTC Over-The-Counter
PDF Project Development Facility
PPP Public Private Partnership
SEA South-East Asia
SOE State - Owned Enterprise
UN United Nations
UNCTAD United Nations Conference on Trade and Development
UN-ESCAP United Nations Economic and Social Commission for Asia and
Pacific
VGF Viability Gap Funding
WB World Bank
$ United States Dollar
4
Executive Summary
South-East Asia (SEA) is considered as one of the fastest growing regions in the world with a
cumulative population of 640 million and GDP of about $2.430 billion, which account for 14.7%
of the population and 9.6% of GDP in Asia. However, SEA countries are not a homogenous group
as they included both developed and developing economies and have different level of
infrastructure development.
Infrastructure is vital for the long-term growth and competitiveness of countries worldwide, and
particularly so in SEA economies. Adequate infrastructure is key to economic growth as well as
social and environment progress. However, many SEA countries are facing constraints in
developing and funding infrastructure projects that may hinder their future prospects.
SEA countries require trillions of dollars in new infrastructure over the next two decades just to
keep pace with current urbanization trends and fuel economic growth. ADB estimated that
infrastructure needs in SEA sub-region are at around $150 billion per year (approximately 6 per
cent of GDP). This represents more than doubling the current spending. Traditional public funding
is unlikely to meet this demand, leaving a gap that will affect not only public welfare, but also
economic prosperity.
In that context, SEA countries should carefully design financing strategies in order to fill the
existing gaps and meet future demand. These strategies will, however, differ according to the
macroeconomic and capital market conditions of each country. Overall, there are five avenues that
SEA countries should look at when designing effective infrastructure financing strategies for
sustainable development:
First, SEA countries could achieve significant savings by improving public expenditure efficiency
in infrastructure thereby freeing resources for other priority investments. This can notably be done
by improving project delivery through streamlined permit approvals, facilitated land acquisition,
and better public procurement practices.
Second, mobilizing domestic resources for infrastructure development through fiscal management
and tax reforms. State budget deficits and relatively high levels of government debt constrain
infrastructure investment in some countries. A way to address this issue is to reprioritize public
spending to free resources for infrastructure investments but also consider how tax revenues could
be increased by rethinking the tax policy mix and improving tax administration and collection.
Third, Official Development Assistance (ODA) has been a major funding source for several lower
income SEA countries. Countries should find ways to maximize the impact of these limited
resources for instance by using them to leverage private finance.
Fourth, private financing and Public –Private Partnership (PPP) are expected to play a greater role
as public resources alone will be insufficient to meet the SEA’s significant infrastructure needs.
This will require further strengthening the PPP legal and institutional frameworks in SEA while
building a stronger pipeline of bankable projects.
DRAFT
5
Fifth, capital markets can potentially provide significant amount of both equity and debt for
infrastructure projects. It is broadly estimated that $10 trillion of funds in SEA could be tapped for
infrastructure investment.
While none of these five avenues can address alone the financing challenges of the region,
combining them will go a long way towards better infrastructure development in the region and
consequently more sustainable development. To implement these strategies, countries in the region
should call on the assistance of development partners, such as ESCAP, to build the necessary
institutional capacity, learn from other countries’ experiences and select the right policies.
DRAFT
6
Introduction
Infrastructure is vital for the long-term development and competitiveness of countries worldwide,
and particularly so in developing economies. Adequate infrastructure is key to economic growth
as well as social and environment progress. However, many South-East Asia (SEA) countries are
facing constraints in developing and funding infrastructure projects. This may hinder their
development prospects.
In that context, this study evaluates infrastructure finance issues in SEA. It provides an overview
of the investment environment, financing needs and availability of finance within the SEA sub-
region. The study covers as many of the 11 SEA countries as possible although data limitations
mean that some analysis include only part of them.1
The report is structured as follows. Section 1 gives an overview on the infrastructure investment
environment in the SEA sub-region. Section 2 provides the latest projections of infrastructure
financing needs. Section 3 assesses the availability and various sources of funds for infrastructure
in the sub-region. Section 4 concludes.
1. Infrastructure Investment Environment
1.1. Economic Growth Prospects
SEA is considered as one of the fastest growing regions in the world with a cumulative population
of 640 million and GDP of about $2.430 billion, which account for 14.7% of the population and
9.6% of GDP in Asia (Table 1).2 The ten ASEAN economies are projected to see a slight
improvement in growth from 4.8% in 2016 to 4.9% in 2017, and average annual growth of 5.1%
over 2017-2021.3
SEA is yet a diverse region and there is a wide gap among countries in terms of the size of the
economy, GDP per capital and global competitiveness. For instance, growth is expected to be
higher than the average in the Philippines and Viet Nam at 6.2% and 6.1% per year respectively
over the medium term. Cambodia, Lao PDR and Myanmar will continue their catch-up, with the
strongest growth rates among ASEAN countries, exceeding 7% annually over the next five years
and reaching 8.5% on average in Myanmar.4
1 South-East Asia includes 11 countries: Brunei Darussalam, Cambodia, Indonesia, Lao PDR, Malaysia, Myanmar,
Philippines, Singapore, Thailand, Timor-Leste and Viet Nam. 2 Data by 2015 3 ASEAN includes 10 countries: Brunei Darussalam, Cambodia, Indonesia, Lao PDR, Malaysia, Myanmar,
Phillipines, Singapore, Thailand and Viet Nam. 4 OECD Economic Outlook for Southeast Asia, China and India 2017, Addressing the Energy Challenges.
Source: Global Infrastructure Investment Index 2016 Report (Arcadis)
Actual infrastructure investment in SEA have, however, been more limited than in other Asian
sub-regions. It accounts for about 2.6% of GDP between 2010 to 2014 which was the lowest in
comparing with East Asia (6.3%), South Asia (4.8%) and Central Asia (2.9%).7 Historically
infrastructure investment in SEA countries accounted for an average of 3% of GDP annually from
1992-2011, moderately below the global average of 3.8% in the same period. Total infrastructure
investment in Viet Nam had accounted for more than 8% of GDP, putting Viet Nam ahead of other
countries in the sub-region such as Malaysia, Singapore, Indonesia and Thailand with 5.6%, 4.5%,
2.6% and 2.3% respectively.8
Figure 1- Infrastructure Investment in Selected Countries in SEA (% of GDP), 1992-2011
Source: Network Asia Forum (2013), Infrastructure, Power & Utilities + Lifting- the -Barrier report, Mc Kinsey &
Company, CIMB Asean Research Institute (CARI).
7 ADB (2017), Meeting Asia’s Infrastructure Needs and Author’s calculation 8 Network Asia Forum (2013), Infrastructure, Power & Utilities + Lifting- the -Barrier report, Mc Kinsey &
Company, CIMB Asean Research Institute (CARI)
8.1 5.6 4.5 2.6 2.3
3.8
3.0
0
1
2
3
4
5
6
7
8
9
Viet Nam Malaysia Singapore Indonesia Thailand
Infr
astr
uct
ure
inve
stm
ent
(% o
f G
DP
)
% of GDP World Average South-East Asia Average
DRAFT
10
2. Infrastructure Financing Needs
Some SEA countries already possess good-quality infrastructure resulting from significant
investment made in the past while others suffer from underinvestment and need to do more to
ensure the provision of quality infrastructure assets to support economic growth and meet rapidly
growing demand.
Overall, the SEA countries have to spend much more than their historical investments in
infrastructure (i.e. 3% of GDP between 1992-2011) to accommodate expected GDP growth while
maintaining its competitiveness of infrastructure. ADB estimated that infrastructure needs are at
around $150 billion per year (approximately 6 per cent of GDP). This represents more than
doubling the current spending.9
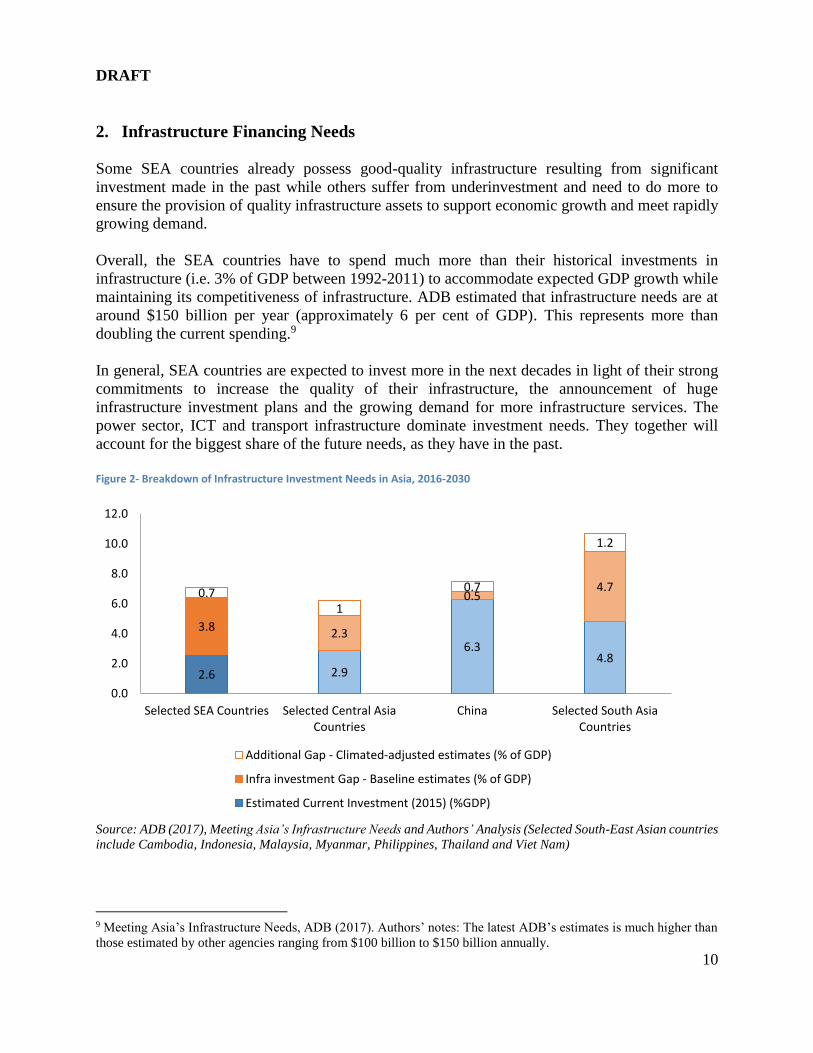
In general, SEA countries are expected to invest more in the next decades in light of their strong
commitments to increase the quality of their infrastructure, the announcement of huge
infrastructure investment plans and the growing demand for more infrastructure services. The
power sector, ICT and transport infrastructure dominate investment needs. They together will
account for the biggest share of the future needs, as they have in the past.
Figure 2- Breakdown of Infrastructure Investment Needs in Asia, 2016-2030
Source: ADB (2017), Meeting Asia’s Infrastructure Needs and Authors’ Analysis (Selected South-East Asian countries
include Cambodia, Indonesia, Malaysia, Myanmar, Philippines, Thailand and Viet Nam)
9 Meeting Asia’s Infrastructure Needs, ADB (2017). Authors’ notes: The latest ADB’s estimates is much higher than
those estimated by other agencies ranging from $100 billion to $150 billion annually.
2.6 2.9
6.34.8
3.82.3
0.54.70.7
1
0.7
1.2
0.0
2.0
4.0
6.0
8.0
10.0
12.0
Selected SEA Countries Selected Central AsiaCountries
China Selected South AsiaCountries
Additional Gap - Climated-adjusted estimates (% of GDP)
Infra investment Gap - Baseline estimates (% of GDP)
Estimated Current Investment (2015) (%GDP)
DRAFT
11
A closer look to the least developing countries in the sub-region shows that infrastructure needs
are higher in these countries in comparisons with the more advanced economies in SEA.
Specifically, Timor-Leste and Cambodia will need to invest as much as 11.8% and 10.3% of GDP
for infrastructure, respectively. While other least developing countries in the sub-region such as
Lao PDR and Myanmar have estimated infrastructure investment requirements of more than 8%
of GDP.
Figure 3- Yearly Infrastructure Needs in selected SEA countries and breakdown by sector and type of investment
Source: based on ESCAP (2017), Asia-Pacific Countries with Special Needs Development Report “Investing in
infrastructure for an inclusive and sustainable development”
In addition to domestic infrastructure, countries in SEA have also ambitious plan to develop
regional connectivity, which will require additional investments for instance to develop regional
railway lines and cross-border power grids. ADB noted that indicative investment needs for
Greater Mekong sub-region program is about $51 billion. 10
In order to promote greater connectivity, the ASEAN countries adopted the Master Plan on
ASEAN Connectivity 2025 (MPAC 2025) at the ASEAN Summits 2016. The MPAC 2025 focuses
on five strategic areas: sustainable infrastructure, digital innovation, seamless logistics, regulatory
excellence and people mobility. One of its objectives is to add value by complementing and
synergizing the ASEAN countries’ physical infrastructure and the sub-regional connectivity.
10 ADB publication on Meeting Asia’s Infrastructure Needs (page 41). GMS covers Cambodia, the PRC (Yunnan
Province and Guangxi Zhuang Autonomous Region), the Lao People’s Democratic Republic, Myanmar, Thailand,
and Viet Nam
0.0%
2.0%
4.0%
6.0%
8.0%
10.0%
12.0%
14.0%
Cambodia Lao PDR Myanmar Timor Leste
Transport Energy ICT WSS
49%
25%
26%
Univesal Access New Demand Maintenance
DRAFT
12
3. Infrastructure Financing Strategies
Investing in infrastructure to meet rapid economic growth and provide reliable services to people,
businesses and industries has been a challenge for most SEA countries. Investments have mainly
been funded by sovereign resources, including State-Owned Enterprises (SOEs), sometimes
backed up by user fees, or supplemented by foreign aids. These traditional sources still cannot
fulfil the whole demand for infrastructure investment given the existing pressure on the public
fiscal space. Different approaches to financing are nevertheless possible.
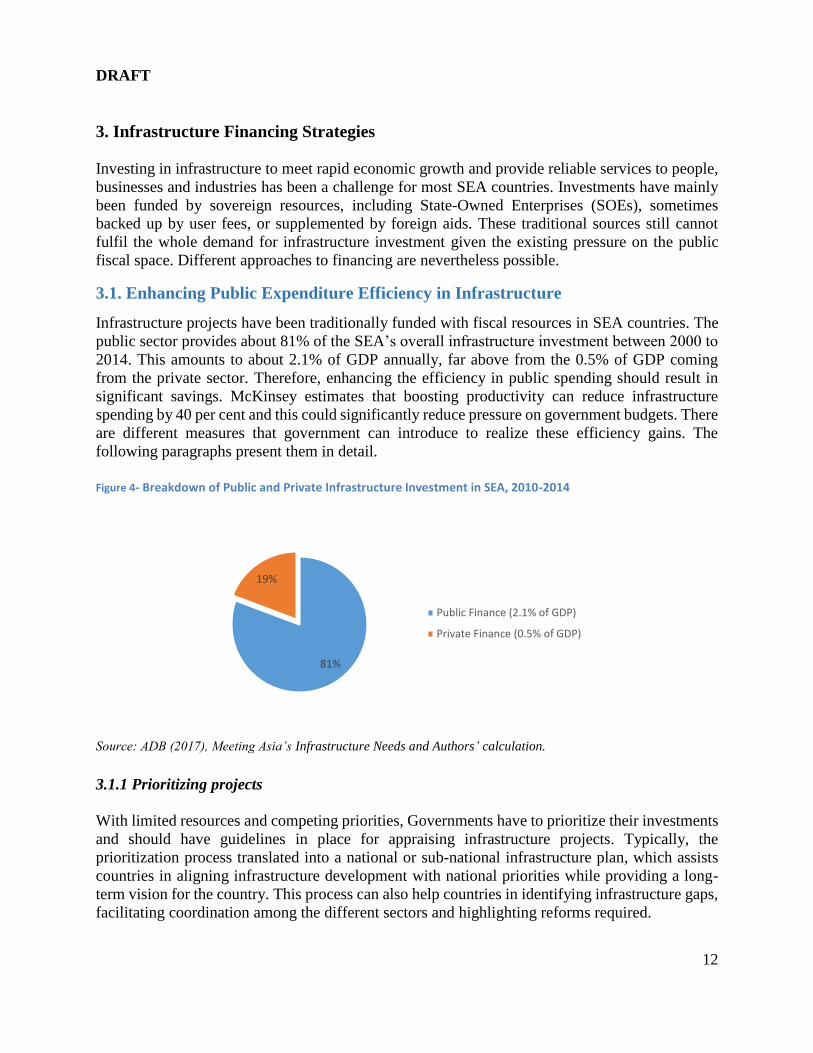
3.1. Enhancing Public Expenditure Efficiency in Infrastructure
Infrastructure projects have been traditionally funded with fiscal resources in SEA countries. The
public sector provides about 81% of the SEA’s overall infrastructure investment between 2000 to
2014. This amounts to about 2.1% of GDP annually, far above from the 0.5% of GDP coming
from the private sector. Therefore, enhancing the efficiency in public spending should result in
significant savings. McKinsey estimates that boosting productivity can reduce infrastructure
spending by 40 per cent and this could significantly reduce pressure on government budgets. There
are different measures that government can introduce to realize these efficiency gains. The
following paragraphs present them in detail.
Figure 4- Breakdown of Public and Private Infrastructure Investment in SEA, 2010-2014
Source: ADB (2017), Meeting Asia’s Infrastructure Needs and Authors’ calculation.
3.1.1 Prioritizing projects
With limited resources and competing priorities, Governments have to prioritize their investments
and should have guidelines in place for appraising infrastructure projects. Typically, the
prioritization process translated into a national or sub-national infrastructure plan, which assists
countries in aligning infrastructure development with national priorities while providing a long-
term vision for the country. This process can also help countries in identifying infrastructure gaps,
facilitating coordination among the different sectors and highlighting reforms required.
81%
19%
Public Finance (2.1% of GDP)
Private Finance (0.5% of GDP)
DRAFT
13
With regard to the appraisal guidelines, they should ensure that sufficient information on the
project is available to make an informed selection. This includes accurate project costs, clearly
specified objectives and option analysis. The appraisal should not only take into account financial
elements but also environmental and social impacts. The table below illustrates the situation in
different SEA countries.
Table 5- Infrastructure Planning in SEA
Does the country have a National or Sub-National
Infrastructure Plan?
Do the National and Sub-National Infrastructure Plans
contain a list of specific projects (Pipeline)?
Does the country have guidelines for the appraisal of
infrastructure projects?
Indonesia Yes Yes Yes
Malaysia No No No
Philippines No Yes Yes
Singapore No No Yes
Thailand Yes Yes Yes
Viet Nam No Yes Yes
Source: InfraCompass accessible from http://infracompass.gihub.org/
The 11th Malaysia Plan, launched on 21 May 2015, is an example of prioritization effort.
According to the plan, strengthening infrastructure to support economic expansion is regarded as
one of six strategic thrusts that the government has defined to help Malaysia stay ahead of the
challenges and opportunities of the fast-changing global and political landscape. The summary of
focus areas about “strengthening infrastructure” in the 11th Malaysia Plan is as follows:
- Building an integrated need-based transport system.
- Unleashing growth of logistics and enhancing trade facilitation.
- Improving coverage, quality, and affordability of digital infrastructure.
- Continuing the transition to a new water services industry framework.
- Encouraging sustainable energy use to support growth.
Subsequently, Malaysia has announced several major infrastructure projects to boost growth, to
be funded by both the private and the public sectors. These projects include additional Mass Rapid
Transit (MRT) and Light- Rail Transit (LRT) rail lines.
3.1.2 Improving delivery
Significant gains can be realized during the delivery of infrastructure projects for instance by
streamlining permit approvals, facilitating land acquisition, and improving public procurement
practices.
DRAFT
14
Streamlining permit approvals
Delays in the permitting process, which can increase costs and uncertainty, are considered as a
fundamental barrier to private investment in and speedy delivery of needed infrastructure projects.
A better understanding of the cost of delays should create a greater sense of urgency about the
need to get projects done more quickly. Therefore, it is important to figure out what is needed to
move a project along, defining the terms and timetable for the permitting and review process early
in project development, and doing so in a collaborative way on either a project-by-project or, even
better, a programmatic basis.
Several SEA countries perform better than the OECD average for dealing with a construction
permit with the exceptions of Cambodia (652 days), Timor Lester (207 days), Indonesia (200 days)
and Viet Nam (166 days). Singapore, at one extreme, is a good example on the efficiencies of
streamlining permit approval. It needs 9 procedures in 48 days to obtain necessary licenses and
permits, complete required notifications and inspections, and obtain utility connections. One of the
reasons is that Singapore has adopted online applications to fasten the permit approval process.
Figure 5-Construction Permits in SEA
Source: World Bank Doing Business - accessible from http://www.doingbusiness.org/
Facilitation land acquisition
The land acquisition process is critical to the successful development of public infrastructure,
which often requires a large amount of land. Many projects have been stumbled on land-acquisition
issues such as the Central Java Power Plant project in Indonesia signed in 2011 but for which the
construction could only start in 2017. Overall, bottlenecks in the land acquisition phase are an
impediment for infrastructure development in the SEA sub-region. This problem is evident in
countries like Thailand, Indonesia, the Philippines and Viet Nam where transport infrastructure is
a pressing issue and land is urgently required. Even if there are laws in place like the Philippines’
0
5
10
15
20
25
30
0
100
200
300
400
500
600
700
Nu
mb
er
Day
s
Time (days) Procedures (number) (rhs)
DRAFT
15
“Right-of-Way Act”, it boils down to the effectiveness of implementation. The following examples
illustrate some measures taken in the region to address this issue:
• Indonesia: On January 14 2012, Law No. 2 of 2012 on Land Procurement for Development in
the Public Interest (Law 2/2012) came into effect in Indonesia. Law 2/2012 substantially
accelerates the land acquisition process for development in the public interest. It sets a clearer
mechanism for the acquisition of civilian land to facilitate the development of new
infrastructure projects. Law 2/2012 prescribes that the time to complete the land acquisition
procedure is from six months to 3.3 years. Most importantly, landowners are obligated to
release their land after receiving compensation or after a binding court decision is delivered,
in which case the compensation will be deposited to the District Court. The valuation of the
land will be conducted by an appraiser appointed by the Land Agency. Furthermore, Indonesia
enacted Presidential Regulation No.30 Year 2015 on 17 March 2015, which covers land
procurement for public infrastructure. The Government will take over the responsibility for
conducting such procurement.
• Singapore amended its Land Titles Act, effective 15 August 2014, to provide greater clarity,
consistency and operational efficiency. For example, the provisions relating to the surrender
and reissuance of title to land (whether registered or unregistered, whether subject to mortgage
or charge, and whether of the same or different tenure) have been streamlined and simplified
to a single process.
The land acquisition process could also be facilitated if land administration was reinforced in the
region, notably regarding land registration. World Bank’s land administration index provides
information about these issues (Figure 6). The index comprises of five dimensions: reliability of
infrastructure (e.g. availability of Geographical Information System), transparency of information
(e.g. accessibility of maps), geographic coverage, land dispute resolution, and equal access to
property rights.
Figure 6- Quality of the Land Administration Index (0-30)
Source: World Bank Doing Business - accessible from http://www.doingbusiness.org/
A way to address this issue is to reprioritize public spending to free resources for infrastructure
investments. For instance, many countries in the sub-region may try to gradually remove huge
subsidies that are consuming a large of the government budget (e.g. petrol and electricity subsidies
take up around 20 per cent of the government budget in Indonesia) and reallocate these resources
to infrastructure investments.
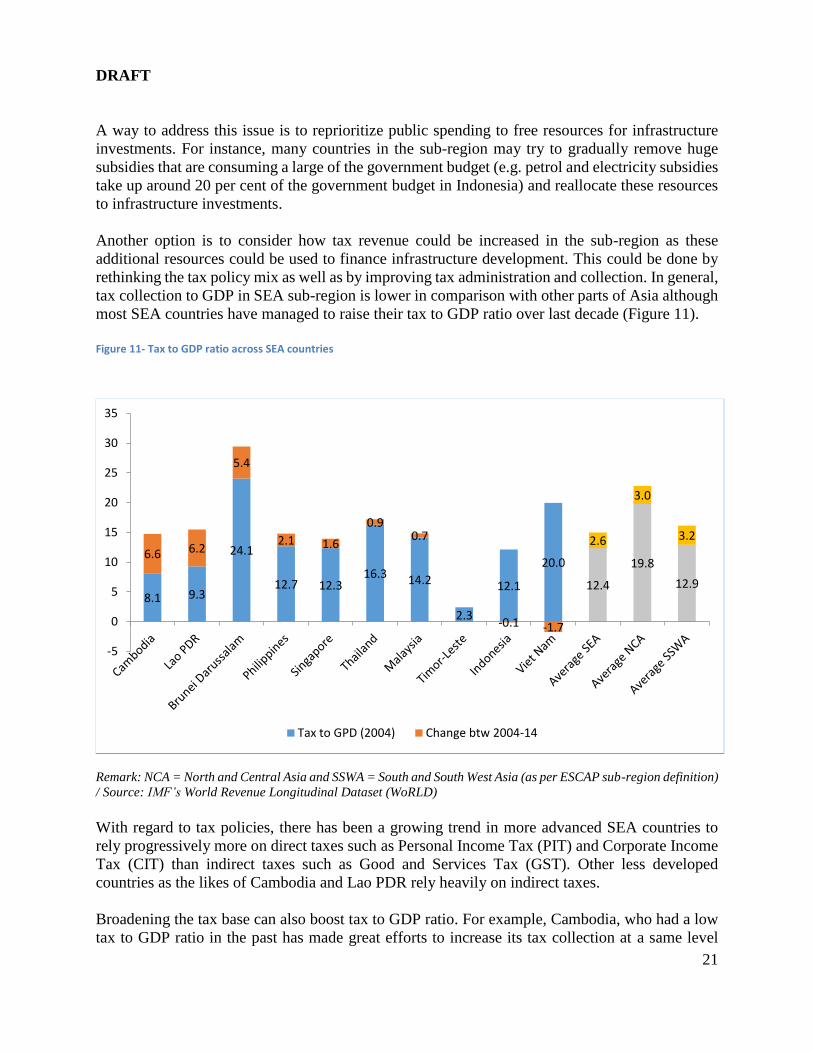
Another option is to consider how tax revenue could be increased in the sub-region as these
additional resources could be used to finance infrastructure development. This could be done by
rethinking the tax policy mix as well as by improving tax administration and collection. In general,
tax collection to GDP in SEA sub-region is lower in comparison with other parts of Asia although
most SEA countries have managed to raise their tax to GDP ratio over last decade (Figure 11).
Figure 11- Tax to GDP ratio across SEA countries
Remark: NCA = North and Central Asia and SSWA = South and South West Asia (as per ESCAP sub-region definition)
/ Source: IMF’s World Revenue Longitudinal Dataset (WoRLD)
With regard to tax policies, there has been a growing trend in more advanced SEA countries to
rely progressively more on direct taxes such as Personal Income Tax (PIT) and Corporate Income
Tax (CIT) than indirect taxes such as Good and Services Tax (GST). Other less developed
countries as the likes of Cambodia and Lao PDR rely heavily on indirect taxes.
Broadening the tax base can also boost tax to GDP ratio. For example, Cambodia, who had a low
tax to GDP ratio in the past has made great efforts to increase its tax collection at a same level
8.1 9.3
24.1
12.7 12.316.3 14.2
2.3
12.1
20.0
12.4
19.8
12.9
6.6 6.2
5.4
2.1 1.6
0.90.7
-0.1 -1.7
2.6
3.0
3.2
-5
0
5
10
15
20
25
30
35
Tax to GPD (2004) Change btw 2004-14
DRAFT
22
similar to other countries in the sub-region. Cambodia traditionally operated a two-tier tax
structure. On the one hand, there were the ‘real regime’ taxpayers: registered companies, state-
owned companies and other businesses with some system of formal accounting. On the other hand,
there were the ‘estimated regime’ taxpayers: companies or small ventures with no formal
accounting – essentially without a paper-trail of profits – and taxable amounts for these were
estimated based on discussions between taxpayers and tax officials. It was reported that 60% of
the country’s state tax collectors worked with ‘estimated regime’ payers, which brought in less
than 1% of the total tax revenue. The government of Cambodia has set about scrapping the
‘estimated regime’ to bring all enterprises under the ‘real’ tax regime. In December 2015, the
government issued a prakas – an official edict – to end the ‘estimated regime’, creating a stricter
system for small and medium enterprises.
Figure 12- Tax mix in selected SEA countries
Source: Authors’ calculation based on IMF’s World Revenue Longitudinal Dataset (WoRLD) – PIT, CIT and GST
stand respectively for Personal Income Tax, Corporate Income Tax and General taxes on goods and services
Myanmar is another interesting example. The country’s tax-to-GDP stood at below 7 percent in
2012, one of the lowest in the world. However, with the support of IMF, the country has made
significant progress thanks to strengthened capacity in tax administration. Since 2012, revenues
from major taxes have increased on average by more than 20 per cent on yearly basis. The
compliance by large tax payers in the areas of registration, on-time filing and payment is close to
international standards. Tax policy reforms have been initiated to broaden the base of indirect taxes
and the tax department is in a better position to review the direct-taxes base.14
14 IMF Annual Report 2016 - Finding Solutions Together
0%
0%
9%
16%
17%
17%
13%
0%
0%
35%
45%
27%
28%
30%
44%
38%
32%
20%
16%
19%
23%
31%
49%
19%
10%
13%
13%
29%
24%
12%
2%
2%
20%
0%
5%
0% 10% 20% 30% 40% 50% 60% 70% 80% 90% 100%
Cambodia
Lao PDR
Indonesia
Malaysia
Philippines
Singapore
Thailand
PIT CIT GST Other taxes on goods & services Taxes on property Taxes on inter. trade Other
DRAFT
23
Figure 13- Direct to indirect tax ration, change since 1990s
Source: ESCAP’s calculation based on IMF’s World Revenue Longitudinal Dataset (WoRLD)
Regarding tax administration and collection, these reforms have often involved changes in the
organizational structure of tax authority, including the creation of taxpayer offices. More intensive
use of ICT, such as electronic filing systems is another common reform. For example, electronic
tax filing system in Viet Nam has been implemented since 2014, the result so far is very positive
with 99.6% of enterprises registered on the system and reduce transaction time for tax payers.
Rationalizing tax incentives can also be a means to increase revenue generation. Typically,
countries in the region have provided tax incentives to encourage investment including in
infrastructure projects. Cost-benefit analysis are needed to evaluate whether these incentives are
bringing value-for-money.
Box 1- Tax Incentives in selected SEA countries
• Indonesia issued Government Regulation Number 18 Year 2015 (effective since 6 May 2015) to improve tax incentives for investments made in certain business fields or regions. It offers more types of incentives with more relaxed conditions and broader eligibility criteria for business fields and regions.
• Malaysia announced four new incentives in the 2015 budget for investments made in less developed areas, industrial estates, and projects that increase automation in labor-intensive industries, and establishment of principal hubs.
• Thailand’s “Seven-Year Investment Strategy” (2015-2021), approved in November 2014, offers fiscal incentives on the basis of the importance of the activities and the merit of the investment (such as whether it enhances competitiveness, promotes decentralization, or encourages industrial area development).
Source: ASEAN Investment Report 2015, Infrastructure and Connectivity.
-2.5
-2
-1.5
-1
-0.5
0
0.5
1
1.5
2
2.5Ja
pan
Ind
on
esi
aTu
rke
yH
on
g K
on
g, C
hin
aK
yrgy
z R
epu
blic
Mo
ngo
lia Fiji
Sin
gap
ore
Ru
ssia
n F
ed
era
tio
nA
ust
ralia
Tajik
ista
nN
ew Z
eala
nd
Ch
ina
Mal
div
esSa
mo
aSr
i Lan
kaLa
o P
DR
Cam
bo
dia
Nep
alB
angl
ade
shA
rmen
iaA
fgh
anis
tan
Pap
ua
Ne
w G
uin
ea
Ko
rea,
Rep
.M
yan
mar
Ph
ilip
pin
esTh
aila
nd
Pak
ista
nG
eorg
iaK
azak
hst
anA
zerb
aija
nIn
dia
Bh
uta
nIr
an, I
slam
ic R
ep
.M
alay
sia
per
cnta
ge p
oin
ts
DRAFT
24
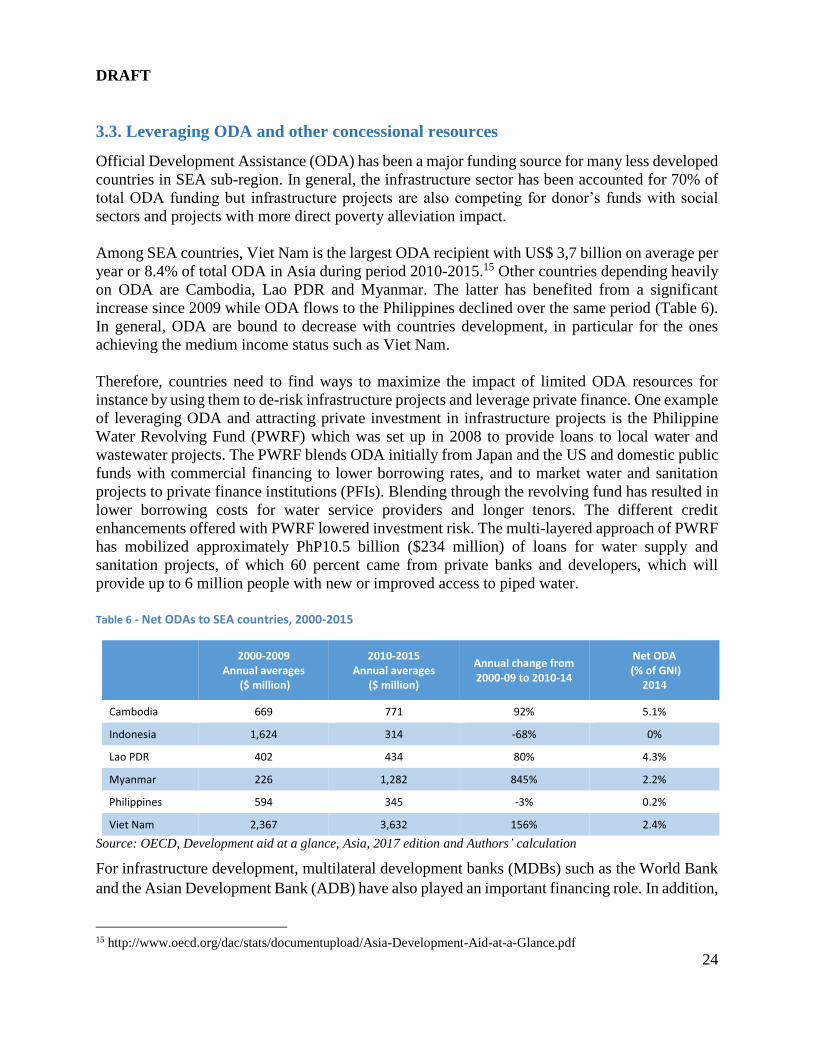
3.3. Leveraging ODA and other concessional resources
Official Development Assistance (ODA) has been a major funding source for many less developed
countries in SEA sub-region. In general, the infrastructure sector has been accounted for 70% of
total ODA funding but infrastructure projects are also competing for donor’s funds with social
sectors and projects with more direct poverty alleviation impact.
Among SEA countries, Viet Nam is the largest ODA recipient with US$ 3,7 billion on average per
year or 8.4% of total ODA in Asia during period 2010-2015.15 Other countries depending heavily
on ODA are Cambodia, Lao PDR and Myanmar. The latter has benefited from a significant
increase since 2009 while ODA flows to the Philippines declined over the same period (Table 6).
In general, ODA are bound to decrease with countries development, in particular for the ones
achieving the medium income status such as Viet Nam.
Therefore, countries need to find ways to maximize the impact of limited ODA resources for
instance by using them to de-risk infrastructure projects and leverage private finance. One example
of leveraging ODA and attracting private investment in infrastructure projects is the Philippine
Water Revolving Fund (PWRF) which was set up in 2008 to provide loans to local water and
wastewater projects. The PWRF blends ODA initially from Japan and the US and domestic public
funds with commercial financing to lower borrowing rates, and to market water and sanitation
projects to private finance institutions (PFIs). Blending through the revolving fund has resulted in
lower borrowing costs for water service providers and longer tenors. The different credit
enhancements offered with PWRF lowered investment risk. The multi-layered approach of PWRF
has mobilized approximately PhP10.5 billion ($234 million) of loans for water supply and
sanitation projects, of which 60 percent came from private banks and developers, which will
provide up to 6 million people with new or improved access to piped water.
Table 6 - Net ODAs to SEA countries, 2000-2015
2000-2009
Annual averages ($ million)
2010-2015 Annual averages
($ million)
Annual change from 2000-09 to 2010-14
Net ODA (% of GNI)
2014
Cambodia 669 771 92% 5.1%
Indonesia 1,624 314 -68% 0%
Lao PDR 402 434 80% 4.3%
Myanmar 226 1,282 845% 2.2%
Philippines 594 345 -3% 0.2%
Viet Nam 2,367 3,632 156% 2.4%
Source: OECD, Development aid at a glance, Asia, 2017 edition and Authors’ calculation
For infrastructure development, multilateral development banks (MDBs) such as the World Bank
and the Asian Development Bank (ADB) have also played an important financing role. In addition,
Another emerging source of infrastructure financing is climate finance, which has grown rapidly
in recent years and further increases are anticipated. For example, global climate finance increased
by 18% from $342 billion in 2013 to $392 billion in 2014. East Asia and the Pacific excluding
China accounted for 9% of the total or $35 billion.16 Renewable energy, energy efficiency
investment and low-carbon transport have captured the majority of climate finance flows over the
last four years. Entities such as the Climate Investment Funds (CIFs) have been important vehicles
for delivering concessional climate finance. The Climate Investment Funds (CIFs) which operated
alongside the MDBs has a mandate to finance low- carbon resilient infrastructure17. The funding
contributions to the CIFs are divided between two trust funds—the Clean Technology Fund (CTF),
$5.5 billion at present; and the Strategic Climate Fund (SCF), $2.5 billion. Example projects in
SEA sub-region received CTF funding:
• The Central Thailand Solar Power Project (57 MW) with Solarco. The project’s cost is $159
million, of which $35 million is from CTF, $52 million from ADB, and $72 million from local
Thai commercial banks.
• The provincial solar power project with Bangchak Solar energy (32 MW) of solar power
generation. The project’s cost is $63 million, of which $12.6 million is from CTF, $25.2
million from ADB, and $25.2 million from local Thai commercial banks.
With more than $10 billion mobilized, the Green Climate Fund (GCF) is another key instrument
to support developing countries to respond to the challenge of climate change. Through GCF,
countries can access finance for climate mitigation and adaption projects. In the sub-region, Viet
Nam has benefited from $29.5 million of grants from GCF for its project entitled: “Improving the
resilience of vulnerable coastal communities to climate change related impacts in Viet Nam”,
which will incorporate storm and flood resilient design features in new houses benefiting 20,000
poor and highly disaster-exposed people.
16 http://www.climatefinancelandscape.org/
East Asia and the Pacific remained the largest destination for climate finance, accounting for 30% of the total or
$118 billion, up 24% on 2013. China alone accounted for 21% of total finance. 17 Low-carbon resilient infrastructure is a subset of overall infrastructure and comprises “core” infrastructure
needs—power, transport, and water/sewage as well as investments in energy efficiency.
sustainability, problem with managing debt, no credit rating, undiversified sector of private sector participation (focus on hydropower), inappropriate financing mechanism has led to macroeconomic instability.
• Viet Nam: Macroeconomic instability, high inflation, price volatility lead to higher risks for projects of
infrastructure, high debt makes difficult to increase borrowing even on concessional terms, new PPP Decree was introduced to promote private investment in infrastructure but the results seem to be limited(*).
sustainability, no credit rating, heavily dependent on ODA. As new emerging economy with quite large population and area, Myanmar has the potential to attract investment and support from international community.
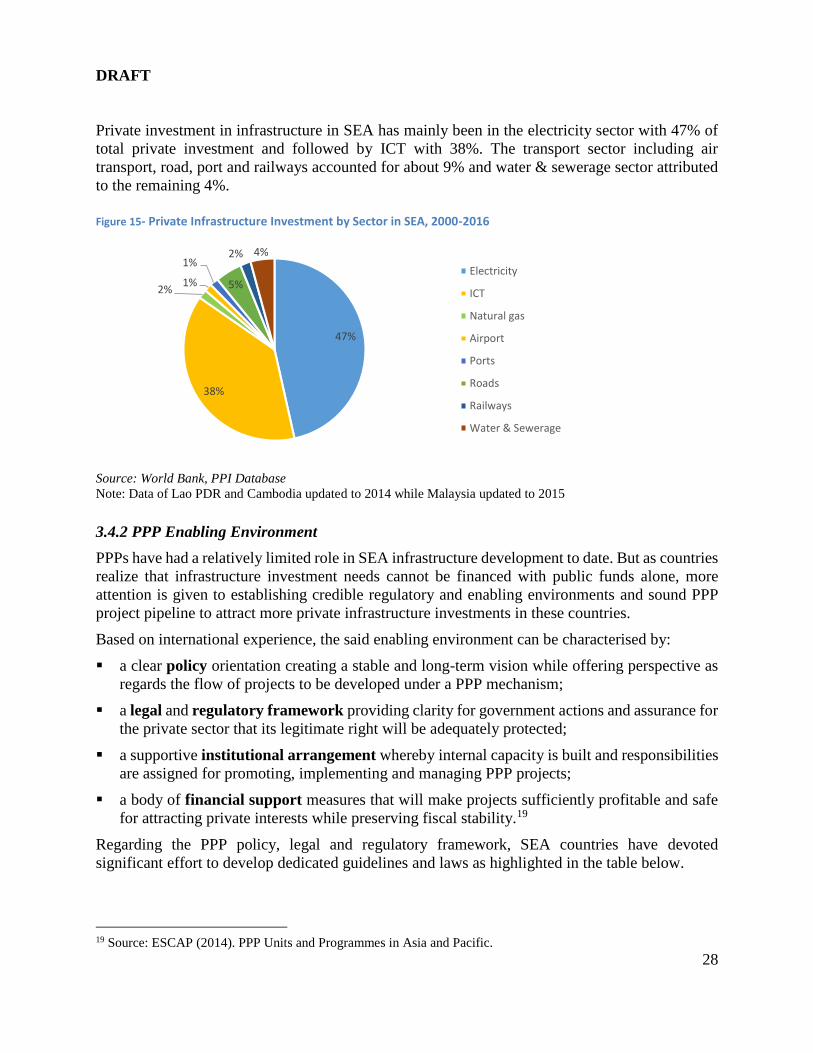
To contribute to infrastructure development, the private sector has to access financing. However,
domestic markets provide limited opportunities to source project finance in some SEA countries.
Malaysia, Indonesia, Singapore and Thailand meet the criteria of mature financial markets but
originate only minor levels of infrastructure finance loans. The rest of SEA countries (Brunei,
Cambodia, Lao PDR, Myanmar, Viet Nam) have capital markets in transition and rely mostly on
foreign-sourced debts. This group of countries will require more time to develop the depth and
diversity of financial services needed for infrastructure finance.
Figure 17- Project Finance Loans - SEA, 2013-2015
Source: PFI League Table, www.Reuters.com
1,376 1,125
703
3,571
2,509
5,000
4,268
729 592
1,879
914
2,763
23
566
84
984
3,173 3,030
418 296
0
500
1,000
1,500
2,000
2,500
3,000
3,500
4,000
4,500
5,000
Indonesia Lao PDR Malaysia Phillipines Singapore Thailand Viet Nam
($ m
illio
n)
2013 2014 2015
DRAFT
33
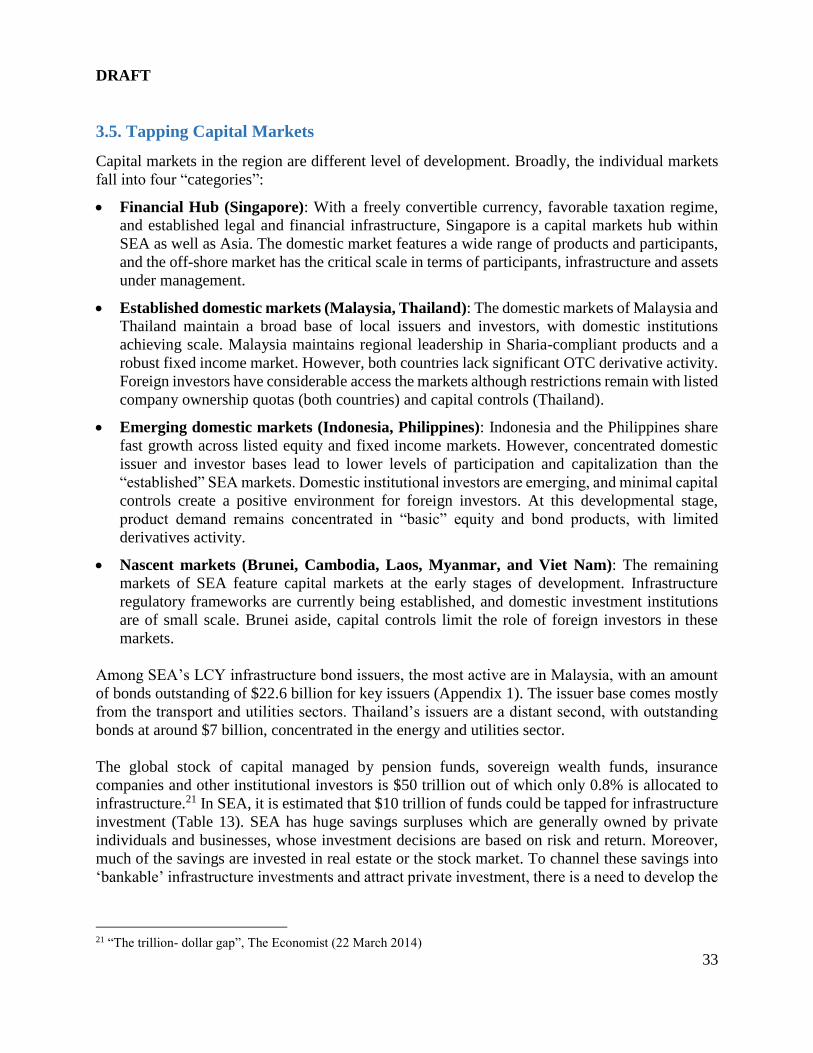
3.5. Tapping Capital Markets
Capital markets in the region are different level of development. Broadly, the individual markets
fall into four “categories”:
• Financial Hub (Singapore): With a freely convertible currency, favorable taxation regime,
and established legal and financial infrastructure, Singapore is a capital markets hub within
SEA as well as Asia. The domestic market features a wide range of products and participants,
and the off-shore market has the critical scale in terms of participants, infrastructure and assets
under management.
• Established domestic markets (Malaysia, Thailand): The domestic markets of Malaysia and
Thailand maintain a broad base of local issuers and investors, with domestic institutions
achieving scale. Malaysia maintains regional leadership in Sharia-compliant products and a
robust fixed income market. However, both countries lack significant OTC derivative activity.
Foreign investors have considerable access the markets although restrictions remain with listed
company ownership quotas (both countries) and capital controls (Thailand).
• Emerging domestic markets (Indonesia, Philippines): Indonesia and the Philippines share
fast growth across listed equity and fixed income markets. However, concentrated domestic
issuer and investor bases lead to lower levels of participation and capitalization than the
“established” SEA markets. Domestic institutional investors are emerging, and minimal capital
controls create a positive environment for foreign investors. At this developmental stage,
product demand remains concentrated in “basic” equity and bond products, with limited
derivatives activity.
• Nascent markets (Brunei, Cambodia, Laos, Myanmar, and Viet Nam): The remaining
markets of SEA feature capital markets at the early stages of development. Infrastructure
regulatory frameworks are currently being established, and domestic investment institutions
are of small scale. Brunei aside, capital controls limit the role of foreign investors in these
markets.
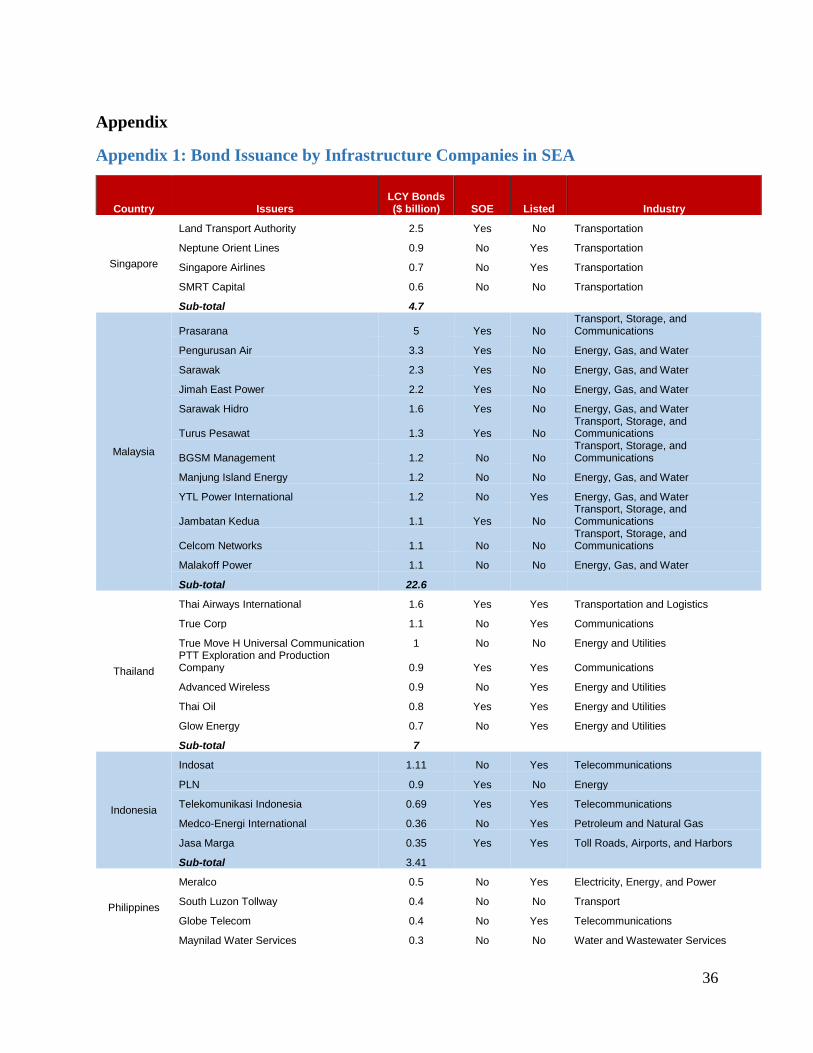
Among SEA’s LCY infrastructure bond issuers, the most active are in Malaysia, with an amount
of bonds outstanding of $22.6 billion for key issuers (Appendix 1). The issuer base comes mostly
from the transport and utilities sectors. Thailand’s issuers are a distant second, with outstanding
bonds at around $7 billion, concentrated in the energy and utilities sector.
The global stock of capital managed by pension funds, sovereign wealth funds, insurance
companies and other institutional investors is $50 trillion out of which only 0.8% is allocated to
infrastructure.21 In SEA, it is estimated that $10 trillion of funds could be tapped for infrastructure
investment (Table 13). SEA has huge savings surpluses which are generally owned by private
individuals and businesses, whose investment decisions are based on risk and return. Moreover,
much of the savings are invested in real estate or the stock market. To channel these savings into
‘bankable’ infrastructure investments and attract private investment, there is a need to develop the
21 “The trillion- dollar gap”, The Economist (22 March 2014)
DRAFT
34
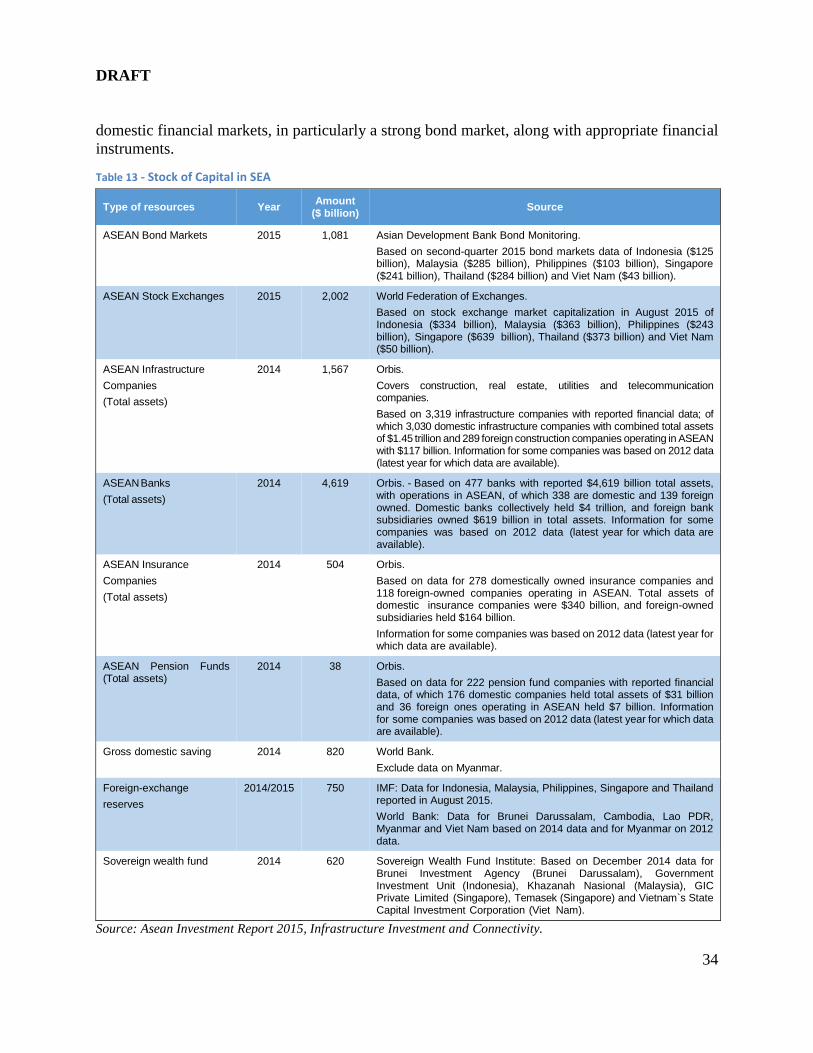
domestic financial markets, in particularly a strong bond market, along with appropriate financial
instruments.
Table 13 - Stock of Capital in SEA
Type of resources Year Amount
($ billion) Source
ASEAN Bond Markets 2015 1,081 Asian Development Bank Bond Monitoring.
Based on second-quarter 2015 bond markets data of Indonesia ($125 billion), Malaysia ($285 billion), Philippines ($103 billion), Singapore ($241 billion), Thailand ($284 billion) and Viet Nam ($43 billion).
ASEAN Stock Exchanges
2015 2,002 World Federation of Exchanges.
Based on stock exchange market capitalization in August 2015 of Indonesia ($334 billion), Malaysia ($363 billion), Philippines ($243 billion), Singapore ($639 billion), Thailand ($373 billion) and Viet Nam ($50 billion).
ASEAN Infrastructure
Companies
(Total assets)
2014 1,567 Orbis.
Covers construction, real estate, utilities and telecommunication companies.
Based on 3,319 infrastructure companies with reported financial data; of which 3,030 domestic infrastructure companies with combined total assets of $1.45 trillion and 289 foreign construction companies operating in ASEAN with $117 billion. Information for some companies was based on 2012 data (latest year for which data are available).
ASEAN Banks
(Total assets)
2014 4,619 Orbis. - Based on 477 banks with reported $4,619 billion total assets, with operations in ASEAN, of which 338 are domestic and 139 foreign owned. Domestic banks collectively held $4 trillion, and foreign bank subsidiaries owned $619 billion in total assets. Information for some companies was based on 2012 data (latest year for which data are available).
ASEAN Insurance
Companies
(Total assets)
2014 504 Orbis.
Based on data for 278 domestically owned insurance companies and 118 foreign-owned companies operating in ASEAN. Total assets of domestic insurance companies were $340 billion, and foreign-owned subsidiaries held $164 billion.
Information for some companies was based on 2012 data (latest year for which data are available).
ASEAN Pension Funds (Total assets)
2014 38 Orbis.
Based on data for 222 pension fund companies with reported financial data, of which 176 domestic companies held total assets of $31 billion and 36 foreign ones operating in ASEAN held $7 billion. Information for some companies was based on 2012 data (latest year for which data are available).
Gross domestic saving 2014 820 World Bank.
Exclude data on Myanmar.
Foreign-exchange
reserves
2014/2015 750 IMF: Data for Indonesia, Malaysia, Philippines, Singapore and Thailand reported in August 2015.
World Bank: Data for Brunei Darussalam, Cambodia, Lao PDR, Myanmar and Viet Nam based on 2014 data and for Myanmar on 2012 data.
Sovereign wealth fund 2014 620 Sovereign Wealth Fund Institute: Based on December 2014 data for Brunei Investment Agency (Brunei Darussalam), Government Investment Unit (Indonesia), Khazanah Nasional (Malaysia), GIC Private Limited (Singapore), Temasek (Singapore) and Vietnam`s State Capital Investment Corporation (Viet Nam).
Source: Asean Investment Report 2015, Infrastructure Investment and Connectivity.
DRAFT
35
Developing capital markets has been progressed in SEA to channel capital flow for infrastructure
investment. Some good examples from SEA countries are:
• Regulatory initiatives for the development of local capital markets: Indonesia, Malaysia, and
Thailand issue periodic Capital Markets Master Plans (CMMP) to build consensus around
policy and legal reforms against a fixed timeline, while Singapore has an explicit target of
developing an international financial center.
• Institutional investor regulation: Indonesia, the Philippines and Thailand are enhancing
national healthcare and pension schemes, creating sizable domestic asset management
institutions with the potential to act as “cornerstone” investors in local markets. Furthermore,
as domestic insurers across ASEAN slowly liberalize asset allocation guidelines it is expect
these institutions to play larger roles in domestic equity and corporate debt markets across the
region.
• Solutions to incentivize the private sector for investing long-term in the SEA countries will be
important. This includes mechanisms such as infrastructure guarantee funds (similar to that
which Indonesia has established), transparency on foreign investors operating in a country, and
domestic bond market development (e.g., Malaysia has enabled project companies to raise
bonds for their infrastructure projects).
4. Conclusion
The SEA sub-region’s infrastructure investment requirements are huge and public resources
limited. In that context, countries have to carefully design financing strategies in order to fill the
existing gaps and meet future demand. These strategies will, however, differ according to the
macroeconomic and capital market conditions of each country.
Less developed economies such as Cambodia, Laos and Myanmar are likely to rely on multilateral
development banks and ODA. Similarly, in the Philippines and Viet Nam, government financing
and multilateral agencies may lead the way although the private sector is likely to play a growing
role. Malaysia and Thailand have been increasingly tapping capital markets and they are expected
to employ various methods of government financing as well as commercial bank loans and capital
market options.
To address the infrastructure financing challenges in the region, all the different strategies
presented will though be necessary and governments should call on development partners to assist
them in taking forward this agenda.
36
Appendix
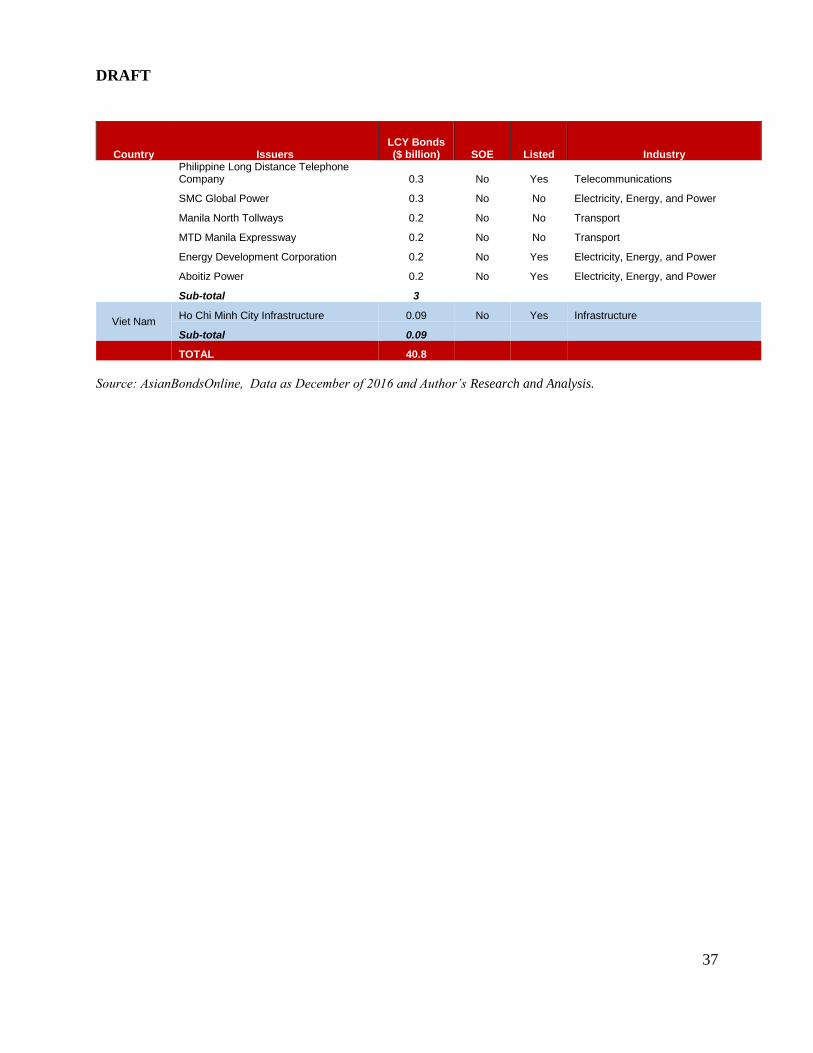
Appendix 1: Bond Issuance by Infrastructure Companies in SEA
Country Issuers LCY Bonds ($ billion) SOE Listed Industry
Singapore
Land Transport Authority 2.5 Yes No Transportation
Neptune Orient Lines 0.9 No Yes Transportation
Singapore Airlines 0.7 No Yes Transportation
SMRT Capital 0.6 No No Transportation
Sub-total 4.7
Malaysia
Prasarana 5 Yes No Transport, Storage, and Communications
Pengurusan Air 3.3 Yes No Energy, Gas, and Water
Sarawak 2.3 Yes No Energy, Gas, and Water
Jimah East Power 2.2 Yes No Energy, Gas, and Water
Sarawak Hidro 1.6 Yes No Energy, Gas, and Water
Turus Pesawat 1.3 Yes No Transport, Storage, and Communications
BGSM Management 1.2 No No Transport, Storage, and Communications
Manjung Island Energy 1.2 No No Energy, Gas, and Water
YTL Power International 1.2 No Yes Energy, Gas, and Water
Jambatan Kedua 1.1 Yes No Transport, Storage, and Communications
Celcom Networks 1.1 No No Transport, Storage, and Communications
Malakoff Power 1.1 No No Energy, Gas, and Water
Sub-total 22.6
Thailand
Thai Airways International 1.6 Yes Yes Transportation and Logistics
True Corp 1.1 No Yes Communications
True Move H Universal Communication 1 No No Energy and Utilities PTT Exploration and Production Company 0.9 Yes Yes Communications
Advanced Wireless 0.9 No Yes Energy and Utilities
Thai Oil 0.8 Yes Yes Energy and Utilities
Glow Energy 0.7 No Yes Energy and Utilities
Sub-total 7
Indonesia
Indosat 1.11 No Yes Telecommunications
PLN 0.9 Yes No Energy
Telekomunikasi Indonesia 0.69 Yes Yes Telecommunications
Medco-Energi International 0.36 No Yes Petroleum and Natural Gas
Jasa Marga 0.35 Yes Yes Toll Roads, Airports, and Harbors
Sub-total 3.41
Philippines
Meralco 0.5 No Yes Electricity, Energy, and Power
South Luzon Tollway 0.4 No No Transport
Globe Telecom 0.4 No Yes Telecommunications
Maynilad Water Services 0.3 No No Water and Wastewater Services
DRAFT
37
Country Issuers LCY Bonds ($ billion) SOE Listed Industry
Philippine Long Distance Telephone Company 0.3 No Yes Telecommunications
SMC Global Power 0.3 No No Electricity, Energy, and Power
Manila North Tollways 0.2 No No Transport
MTD Manila Expressway 0.2 No No Transport
Energy Development Corporation 0.2 No Yes Electricity, Energy, and Power
Aboitiz Power 0.2 No Yes Electricity, Energy, and Power
Sub-total 3
Viet Nam Ho Chi Minh City Infrastructure 0.09 No Yes Infrastructure
Sub-total 0.09
TOTAL 40.8
Source: AsianBondsOnline, Data as December of 2016 and Author’s Research and Analysis.
38
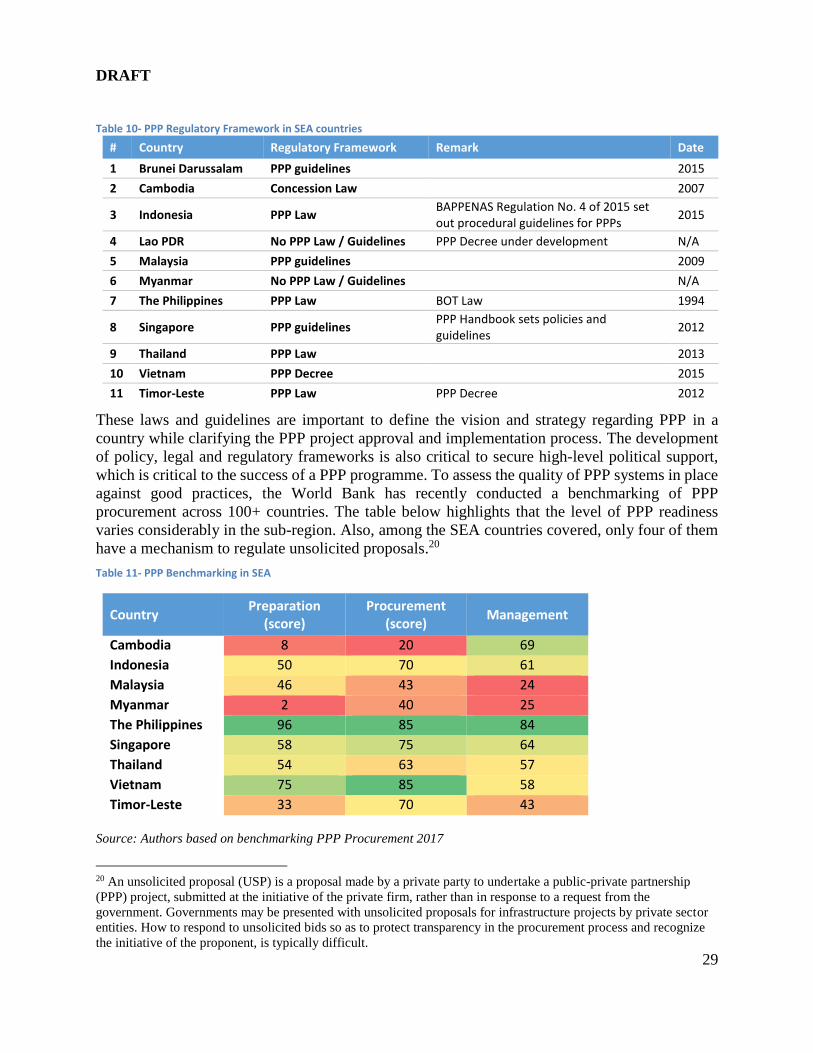
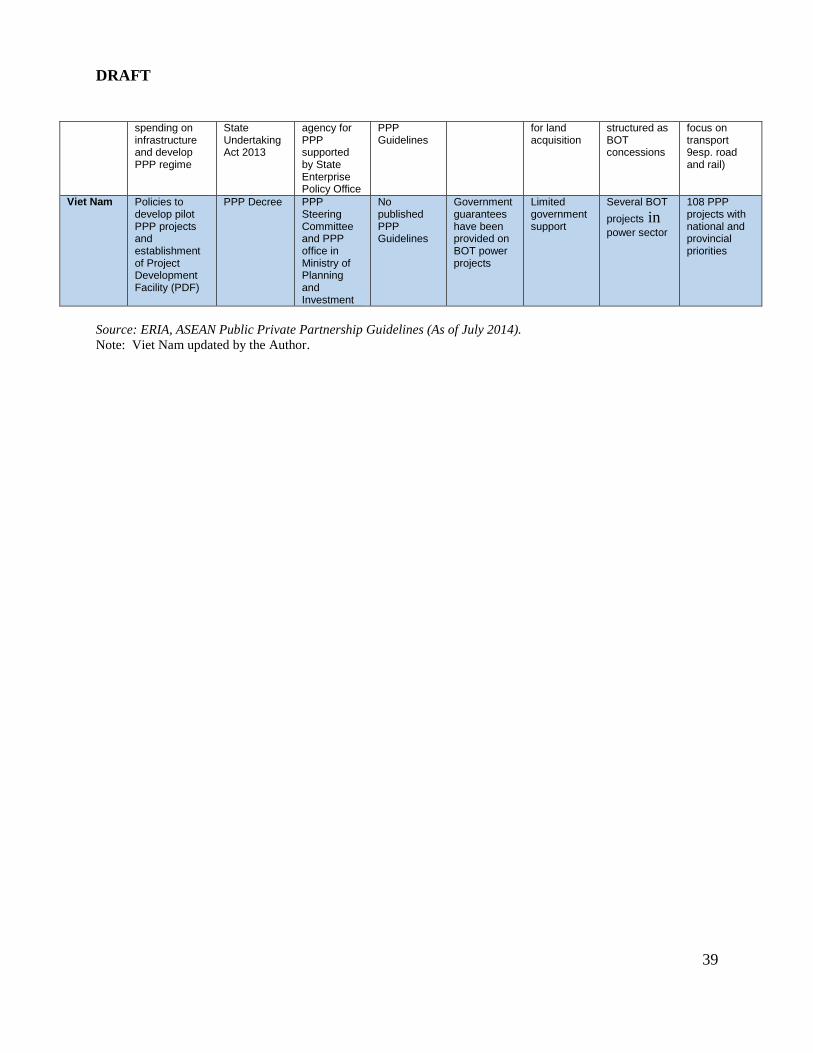
Appendix 2: Summary of PPP Framework/Experience in SEA countries
Country Policy Framework
Legal Framework
PPP Governent Agency
Guidelines Government Financial Support
Land Acquisition
Implemented Projects
Pipeline New Projects
Brunei Limited PPP specific policies
No specific PPP laws
No specific PPP agency
Guidelines for Governmentt Procurement
No developed regime beyond subsidiaries
Limited governmnet support
Several ICT and airport projects
Limited
Cambodia Limited PPP specific policies
No specific PPP laws
No specific PPP agency
Procurement manual ( but not specific PPP)
No developed regime
Limited government support
Mainly in the power sector and airport concessions
Limited
Indonesia Set out in Economic Master Plan and PPP book
Several specific PPP laws and regulations
Bappenas and some other bodies paly each role
PPP Investor’s Guide and PPP Book (published annually)
Guarantees (through IIGF and VGF)
A various forms of Land Funds or related laws
Severaal water and power projects currently in procurement
27 projects set out in 2013 PPP Book, mainly in the transport, water, waste and power sectors
Lao PDR Limited PPP specific policies
No specific PPP laws (foreign investment laws provide a basic framework)
No specific PPP agency
General investment guidebook from Ministry of Planning and Investment
No developed regime beyond general tax incentives
Limited government support
Mainly in the hydropower sector
Limited (proposed national road, 13 PPP, social infrastructure projects)
Malaysia Mainly set out in Privatization Policy and 2009 PPP Guideline
No specific PPP laws
3PU (UKAS) PPP Guideline (2009)
Limited government support (Facilitation Fund in place for purely private initiatives)
Federal State Authority can acquire private land
Several road projects in early 2000s (using BOT structure)
Some projects in procurement. 52 projects proposed in 10th Malaysia Plan (2010)
Myanmar Limited PPP specific policies. Some infrastructure policies in National Comprehensive Development Plan
No specific PPP laws (new foreign investment laws provide a basic framework)
No specific PPP agency
No published PPP Guidelines
No developed regime
Limited government support
Several airport and power projects in procurement
Limited (several airport PPPs are in procurement( Hanthawaddy, Mandalay, Yangon)
Phillipines Philippines Development Plan by National Economic and Development Authority
Republic Acts developed from BOT framework and their Implementing Rules and Regulations
PPP Center PPP Manual and Sector Guidelines published by PPP Center
Project Development and Monitoring Facility, PPP Strategic Fund
Strategic Fund was established to support Right- of-Way (ROW) acquisition
Airport, Expressway, school infrastructure
37 projects of Airport, railway, social infrastructure projects are ongoing (As of 10 July 2014)
Singapore Limited overall framework for PPP. Some policies set out in . PPP Handbook
No specific PPP laws
MOF has overall responsibility (but not specific to PPP)
PPP Handbook published by MOF
Limited government support, Refinancing guarantee provided on Sports Hub PPP (2010)
Compulsory acquisition is possible
Several in water and social infrastructure projects from mid-2000s to present
Limited (water and waste projects currently in procurement)
Thailand General policies to increase
PPP law-Private Investment in
PPP Committee in the key
No published
No developed regime
Government has the responsibility
Some transport projects
Being developed, but likely to
DRAFT
39
spending on infrastructure and develop PPP regime
State Undertaking Act 2013
agency for PPP supported by State Enterprise Policy Office
PPP Guidelines
for land acquisition
structured as BOT concessions
focus on transport 9esp. road and rail)
Viet Nam Policies to develop pilot PPP projects and establishment of Project Development Facility (PDF)
PPP Decree PPP Steering Committee and PPP office in Ministry of Planning and Investment
No published PPP Guidelines
Government guarantees have been provided on BOT power projects
Limited government support
Several BOT
projects in power sector
108 PPP projects with national and provincial priorities
Source: ERIA, ASEAN Public Private Partnership Guidelines (As of July 2014).
Note: Viet Nam updated by the Author.
40
References Asian Development Bank. 2015 Joint report on multilateral development banks ‘climate finance.