60
ANNUAL REPORT 2010 INVESTING UK ING UK Real Estate Income Trust Limited Annual Report & Consolidated Financial Statements For the year ended 31 December 2010
| Date post: | 09-May-2018 |
| Category: |
Documents |
| Upload: | doankhuong |
| View: | 216 times |
| Download: | 1 times |
ANNUAL REPORT 2010
INVESTING
UK
ING UK Real Estate Income Trust LimitedAnnual Report & Consolidated Financial StatementsFor the year ended 31 December 2010

ING UK REAL ESTATE INCOME TRUST LIMITED1
28 Austin Friars, London, EC2609 sq m multi-let office acquired in 2010. Refurbishment and re-letting of two floors.
ANNUAL REPORT 2
Contents
Executive Summary
Facts and Figures 4Chairman’s Statement 7Responsibility Statement 9
Manager’s Report Investment Manager’s Report 11Portfolio Analysis 16
Corporate GovernanceCorporate Governance Report 21Directors’ Report 27Company Information 29Independent Auditor’s Report 31
Financial StatementsConsolidated Statement of Comprehensive Income 33Consolidated Statement of Changes in Equity 34Consolidated Statement of Financial Position 35Consolidated Statement of Cash Flows 36Notes to the Consolidated Financial Statements 37
Front Cover: Unit 5320 Magna Park, Lutterworth, Leicestershire
EXEC
UTI
VE
SUM
MA
RY
FIN
AN
CIA
L ST
ATE
MEN
TSM
AN
AG
ER’S
REP
OR
TCO
RPO
RATE
GO
VER
NA
NCE

ING UK REAL ESTATE INCOME TRUST LIMITED3
EXEC
UTIV
E SUM
MA
RY
50 Farringdon Road, London, EC13,051 sq m office building. Substantial refurbishment just completed.
ANNUAL REPORT 4
Facts and Figures
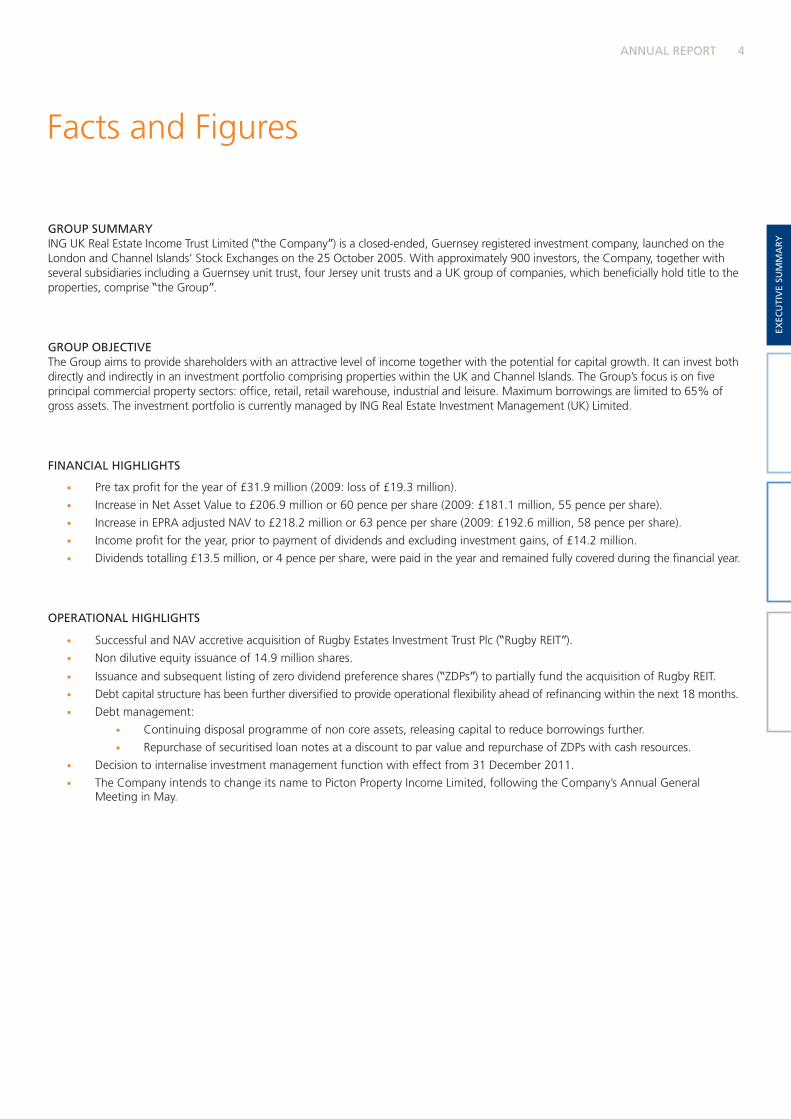
GROUP SUMMARYING UK Real Estate Income Trust Limited ( the Company ) is a closed-ended, Guernsey registered investment company, launched on the London and Channel Islands’ Stock Exchanges on the 25 October 2005. With approximately 900 investors, the Company, together with several subsidiaries including a Guernsey unit trust, four Jersey unit trusts and a UK group of companies, which beneficially hold title to the properties, comprise the Group .
GROUP OBJECTIVE The Group aims to provide shareholders with an attractive level of income together with the potential for capital growth. It can invest both directly and indirectly in an investment portfolio comprising properties within the UK and Channel Islands. The Group’s focus is on five principal commercial property sectors: office, retail, retail warehouse, industrial and leisure. Maximum borrowings are limited to 65% of gross assets. The investment portfolio is currently managed by ING Real Estate Investment Management (UK) Limited.
FINANCIAL HIGHLIGHTS
• Pre tax profit for the year of £31.9 million (2009: loss of £19.3 million).
• Increase in Net Asset Value to £206.9 million or 60 pence per share (2009: £181.1 million, 55 pence per share).
• Increase in EPRA adjusted NAV to £218.2 million or 63 pence per share (2009: £192.6 million, 58 pence per share).
• Income profit for the year, prior to payment of dividends and excluding investment gains, of £14.2 million.
• Dividends totalling £13.5 million, or 4 pence per share, were paid in the year and remained fully covered during the financial year.
OPERATIONAL HIGHLIGHTS
• Successful and NAV accretive acquisition of Rugby Estates Investment Trust Plc ( Rugby REIT ).
• Non dilutive equity issuance of 14.9 million shares.
• Issuance and subsequent listing of zero dividend preference shares ( ZDPs ) to partially fund the acquisition of Rugby REIT.
• Debt capital structure has been further diversified to provide operational flexibility ahead of refinancing within the next 18 months.
• Debt management:
• Continuing disposal programme of non core assets, releasing capital to reduce borrowings further.
• Repurchase of securitised loan notes at a discount to par value and repurchase of ZDPs with cash resources.
• Decision to internalise investment management function with effect from 31 December 2011.
• The Company intends to change its name to Picton Property Income Limited, following the Company’s Annual General Meeting in May.
EXEC
UTI
VE
SUM
MA
RY
ING UK REAL ESTATE INCOME TRUST LIMITED5
Facts and Figures
Year ended 31 December 2010 Year ended 31 December 2009
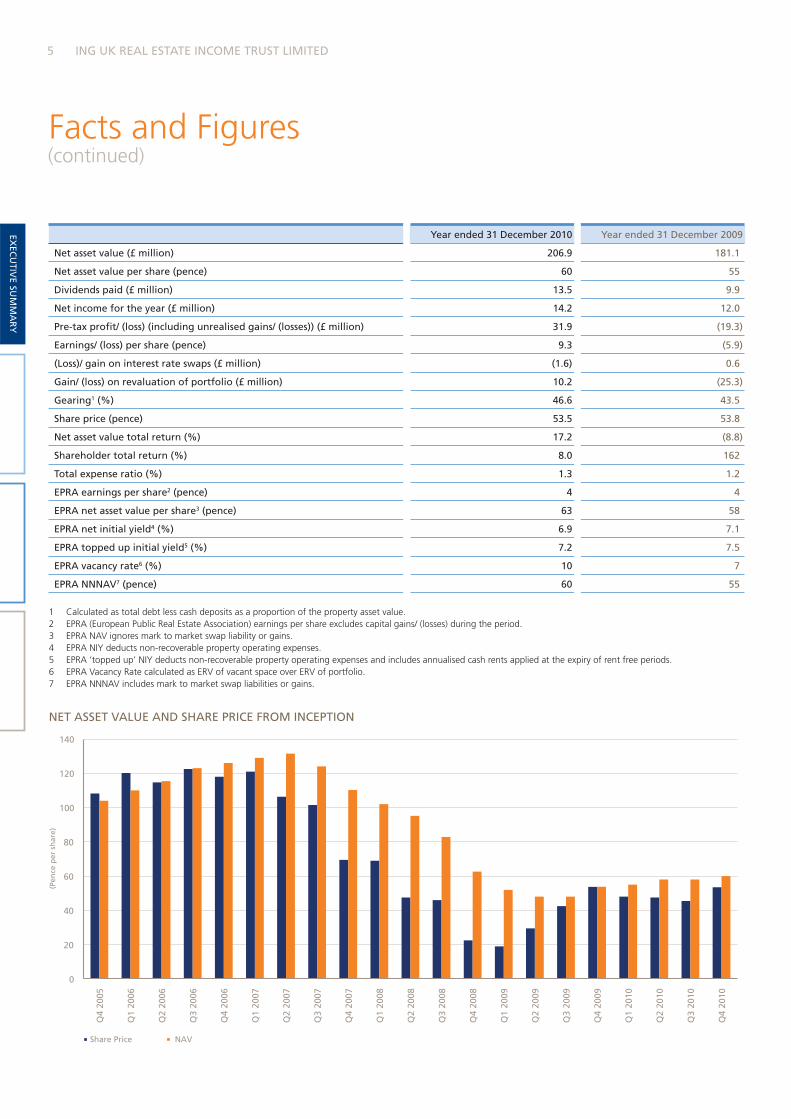
Net asset value (£ million) 206.9 181.1
Net asset value per share (pence) 60 55
Dividends paid (£ million) 13.5 9.9
Net income for the year (£ million) 14.2 12.0
Pre-tax profit/ (loss) (including unrealised gains/ (losses)) (£ million) 31.9 (19.3)
Earnings/ (loss) per share (pence) 9.3 (5.9)
(Loss)/ gain on interest rate swaps (£ million) (1.6) 0.6
Gain/ (loss) on revaluation of portfolio (£ million) 10.2 (25.3)
Gearing1 (%) 46.6 43.5
Share price (pence) 53.5 53.8
Net asset value total return (%) 17.2 (8.8)
Shareholder total return (%) 8.0 162
Total expense ratio (%) 1.3 1.2
EPRA earnings per share2 (pence) 4 4
EPRA net asset value per share3 (pence) 63 58
EPRA net initial yield4 (%) 6.9 7.1
EPRA topped up initial yield5 (%) 7.2 7.5
EPRA vacancy rate6 (%) 10 7
EPRA NNNAV7 (pence) 60 55
1 Calculated as total debt less cash deposits as a proportion of the property asset value.2 EPRA (European Public Real Estate Association) earnings per share excludes capital gains/ (losses) during the period.3 EPRA NAV ignores mark to market swap liability or gains.4 EPRA NIY deducts non-recoverable property operating expenses.5 EPRA ‘topped up’ NIY deducts non-recoverable property operating expenses and includes annualised cash rents applied at the expiry of rent free periods.6 EPRA Vacancy Rate calculated as ERV of vacant space over ERV of portfolio. 7 EPRA NNNAV includes mark to market swap liabilities or gains.
NET ASSET VALUE AND SHARE PRICE FROM INCEPTION
EXEC
UTIV
E SUM
MA
RY
0
20
40
60
80
100
120
140
Q4
2005
Q1
2006
Q2
2006
Q3
2006
Q4
2006
Q1
2007
Q2
2007
Q3
2007
Q4
2007
Q1
2008
Q2
2008
Q3
2008
Q4
2008
Q1
2009
Q2
2009
Q3
2009
Q4
2009
Q1
2010
Q2
2010
Q3
2010
Q4
2010
NAV Share Price
(Pen
ce p
er s
har
e)
(continued)

ANNUAL REPORT 6
EXEC
UTI
VE
SUM
MA
RY
Stanford House, Long Acre, London, WC21,688 sq m retail, office and residential property in the heart of Covent Garden. Acquired in 2010.
7 ING UK REAL ESTATE INCOME TRUST LIMITED
2010 was a strong year for the Company which also marked its fifth anniversary since its launch on the London and Channel Islands’ Stock Exchanges. It can be observed that against a backdrop of an improving property market, good progress has been made on a number of levels.
Over the year, the Company saw growth in Net Asset Value of 14% from £181.1 million to £206.9 million, reflecting the underlying improvement in asset values, equity issuance and the value accretive acquisition of Rugby Estates Investment Trust Plc (‘Rugby REIT’) in the first half of the year. The underlying EPRA adjusted Net Asset Value rose 13% from £192.6 million to £218.2 million.
The Company successfully issued 14.9 million shares over the course of the year on a non dilutive basis, despite continuing to trade at a discount to Net Asset Value.
The zero dividend preference shares, issued to part finance the Rugby REIT acquisition, achieved a listing on the London Stock Exchange at the end of 2010 and have the IREZ ticker. The accounts for IRET Securities Limited have also been issued as of today’s date.
The Company’s assets have continued to outperform the IPD benchmark over a three and five year time horizon as at 31 December 2010 and deliver an income return some 20% ahead of the market. The Company’s share price total return performance has also outperformed the UK EPRA index since inception.
Our aim is to ensure that the Company is the vehicle of choice for those investors seeking income biased exposure to the UK commercial property market. At present the Company is focused on three key initiatives which will help to achieve this.
Firstly, the management of the existing portfolio and maintenance of cashflow remains paramount. In 2010 the Company has delivered considerable success in this regard, restructuring a number of leases and maintaining income in a fragile occupier market.
Secondly, the Company is focused on achieving an optimal solution to the refinancing of its securitised facility that is due for renewal within the next 18 months. The Company is already progressing plans for this in conjunction with its advisors. The Company has a good track record of debt management having ensured that its securitised loan notes remained AAA rated during one of the most severe downturns on record. Whilst there is an overall desire to deleverage the structure, this is likely to occur as we move through the real estate cycle.
Thirdly, following a review during 2010, and after much consideration, the Board has made a decision to internalise the investment management function with effect from 1 January 2012. The internalisation is expected to deliver a number of potential benefits to the Company, including: an aligned management team structure focused solely on the Company’s interests, a significant cost saving over the short to medium term, anticipated to be in the region of £400,000 per annum which will further enhance the Company’s dividend cover, and the potential to attract a wider group of investors than it currently does as many major institutional investors will only invest in internally managed structures. Moreover, it is anticipated that the internalised structure will achieve one of the most efficient cost bases in the Guernsey registered real estate investment company sector. During 2011 the portfolio will continue to be managed by ING Real Estate Investment Management (UK) Limited in accordance with the existing contract.
Furthermore, we are pleased to have secured the services of Michael Morris, the current Fund Manager, who will lead the internalisation process and become Chief Executive of the Company’s Investment Management subsidiary in due course. This will ensure uninterrupted continuity of his involvement with the Company throughout 2011. He will be joined by Andrew Dewhirst who will become the Finance Director and be responsible for the Company’s financial control and reporting. The Investment Management subsidiary will be located in part of 28 Austin Friars, one of the Company’s smaller, multi let, City of London assets.
As a result of these changes, the Company intends to change its name to Picton Property Income Limited and create a wholly owned Investment Management subsidiary called Picton Capital Limited. The Company will ask for shareholder approval for the name change at the forthcoming AGM in May. We will continue to regularly update shareholders throughout the course of this year on any important matters as the internalisation progresses.
Finally there remains ‘fall out’ from the worst recorded property downturn in over 30 years. Whilst there has been a strengthening in asset values, this is in no way uniform across the market and, whilst scarce, there are still opportunities available to exploit for well capitalised companies with a proven track record.
Chairman’s Statement
EXEC
UTIV
E SUM
MA
RY

8ANNUAL REPORT
The Company remains alive to such opportunities and is continually looking at ways to enhance shareholder returns and improve both underlying Net Asset Value and Market Capitalisation.
The past year has been an extremely active year for the Company and significant strategic decisions have been taken both in enhancing the quality of its portfolio, financial position and the management of its affairs which places it in a strong position for the future.
Nicholas Thompson 4 April 2011
EXEC
UTI
VE
SUM
MA
RY

9 ING UK REAL ESTATE INCOME TRUST LIMITED
We confirm to the best of our knowledge:
(a) the Financial Statements, prepared in accordance with International Financial Reporting Standards, give a true and fair view of the assets, liabilities, financial position and profit or loss of the Company and the undertakings included in the consolidation taken as a whole as required by Disclosure and Transparency Rules (‘DTR’) 4.1.12 R; and
(b) the Investment Manager’s Report includes a fair review of development and performance of the business and the position of the Company and the undertakings included in the consolidation taken as a whole, together with a description of the principal risks and uncertainties they face as required by DTR 4.1.12 R.
By order of the Board
Nicholas Thompson 4 April 2011
Responsibility Statement
EXEC
UTIV
E SUM
MA
RY

10ANNUAL REPORT
EXEC
UTI
VE
SUM
MA
RY
Trident House, St Albans, Hertfordshire1,847 sq m town centre office. 1,070 sq m to be refurbished and marketed in 2011.
11 ING UK REAL ESTATE INCOME TRUST LIMITED
Investment Manager’s Report
MA
NA
GER
’S REPO
RT
ECONOMIC OVERVIEWThe UK economy continued to grow over the first three quarters of 2010 with the third quarter recording a 0.7% increase from the 1.1% in the preceding quarter. Despite expectations to the contrary, GDP fell by 0.5% in the fourth quarter, however GDP increased over 2010 by 1.3%, the first annual positive growth since 2007.
One of the primary concerns for continued recovery into 2011 is the increasing rate of CPI inflation, which stands at 4.4%. This rate has been largely driven by the increasing tax, fuel and commodity prices rather than from consumer spending pressures which has sparked much debate as to the MPC policy regarding interest rates, currently set at 0.5%. Market expectations are for rates to rise in May; however, it is arguable that an increase at this time could stifle economic growth prospects.
Ten year gilts and three and five year swap rates have recently seen a dip having broadly followed an upward trend since August 2010 and although still low by 2006-2007 standards they are currently echoing the tone set at the end of 2009. The cost of debt is therefore increasing in response to expected long term interest rate rises.
Despite the anticipated challenges over 2011, ING Financial Markets suggests a steady improvement in the recovery through 2011 and 2012, predicting GDP growth of 1.5% and 2.0% respectively.
PROPERTY MARKET OVERVIEWIn 2010, the market recorded capital growth of over 8% according to the IPD Annual Index, continuing the theme that the recovery in asset values since mid 2009 has predominately been capital markets led, with the occupational cycle subdued.
Whilst occupancy rates have been improving since the latter part of 2009, and stand at 90% up from their low of 87%, there is still some way to go before recovering to the long term average of 93%.
Rental value growth is now positive in some sectors, primarily in central London, but negative in the majority of other subsectors. The extent of the rental value declines has now passed its 2009 peak and is generally flat at present, recording -0.5% in the IPD Annual Index over 2010 compared to the -7.9% in the previous year.
Looking at the market in the broadest terms, one can see that there is a recovery in values, but at this stage it is not widespread. The recovery has not been consistent across the market and for certain types of assets, especially those with shorter term income profiles, the recovery in pricing has yet to happen.
Furthermore, the Investment Management Association quarterly property fund flow data shows that retail and institution fund flows have steadily decreased since the final quarter of 2009 and the outlook for 2011 is likely to be more income focused rather than driven by yield compression.
STRATEGYThe Group’s strategy is to become the vehicle of choice for investors seeking an income biased exposure to UK commercial real estate. This is achieved by investing in a diversified portfolio of assets and ensuring diversification of cashflow across over approximately 400 tenants.
The portfolio tends to consist of ‘value add’ type assets where the combination of lease restructuring, refurbishment or other active management initiatives to maximise underlying cashflow will provide opportunities for enhancement in asset values over the medium term.
Whilst the Group tends to limit the amount of trading of assets, not least by virtue of the significant friction costs of purchasing direct real estate, the Group has continued to dispose of non core assets and repay debt, following completion of asset management initiatives. Further details of these assets are detailed below.
UNDERLYING PERFORMANCEIn share price terms the Company began the year at 53.8 pence per share and maintained that level over the period with the share price closing at 53.5 pence per share on 31 December 2010.
This was despite an increase of 9.1% in the Net Asset Value per share during the period and consecutive increases in value over the four quarters. Net Asset Value rose from 55 pence per share as at 31 December 2009 to 60 pence per share as at 31 December 2010. The EPRA Net Asset Value also benefitted from an 8.6% increase from 58 pence per share to 63 pence per share. This measure ignores changes in the fair value of the interest rate swaps.
12ANNUAL REPORT
UNDERLYING PERFORMANCE (CONTINUED)The increase in property values and high dividend was the key driver of the increase in Net Asset Value. This was supported by the acquisition of the Rugby REIT portfolio, the positive effect of gearing and also active management initiatives undertaken.
The Group continued to out-perform the IPD benchmark over both the three and five year periods by 0.7% and 0.9% respectively as at 31 December 2010. With respect to underlying performance, the twelve months to 31 December 2010 saw a total return of 12.5% compared to the benchmark of 15.1%, largely due to the Group being underweight in the Shopping Centre and Central London Office sectors.
The Group is income focused and has generated income returns of 7.3%, 7.5% and 7.0% over one, three and five years. Relatively, these returns are on average 21% in excess of the benchmark return.
2010 REVIEW2010 remained very much occupier focused in what has generally been a fragile market. In terms of activity, the Group completed 30 lettings, 15 lease renewals or lease restructurings and 12 rent reviews.
As highlighted in the Half Yearly financial report the most significant event over the period was the acquisition of Rugby Estates Investment Trust Plc (‘Rugby REIT’). At a time when the property market was constrained by a limited supply of stock and strong demand, the Company was able to source an attractive portfolio of assets with existing finance in place. The pricing of the acquisition, at a significant discount to Rugby REIT’s stated IFRS Net Asset Value, was one of the principal drivers of capital growth during the period. In addition, as this was a corporate acquisition, it enabled the Group to purchase a portfolio of assets in a financially efficient manner.
Capital growth over the preceding 12 months, which was relatively muted, reflects the current market polarisation between longer term income and that of a shorter duration. Over the medium term, we believe there is embedded value within the portfolio, where current external ‘market’ valuation, remains some 10% lower than the most recent estimate of cost of construction of the assets, before allowing for land costs also.
As at 31 December 2010, the annualised rental income was £31.2 million. It is expected that this will rise to £31.9 million per annum by the end of 2011 following expiries of rent free periods and fixed rental uplifts. The reversionary rental income for the portfolio is £34.9 million per annum, which will be primarily achieved through the letting of vacant accommodation. The net initial yield of the property portfolio is 6.9%.
The most significant transactions undertaken during the year are detailed below.
OFFICESThe Group’s exposure to the office sector represents 34.2% of the portfolio by value.
As at 31 December the Group held 22 office assets, with a value of £145.7 million, reflecting a capital value of approximately £159 per sq ft. The office portfolio is leased to 175 tenants and had an occupancy rate of 84% at 31 December 2010.
The most significant transaction over the period was at 50 Farringdon Road, London EC1, where we undertook a lease surrender in April, for a premium in excess of £4 million, ahead of a tenant break option in September 2010. A significant refurbishment programme has been undertaken and the property has just started to be marketed with positive occupier interest.
At Austin Friars, London EC2, acquired as part of the Rugby REIT transaction, we have let two floors in two separate transactions at rental levels some 30% ahead of our original estimates at the time of purchase. This reflects not only an underlying improvement in this core central London market but also a refurbishment of the accommodation.
At our business park in Colchester, four new lettings were achieved in some of the smaller suites adding £90,000 per annum of income. In a separate transaction we negotiated out a break clause, due in 2012, by offering a short term rent free period thereby securing income maturity to 2017 and also enhancing asset value. The rental income was £202,000 per annum.
In the final quarter, in Milton Keynes, following a tenant exercising a break option on a suite of offices, we simultaneously agreed a back to back letting for 50% of the space, with the remainder currently being marketed. This letting has set a new headline rental level for the building.
MA
NA
GER
’S R
EPO
RT
13 ING UK REAL ESTATE INCOME TRUST LIMITED
INDUSTRIALThe Group’s exposure to the industrial sector is 34.2%. This comprises five distribution warehouses and 20 multi-let industrial estates. The industrial portfolio is leased to 130 tenants and had an occupancy rate of 92%.
As at 31 December the Group held 25 industrial assets with a value of £145.4 million reflecting a capital value of £65 per sq ft.
In Harlow, we have moved an existing tenant into larger premises and refurbished the two small units they vacated. Following the year end we have let one of the smaller units and have good interest in the remainder. These transactions add £110,000 per annum and £56,000 per annum respectively to the rental income.
At another unit, following a tenant going into liquidation in 2009, we negotiated a financial settlement with guarantors for over £540,000. These monies have been in part used to refurbish the unit, which is shortly to finish, ahead of formal marketing.
In Colchester we negotiated the removal of a break clause due in 2012, by offering a short term rent free period thereby securing income maturity to 2022 and enhancing asset value. The rental income here was £148,000 per annum.
In respect of the Rugby assets acquired, we regeared one of the leases at Datapoint Business Centre, London E16 in line with estimated rental value at the time of purchase, securing £59,750 per annum and undertook five lease renewals and lettings in Epsom, thereby securing a further £97,550 per annum of income.
RETAILThe Group’s retail exposure totals 27.1% which is split between high street retail and retail warehousing representing 19.9% and 7.2% of the total portfolio respectively.
As at 31 December, the Group held 20 retail assets with a value of £115.1 million. The retail portfolio is leased to 81 tenants and had an occupancy rate of 97%.
At our retail warehouse park in Swansea, full occupancy was achieved following the Administration and CVA of Roseby and JJB respectively, last year. Two lettings to value retailers, Home Bargains and Poundland, have added £160,000 per annum to the net rental income position.
In Stockport we agreed a letting to The Entertainer securing £80,000 per annum on a ten year lease. In Kings Heath, Birmingham, by sub dividing a unit vacated in 2009, we secured two lettings at rents rising to in excess of £120,000 per annum, a figure ahead of the previous passing rent.
In Guildford, a simultaneous surrender and re-letting of a retail unit, enabled the Group to set one of the highest rental levels in the town, with a letting to Toast, the fashion and homeware brand, proving that ‘life’ does exist on the High Street.
LEISUREAs at 31 December the Group held three leisure assets, with a value of £19.3 million. The leisure portfolio is leased to ten tenants and had an occupancy rate of 96%.
The most significant transaction over the period was the settlement of a rent review on the Crown and Mitre hotel in Carlisle, which achieved a 30% uplift, or £26,000 per annum increase. The settlement that was finally reached after the year end relates to a 2008 review. Following this, the Group’s exposure to the leisure sector represents 4.5% of the portfolio by value.
ACQUISITIONS AND DISPOSALSThe Company is continuing its strategy of selling smaller non core assets, whilst at the same time looking to recycle capital into more attractive propositions.
The acquisition activity of 2010 focused around the takeover of Rugby REIT and the 33 assets owned within the structure.
In terms of disposal activity, the Group made seven disposals, for a total consideration of £11.9 million and a further four disposals have completed or exchanged contracts following the year end for a combined consideration of £2.1 million. The combined proceeds of the disposals achieved in 2010 was some 14.5% ahead of their preceding valuation.
Of the disposals last year, three were sold vacant and two were sold to special purchasers.
(continued)
MA
NA
GER
’S REPO
RT
Investment Manager’s Report
14ANNUAL REPORT
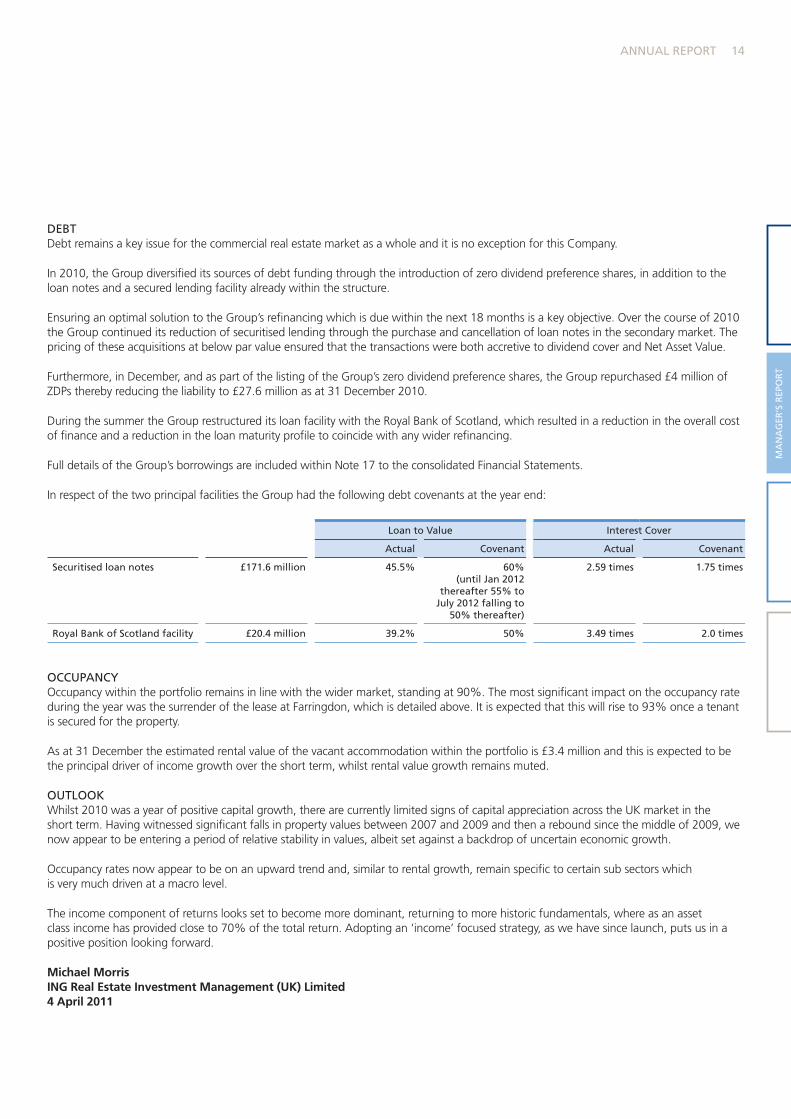
DEBTDebt remains a key issue for the commercial real estate market as a whole and it is no exception for this Company.
In 2010, the Group diversified its sources of debt funding through the introduction of zero dividend preference shares, in addition to the loan notes and a secured lending facility already within the structure.
Ensuring an optimal solution to the Group’s refinancing which is due within the next 18 months is a key objective. Over the course of 2010 the Group continued its reduction of securitised lending through the purchase and cancellation of loan notes in the secondary market. The pricing of these acquisitions at below par value ensured that the transactions were both accretive to dividend cover and Net Asset Value.
Furthermore, in December, and as part of the listing of the Group’s zero dividend preference shares, the Group repurchased £4 million of ZDPs thereby reducing the liability to £27.6 million as at 31 December 2010.
During the summer the Group restructured its loan facility with the Royal Bank of Scotland, which resulted in a reduction in the overall cost of finance and a reduction in the loan maturity profile to coincide with any wider refinancing.
Full details of the Group’s borrowings are included within Note 17 to the consolidated Financial Statements.
In respect of the two principal facilities the Group had the following debt covenants at the year end:
Loan to Value Interest Cover
Actual Covenant Actual Covenant
Securitised loan notes £171.6 million 45.5% 60% (until Jan 2012
thereafter 55% to July 2012 falling to
50% thereafter)
2.59 times 1.75 times
Royal Bank of Scotland facility £20.4 million 39.2% 50% 3.49 times 2.0 times
OCCUPANCYOccupancy within the portfolio remains in line with the wider market, standing at 90%. The most significant impact on the occupancy rate during the year was the surrender of the lease at Farringdon, which is detailed above. It is expected that this will rise to 93% once a tenant is secured for the property.
As at 31 December the estimated rental value of the vacant accommodation within the portfolio is £3.4 million and this is expected to be the principal driver of income growth over the short term, whilst rental value growth remains muted.
OUTLOOKWhilst 2010 was a year of positive capital growth, there are currently limited signs of capital appreciation across the UK market in the short term. Having witnessed significant falls in property values between 2007 and 2009 and then a rebound since the middle of 2009, we now appear to be entering a period of relative stability in values, albeit set against a backdrop of uncertain economic growth.
Occupancy rates now appear to be on an upward trend and, similar to rental growth, remain specific to certain sub sectors which is very much driven at a macro level.
The income component of returns looks set to become more dominant, returning to more historic fundamentals, where as an asset class income has provided close to 70% of the total return. Adopting an ‘income’ focused strategy, as we have since launch, puts us in a positive position looking forward.
Michael Morris ING Real Estate Investment Management (UK) Limited 4 April 2011
MA
NA
GER
’S R
EPO
RT

15 ING UK REAL ESTATE INCOME TRUST LIMITED
MA
NA
GER
’S REPO
RT
Parc Tawe, Link Road, Swansea10,843 sq m retail warehouse scheme. Now fully occupied after two lettings in 2010.
16ANNUAL REPORT
MA
NA
GER
’S R
EPO
RT
Portfolio Analysis
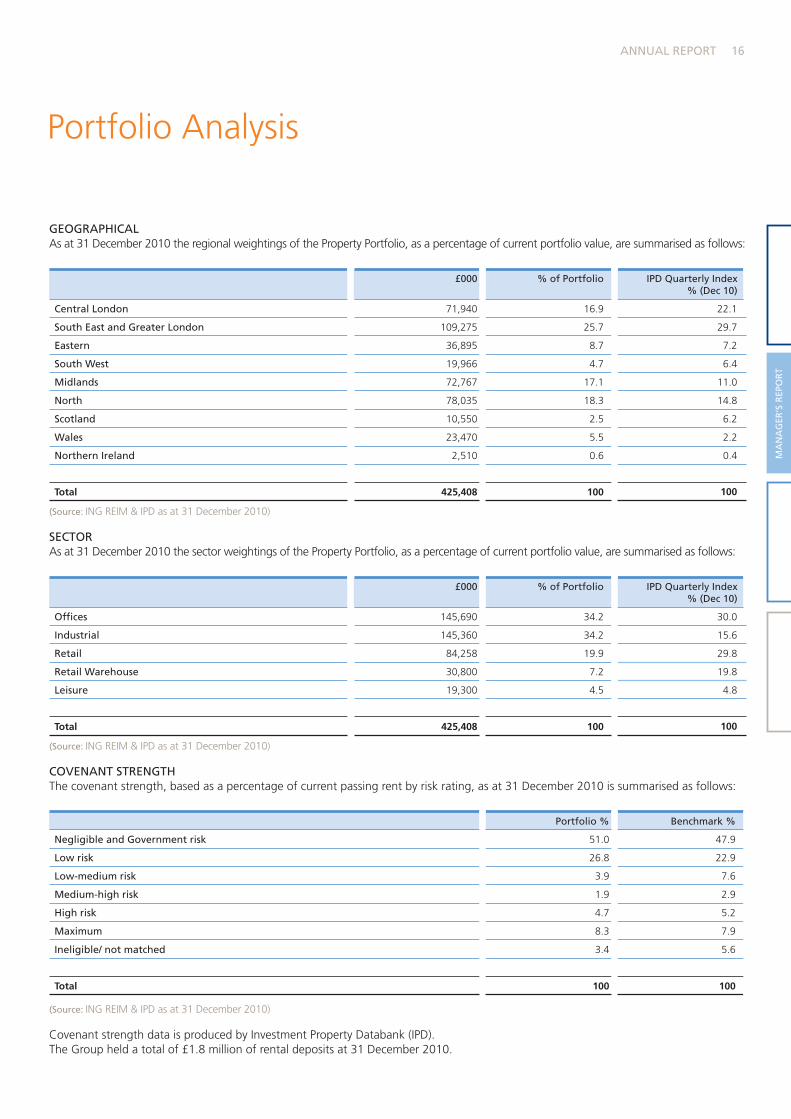
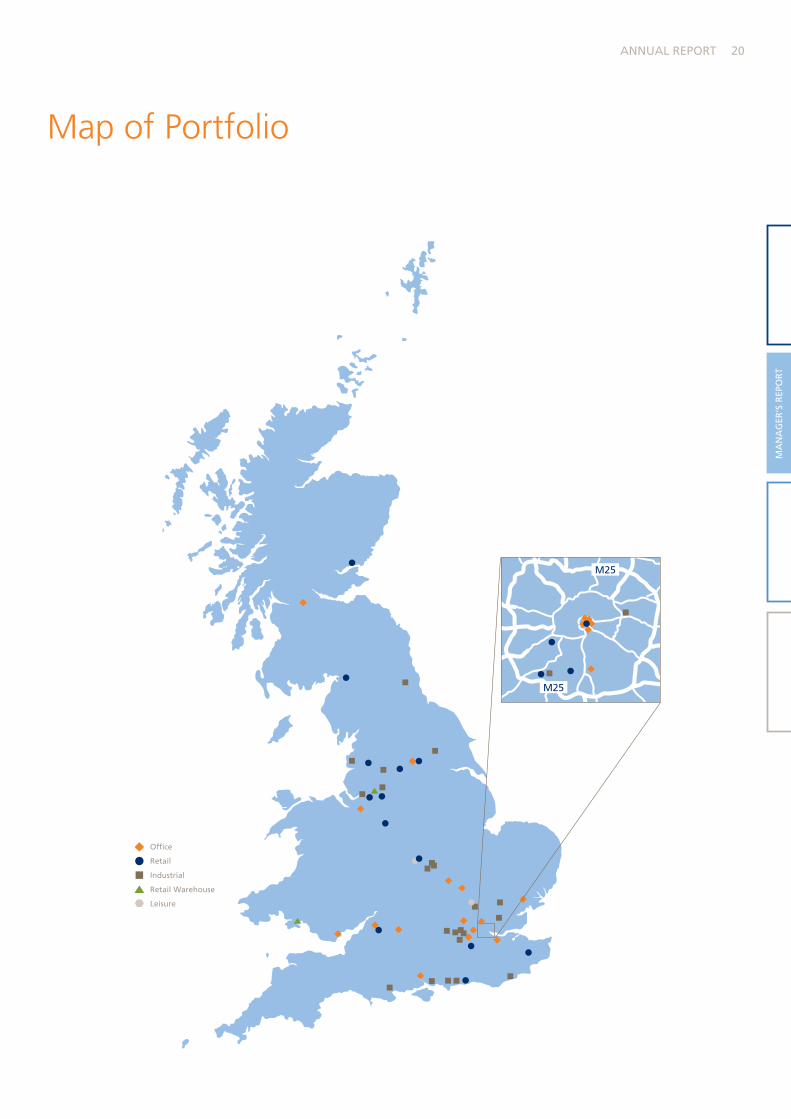
GEOGRAPHICALAs at 31 December 2010 the regional weightings of the Property Portfolio, as a percentage of current portfolio value, are summarised as follows:
£000 % of Portfolio IPD Quarterly Index % (Dec 10)
Central London 71,940 16.9 22.1
South East and Greater London 109,275 25.7 29.7
Eastern 36,895 8.7 7.2
South West 19,966 4.7 6.4
Midlands 72,767 17.1 11.0
North 78,035 18.3 14.8
Scotland 10,550 2.5 6.2
Wales 23,470 5.5 2.2
Northern Ireland 2,510 0.6 0.4
Total 425,408 100 100
(Source: ING REIM & IPD as at 31 December 2010)
SECTORAs at 31 December 2010 the sector weightings of the Property Portfolio, as a percentage of current portfolio value, are summarised as follows:
£000 % of Portfolio IPD Quarterly Index % (Dec 10)
Offices 145,690 34.2 30.0
Industrial 145,360 34.2 15.6
Retail 84,258 19.9 29.8
Retail Warehouse 30,800 7.2 19.8
Leisure 19,300 4.5 4.8
Total 425,408 100 100
(Source: ING REIM & IPD as at 31 December 2010)
COVENANT STRENGTHThe covenant strength, based as a percentage of current passing rent by risk rating, as at 31 December 2010 is summarised as follows:
Portfolio % Benchmark %
Negligible and Government risk 51.0 47.9
Low risk 26.8 22.9
Low-medium risk 3.9 7.6
Medium-high risk 1.9 2.9
High risk 4.7 5.2
Maximum 8.3 7.9
Ineligible/ not matched 3.4 5.6
Total 100 100
(Source: ING REIM & IPD as at 31 December 2010)
Covenant strength data is produced by Investment Property Databank (IPD). The Group held a total of £1.8 million of rental deposits at 31 December 2010.

17 ING UK REAL ESTATE INCOME TRUST LIMITED
MA
NA
GER
’S REPO
RT
Portfolio Analysis(continued)
LONGEVITY OF INCOMEAs at 31 December 2010, based as a percentage of current net annual rent, the length of the leases to the first termination is summarised as follows:
Years £000 %
Up to 5 years 14,582 46.8
5 to 10 years 10,443 33.5
10 to 15 years 2,958 9.5
15 to 25 years 2,275 7.3
25 years and over 909 2.9
Total 31,167 100
(Source: ING REIM as at 31 December 2010)
TOP TEN TENANTSThe top ten tenants, based as a percentage of current passing rent, as at 31 December 2010 is summarised as follows:
Tenant % of Passing Rent
TNT UK Ltd 9.1
Cadence Design Systems Ltd 3.1
Tanfield Group Plc 2.7
Menzies Hotels Property No.20 Ltd 2.7
Exel UK Ltd 2.7
BT Telecommunications Plc 2.5
Edward Stanford Ltd 2.1
Asda Stores Ltd 1.9
Amcor Packaging UK Ltd 1.7
RHM Group Ltd 1.5
Total 30
(Source: ING REIM as at 31 December 2010)
18ANNUAL REPORT
MA
NA
GER
’S R
EPO
RT
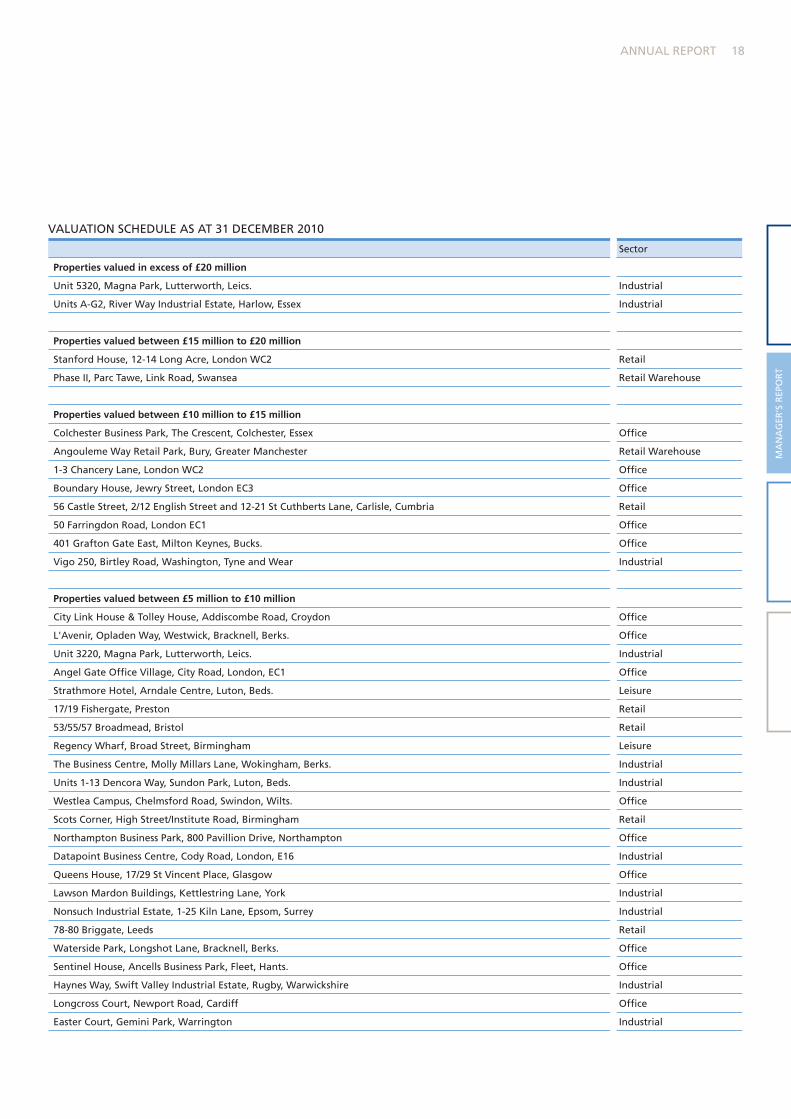
VALUATION SCHEDULE AS AT 31 DECEMBER 2010
Sector
Properties valued in excess of £20 million
Unit 5320, Magna Park, Lutterworth, Leics. Industrial
Units A-G2, River Way Industrial Estate, Harlow, Essex Industrial
Properties valued between £15 million to £20 million
Stanford House, 12-14 Long Acre, London WC2 Retail
Phase II, Parc Tawe, Link Road, Swansea Retail Warehouse
Properties valued between £10 million to £15 million
Colchester Business Park, The Crescent, Colchester, Essex Office
Angouleme Way Retail Park, Bury, Greater Manchester Retail Warehouse
1-3 Chancery Lane, London WC2 Office
Boundary House, Jewry Street, London EC3 Office
56 Castle Street, 2/12 English Street and 12-21 St Cuthberts Lane, Carlisle, Cumbria Retail
50 Farringdon Road, London EC1 Office
401 Grafton Gate East, Milton Keynes, Bucks. Office
Vigo 250, Birtley Road, Washington, Tyne and Wear Industrial
Properties valued between £5 million to £10 million
City Link House & Tolley House, Addiscombe Road, Croydon Office
L'Avenir, Opladen Way, Westwick, Bracknell, Berks. Office
Unit 3220, Magna Park, Lutterworth, Leics. Industrial
Angel Gate Office Village, City Road, London, EC1 Office
Strathmore Hotel, Arndale Centre, Luton, Beds. Leisure
17/19 Fishergate, Preston Retail
53/55/57 Broadmead, Bristol Retail
Regency Wharf, Broad Street, Birmingham Leisure
The Business Centre, Molly Millars Lane, Wokingham, Berks. Industrial
Units 1-13 Dencora Way, Sundon Park, Luton, Beds. Industrial
Westlea Campus, Chelmsford Road, Swindon, Wilts. Office
Scots Corner, High Street/Institute Road, Birmingham Retail
Northampton Business Park, 800 Pavillion Drive, Northampton Office
Datapoint Business Centre, Cody Road, London, E16 Industrial
Queens House, 17/29 St Vincent Place, Glasgow Office
Lawson Mardon Buildings, Kettlestring Lane, York Industrial
Nonsuch Industrial Estate, 1-25 Kiln Lane, Epsom, Surrey Industrial
78-80 Briggate, Leeds Retail
Waterside Park, Longshot Lane, Bracknell, Berks. Office
Sentinel House, Ancells Business Park, Fleet, Hants. Office
Haynes Way, Swift Valley Industrial Estate, Rugby, Warwickshire Industrial
Longcross Court, Newport Road, Cardiff Office
Easter Court, Gemini Park, Warrington Industrial
19 ING UK REAL ESTATE INCOME TRUST LIMITED
Portfolio Analysis(continued)
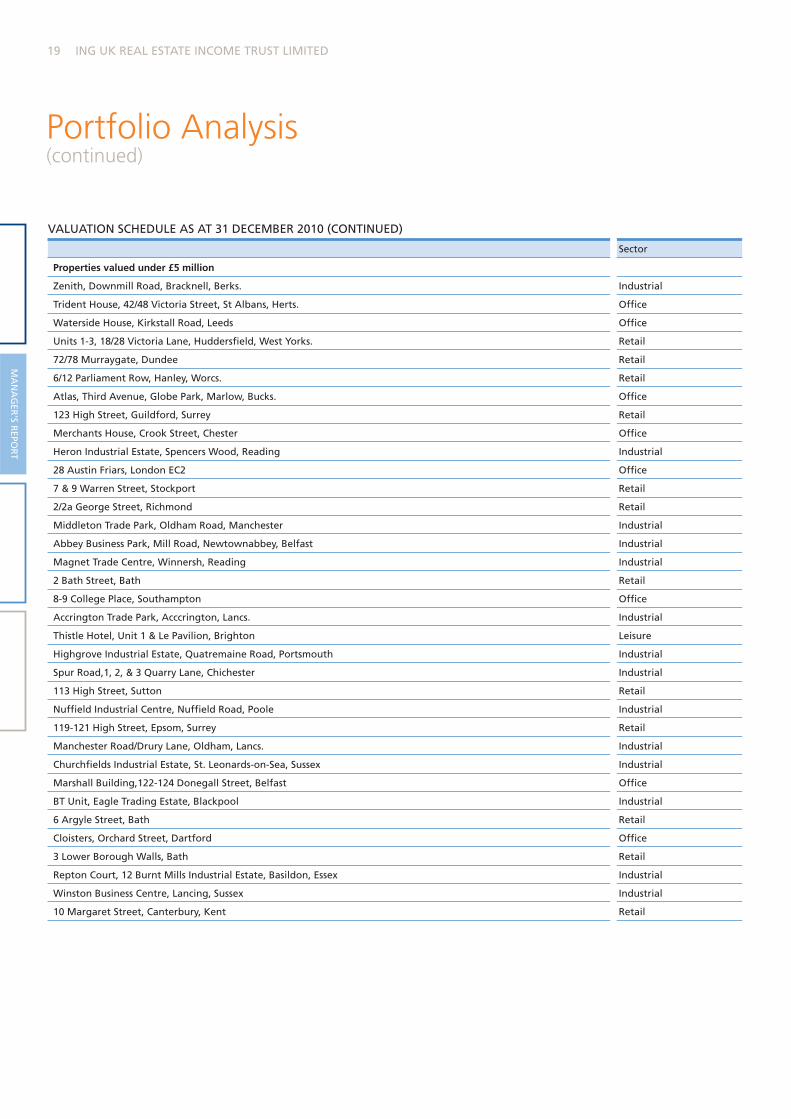
VALUATION SCHEDULE AS AT 31 DECEMBER 2010 (CONTINUED)
Sector
Properties valued under £5 million
Zenith, Downmill Road, Bracknell, Berks. Industrial
Trident House, 42/48 Victoria Street, St Albans, Herts. Office
Waterside House, Kirkstall Road, Leeds Office
Units 1-3, 18/28 Victoria Lane, Huddersfield, West Yorks. Retail
72/78 Murraygate, Dundee Retail
6/12 Parliament Row, Hanley, Worcs. Retail
Atlas, Third Avenue, Globe Park, Marlow, Bucks. Office
123 High Street, Guildford, Surrey Retail
Merchants House, Crook Street, Chester Office
Heron Industrial Estate, Spencers Wood, Reading Industrial
28 Austin Friars, London EC2 Office
7 & 9 Warren Street, Stockport Retail
2/2a George Street, Richmond Retail
Middleton Trade Park, Oldham Road, Manchester Industrial
Abbey Business Park, Mill Road, Newtownabbey, Belfast Industrial
Magnet Trade Centre, Winnersh, Reading Industrial
2 Bath Street, Bath Retail
8-9 College Place, Southampton Office
Accrington Trade Park, Acccrington, Lancs. Industrial
Thistle Hotel, Unit 1 & Le Pavilion, Brighton Leisure
Highgrove Industrial Estate, Quatremaine Road, Portsmouth Industrial
Spur Road,1, 2, & 3 Quarry Lane, Chichester Industrial
113 High Street, Sutton Retail
Nuffield Industrial Centre, Nuffield Road, Poole Industrial
119-121 High Street, Epsom, Surrey Retail
Manchester Road/Drury Lane, Oldham, Lancs. Industrial
Churchfields Industrial Estate, St. Leonards-on-Sea, Sussex Industrial
Marshall Building,122-124 Donegall Street, Belfast Office
BT Unit, Eagle Trading Estate, Blackpool Industrial
6 Argyle Street, Bath Retail
Cloisters, Orchard Street, Dartford Office
3 Lower Borough Walls, Bath Retail
Repton Court, 12 Burnt Mills Industrial Estate, Basildon, Essex Industrial
Winston Business Centre, Lancing, Sussex Industrial
10 Margaret Street, Canterbury, Kent Retail
MA
NA
GER
’S REPO
RT
20ANNUAL REPORT
Map of Portfolio
Office
Retail
Industrial
Retail Warehouse
Leisure
M25
M25
MA
NA
GER
’S R
EPO
RT

21 ING UK REAL ESTATE INCOME TRUST LIMITED
CORPO
RATE G
OV
ERNA
NCE
Corporate Governance Report
THE COMBINED CODEThe Board notes the consultation on the proposed Guernsey Code of Corporate Governance.
Following the changes in the UK listing regime that became effective in April 2010, it is now mandatory for Companies with a premium listing to follow the principles and comply with the provisions of the revised Combined Code on Corporate Governance (“the Code”) which was issued in 2008 by the Financial Reporting Council. The Board also notes that for accounting periods beginning on or after 29 June 2010 the Board will be required to report against the principles and recommendations of The UK Corporate Governance Code issued by the Financial Reporting Council in June 2010. It is the intention of the Board that the Company will comply with those provisions throughout the year to 31 December 2011.
The Directors believe that the Group has complied with the provisions of the Code where appropriate, and that it has complied throughout the year with the provisions where the requirements are of a continuing nature, except that a separate Nominations Committee has not been established. These duties are performed by the Board for practical reasons. Board members are nominated by a quorum of the Board, being a minimum of two Directors. The number of Directors shall be not less than two nor more than ten. At no time shall a majority of Directors be resident in the United Kingdom. In addition a Senior Independent Director has not been appointed given that the majority of the Directors are considered to be independent.
THE BOARDThe Board meets regularly, normally quarterly, and more frequently if necessary, and retains full responsibility for the direction and control of the Company. Details of the Board including biographies can be found at the end of the Directors’ Report. Roger Lewis was appointed to the Board on 31 March 2010.
The Company is led and controlled by a Board comprising of non-executive Directors, all of whom have wide experience and four of whom were considered to be independent during the year. Tjeerd Borstlap is not considered to be independent due to being an employee of ING Real Estate Investment Management. Notwithstanding Trevor Ash’s directorship of ING Global Real Estate Securities Limited, the Board considers him to be independent in character and judgement and does not believe that there are any relationships or circumstances which are likely to affect, or could appear to affect, his judgement.
The Board believes that it is in the shareholders’ best interests for the Chairman to be the point of contact for all matters relating to the governance of the Company and as such has not appointed a senior independent non-executive Director for the purposes of the Code. The appointment of Directors is considered by the Board as a whole. The Articles of Association stipulate that all new Directors shall retire at their first Annual General Meeting and offer themselves for re-appointment. One third, or the number nearest to but not exceeding one third, of the Directors shall retire and offer themselves for re-appointment at each subsequent Annual General Meeting.
The performance of the Board is evaluated on an annual basis. An independent evaluation of the Board was carried out by Trust Associates in August 2010 which confirmed that the performance of all Directors continues to be effective and that they have demonstrated commitment to their roles. The report commented ‘...that this is a very strong-minded and independent Board, fully aware of and focused on the interest of shareholders, with an excellent culture of co-operation and mutual support.’
The Board is responsible for establishing, maintaining and monitoring the effectiveness of the Group’s system of internal, financial and other controls. The internal financial controls operated by the Board include the authorisation of the investment strategy and regular reviews of the financial results and investment performance. The system of internal financial controls can provide only reasonable and not absolute assurance against material misstatement or loss.
The Board has contractually delegated to ING Real Estate Investment Management (UK) Limited the investment management of the Group’s properties and Northern Trust International Fund Administration Services (Guernsey) Limited is contracted to provide the Company’s administration, registrar and secretarial functions. The Board reviews regularly the performance of the services provided by these companies. During the year the contract with the Investment Manager was amended to include a quarterly fee payable on the zero dividend preference shares that were issued in part consideration for the Rugby REIT acquisition. This is detailed further in note 6 to the Financial Statements.
During 2010 the Board undertook a very thorough evaluation of all the options available to the Company in the management of its affairs. As a result the Board decided that the investment management function should be undertaken by adopting an internalised structure and consequently that ING Real Estate Investment Management (UK) Limited’s contract should be terminated. Notice to this effect was served with effect from 31 December 2010 and the contract will terminate in December 2011. In the meantime all the terms and conditions will be in force to ensure the continued effective management of the portfolio.
22ANNUAL REPORT
CORP
ORA
TE G
OV
ERN
AN
CE
The Company maintains Directors’ and Officers’ liability insurance which provides insurance cover for the Directors against certain personal liabilities which they may incur by reason of their duties as Directors.
The Company has a procedure whereby the Board is entitled to obtain independent advice where relevant.
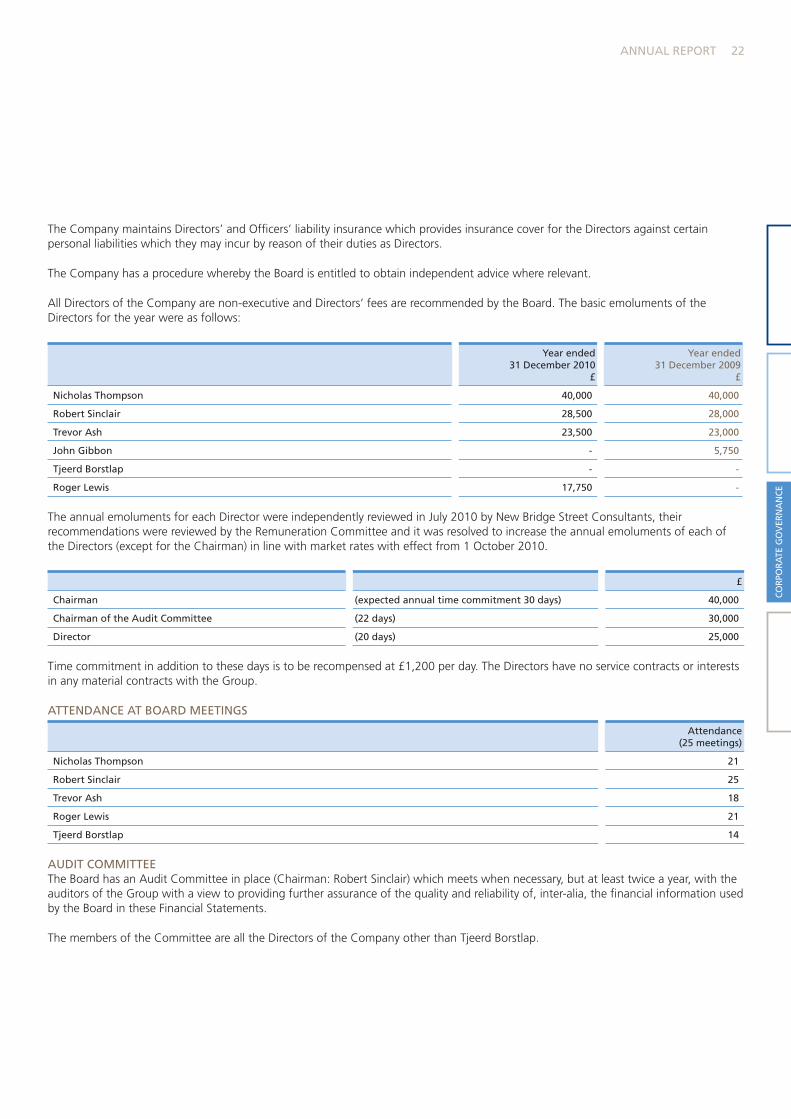
All Directors of the Company are non-executive and Directors’ fees are recommended by the Board. The basic emoluments of the Directors for the year were as follows:
Year ended 31 December 2010
£
Year ended 31 December 2009
£
Nicholas Thompson 40,000 40,000
Robert Sinclair 28,500 28,000
Trevor Ash 23,500 23,000
John Gibbon - 5,750
Tjeerd Borstlap - -
Roger Lewis 17,750 -
The annual emoluments for each Director were independently reviewed in July 2010 by New Bridge Street Consultants, their recommendations were reviewed by the Remuneration Committee and it was resolved to increase the annual emoluments of each of the Directors (except for the Chairman) in line with market rates with effect from 1 October 2010.
£
Chairman (expected annual time commitment 30 days) 40,000
Chairman of the Audit Committee (22 days) 30,000
Director (20 days) 25,000
Time commitment in addition to these days is to be recompensed at £1,200 per day. The Directors have no service contracts or interests in any material contracts with the Group.
ATTENDANCE AT BOARD MEETINGS
Attendance(25 meetings)
Nicholas Thompson 21
Robert Sinclair 25
Trevor Ash 18
Roger Lewis 21
Tjeerd Borstlap 14
AUDIT COMMITTEEThe Board has an Audit Committee in place (Chairman: Robert Sinclair) which meets when necessary, but at least twice a year, with the auditors of the Group with a view to providing further assurance of the quality and reliability of, inter-alia, the financial information used by the Board in these Financial Statements.
The members of the Committee are all the Directors of the Company other than Tjeerd Borstlap.
23 ING UK REAL ESTATE INCOME TRUST LIMITED
CORPO
RATE G
OV
ERNA
NCE
Corporate Governance Report
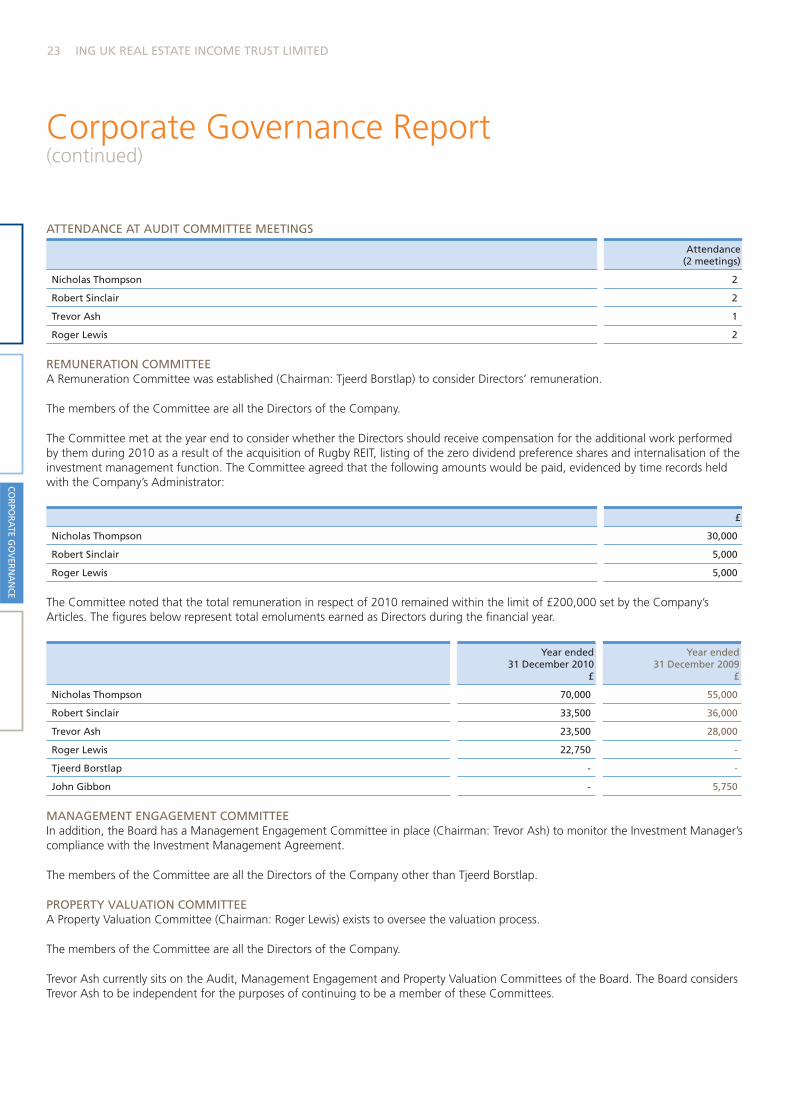
ATTENDANCE AT AUDIT COMMITTEE MEETINGS
Attendance(2 meetings)
Nicholas Thompson 2
Robert Sinclair 2
Trevor Ash 1
Roger Lewis 2
REMUNERATION COMMITTEEA Remuneration Committee was established (Chairman: Tjeerd Borstlap) to consider Directors’ remuneration.
The members of the Committee are all the Directors of the Company.
The Committee met at the year end to consider whether the Directors should receive compensation for the additional work performed by them during 2010 as a result of the acquisition of Rugby REIT, listing of the zero dividend preference shares and internalisation of the investment management function. The Committee agreed that the following amounts would be paid, evidenced by time records held with the Company’s Administrator:
£
Nicholas Thompson 30,000
Robert Sinclair 5,000
Roger Lewis 5,000
The Committee noted that the total remuneration in respect of 2010 remained within the limit of £200,000 set by the Company’s Articles. The figures below represent total emoluments earned as Directors during the financial year.
Year ended 31 December 2010
£
Year ended 31 December 2009
£
Nicholas Thompson 70,000 55,000
Robert Sinclair 33,500 36,000
Trevor Ash 23,500 28,000
Roger Lewis 22,750 -
Tjeerd Borstlap - -
John Gibbon - 5,750
MANAGEMENT ENGAGEMENT COMMITTEEIn addition, the Board has a Management Engagement Committee in place (Chairman: Trevor Ash) to monitor the Investment Manager’s compliance with the Investment Management Agreement.
The members of the Committee are all the Directors of the Company other than Tjeerd Borstlap.
PROPERTY VALUATION COMMITTEEA Property Valuation Committee (Chairman: Roger Lewis) exists to oversee the valuation process.
The members of the Committee are all the Directors of the Company.
Trevor Ash currently sits on the Audit, Management Engagement and Property Valuation Committees of the Board. The Board considers Trevor Ash to be independent for the purposes of continuing to be a member of these Committees.
(continued)
24ANNUAL REPORT
CORP
ORA
TE G
OV
ERN
AN
CE
RELATIONS WITH SHAREHOLDERSIn conjunction with the Board, the Administrator keeps under review the register of members of the Company. All shareholders are encouraged to participate in the Company’s Annual General Meeting. All Directors normally attend the Annual General Meeting, at which shareholders have the opportunity to ask questions and discuss matters with the Directors and the Investment Manager. Investors are able to direct any questions for the Board via the Secretary.
The Chairman regularly attends analyst meetings and roadshows to meet investors. The outcome of these meetings is communicated to the rest of the Board at Board meetings.
It is recognised that the Code requires notice of Annual General Meetings to be dispatched at least 20 working days before the meeting.
ACCOUNTABILITY AND AUDITDIRECTORS’ RESPONSIBILITIES IN RELATION TO THE FINANCIAL STATEMENTSThe Directors have responsibility for ensuring that the Group keeps accounting records which disclose with reasonable accuracy at any time the financial position of the Group and which enables them to ensure that the Financial Statements comply with the Companies (Guernsey) Law, 2008. They have general responsibility for taking such steps as are reasonably open to them to safeguard the assets of the Group and to prevent and detect fraud and other irregularities.
STATEMENT OF GOING CONCERNAfter due consideration, the Directors consider that the Group has adequate resources to continue in operational existence for the foreseeable future and adopt the going concern basis in preparing the Financial Statements.
INTERNAL CONTROLThe Directors acknowledge that they are responsible for establishing and maintaining the Group’s system of internal controls and reviewing its effectiveness. Internal control systems are designed to manage rather than eliminate the failure to achieve business objectives and can only provide reasonable and not absolute assurance against material misstatement or loss. They have therefore established an ongoing process designed to meet the particular needs of the Group in managing the risks to which it is exposed consistent with the guidance provided by the Turnbull Committee. Such review procedures have been in place throughout the full financial year and up to the date of the approval of the Financial Statements and the Board is satisfied with their effectiveness.
This process involves a review by the Board of the control environment within the Group’s service providers to ensure that the Group’s requirements are met.
The Group, in common with other similar groups, does not have an internal audit function. The Board has considered the need for an internal audit function but has decided to place reliance on the Administrator’s and Investment Manager’s systems and internal audit procedures.
These systems are designed to ensure effectiveness and efficient operations, internal control and compliance with laws and regulations. In establishing the systems of internal control regard is paid to the materiality of relevant risks, the likelihood of costs being incurred and costs of control. It follows therefore that the systems of internal control can only provide reasonable but not absolute assurance against the risk of material misstatement or loss.
The effectiveness of the internal control systems is reviewed annually by the Board and the Audit Committee. The Audit Committee has a discussion annually with the auditor to ensure that there are no issues of concern in relation to the audit opinion on the Financial Statements and, if necessary, representatives of the Investment Manager would be excluded from that discussion.
25 ING UK REAL ESTATE INCOME TRUST LIMITED
CORPO
RATE G
OV
ERNA
NCE
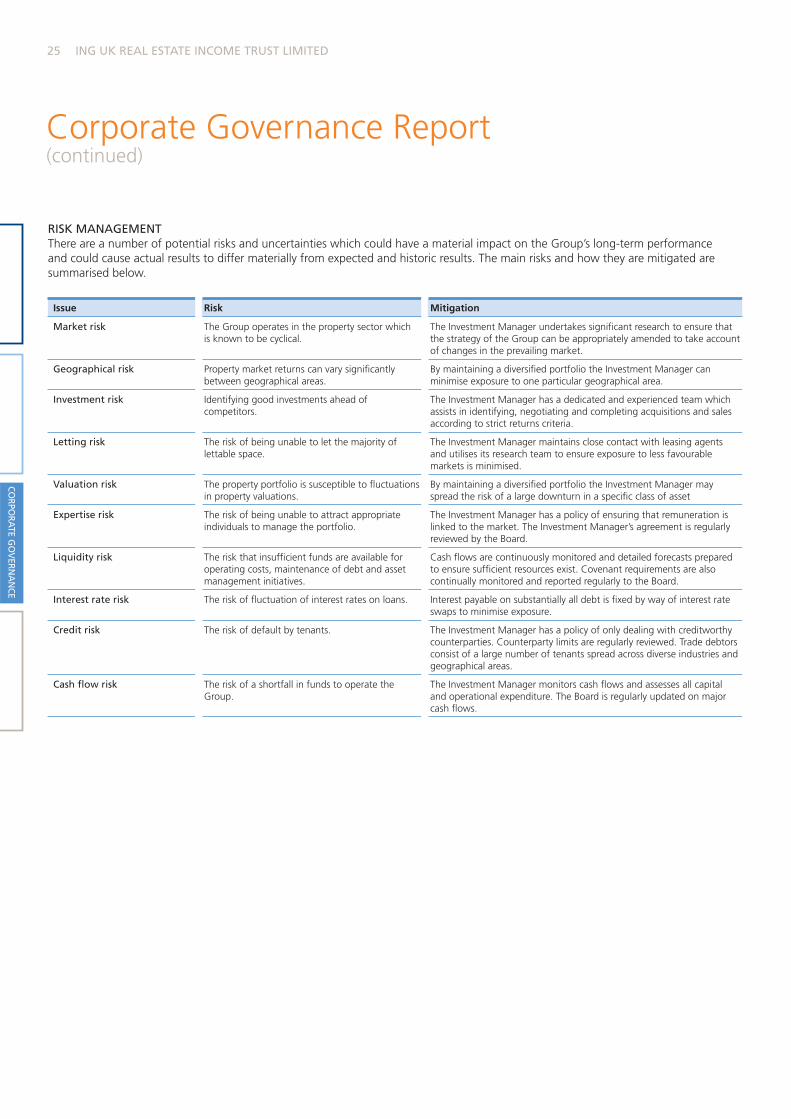
RISK MANAGEMENTThere are a number of potential risks and uncertainties which could have a material impact on the Group’s long-term performance and could cause actual results to differ materially from expected and historic results. The main risks and how they are mitigated are summarised below.
Issue Risk Mitigation
Market risk The Group operates in the property sector which is known to be cyclical.
The Investment Manager undertakes significant research to ensure that the strategy of the Group can be appropriately amended to take account of changes in the prevailing market.
Geographical risk Property market returns can vary significantly between geographical areas.
By maintaining a diversified portfolio the Investment Manager can minimise exposure to one particular geographical area.
Investment risk Identifying good investments ahead of competitors.
The Investment Manager has a dedicated and experienced team which assists in identifying, negotiating and completing acquisitions and sales according to strict returns criteria.
Letting risk The risk of being unable to let the majority of lettable space.
The Investment Manager maintains close contact with leasing agents and utilises its research team to ensure exposure to less favourable markets is minimised.
Valuation risk The property portfolio is susceptible to fluctuations in property valuations.
By maintaining a diversified portfolio the Investment Manager may spread the risk of a large downturn in a specific class of asset
Expertise risk The risk of being unable to attract appropriate individuals to manage the portfolio.
The Investment Manager has a policy of ensuring that remuneration is linked to the market. The Investment Manager’s agreement is regularly reviewed by the Board.
Liquidity risk The risk that insufficient funds are available for operating costs, maintenance of debt and asset management initiatives.
Cash flows are continuously monitored and detailed forecasts prepared to ensure sufficient resources exist. Covenant requirements are also continually monitored and reported regularly to the Board.
Interest rate risk The risk of fluctuation of interest rates on loans. Interest payable on substantially all debt is fixed by way of interest rate swaps to minimise exposure.
Credit risk The risk of default by tenants. The Investment Manager has a policy of only dealing with creditworthy counterparties. Counterparty limits are regularly reviewed. Trade debtors consist of a large number of tenants spread across diverse industries and geographical areas.
Cash flow risk The risk of a shortfall in funds to operate the Group.
The Investment Manager monitors cash flows and assesses all capital and operational expenditure. The Board is regularly updated on major cash flows.
Corporate Governance Report(continued)
26ANNUAL REPORT
CORP
ORA
TE G
OV
ERN
AN
CE
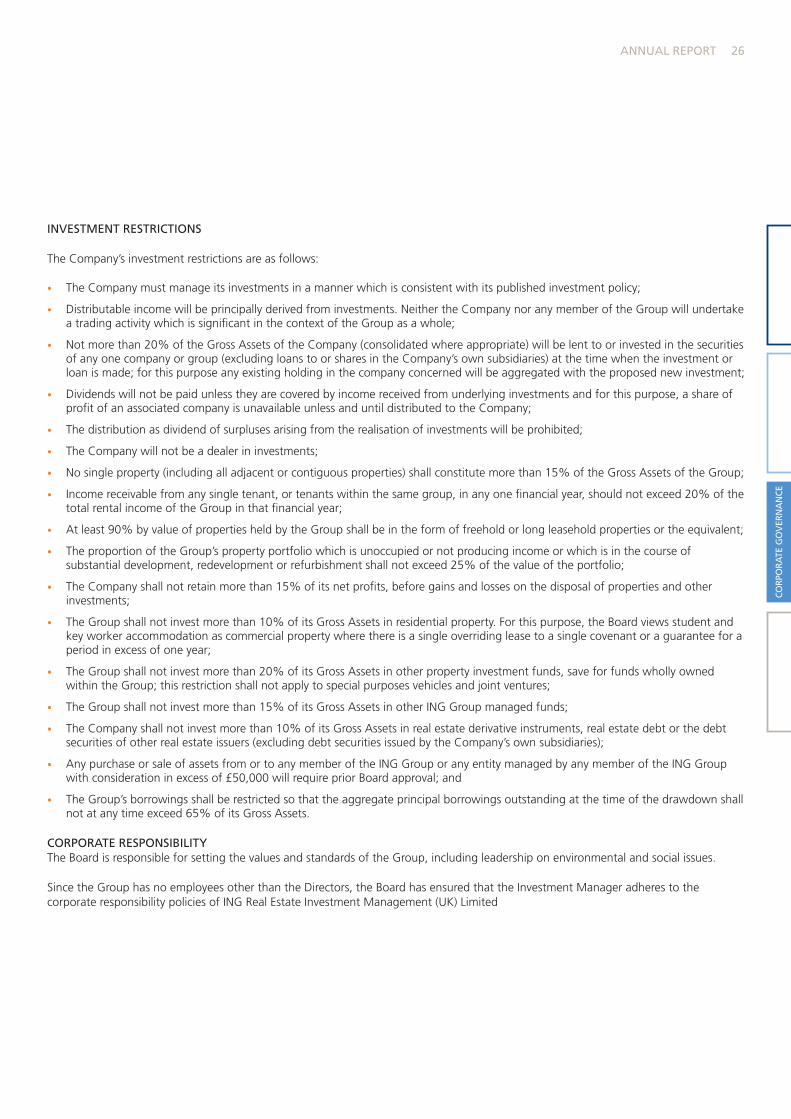
INVESTMENT RESTRICTIONS
The Company’s investment restrictions are as follows:
• The Company must manage its investments in a manner which is consistent with its published investment policy;
• Distributable income will be principally derived from investments. Neither the Company nor any member of the Group will undertake a trading activity which is significant in the context of the Group as a whole;
• Not more than 20% of the Gross Assets of the Company (consolidated where appropriate) will be lent to or invested in the securities of any one company or group (excluding loans to or shares in the Company’s own subsidiaries) at the time when the investment or loan is made; for this purpose any existing holding in the company concerned will be aggregated with the proposed new investment;
• Dividends will not be paid unless they are covered by income received from underlying investments and for this purpose, a share of profit of an associated company is unavailable unless and until distributed to the Company;
• The distribution as dividend of surpluses arising from the realisation of investments will be prohibited;
• The Company will not be a dealer in investments;
• No single property (including all adjacent or contiguous properties) shall constitute more than 15% of the Gross Assets of the Group;
• Income receivable from any single tenant, or tenants within the same group, in any one financial year, should not exceed 20% of the total rental income of the Group in that financial year;
• At least 90% by value of properties held by the Group shall be in the form of freehold or long leasehold properties or the equivalent;
• The proportion of the Group’s property portfolio which is unoccupied or not producing income or which is in the course of substantial development, redevelopment or refurbishment shall not exceed 25% of the value of the portfolio;
• The Company shall not retain more than 15% of its net profits, before gains and losses on the disposal of properties and other investments;
• The Group shall not invest more than 10% of its Gross Assets in residential property. For this purpose, the Board views student and key worker accommodation as commercial property where there is a single overriding lease to a single covenant or a guarantee for a period in excess of one year;
• The Group shall not invest more than 20% of its Gross Assets in other property investment funds, save for funds wholly owned within the Group; this restriction shall not apply to special purposes vehicles and joint ventures;
• The Group shall not invest more than 15% of its Gross Assets in other ING Group managed funds;
• The Company shall not invest more than 10% of its Gross Assets in real estate derivative instruments, real estate debt or the debt securities of other real estate issuers (excluding debt securities issued by the Company’s own subsidiaries);
• Any purchase or sale of assets from or to any member of the ING Group or any entity managed by any member of the ING Group with consideration in excess of £50,000 will require prior Board approval; and
• The Group’s borrowings shall be restricted so that the aggregate principal borrowings outstanding at the time of the drawdown shall not at any time exceed 65% of its Gross Assets.
CORPORATE RESPONSIBILITYThe Board is responsible for setting the values and standards of the Group, including leadership on environmental and social issues.
Since the Group has no employees other than the Directors, the Board has ensured that the Investment Manager adheres to the corporate responsibility policies of ING Real Estate Investment Management (UK) Limited
27 ING UK REAL ESTATE INCOME TRUST LIMITED
CORPO
RATE G
OV
ERNA
NCE
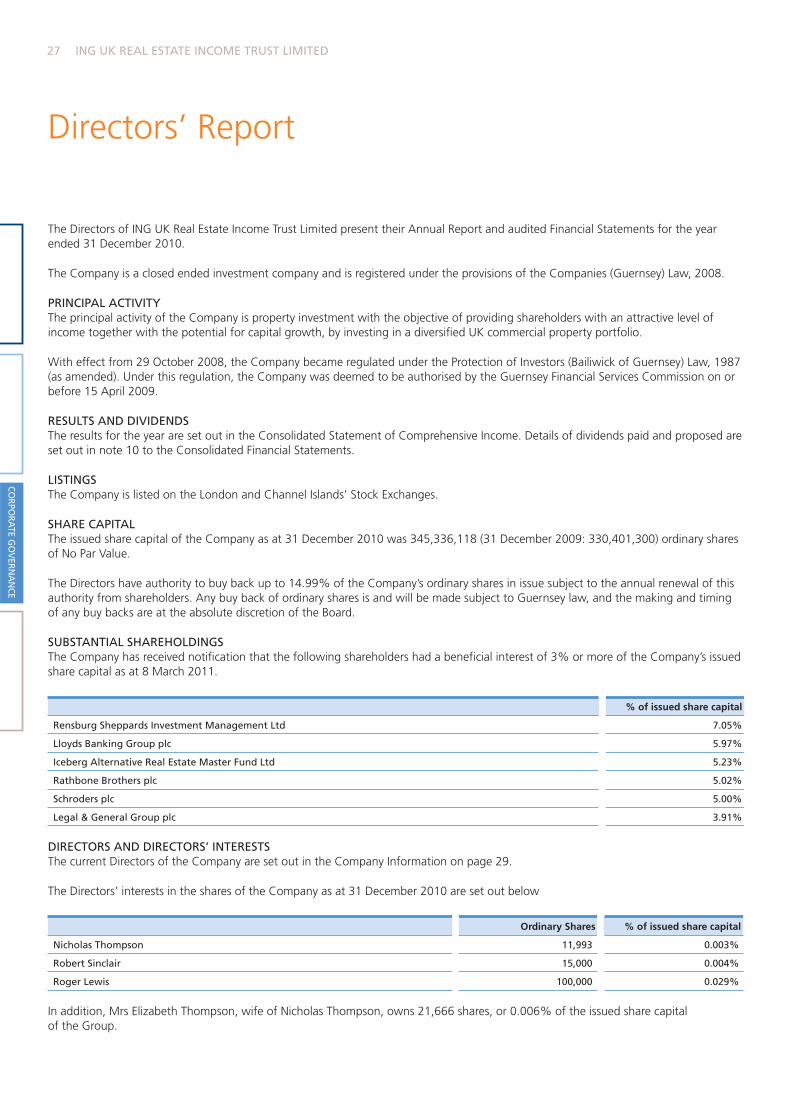
Directors’ Report
The Directors of ING UK Real Estate Income Trust Limited present their Annual Report and audited Financial Statements for the year ended 31 December 2010.
The Company is a closed ended investment company and is registered under the provisions of the Companies (Guernsey) Law, 2008.
PRINCIPAL ACTIVITYThe principal activity of the Company is property investment with the objective of providing shareholders with an attractive level of income together with the potential for capital growth, by investing in a diversified UK commercial property portfolio.
With effect from 29 October 2008, the Company became regulated under the Protection of Investors (Bailiwick of Guernsey) Law, 1987 (as amended). Under this regulation, the Company was deemed to be authorised by the Guernsey Financial Services Commission on or before 15 April 2009.
RESULTS AND DIVIDENDSThe results for the year are set out in the Consolidated Statement of Comprehensive Income. Details of dividends paid and proposed are set out in note 10 to the Consolidated Financial Statements.
LISTINGSThe Company is listed on the London and Channel Islands’ Stock Exchanges.
SHARE CAPITALThe issued share capital of the Company as at 31 December 2010 was 345,336,118 (31 December 2009: 330,401,300) ordinary shares of No Par Value.
The Directors have authority to buy back up to 14.99% of the Company’s ordinary shares in issue subject to the annual renewal of this authority from shareholders. Any buy back of ordinary shares is and will be made subject to Guernsey law, and the making and timing of any buy backs are at the absolute discretion of the Board.
SUBSTANTIAL SHAREHOLDINGSThe Company has received notification that the following shareholders had a beneficial interest of 3% or more of the Company’s issued share capital as at 8 March 2011.
% of issued share capital
Rensburg Sheppards Investment Management Ltd 7.05%
Lloyds Banking Group plc 5.97%
Iceberg Alternative Real Estate Master Fund Ltd 5.23%
Rathbone Brothers plc 5.02%
Schroders plc 5.00%
Legal & General Group plc 3.91%
DIRECTORS AND DIRECTORS’ INTERESTSThe current Directors of the Company are set out in the Company Information on page 29.
The Directors’ interests in the shares of the Company as at 31 December 2010 are set out below
Ordinary Shares % of issued share capital
Nicholas Thompson 11,993 0.003%
Robert Sinclair 15,000 0.004%
Roger Lewis 100,000 0.029%
In addition, Mrs Elizabeth Thompson, wife of Nicholas Thompson, owns 21,666 shares, or 0.006% of the issued share capital of the Group.
ANNUAL REPORT 28
EXEC
UTI
VE
SUM
MA
RY
CORP
ORA
TE G
OV
ERN
AN
CE
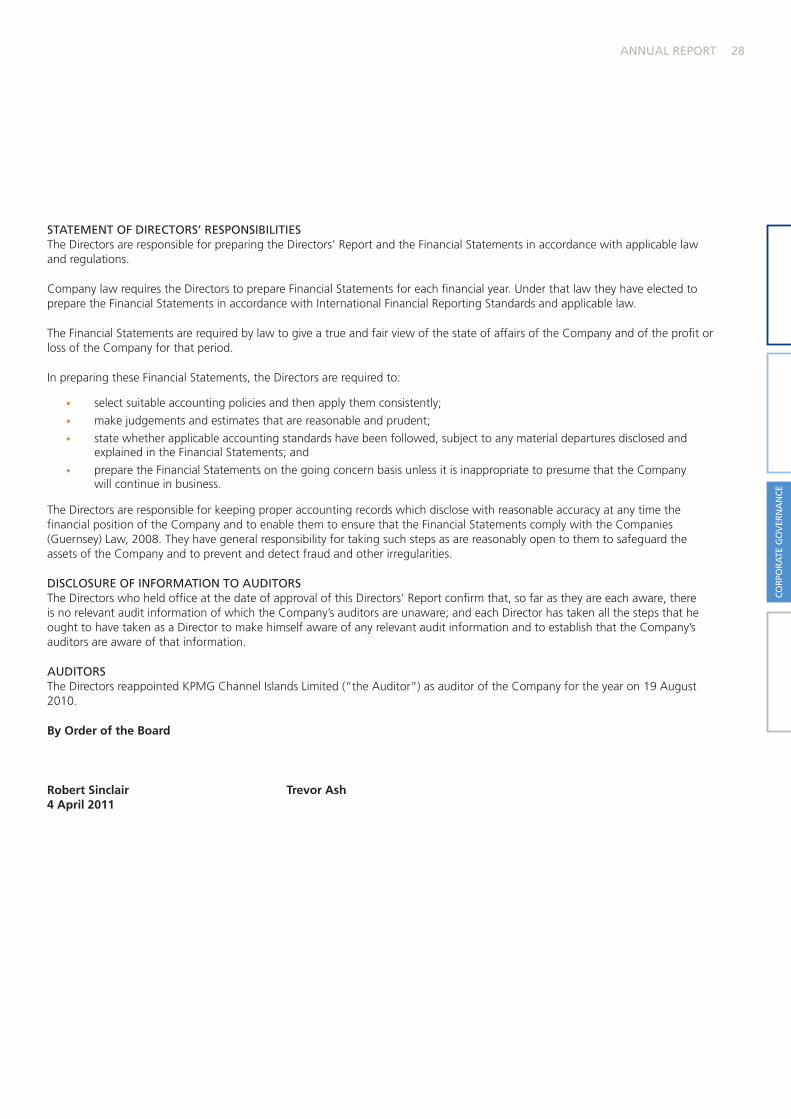
STATEMENT OF DIRECTORS’ RESPONSIBILITIESThe Directors are responsible for preparing the Directors’ Report and the Financial Statements in accordance with applicable law and regulations.
Company law requires the Directors to prepare Financial Statements for each financial year. Under that law they have elected to prepare the Financial Statements in accordance with International Financial Reporting Standards and applicable law.
The Financial Statements are required by law to give a true and fair view of the state of affairs of the Company and of the profit or loss of the Company for that period.
In preparing these Financial Statements, the Directors are required to:
• select suitable accounting policies and then apply them consistently;
• make judgements and estimates that are reasonable and prudent;
• state whether applicable accounting standards have been followed, subject to any material departures disclosed and explained in the Financial Statements; and
• prepare the Financial Statements on the going concern basis unless it is inappropriate to presume that the Company will continue in business.
The Directors are responsible for keeping proper accounting records which disclose with reasonable accuracy at any time the financial position of the Company and to enable them to ensure that the Financial Statements comply with the Companies (Guernsey) Law, 2008. They have general responsibility for taking such steps as are reasonably open to them to safeguard the assets of the Company and to prevent and detect fraud and other irregularities.
DISCLOSURE OF INFORMATION TO AUDITORSThe Directors who held office at the date of approval of this Directors’ Report confirm that, so far as they are each aware, there is no relevant audit information of which the Company’s auditors are unaware; and each Director has taken all the steps that he ought to have taken as a Director to make himself aware of any relevant audit information and to establish that the Company’s auditors are aware of that information.
AUDITORSThe Directors reappointed KPMG Channel Islands Limited (“the Auditor”) as auditor of the Company for the year on 19 August 2010.
By Order of the Board
Robert Sinclair Trevor Ash 4 April 2011

ING UK REAL ESTATE INCOME TRUST LIMITED29
DIRECTORSNICHOLAS THOMPSON Chairman
Age 62, was formerly Director and Head of Fund and Investment Management at Prudential Property Investment Management. He is currently Chairman of IPD’s Performance Analysis Service Consultative Group and their Index Consultative Group, Chairman of the Property Forum of the Association of Investment Companies, a Director of the Lend Lease Retail Partnership, a Board member of West Northants Development Corporation and a Governor of the Cambridge International Land Institute. He is a Fellow of the Royal Institution of Chartered Surveyors.
TREVOR ASH Chairman of the Management Engagement Committee
Age 64, was formerly Managing Director of Rothschild Asset Management (CI) Limited (until 1999) and a non-executive Director of Rothschild Asset Management Limited. He retired as a Director of NM Rothschild & Sons (CI) Limited in 2007. He is a Director of a number of funds managed by Merrill Lynch, Thames River Capital, Dexion Capital Management and ING. He is a Fellow of the Securities & Investment Institute.
ROBERT SINCLAIR Chairman of the Audit Committee
Age 61, is Managing Director of the Guernsey based Artemis Group and a Director of a number of investment fund management companies and investment funds associated with clients of that Group. Robert is Chairman of Schroder Oriental Income Fund Limited and also a Director of Gottex Market Neutral Trust Limited, both companies listed on the London Stock Exchange. He is a Fellow of the Institute of Chartered Accountants in England and Wales.
TJEERD BORSTLAP Chairman of the Remuneration Committee
Age 56, is Chief Financial Officer of ING Real Estate Investment Management located in The Hague, The Netherlands. In this capacity he is responsible for Finance, Treasury and Risk. Prior to joining ING Real Estate Investment Management in 2003, Tjeerd held various senior financial management positions within the ING Group. He graduated in Business Economics at the Erasmus University in Rotterdam and subsequently qualified as a Registered Auditor through the auditing profession with Peat Marwick & Mitchell, now KPMG.
ROGER LEWIS Chairman of the Property Valuation Committee
Age 63, has extensive experience in the property sector, most recently as a director of Berkeley Group Holdings Plc for over 15 years, the last eight of which was as Chairman, a position from which he retired at the end of July 2007. He currently acts as a consultant to the Berkeley Group and is a Director of three Jersey based subsidiaries of the Berkeley Group. Prior to this, he was UK Group Chief Executive Officer of Crest Nicholson Group PLC from 1983 to 1991. He is also currently a director of Camper & Nicholsons Marina Investments Limited and Grand Harbour Marina Plc (Malta).
Company Information
CORPO
RATE G
OV
ERNA
NCE
ANNUAL REPORT 30
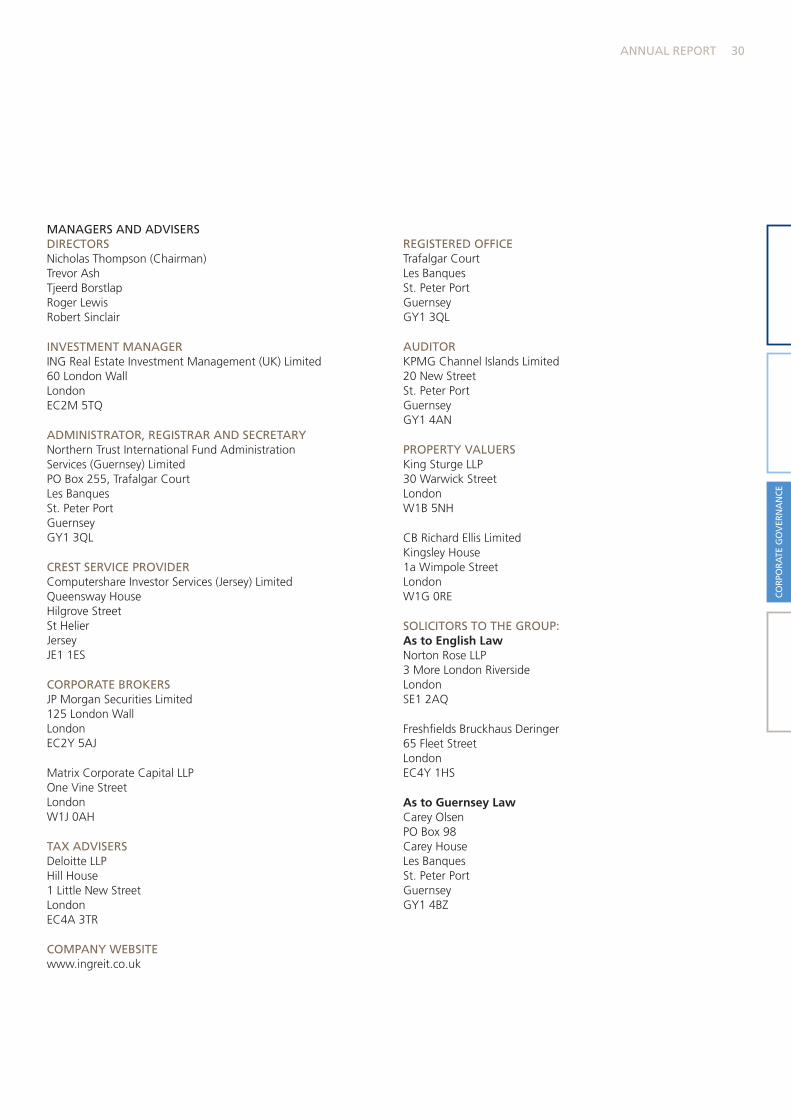
MANAGERS AND ADVISERSDIRECTORS Nicholas Thompson (Chairman) Trevor Ash Tjeerd Borstlap Roger Lewis Robert Sinclair
INVESTMENT MANAGERING Real Estate Investment Management (UK) Limited 60 London Wall London EC2M 5TQ
ADMINISTRATOR, REGISTRAR AND SECRETARY Northern Trust International Fund Administration Services (Guernsey) Limited PO Box 255, Trafalgar Court Les Banques St. Peter Port Guernsey GY1 3QL
CREST SERVICE PROVIDERComputershare Investor Services (Jersey) Limited Queensway House Hilgrove Street St Helier Jersey JE1 1ES
CORPORATE BROKERSJP Morgan Securities Limited 125 London Wall London EC2Y 5AJ
Matrix Corporate Capital LLP One Vine Street London W1J 0AH
TAX ADVISERSDeloitte LLP Hill House 1 Little New Street London EC4A 3TR
COMPANY WEBSITEwww.ingreit.co.uk
REGISTERED OFFICETrafalgar Court Les Banques St. Peter Port Guernsey GY1 3QL
AUDITORKPMG Channel Islands Limited 20 New Street St. Peter Port Guernsey GY1 4AN
PROPERTY VALUERS King Sturge LLP 30 Warwick Street London W1B 5NH
CB Richard Ellis Limited Kingsley House 1a Wimpole Street London W1G 0RE
SOLICITORS TO THE GROUP: As to English Law Norton Rose LLP 3 More London Riverside London SE1 2AQ
Freshfields Bruckhaus Deringer 65 Fleet Street London EC4Y 1HS
As to Guernsey Law Carey Olsen PO Box 98 Carey House Les Banques St. Peter Port Guernsey GY1 4BZ
EXEC
UTI
VE
SUM
MA
RY
CORP
ORA
TE G
OV
ERN
AN
CE
ING UK REAL ESTATE INCOME TRUST LIMITED31
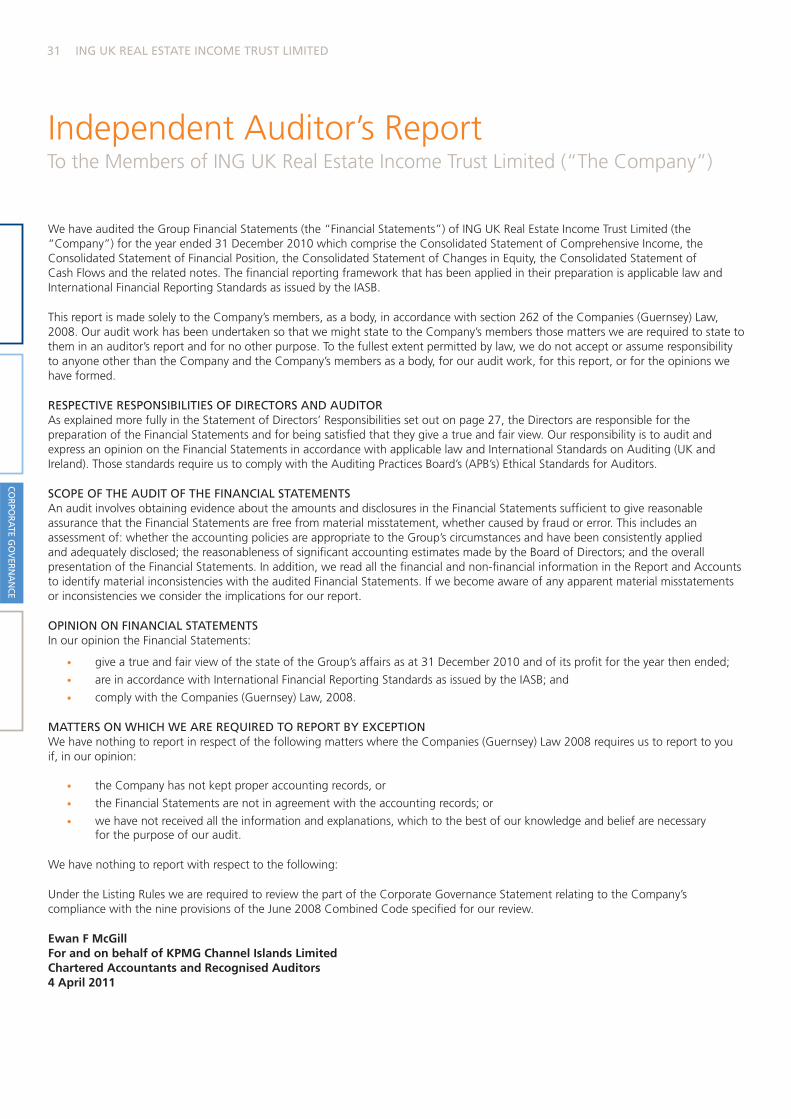
Independent Auditor’s Report
We have audited the Group Financial Statements (the “Financial Statements”) of ING UK Real Estate Income Trust Limited (the “Company”) for the year ended 31 December 2010 which comprise the Consolidated Statement of Comprehensive Income, the Consolidated Statement of Financial Position, the Consolidated Statement of Changes in Equity, the Consolidated Statement of Cash Flows and the related notes. The financial reporting framework that has been applied in their preparation is applicable law and International Financial Reporting Standards as issued by the IASB.
This report is made solely to the Company’s members, as a body, in accordance with section 262 of the Companies (Guernsey) Law, 2008. Our audit work has been undertaken so that we might state to the Company’s members those matters we are required to state to them in an auditor’s report and for no other purpose. To the fullest extent permitted by law, we do not accept or assume responsibility to anyone other than the Company and the Company’s members as a body, for our audit work, for this report, or for the opinions we have formed.
RESPECTIVE RESPONSIBILITIES OF DIRECTORS AND AUDITORAs explained more fully in the Statement of Directors’ Responsibilities set out on page 27, the Directors are responsible for the preparation of the Financial Statements and for being satisfied that they give a true and fair view. Our responsibility is to audit and express an opinion on the Financial Statements in accordance with applicable law and International Standards on Auditing (UK and Ireland). Those standards require us to comply with the Auditing Practices Board’s (APB’s) Ethical Standards for Auditors.
SCOPE OF THE AUDIT OF THE FINANCIAL STATEMENTSAn audit involves obtaining evidence about the amounts and disclosures in the Financial Statements sufficient to give reasonable assurance that the Financial Statements are free from material misstatement, whether caused by fraud or error. This includes an assessment of: whether the accounting policies are appropriate to the Group’s circumstances and have been consistently applied and adequately disclosed; the reasonableness of significant accounting estimates made by the Board of Directors; and the overall presentation of the Financial Statements. In addition, we read all the financial and non-financial information in the Report and Accounts to identify material inconsistencies with the audited Financial Statements. If we become aware of any apparent material misstatements or inconsistencies we consider the implications for our report.
OPINION ON FINANCIAL STATEMENTSIn our opinion the Financial Statements:
• give a true and fair view of the state of the Group’s affairs as at 31 December 2010 and of its profit for the year then ended;
• are in accordance with International Financial Reporting Standards as issued by the IASB; and
• comply with the Companies (Guernsey) Law, 2008.
MATTERS ON WHICH WE ARE REQUIRED TO REPORT BY EXCEPTIONWe have nothing to report in respect of the following matters where the Companies (Guernsey) Law 2008 requires us to report to you if, in our opinion:
• the Company has not kept proper accounting records, or
• the Financial Statements are not in agreement with the accounting records; or
• we have not received all the information and explanations, which to the best of our knowledge and belief are necessary for the purpose of our audit.
We have nothing to report with respect to the following:
Under the Listing Rules we are required to review the part of the Corporate Governance Statement relating to the Company’s compliance with the nine provisions of the June 2008 Combined Code specified for our review.
Ewan F McGill For and on behalf of KPMG Channel Islands Limited Chartered Accountants and Recognised Auditors 4 April 2011
To the Members of ING UK Real Estate Income Trust Limited (“The Company”)
CORPO
RATE G
OV
ERNA
NCE

32ANNUAL REPORT
EXEC
UTI
VE
SUM
MA
RY
CORP
ORA
TE G
OV
ERN
AN
CE
Datapoint Estate, Cody Road, London, E164,736 sq m multi-let industrial scheme. Acquired in 2010.
33 ING UK REAL ESTATE INCOME TRUST LIMITED
FINA
NC
IAL STA
TEMEN
TS
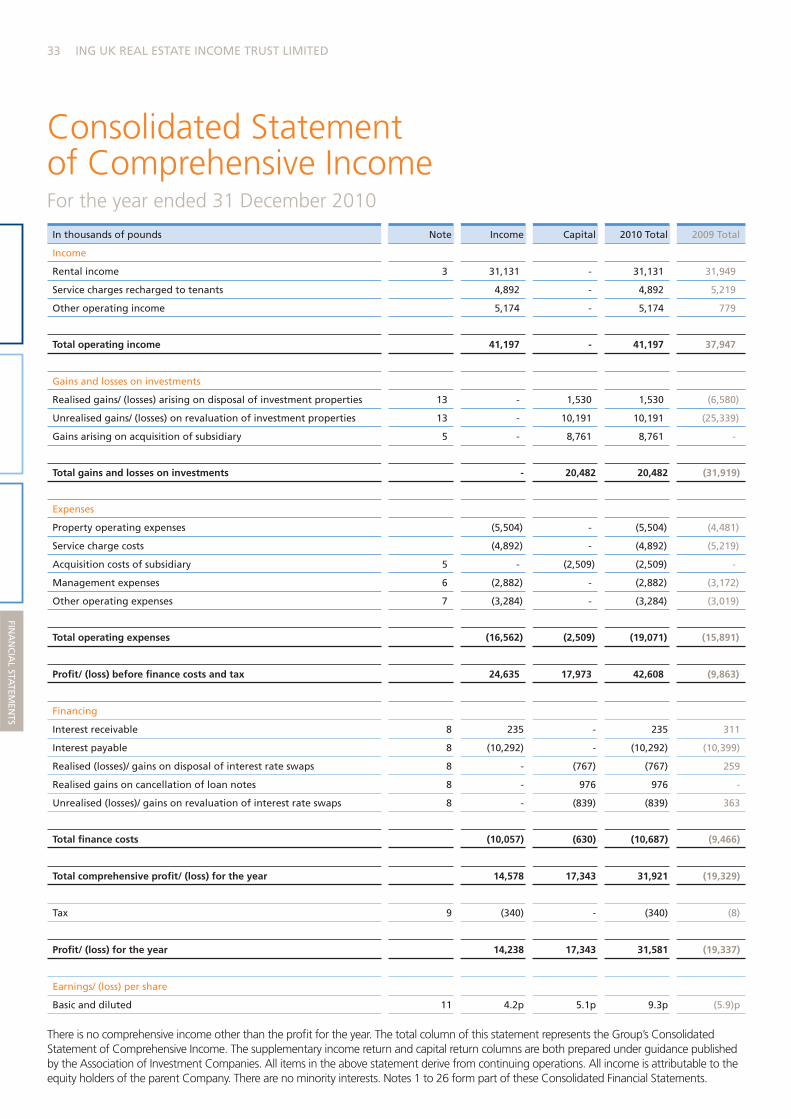
In thousands of pounds Note Income Capital 2010 Total 2009 Total
Income
Rental income 3 31,131 - 31,131 31,949
Service charges recharged to tenants 4,892 - 4,892 5,219
Other operating income 5,174 - 5,174 779
Total operating income 41,197 - 41,197 37,947
Gains and losses on investments
Realised gains/ (losses) arising on disposal of investment properties 13 - 1,530 1,530 (6,580)
Unrealised gains/ (losses) on revaluation of investment properties 13 - 10,191 10,191 (25,339)
Gains arising on acquisition of subsidiary 5 - 8,761 8,761 -
Total gains and losses on investments - 20,482 20,482 (31,919)
Expenses
Property operating expenses (5,504) - (5,504) (4,481)
Service charge costs (4,892) - (4,892) (5,219)
Acquisition costs of subsidiary 5 - (2,509) (2,509) -
Management expenses 6 (2,882) - (2,882) (3,172)
Other operating expenses 7 (3,284) - (3,284) (3,019)
Total operating expenses (16,562) (2,509) (19,071) (15,891)
Profit/ (loss) before finance costs and tax 24,635 17,973 42,608 (9,863)
Financing
Interest receivable 8 235 - 235 311
Interest payable 8 (10,292) - (10,292) (10,399)
Realised (losses)/ gains on disposal of interest rate swaps 8 - (767) (767) 259
Realised gains on cancellation of loan notes 8 - 976 976 -
Unrealised (losses)/ gains on revaluation of interest rate swaps 8 - (839) (839) 363
Total finance costs (10,057) (630) (10,687) (9,466)
Total comprehensive profit/ (loss) for the year 14,578 17,343 31,921 (19,329)
Tax 9 (340) - (340) (8)
Profit/ (loss) for the year 14,238 17,343 31,581 (19,337)
Earnings/ (loss) per share
Basic and diluted 11 4.2p 5.1p 9.3p (5.9)p
There is no comprehensive income other than the profit for the year. The total column of this statement represents the Group’s Consolidated Statement of Comprehensive Income. The supplementary income return and capital return columns are both prepared under guidance published by the Association of Investment Companies. All items in the above statement derive from continuing operations. All income is attributable to the equity holders of the parent Company. There are no minority interests. Notes 1 to 26 form part of these Consolidated Financial Statements.
Consolidated Statement of Comprehensive IncomeFor the year ended 31 December 2010
34ANNUAL REPORT
FINA
NC
IAL STA
TEMEN
TS FIN
AN
CIA
L ST
ATE
MEN
TS
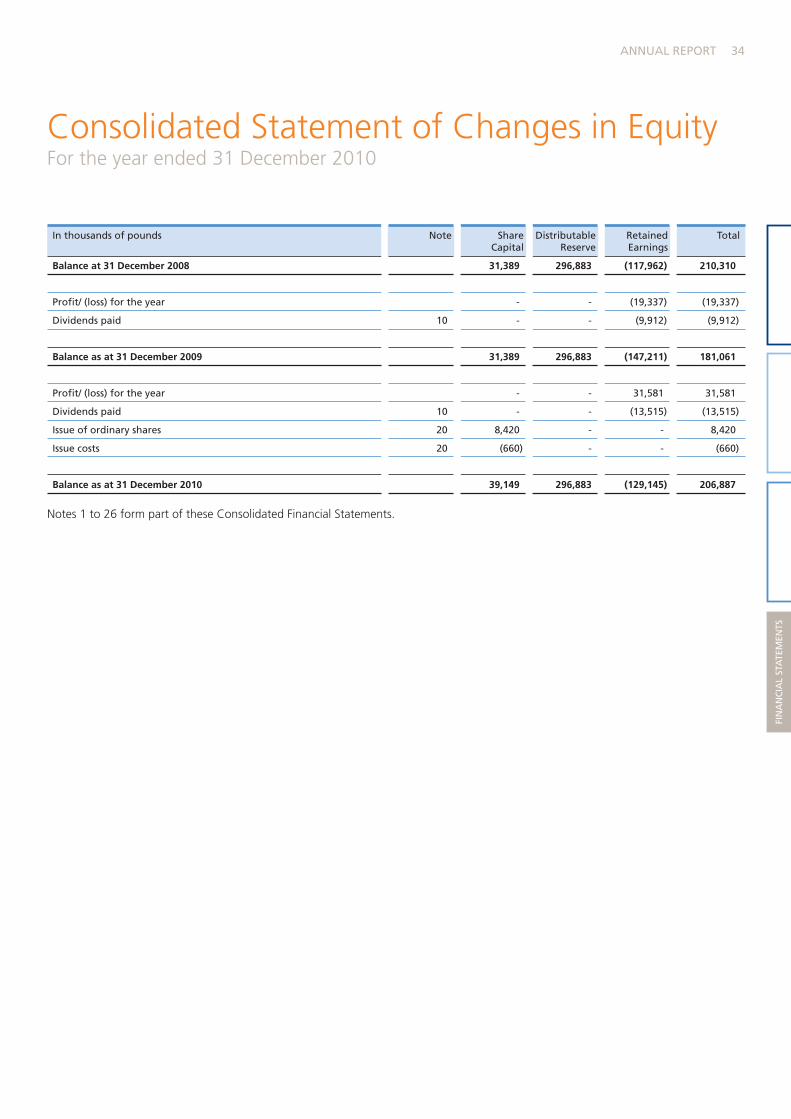
In thousands of pounds Note Share Capital
Distributable Reserve
Retained Earnings
Total
Balance at 31 December 2008 31,389 296,883 (117,962) 210,310
Profit/ (loss) for the year - - (19,337) (19,337)
Dividends paid 10 - - (9,912) (9,912)
Balance as at 31 December 2009 31,389 296,883 (147,211) 181,061
Profit/ (loss) for the year - - 31,581 31,581
Dividends paid 10 - - (13,515) (13,515)
Issue of ordinary shares 20 8,420 - - 8,420
Issue costs 20 (660) - - (660)
Balance as at 31 December 2010 39,149 296,883 (129,145) 206,887
Notes 1 to 26 form part of these Consolidated Financial Statements.
Consolidated Statement of Changes in EquityFor the year ended 31 December 2010
35 ING UK REAL ESTATE INCOME TRUST LIMITED
FINA
NC
IAL STA
TEMEN
TS
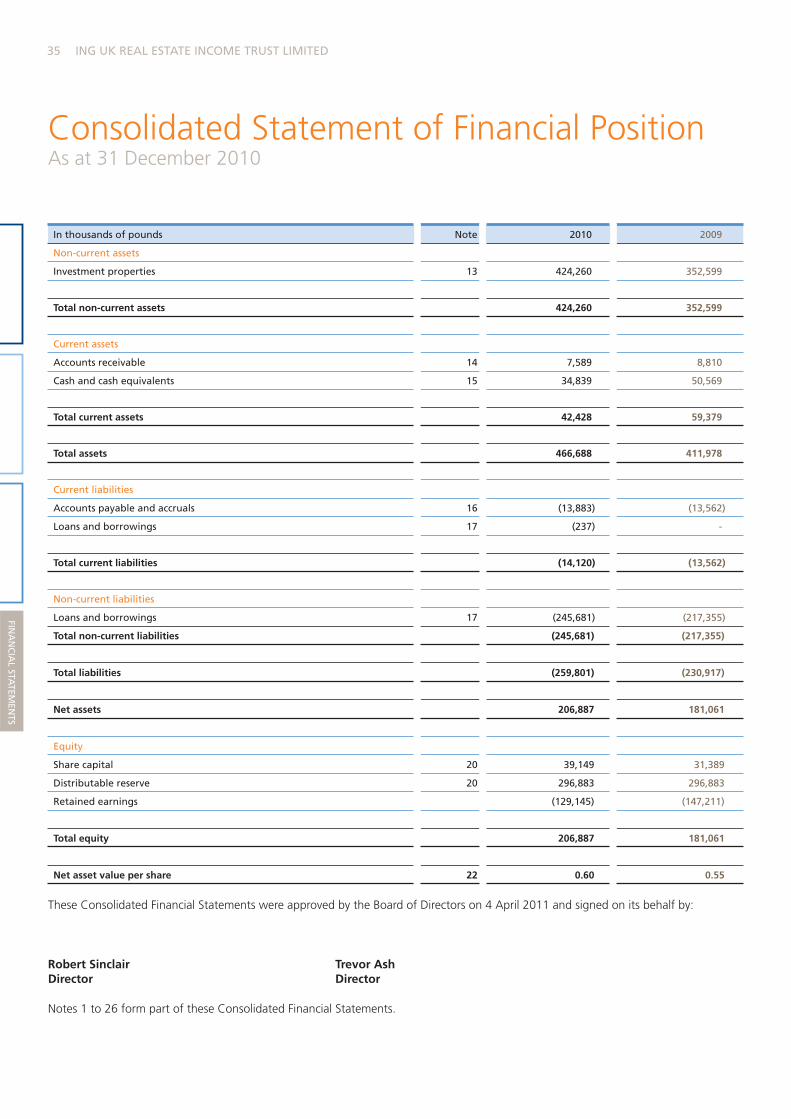
As at 31 December 2010
In thousands of pounds Note 2010 2009
Non-current assets
Investment properties 13 424,260 352,599
Total non-current assets 424,260 352,599
Current assets
Accounts receivable 14 7,589 8,810
Cash and cash equivalents 15 34,839 50,569
Total current assets 42,428 59,379
Total assets 466,688 411,978
Current liabilities
Accounts payable and accruals 16 (13,883) (13,562)
Loans and borrowings 17 (237) -
Total current liabilities (14,120) (13,562)
Non-current liabilities
Loans and borrowings 17 (245,681) (217,355)
Total non-current liabilities (245,681) (217,355)
Total liabilities (259,801) (230,917)
Net assets 206,887 181,061
Equity
Share capital 20 39,149 31,389
Distributable reserve 20 296,883 296,883
Retained earnings (129,145) (147,211)
Total equity 206,887 181,061
Net asset value per share 22 0.60 0.55
These Consolidated Financial Statements were approved by the Board of Directors on 4 April 2011 and signed on its behalf by:
Robert Sinclair Trevor Ash Director Director
Notes 1 to 26 form part of these Consolidated Financial Statements.
Consolidated Statement of Financial Position
36ANNUAL REPORT
FINA
NC
IAL STA
TEMEN
TS FIN
AN
CIA
L ST
ATE
MEN
TS
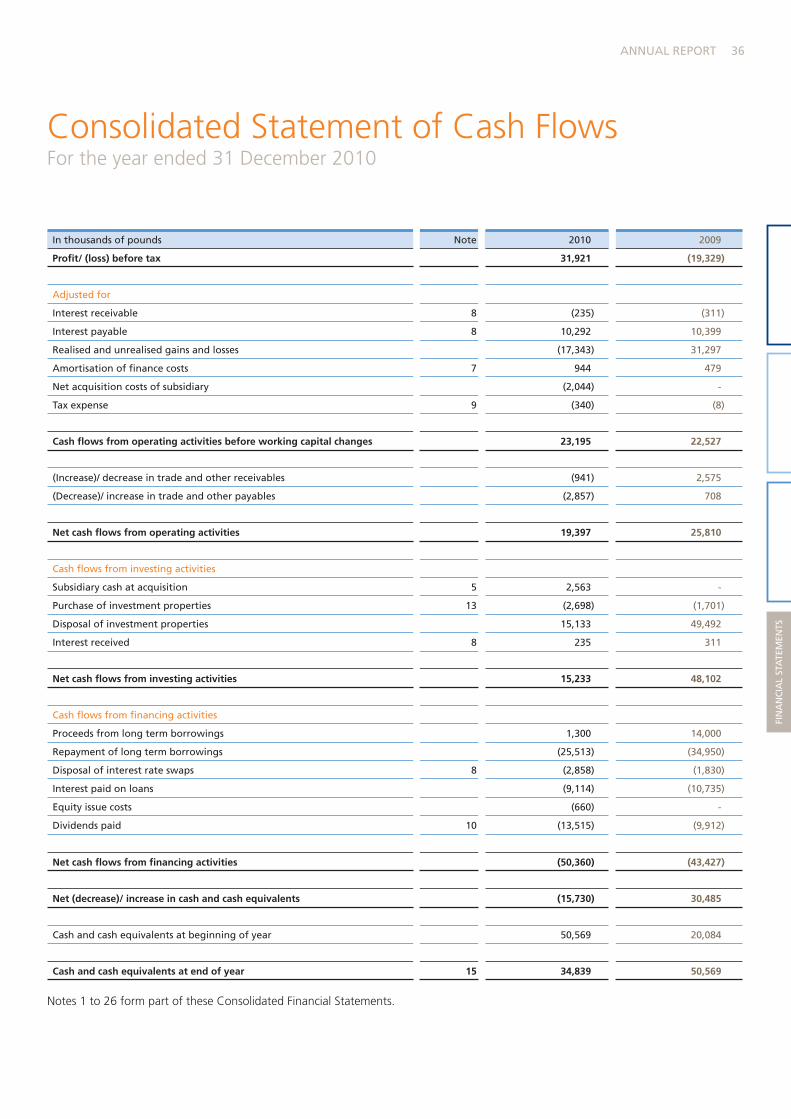
In thousands of pounds Note 2010 2009
Profit/ (loss) before tax 31,921 (19,329)
Adjusted for
Interest receivable 8 (235) (311)
Interest payable 8 10,292 10,399
Realised and unrealised gains and losses (17,343) 31,297
Amortisation of finance costs 7 944 479
Net acquisition costs of subsidiary (2,044) -
Tax expense 9 (340) (8)
Cash flows from operating activities before working capital changes 23,195 22,527
(Increase)/ decrease in trade and other receivables (941) 2,575
(Decrease)/ increase in trade and other payables (2,857) 708
Net cash flows from operating activities 19,397 25,810
Cash flows from investing activities
Subsidiary cash at acquisition 5 2,563 -
Purchase of investment properties 13 (2,698) (1,701)
Disposal of investment properties 15,133 49,492
Interest received 8 235 311
Net cash flows from investing activities 15,233 48,102
Cash flows from financing activities
Proceeds from long term borrowings 1,300 14,000
Repayment of long term borrowings (25,513) (34,950)
Disposal of interest rate swaps 8 (2,858) (1,830)
Interest paid on loans (9,114) (10,735)
Equity issue costs (660) -
Dividends paid 10 (13,515) (9,912)
Net cash flows from financing activities (50,360) (43,427)
Net (decrease)/ increase in cash and cash equivalents (15,730) 30,485
Cash and cash equivalents at beginning of year 50,569 20,084
Cash and cash equivalents at end of year 15 34,839 50,569
Notes 1 to 26 form part of these Consolidated Financial Statements.
For the year ended 31 December 2010Consolidated Statement of Cash Flows
37 ING UK REAL ESTATE INCOME TRUST LIMITED
FINA
NC
IAL STA
TEMEN
TS
1. GENERAL INFORMATION ING UK Real Estate Income Trust Limited was incorporated on 15 September 2005 and is registered as a closed ended Guernsey
investment company. The Consolidated Financial Statements are prepared for the year ended 31 December 2010 with comparatives for the year ended 31 December 2009.
2. SIGNIFICANT ACCOUNTING POLICIES BASIS OF ACCOUNTING The Financial Statements have been prepared on a going concern basis and adopt the historical cost basis, except for the
revaluation of investment properties and financial instruments. Historical cost is generally based on the fair value of the consideration given in exchange for the assets. The Financial Statements are in accordance with International Financial Reporting Standards (“IFRS”) and are in compliance with the Companies (Guernsey) Law, 2008.
CHANGES IN ACCOUNTING POLICIES The accounting policies adopted are consistent with those of the previous financial year, except that the Group has adopted the
following new and amended standards and interpretations as of 1 January 2010:
• IFRS 3 Business Combinations
• Amendment to IFRS 8 Operating Segments
• Amendment to IAS 17 Leases
• Amendment to IAS 39 Financial Instruments: Recognition and Measurement
The principal effects of these changes are as follows:
IFRS 3 Business Combinations Effective 1 July 2009, the Group has applied revised IFRS 3 ‘Business Combinations’. The revised standard requires all business
combinations to be accounted for using the acquisition method as at the acquisition date, which is the date on which control is transferred to the Group. The Group measures goodwill at the acquisition date as the fair value of the consideration transferred, less the net recognised amount (generally fair value) of the identifiable assets acquired and liabilities assumed. When the excess is negative, a gain is recognised immediately in profit and loss. The application of this standard impacted the Financial Statements of the Group in the current period.
Amendment to IFRS 8 Operating Segments IFRS 8 replaces IAS 14 Segment Reporting. The Board have concluded that the Group operates in a single reporting segment
determined in accordance with IAS 14 and this remains valid under the amended criteria outlined under IFRS 8. No amendments are therefore required to the Financial Statements of this, or prior, reporting periods.
Amendment to IAS 17 Leases This amendment deletes much of the existing wording in the Standard to the effect all leases of land (where title does not pass)
were operating leases. The amendment requires that in determining whether the lease of land (either separately or in combination with other property) is an operating or finance lease, the same criteria are applied as for any other asset. This amendment has not had any effect on the Financial Statements of the Group in this, or prior, reporting periods.
Amendment to IAS 39 Financial Instruments: Recognition and Measurement Effective 1 July 2009, this amendment provides guidance on what can be designated as a hedged portion under IAS 39. This
amendment has not had any effect on the Financial Statements of the Group in this, or prior, reporting periods.
The Directors believe that other pronouncements which are in issue but not yet operative or adopted by the Group will not have a material impact on the Financial Statements of the Group.
For the year ended 31 December 2010Notes to the Consolidated Financial Statements
38ANNUAL REPORT
FIN
AN
CIA
L ST
ATE
MEN
TS
2. ACCOUNTING POLICIES (CONTINUED) Critical accounting judgements and key sources of estimation uncertainty The preparation of Financial Statements in conformity with IFRS requires management to make judgements, estimates and
assumptions that affect the application of policies and the reported amounts of assets and liabilities, income and expenses. The estimates and associated assumptions are based on historical experience and various other factors that are believed to be reasonable under the circumstances, the results of which form the basis of making judgements about the carrying values of assets and liabilities that are not readily apparent from other sources. Actual results may differ from these estimates.
The estimates and underlying assumptions are reviewed on an ongoing basis. Revisions to accounting estimates are recognised in the year in which the estimate is revised if the revision affects only that year or in the year of the revision and future years if the revision affects both current and future years. Where such judgements are made they are discussed below.
Fair value of derivatives The Directors use their judgement in selecting an appropriate valuation technique for financial instruments. Valuation techniques
commonly used by market practitioners are applied. For derivative instruments, assumptions are made based on quoted market rates adjusted for specific features of the instrument. Derivatives are valued in these Financial Statements based on the valuations received from the issuer of the swaps.
Fair value of investment properties The fair value of the Group’s investment properties is a key source of estimated uncertainty; however, in accordance with the
accounting policy of the Group, investment properties have been valued on the basis of market value and market rental value by external valuers.
Market value is defined as the estimated amount for which a property should exchange on the date of valuation between a willing buyer and a willing seller in an arms length transaction after proper marketing wherein the parties had each acted knowledgeably, prudently and without compulsion. The Group ensures the use of suitable qualified external valuers valuing the investment properties held by the Group.
BASIS OF CONSOLIDATION The Consolidated Financial Statements incorporate the Financial Statements of the Company and entities controlled by the
Company made up to 31 December. Control is achieved where the Company has the power to govern the financial and operating policies of an investee entity so as to obtain benefits from its activities. All intra-group transactions, balances, income and expenses are eliminated on consolidation.
The results of ING (UK) Listed Real Estate Issuer PLC are consolidated in accordance with SIC 12, ‘Consolidation – Special Purpose Entities’.
BUSINESS COMBINATIONS Goodwill on business combinations is measured as the fair value of the consideration transferred less the net recognised amount
(fair value) of the identifiable assets acquired and liabilities assumed, all measured as of the acquisition date. When the excess is negative, this is recognised immediately in the Statement of Comprehensive Income.
Transaction costs, other than those associated with the issue of debt or equity securities, that the Group incurs in connection with a business combination are expensed as incurred. See note 5 for the application of the new policy to the business combination that occurred during the year.
PRESENTATION OF THE STATEMENT OF COMPREHENSIVE INCOME In order to better reflect the activities of an Investment Company and in accordance with guidance issued by the AIC, supplementary
information which analyses the Statement of Comprehensive Income between items of a revenue and capital nature has been presented alongside the Statement of Comprehensive Income.

39 ING UK REAL ESTATE INCOME TRUST LIMITED
FINA
NC
IAL STA
TEMEN
TS
2. ACCOUNTING POLICIES (CONTINUED) INVESTMENT PROPERTIES Freehold property held by the Group to earn income or for capital appreciation or both is classified as investment property
in accordance with IAS 40 ‘Investment Property’. Property held under finance leases for similar purposes is also classified as investment property. Investment property is initially recognised at purchase cost plus directly attributable acquisition expenses. Investment properties are carried at a revalued amount which is stated at its fair value as determined on an open market basis as at the reporting date. The fair value of investment property is based on valuation by an independent valuer who holds a recognised and relevant professional qualification and who has recent experience in the location and category of the investment property being valued.
The fair value of investment property generally involves consideration of:
• Market evidence on comparable transactions for similar properties;
• The actual current market for that type of property in that type of location at the reporting date and current market expectations;
• Rental income from leases and market expectations regarding possible future lease terms;
• Hypothetical sellers and buyers, who are reasonably informed about the current market and who are motivated, but not compelled, to transact in that market on an arm’s length basis; and
• Investor expectations on matters such as future enhancement of rental income or market conditions.
Gains and losses arising from changes in fair value are included in the Statement of Comprehensive Income in the year in which they arise. Purchases and sales of investment property are recognised when contracts have been unconditionally exchanged during the year and the significant risks and rewards of ownership have been transferred.
An item of investment property is derecognised upon disposal or when no future economic benefits are expected to arise from the continued use of the asset. Any gain or loss arising on derecognition of the asset (calculated as the difference between the net disposal proceeds and the carrying amount of the item) is included in the Statement of Comprehensive Income in the year the item is derecognised. Investment properties are not depreciated.
Realised and unrealised gains on investment properties have been presented as capital items within the Statement of Comprehensive Income.
The loans have a first ranking mortgage over the properties, see note 17. In line with industry practice, investment properties are held in nominee companies.
LEASES Finance leases, which transfer to the Group substantially all the risks and benefits incidental to ownership of the leased item are
capitalised at the inception of the lease at the fair value of the leased property or, if lower, the present value of the minimum lease payments. Lease payments are apportioned between the finance charges and reduction of the lease liability so as to achieve a constant rate of interest on the remaining balance of the liability. Finance charges are charged directly against income.
An operating lease is a lease other than a finance lease. Lease income is recognised in income on a straight-line basis over the lease term. Direct costs incurred in negotiating and arranging an operating lease are added to the carrying amount of the leased asset and recognised as an expense over the lease term on the same basis as the lease income.
The Financial Statements reflect the requirements of SIC 15, ‘Operating Leases – Incentives’ to the extent that they are material. Premiums received on the surrender of leases are recorded as income immediately if there are no relevant conditions attached to the surrender.
(continued)Notes to the Consolidated Financial Statements

40ANNUAL REPORT
FIN
AN
CIA
L ST
ATE
MEN
TS
2. ACCOUNTING POLICIES (CONTINUED) CASH AND CASH EQUIVALENTS Cash includes cash in hand and cash with banks. Cash equivalents are short-term, highly liquid investments that are readily
convertible to known amounts of cash with original maturities in three months or less and that are subject to an insignificant risk of change in value.
INCOME AND EXPENSES Income and expenses are included in the Statement of Comprehensive Income on an accruals basis. All of the Group’s income and
expenses are derived from continuing operations. Revenue is recognised to the extent that it is probable that the economic benefit will flow to the Group and the revenue can be reliably measured.
Lease incentive payments, including surrender premiums paid, are amortised on a straight-line basis over the period from the date of lease commencement to the earliest termination date. Upon receipt of a surrender premium for the early determination of a lease, the profit, net of dilapidations and non-recoverable outgoings relating to the lease concerned, is immediately reflected in other operating income.
Property operating costs include the costs of professional fees on letting and other non-recoverable costs.
The income charged to tenants for property service charges and the costs associated with such service charges are shown separately in the Statement of Comprehensive Income to reflect that, notwithstanding this money is held on behalf of tenants occupying the properties, the ultimate risk for paying and recovering these costs rests with the property owner.
DIVIDENDS Dividends are recognised in the period in which they are paid.
FINANCIAL LIABILITIES AND EQUITY Financial liabilities and equity instruments are classified according to the substance of the contractual arrangements entered into.
An equity instrument is any contract that evidences a residual interest in the assets of the Group after deducting all of its liabilities.
DERIVATIVE FINANCIAL INSTRUMENTS The Group’s activities expose it to the financial risks of changes in interest rates. The Group uses interest rate swap contracts to
mitigate this exposure. The Group does not use derivative financial instruments for speculative purposes.
Changes in the fair value of derivative financial instruments are recognised in the Statement of Comprehensive Income as they arise. These derivatives are categorised as held for trading under IAS 39, ‘Financial Instruments: Recognition and Measurement’ and are held only to mitigate the risk of changes in interest rates as disclosed in note 24.
TRADE RECEIVABLES Trade receivables are stated at their nominal amount as reduced by appropriate allowances for estimated irrecoverable amounts.
LOANS AND BORROWINGS All loans and borrowings are initially recognised at cost, being the fair value of the consideration received net of issue costs
associated with the borrowing. After initial recognition, loans and borrowings are subsequently measured at amortised cost using the effective interest rate method. Amortised cost is calculated by taking into account any issue costs, and any discount or premium on settlement.
Gains and losses are recognised in the Statement of Comprehensive Income when the liabilities are derecognised, as well as through the amortisation process.
OTHER ASSETS AND LIABILITIES Other assets and liabilities are not interest bearing and are stated at their nominal value.
SHARE CAPITAL Ordinary shares are classified as equity. Incremental costs directly attributable to the issue of ordinary shares are recognised as a
deduction from equity.

41 ING UK REAL ESTATE INCOME TRUST LIMITED
FINA
NC
IAL STA
TEMEN
TS
2. ACCOUNTING POLICIES (CONTINUED) TAXATION The Directors conduct the affairs of the Group such that the management and control of the Group is not exercised in the United
Kingdom and that the Group does not carry on a trade in the United Kingdom. Accordingly the Group will not be liable to United Kingdom taxation on its income or capital gains arising in the United Kingdom, other than certain income deriving from a United Kingdom source.
The Group is subject to United Kingdom taxation on income arising on the investment properties and intra-group loans after deduction of allowable debt financing costs and allowable expenses.
The Group is tax exempt in Guernsey for the year ended 31 December 2010.
PRINCIPLES FOR THE STATEMENT OF CASH FLOWS The Statement of Cash Flows has been drawn up according to the indirect method, separating the cash flows from operating
activities, investing activities and financing activities. The net result has been adjusted for amounts in the Statement of Comprehensive Income and movements in the Statement of Financial Position which have not resulted in cash income or expenditure in the year.
The cash amounts in the Statement of Cash Flows include those assets that can be converted into cash without any restrictions and without any material risk of decreases in value as a result of the transaction. Dividends that have been paid and declared are included in the cash flow from financing activities.
3. RENTAL INCOME Rent receivable is stated exclusive of Value Added Tax and arose wholly from continuing operations in the United Kingdom.
4. OPERATING SEGMENTS The Directors are the chief operating decision makers. The Board is charged with setting the Company’s investment strategy in
accordance with the Prospectus. They have delegated the day to day implementation of this strategy to its Investment Manager but retain responsibility to ensure that adequate resources of the Company are directed in accordance with their decisions. The investment decisions of the Investment Manager are reviewed on a regular basis to ensure compliance with the policies and legal responsibilities of the Board.
The Investment Manager has been given full authority to act on behalf of the Company. Under the terms of the Investment Management Agreement, subject to the overall supervision of the Board, the Investment Manager advises on the general allocation of the assets of the Company between different investments, advises the Company on its borrowing policy and geared investment position, manages the investment of the Company’s subscription proceeds and short term liquidity in fixed income instruments, and advises on the use of (and manage) derivatives and hedging by the Company. Whilst the Investment Manager may make the investment decisions on a day to day basis regarding the allocation of funds to different investments, any changes to the investment strategy or major allocation decisions have to be approved by the Board, even though they may be proposed by the Investment Manager.
The Board therefore retains full responsibility as to the major allocation decisions made on an ongoing basis. The Investment Manager will always act under the terms of the Prospectus and the Investment Management Agreement which cannot be radically changed without the approval of the Board. The Board has considered the requirements of IFRS 8 ‘Operating Segments”. The Board is of the opinion that the Group, through its subsidiary undertakings, operates in one reportable industry segment, namely real estate investment, and across one primary geographical area, namely the United Kingdom and therefore no segmental reporting is required. The portfolio consists of 70 commercial properties, which are in the office, retail, retail warehouse, industrial and leisure sectors.
(continued)Notes to the Consolidated Financial Statements
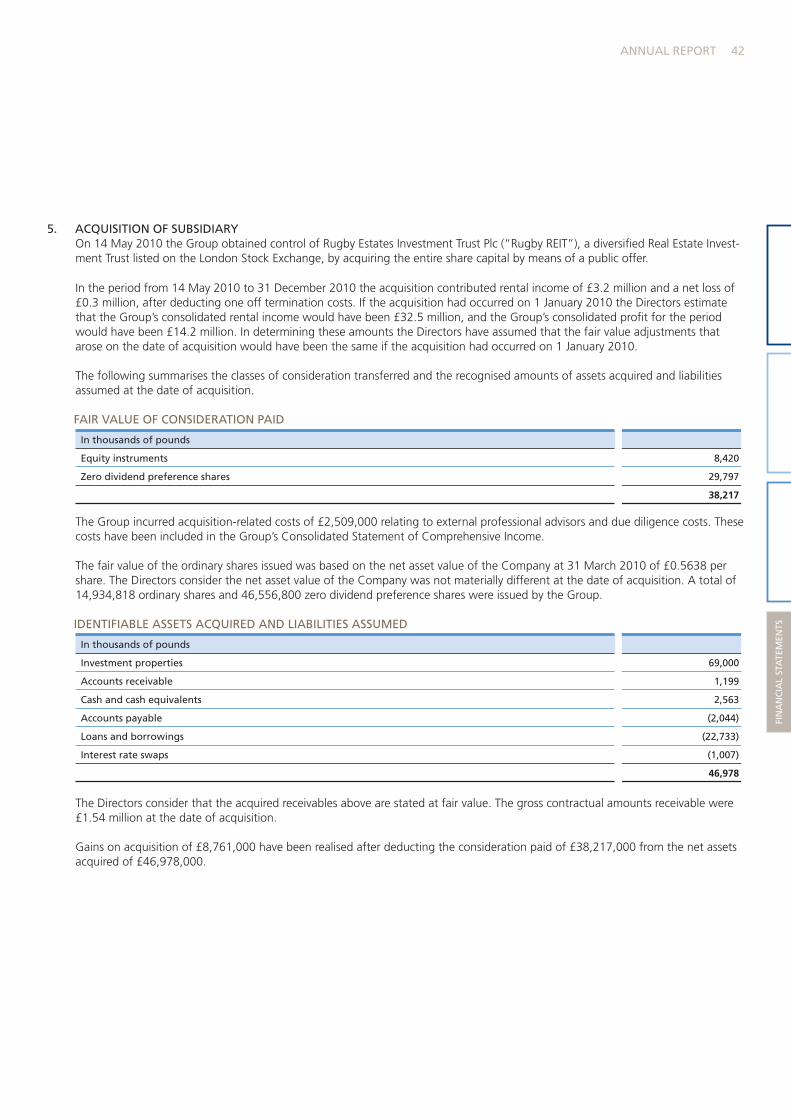
42ANNUAL REPORT
FIN
AN
CIA
L ST
ATE
MEN
TS
5. ACQUISITION OF SUBSIDIARYOn 14 May 2010 the Group obtained control of Rugby Estates Investment Trust Plc (“Rugby REIT”), a diversified Real Estate Invest-ment Trust listed on the London Stock Exchange, by acquiring the entire share capital by means of a public offer.
In the period from 14 May 2010 to 31 December 2010 the acquisition contributed rental income of £3.2 million and a net loss of £0.3 million, after deducting one off termination costs. If the acquisition had occurred on 1 January 2010 the Directors estimate that the Group’s consolidated rental income would have been £32.5 million, and the Group’s consolidated profit for the period would have been £14.2 million. In determining these amounts the Directors have assumed that the fair value adjustments that arose on the date of acquisition would have been the same if the acquisition had occurred on 1 January 2010.
The following summarises the classes of consideration transferred and the recognised amounts of assets acquired and liabilities assumed at the date of acquisition.
FAIR VALUE OF CONSIDERATION PAID
In thousands of pounds
Equity instruments 8,420
Zero dividend preference shares 29,797
38,217 The Group incurred acquisition-related costs of £2,509,000 relating to external professional advisors and due diligence costs. These costs have been included in the Group’s Consolidated Statement of Comprehensive Income.
The fair value of the ordinary shares issued was based on the net asset value of the Company at 31 March 2010 of £0.5638 per share. The Directors consider the net asset value of the Company was not materially different at the date of acquisition. A total of 14,934,818 ordinary shares and 46,556,800 zero dividend preference shares were issued by the Group.
IDENTIFIABLE ASSETS ACQUIRED AND LIABILITIES ASSUMED
In thousands of pounds
Investment properties 69,000
Accounts receivable 1,199
Cash and cash equivalents 2,563
Accounts payable (2,044)
Loans and borrowings (22,733)
Interest rate swaps (1,007)
46,978
The Directors consider that the acquired receivables above are stated at fair value. The gross contractual amounts receivable were £1.54 million at the date of acquisition.
Gains on acquisition of £8,761,000 have been realised after deducting the consideration paid of £38,217,000 from the net assets acquired of £46,978,000.
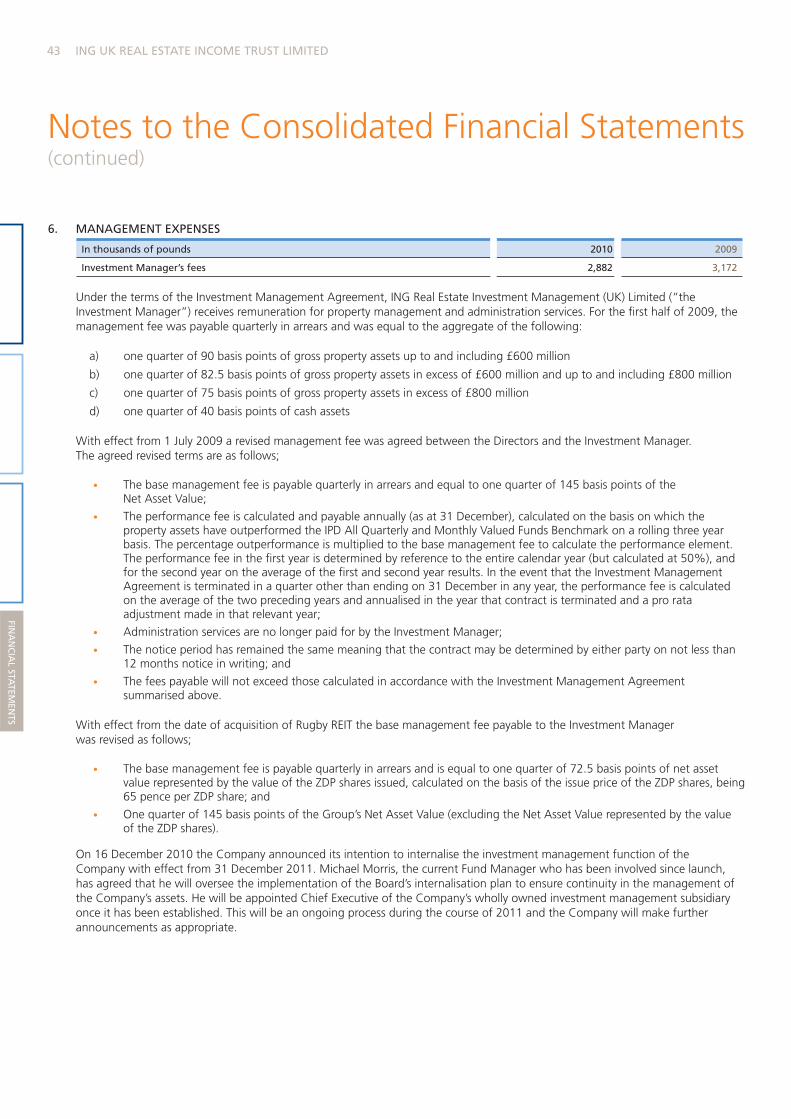
43 ING UK REAL ESTATE INCOME TRUST LIMITED
FINA
NC
IAL STA
TEMEN
TS
6. MANAGEMENT EXPENSES
In thousands of pounds 2010 2009
Investment Manager’s fees 2,882 3,172
Under the terms of the Investment Management Agreement, ING Real Estate Investment Management (UK) Limited (“the Investment Manager”) receives remuneration for property management and administration services. For the first half of 2009, the management fee was payable quarterly in arrears and was equal to the aggregate of the following:
a) one quarter of 90 basis points of gross property assets up to and including £600 million
b) one quarter of 82.5 basis points of gross property assets in excess of £600 million and up to and including £800 million
c) one quarter of 75 basis points of gross property assets in excess of £800 million
d) one quarter of 40 basis points of cash assets
With effect from 1 July 2009 a revised management fee was agreed between the Directors and the Investment Manager. The agreed revised terms are as follows;
• The base management fee is payable quarterly in arrears and equal to one quarter of 145 basis points of the Net Asset Value;
• The performance fee is calculated and payable annually (as at 31 December), calculated on the basis on which the property assets have outperformed the IPD All Quarterly and Monthly Valued Funds Benchmark on a rolling three year basis. The percentage outperformance is multiplied to the base management fee to calculate the performance element. The performance fee in the first year is determined by reference to the entire calendar year (but calculated at 50%), and for the second year on the average of the first and second year results. In the event that the Investment Management Agreement is terminated in a quarter other than ending on 31 December in any year, the performance fee is calculated on the average of the two preceding years and annualised in the year that contract is terminated and a pro rata adjustment made in that relevant year;
• Administration services are no longer paid for by the Investment Manager;
• The notice period has remained the same meaning that the contract may be determined by either party on not less than 12 months notice in writing; and
• The fees payable will not exceed those calculated in accordance with the Investment Management Agreement summarised above.
With effect from the date of acquisition of Rugby REIT the base management fee payable to the Investment Manager was revised as follows;
• The base management fee is payable quarterly in arrears and is equal to one quarter of 72.5 basis points of net asset value represented by the value of the ZDP shares issued, calculated on the basis of the issue price of the ZDP shares, being 65 pence per ZDP share; and
• One quarter of 145 basis points of the Group’s Net Asset Value (excluding the Net Asset Value represented by the value of the ZDP shares).
On 16 December 2010 the Company announced its intention to internalise the investment management function of the Company with effect from 31 December 2011. Michael Morris, the current Fund Manager who has been involved since launch, has agreed that he will oversee the implementation of the Board’s internalisation plan to ensure continuity in the management of the Company’s assets. He will be appointed Chief Executive of the Company’s wholly owned investment management subsidiary once it has been established. This will be an ongoing process during the course of 2011 and the Company will make further announcements as appropriate.
(continued)Notes to the Consolidated Financial Statements
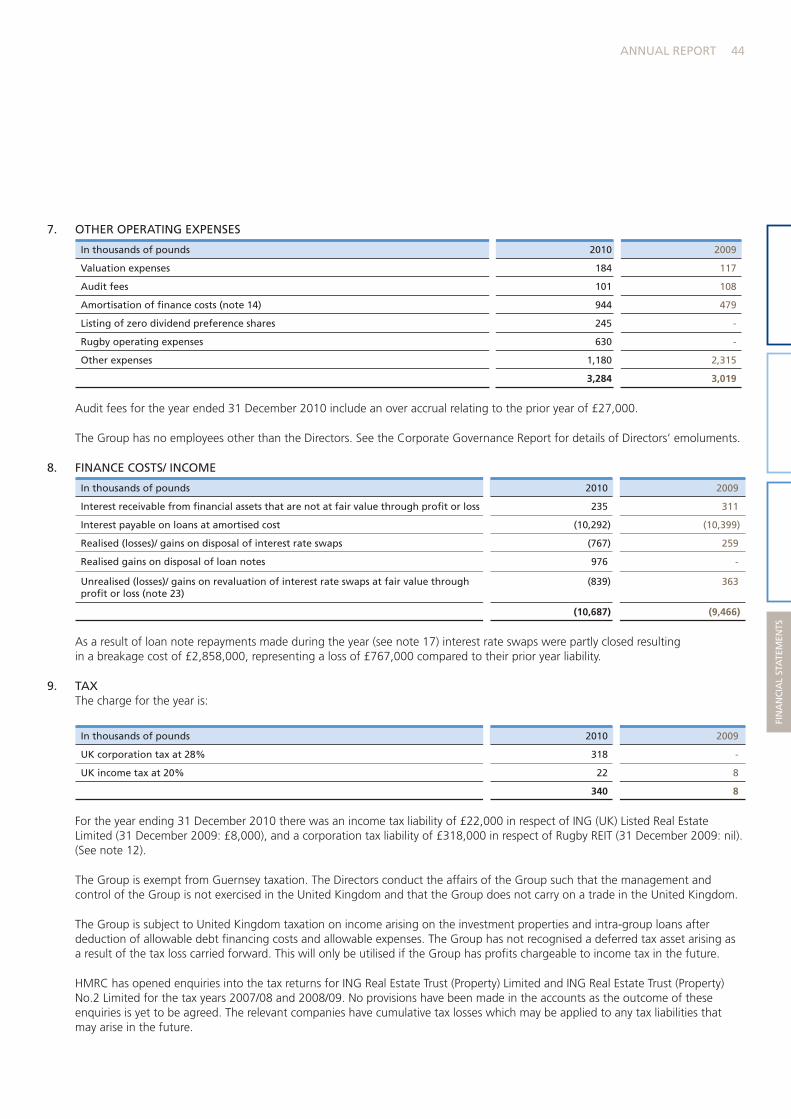
44ANNUAL REPORT
FIN
AN
CIA
L ST
ATE
MEN
TS
7. OTHER OPERATING EXPENSES
In thousands of pounds 2010 2009
Valuation expenses 184 117
Audit fees 101 108
Amortisation of finance costs (note 14) 944 479
Listing of zero dividend preference shares 245 -
Rugby operating expenses 630 -
Other expenses 1,180 2,315
3,284 3,019
Audit fees for the year ended 31 December 2010 include an over accrual relating to the prior year of £27,000.
The Group has no employees other than the Directors. See the Corporate Governance Report for details of Directors’ emoluments.
8. FINANCE COSTS/ INCOME
In thousands of pounds 2010 2009
Interest receivable from financial assets that are not at fair value through profit or loss 235 311
Interest payable on loans at amortised cost (10,292) (10,399)
Realised (losses)/ gains on disposal of interest rate swaps (767) 259
Realised gains on disposal of loan notes 976 -
Unrealised (losses)/ gains on revaluation of interest rate swaps at fair value through profit or loss (note 23)
(839) 363
(10,687) (9,466)
As a result of loan note repayments made during the year (see note 17) interest rate swaps were partly closed resulting in a breakage cost of £2,858,000, representing a loss of £767,000 compared to their prior year liability.
9. TAX The charge for the year is:
In thousands of pounds 2010 2009
UK corporation tax at 28% 318 -
UK income tax at 20% 22 8
340 8
For the year ending 31 December 2010 there was an income tax liability of £22,000 in respect of ING (UK) Listed Real Estate Limited (31 December 2009: £8,000), and a corporation tax liability of £318,000 in respect of Rugby REIT (31 December 2009: nil). (See note 12).
The Group is exempt from Guernsey taxation. The Directors conduct the affairs of the Group such that the management and control of the Group is not exercised in the United Kingdom and that the Group does not carry on a trade in the United Kingdom.
The Group is subject to United Kingdom taxation on income arising on the investment properties and intra-group loans after deduction of allowable debt financing costs and allowable expenses. The Group has not recognised a deferred tax asset arising as a result of the tax loss carried forward. This will only be utilised if the Group has profits chargeable to income tax in the future.
HMRC has opened enquiries into the tax returns for ING Real Estate Trust (Property) Limited and ING Real Estate Trust (Property) No.2 Limited for the tax years 2007/08 and 2008/09. No provisions have been made in the accounts as the outcome of these enquiries is yet to be agreed. The relevant companies have cumulative tax losses which may be applied to any tax liabilities that may arise in the future.
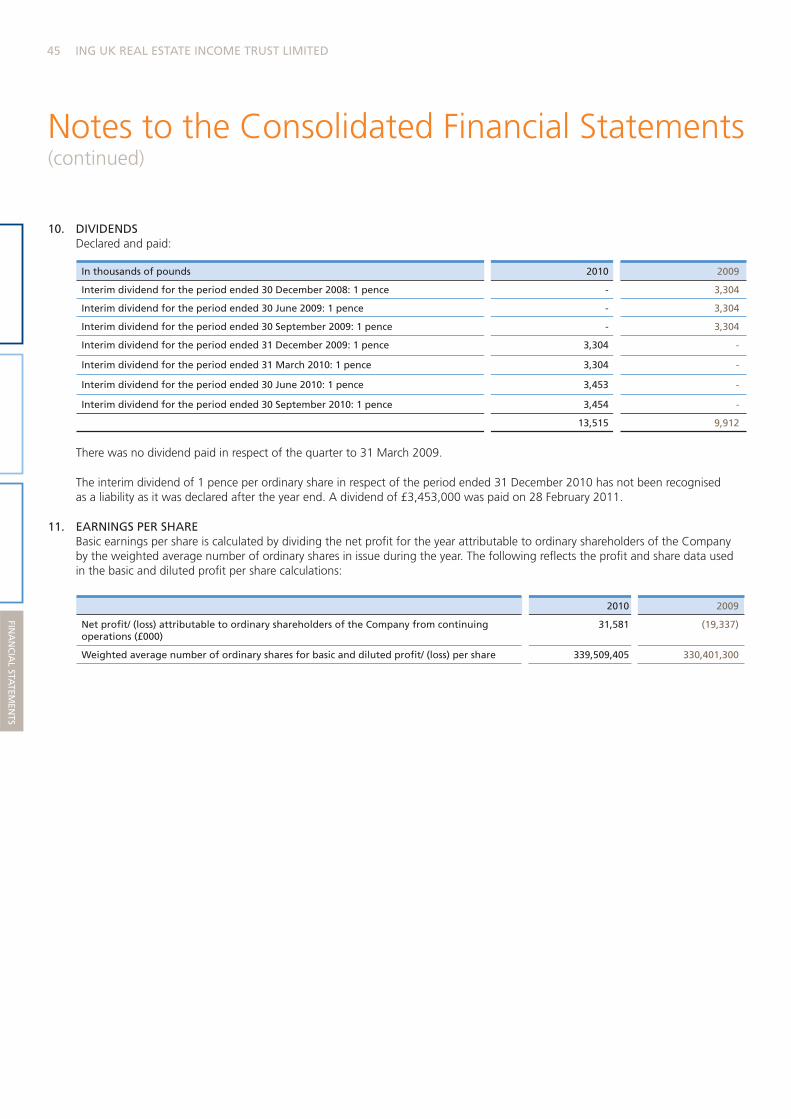
45 ING UK REAL ESTATE INCOME TRUST LIMITED
FINA
NC
IAL STA
TEMEN
TS
10. DIVIDENDS Declared and paid:
In thousands of pounds 2010 2009
Interim dividend for the period ended 30 December 2008: 1 pence - 3,304
Interim dividend for the period ended 30 June 2009: 1 pence - 3,304
Interim dividend for the period ended 30 September 2009: 1 pence - 3,304
Interim dividend for the period ended 31 December 2009: 1 pence 3,304 -
Interim dividend for the period ended 31 March 2010: 1 pence 3,304 -
Interim dividend for the period ended 30 June 2010: 1 pence 3,453 -
Interim dividend for the period ended 30 September 2010: 1 pence 3,454 -
13,515 9,912
There was no dividend paid in respect of the quarter to 31 March 2009.
The interim dividend of 1 pence per ordinary share in respect of the period ended 31 December 2010 has not been recognised as a liability as it was declared after the year end. A dividend of £3,453,000 was paid on 28 February 2011.
11. EARNINGS PER SHARE Basic earnings per share is calculated by dividing the net profit for the year attributable to ordinary shareholders of the Company
by the weighted average number of ordinary shares in issue during the year. The following reflects the profit and share data used in the basic and diluted profit per share calculations:
2010 2009
Net profit/ (loss) attributable to ordinary shareholders of the Company from continuing operations (£000)
31,581 (19,337)
Weighted average number of ordinary shares for basic and diluted profit/ (loss) per share 339,509,405 330,401,300
(continued)Notes to the Consolidated Financial Statements
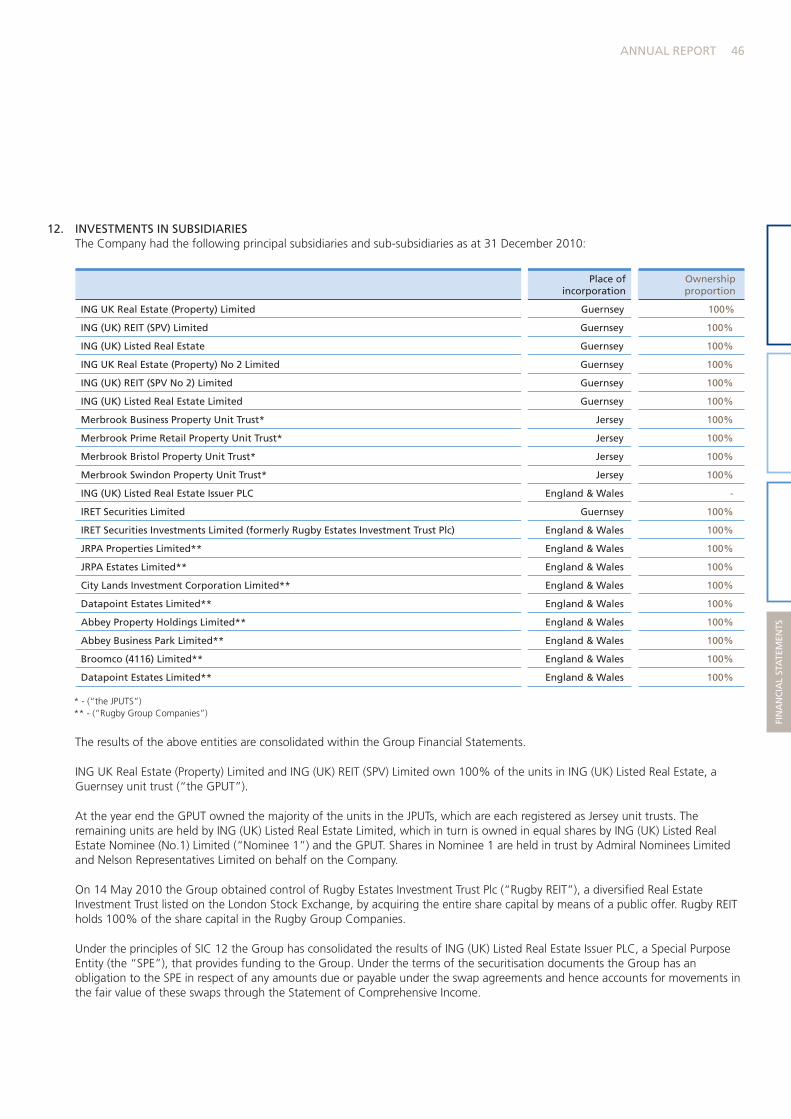
46ANNUAL REPORT
FIN
AN
CIA
L ST
ATE
MEN
TS
12. INVESTMENTS IN SUBSIDIARIES The Company had the following principal subsidiaries and sub-subsidiaries as at 31 December 2010:
Place of incorporation
Ownership proportion
ING UK Real Estate (Property) Limited Guernsey 100%
ING (UK) REIT (SPV) Limited Guernsey 100%
ING (UK) Listed Real Estate Guernsey 100%
ING UK Real Estate (Property) No 2 Limited Guernsey 100%
ING (UK) REIT (SPV No 2) Limited Guernsey 100%
ING (UK) Listed Real Estate Limited Guernsey 100%
Merbrook Business Property Unit Trust* Jersey 100%
Merbrook Prime Retail Property Unit Trust* Jersey 100%
Merbrook Bristol Property Unit Trust* Jersey 100%
Merbrook Swindon Property Unit Trust* Jersey 100%
ING (UK) Listed Real Estate Issuer PLC England & Wales -
IRET Securities Limited Guernsey 100%
IRET Securities Investments Limited (formerly Rugby Estates Investment Trust Plc) England & Wales 100%
JRPA Properties Limited** England & Wales 100%
JRPA Estates Limited** England & Wales 100%
City Lands Investment Corporation Limited** England & Wales 100%
Datapoint Estates Limited** England & Wales 100%
Abbey Property Holdings Limited** England & Wales 100%
Abbey Business Park Limited** England & Wales 100%
Broomco (4116) Limited** England & Wales 100%
Datapoint Estates Limited** England & Wales 100%
* - (“the JPUTS”) ** - (“Rugby Group Companies”)
The results of the above entities are consolidated within the Group Financial Statements.
ING UK Real Estate (Property) Limited and ING (UK) REIT (SPV) Limited own 100% of the units in ING (UK) Listed Real Estate, a Guernsey unit trust (“the GPUT”).
At the year end the GPUT owned the majority of the units in the JPUTs, which are each registered as Jersey unit trusts. The remaining units are held by ING (UK) Listed Real Estate Limited, which in turn is owned in equal shares by ING (UK) Listed Real Estate Nominee (No.1) Limited (“Nominee 1”) and the GPUT. Shares in Nominee 1 are held in trust by Admiral Nominees Limited and Nelson Representatives Limited on behalf on the Company.
On 14 May 2010 the Group obtained control of Rugby Estates Investment Trust Plc (“Rugby REIT”), a diversified Real Estate Investment Trust listed on the London Stock Exchange, by acquiring the entire share capital by means of a public offer. Rugby REIT holds 100% of the share capital in the Rugby Group Companies.
Under the principles of SIC 12 the Group has consolidated the results of ING (UK) Listed Real Estate Issuer PLC, a Special Purpose Entity (the “SPE”), that provides funding to the Group. Under the terms of the securitisation documents the Group has an obligation to the SPE in respect of any amounts due or payable under the swap agreements and hence accounts for movements in the fair value of these swaps through the Statement of Comprehensive Income.
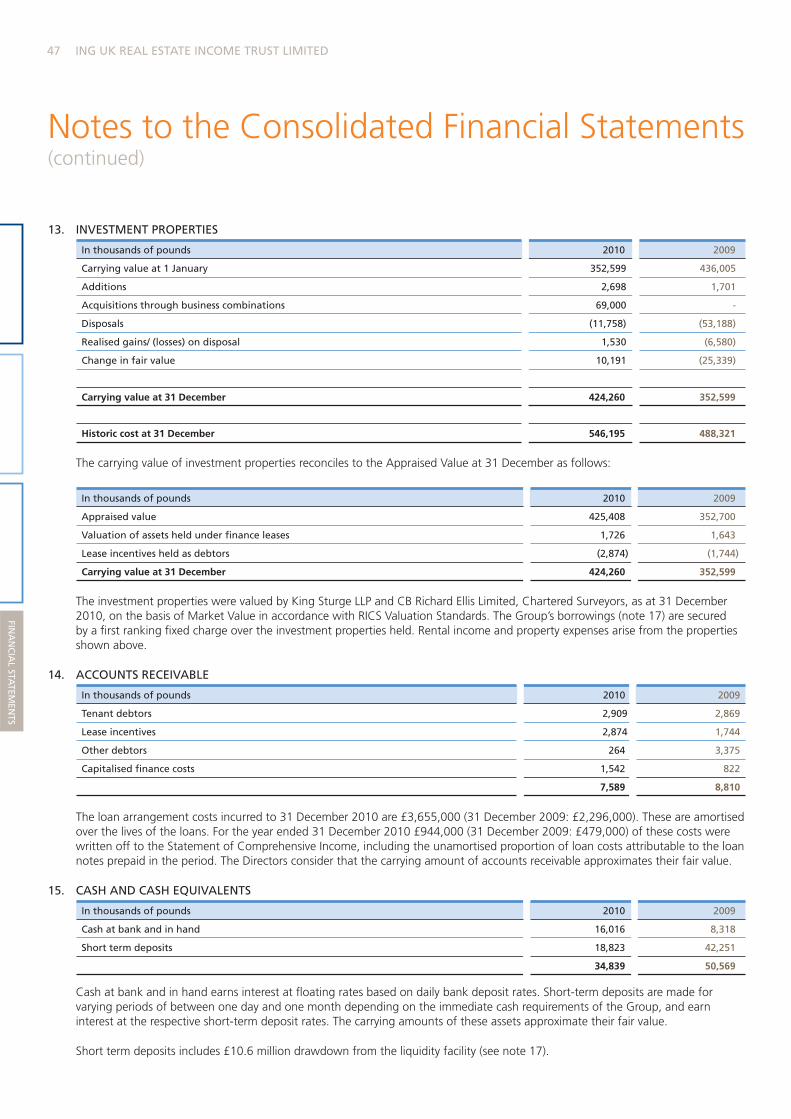
47 ING UK REAL ESTATE INCOME TRUST LIMITED
FINA
NC
IAL STA
TEMEN
TS
13. INVESTMENT PROPERTIES
In thousands of pounds 2010 2009
Carrying value at 1 January 352,599 436,005
Additions 2,698 1,701
Acquisitions through business combinations 69,000 -
Disposals (11,758) (53,188)
Realised gains/ (losses) on disposal 1,530 (6,580)
Change in fair value 10,191 (25,339)
Carrying value at 31 December 424,260 352,599
Historic cost at 31 December 546,195 488,321
The carrying value of investment properties reconciles to the Appraised Value at 31 December as follows:
In thousands of pounds 2010 2009
Appraised value 425,408 352,700
Valuation of assets held under finance leases 1,726 1,643
Lease incentives held as debtors (2,874) (1,744)
Carrying value at 31 December 424,260 352,599
The investment properties were valued by King Sturge LLP and CB Richard Ellis Limited, Chartered Surveyors, as at 31 December 2010, on the basis of Market Value in accordance with RICS Valuation Standards. The Group’s borrowings (note 17) are secured by a first ranking fixed charge over the investment properties held. Rental income and property expenses arise from the properties shown above.
14. ACCOUNTS RECEIVABLE
In thousands of pounds 2010 2009
Tenant debtors 2,909 2,869
Lease incentives 2,874 1,744
Other debtors 264 3,375
Capitalised finance costs 1,542 822
7,589 8,810
The loan arrangement costs incurred to 31 December 2010 are £3,655,000 (31 December 2009: £2,296,000). These are amortised over the lives of the loans. For the year ended 31 December 2010 £944,000 (31 December 2009: £479,000) of these costs were written off to the Statement of Comprehensive Income, including the unamortised proportion of loan costs attributable to the loan notes prepaid in the period. The Directors consider that the carrying amount of accounts receivable approximates their fair value.
15. CASH AND CASH EQUIVALENTS
In thousands of pounds 2010 2009
Cash at bank and in hand 16,016 8,318
Short term deposits 18,823 42,251
34,839 50,569
Cash at bank and in hand earns interest at floating rates based on daily bank deposit rates. Short-term deposits are made for varying periods of between one day and one month depending on the immediate cash requirements of the Group, and earn interest at the respective short-term deposit rates. The carrying amounts of these assets approximate their fair value.
Short term deposits includes £10.6 million drawdown from the liquidity facility (see note 17).
(continued)Notes to the Consolidated Financial Statements
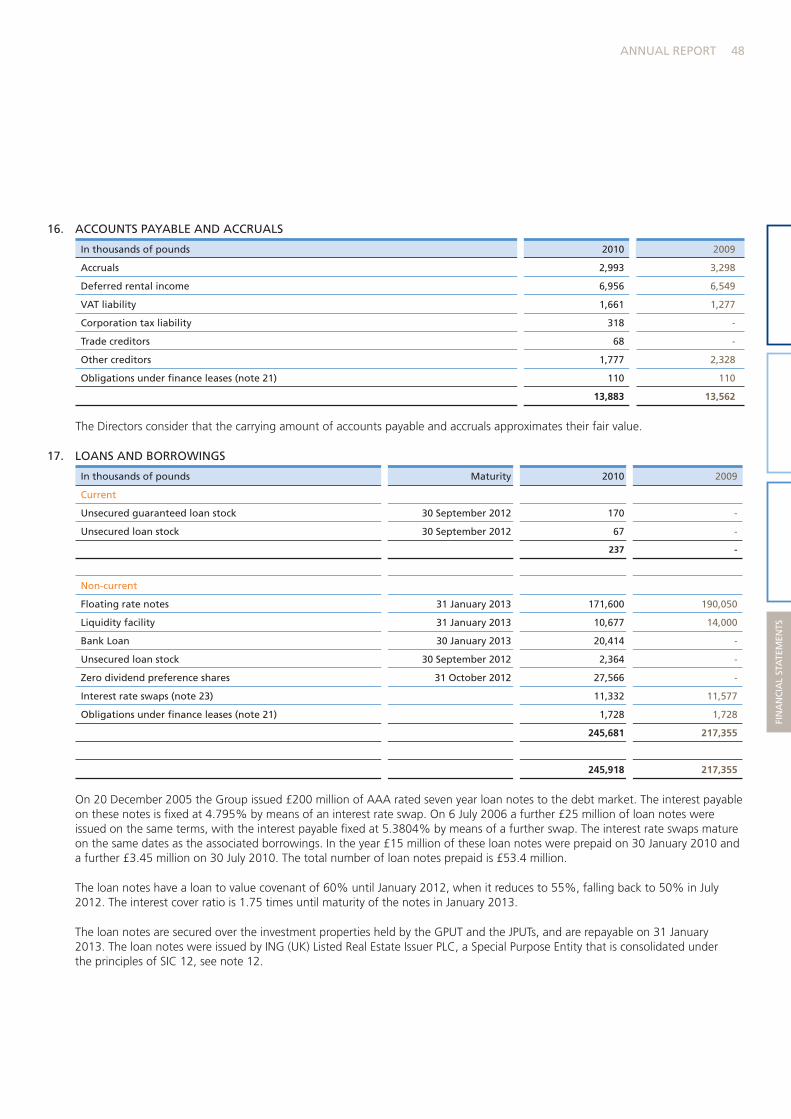
48ANNUAL REPORT
FIN
AN
CIA
L ST
ATE
MEN
TS
16. ACCOUNTS PAYABLE AND ACCRUALS
In thousands of pounds 2010 2009
Accruals 2,993 3,298
Deferred rental income 6,956 6,549
VAT liability 1,661 1,277
Corporation tax liability 318 -
Trade creditors 68 -
Other creditors 1,777 2,328
Obligations under finance leases (note 21) 110 110
13,883 13,562
The Directors consider that the carrying amount of accounts payable and accruals approximates their fair value.
17. LOANS AND BORROWINGS
In thousands of pounds Maturity 2010 2009
Current
Unsecured guaranteed loan stock 30 September 2012 170 -
Unsecured loan stock 30 September 2012 67 -
237 -
Non-current
Floating rate notes 31 January 2013 171,600 190,050
Liquidity facility 31 January 2013 10,677 14,000
Bank Loan 30 January 2013 20,414 -
Unsecured loan stock 30 September 2012 2,364 -
Zero dividend preference shares 31 October 2012 27,566 -
Interest rate swaps (note 23) 11,332 11,577
Obligations under finance leases (note 21) 1,728 1,728
245,681 217,355
245,918 217,355
On 20 December 2005 the Group issued £200 million of AAA rated seven year loan notes to the debt market. The interest payable on these notes is fixed at 4.795% by means of an interest rate swap. On 6 July 2006 a further £25 million of loan notes were issued on the same terms, with the interest payable fixed at 5.3804% by means of a further swap. The interest rate swaps mature on the same dates as the associated borrowings. In the year £15 million of these loan notes were prepaid on 30 January 2010 and a further £3.45 million on 30 July 2010. The total number of loan notes prepaid is £53.4 million.
The loan notes have a loan to value covenant of 60% until January 2012, when it reduces to 55%, falling back to 50% in July 2012. The interest cover ratio is 1.75 times until maturity of the notes in January 2013.
The loan notes are secured over the investment properties held by the GPUT and the JPUTs, and are repayable on 31 January 2013. The loan notes were issued by ING (UK) Listed Real Estate Issuer PLC, a Special Purpose Entity that is consolidated under the principles of SIC 12, see note 12.
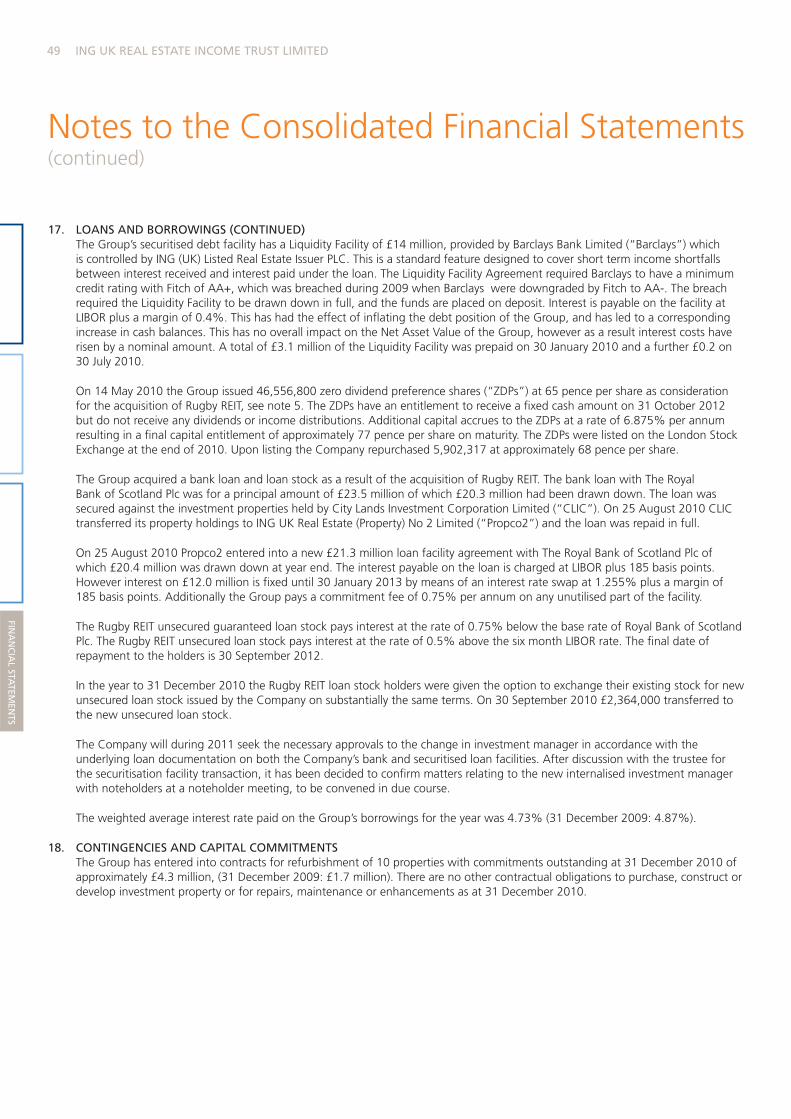
49 ING UK REAL ESTATE INCOME TRUST LIMITED
FINA
NC
IAL STA
TEMEN
TS
17. LOANS AND BORROWINGS (CONTINUED) The Group’s securitised debt facility has a Liquidity Facility of £14 million, provided by Barclays Bank Limited (“Barclays”) which
is controlled by ING (UK) Listed Real Estate Issuer PLC. This is a standard feature designed to cover short term income shortfalls between interest received and interest paid under the loan. The Liquidity Facility Agreement required Barclays to have a minimum credit rating with Fitch of AA+, which was breached during 2009 when Barclays were downgraded by Fitch to AA-. The breach required the Liquidity Facility to be drawn down in full, and the funds are placed on deposit. Interest is payable on the facility at LIBOR plus a margin of 0.4%. This has had the effect of inflating the debt position of the Group, and has led to a corresponding increase in cash balances. This has no overall impact on the Net Asset Value of the Group, however as a result interest costs have risen by a nominal amount. A total of £3.1 million of the Liquidity Facility was prepaid on 30 January 2010 and a further £0.2 on 30 July 2010.
On 14 May 2010 the Group issued 46,556,800 zero dividend preference shares (“ZDPs”) at 65 pence per share as consideration for the acquisition of Rugby REIT, see note 5. The ZDPs have an entitlement to receive a fixed cash amount on 31 October 2012 but do not receive any dividends or income distributions. Additional capital accrues to the ZDPs at a rate of 6.875% per annum resulting in a final capital entitlement of approximately 77 pence per share on maturity. The ZDPs were listed on the London Stock Exchange at the end of 2010. Upon listing the Company repurchased 5,902,317 at approximately 68 pence per share.
The Group acquired a bank loan and loan stock as a result of the acquisition of Rugby REIT. The bank loan with The Royal Bank of Scotland Plc was for a principal amount of £23.5 million of which £20.3 million had been drawn down. The loan was secured against the investment properties held by City Lands Investment Corporation Limited (“CLIC”). On 25 August 2010 CLIC transferred its property holdings to ING UK Real Estate (Property) No 2 Limited (“Propco2”) and the loan was repaid in full.
On 25 August 2010 Propco2 entered into a new £21.3 million loan facility agreement with The Royal Bank of Scotland Plc of which £20.4 million was drawn down at year end. The interest payable on the loan is charged at LIBOR plus 185 basis points. However interest on £12.0 million is fixed until 30 January 2013 by means of an interest rate swap at 1.255% plus a margin of 185 basis points. Additionally the Group pays a commitment fee of 0.75% per annum on any unutilised part of the facility.
The Rugby REIT unsecured guaranteed loan stock pays interest at the rate of 0.75% below the base rate of Royal Bank of Scotland Plc. The Rugby REIT unsecured loan stock pays interest at the rate of 0.5% above the six month LIBOR rate. The final date of repayment to the holders is 30 September 2012.
In the year to 31 December 2010 the Rugby REIT loan stock holders were given the option to exchange their existing stock for new unsecured loan stock issued by the Company on substantially the same terms. On 30 September 2010 £2,364,000 transferred to the new unsecured loan stock.
The Company will during 2011 seek the necessary approvals to the change in investment manager in accordance with the underlying loan documentation on both the Company’s bank and securitised loan facilities. After discussion with the trustee for the securitisation facility transaction, it has been decided to confirm matters relating to the new internalised investment manager with noteholders at a noteholder meeting, to be convened in due course.
The weighted average interest rate paid on the Group’s borrowings for the year was 4.73% (31 December 2009: 4.87%).
18. CONTINGENCIES AND CAPITAL COMMITMENTS The Group has entered into contracts for refurbishment of 10 properties with commitments outstanding at 31 December 2010 of
approximately £4.3 million, (31 December 2009: £1.7 million). There are no other contractual obligations to purchase, construct or develop investment property or for repairs, maintenance or enhancements as at 31 December 2010.
(continued)Notes to the Consolidated Financial Statements
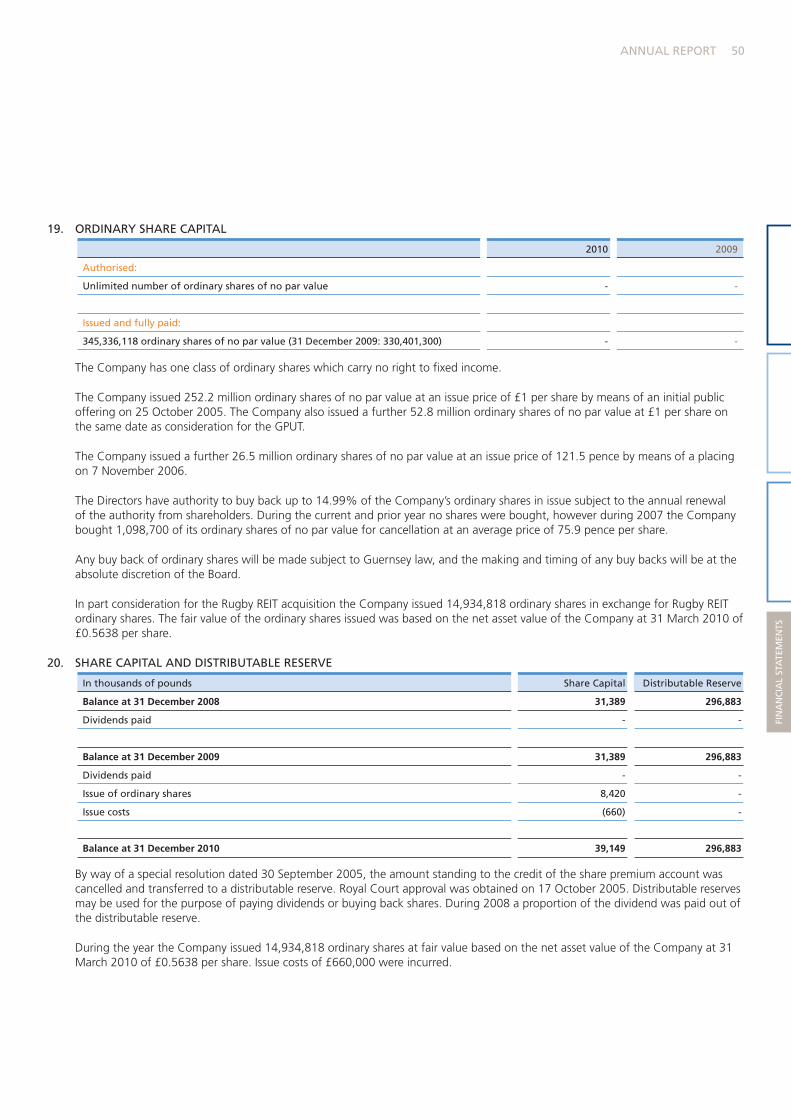
50ANNUAL REPORT
FIN
AN
CIA
L ST
ATE
MEN
TS
19. ORDINARY SHARE CAPITAL
2010 2009
Authorised:
Unlimited number of ordinary shares of no par value - -
Issued and fully paid:
345,336,118 ordinary shares of no par value (31 December 2009: 330,401,300) - -
The Company has one class of ordinary shares which carry no right to fixed income.
The Company issued 252.2 million ordinary shares of no par value at an issue price of £1 per share by means of an initial public offering on 25 October 2005. The Company also issued a further 52.8 million ordinary shares of no par value at £1 per share on the same date as consideration for the GPUT.
The Company issued a further 26.5 million ordinary shares of no par value at an issue price of 121.5 pence by means of a placing on 7 November 2006.
The Directors have authority to buy back up to 14.99% of the Company’s ordinary shares in issue subject to the annual renewal of the authority from shareholders. During the current and prior year no shares were bought, however during 2007 the Company bought 1,098,700 of its ordinary shares of no par value for cancellation at an average price of 75.9 pence per share.
Any buy back of ordinary shares will be made subject to Guernsey law, and the making and timing of any buy backs will be at the absolute discretion of the Board.
In part consideration for the Rugby REIT acquisition the Company issued 14,934,818 ordinary shares in exchange for Rugby REIT ordinary shares. The fair value of the ordinary shares issued was based on the net asset value of the Company at 31 March 2010 of £0.5638 per share.
20. SHARE CAPITAL AND DISTRIBUTABLE RESERVE
In thousands of pounds Share Capital Distributable Reserve
Balance at 31 December 2008 31,389 296,883
Dividends paid - -
Balance at 31 December 2009 31,389 296,883
Dividends paid - -
Issue of ordinary shares 8,420 -
Issue costs (660) -
Balance at 31 December 2010 39,149 296,883
By way of a special resolution dated 30 September 2005, the amount standing to the credit of the share premium account was cancelled and transferred to a distributable reserve. Royal Court approval was obtained on 17 October 2005. Distributable reserves may be used for the purpose of paying dividends or buying back shares. During 2008 a proportion of the dividend was paid out of the distributable reserve.
During the year the Company issued 14,934,818 ordinary shares at fair value based on the net asset value of the Company at 31 March 2010 of £0.5638 per share. Issue costs of £660,000 were incurred.
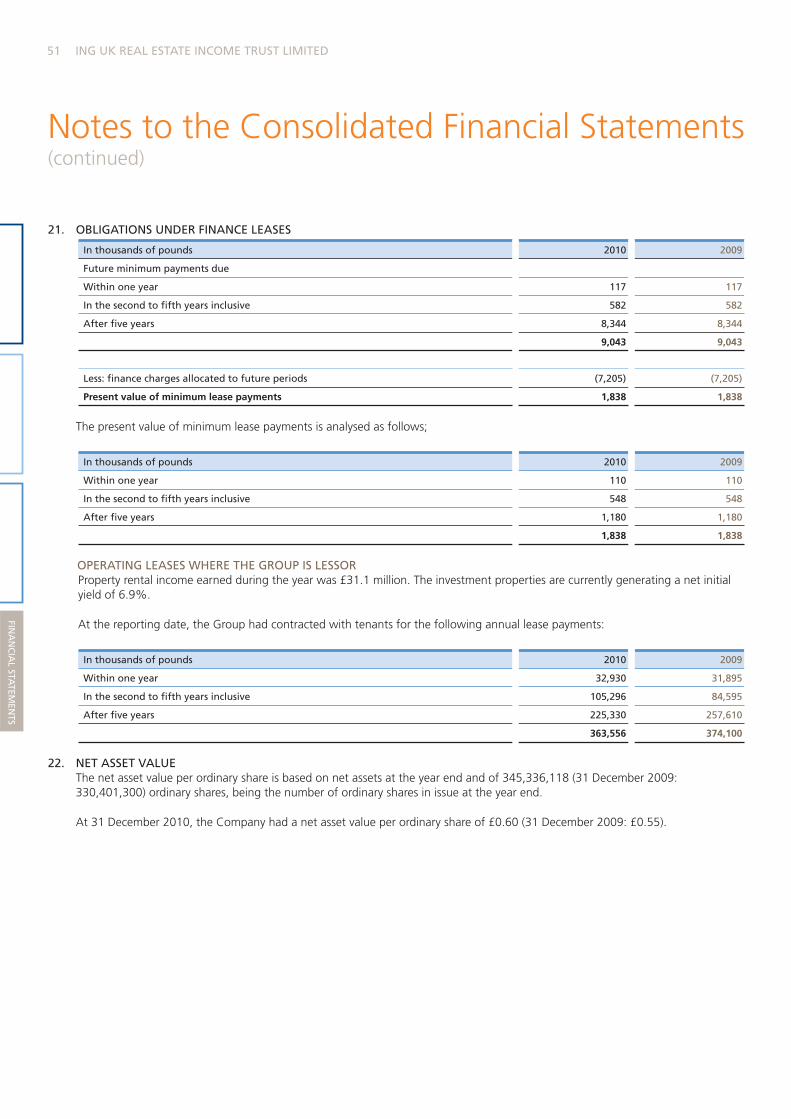
51 ING UK REAL ESTATE INCOME TRUST LIMITED
FINA
NC
IAL STA
TEMEN
TS
21. OBLIGATIONS UNDER FINANCE LEASES
In thousands of pounds 2010 2009
Future minimum payments due
Within one year 117 117
In the second to fifth years inclusive 582 582
After five years 8,344 8,344
9,043 9,043
Less: finance charges allocated to future periods (7,205) (7,205)
Present value of minimum lease payments 1,838 1,838
The present value of minimum lease payments is analysed as follows;
In thousands of pounds 2010 2009
Within one year 110 110
In the second to fifth years inclusive 548 548
After five years 1,180 1,180
1,838 1,838
OPERATING LEASES WHERE THE GROUP IS LESSOR Property rental income earned during the year was £31.1 million. The investment properties are currently generating a net initial
yield of 6.9%.
At the reporting date, the Group had contracted with tenants for the following annual lease payments:
In thousands of pounds 2010 2009
Within one year 32,930 31,895
In the second to fifth years inclusive 105,296 84,595
After five years 225,330 257,610
363,556 374,100
22. NET ASSET VALUE The net asset value per ordinary share is based on net assets at the year end and of 345,336,118 (31 December 2009:
330,401,300) ordinary shares, being the number of ordinary shares in issue at the year end.
At 31 December 2010, the Company had a net asset value per ordinary share of £0.60 (31 December 2009: £0.55).
(continued)Notes to the Consolidated Financial Statements
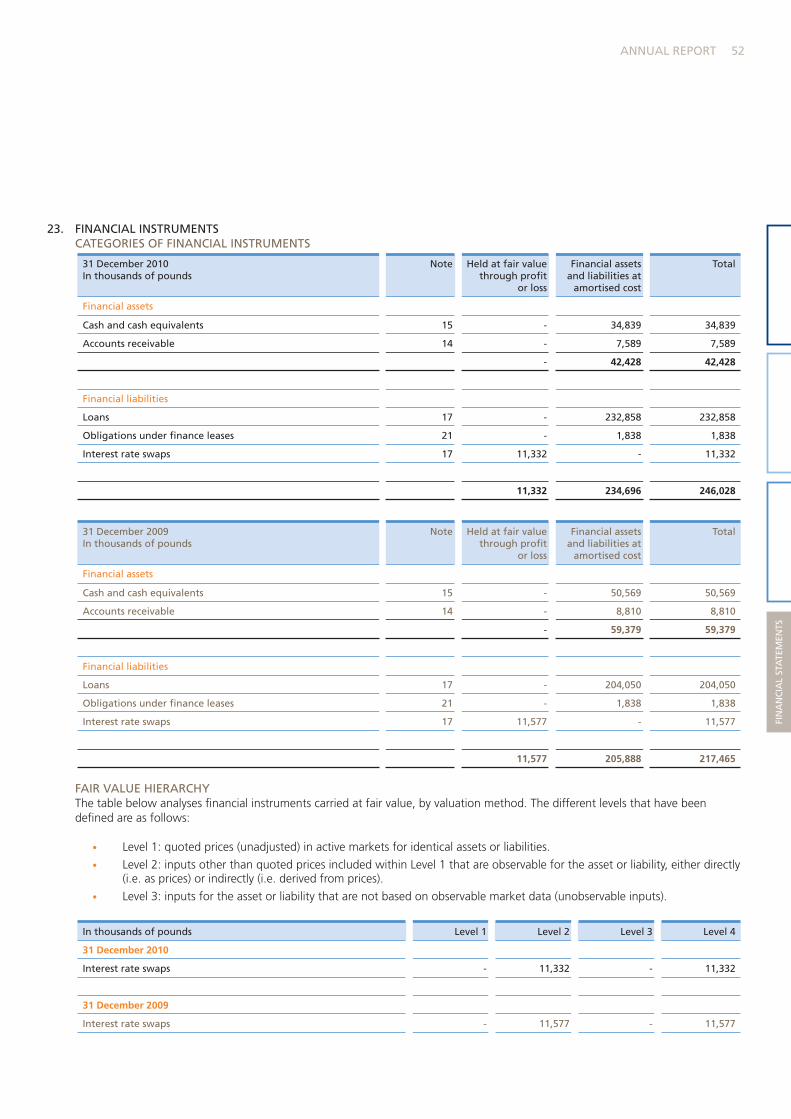
52ANNUAL REPORT
FIN
AN
CIA
L ST
ATE
MEN
TS
23. FINANCIAL INSTRUMENTS CATEGORIES OF FINANCIAL INSTRUMENTS
31 December 2010 In thousands of pounds
Note Held at fair value through profit
or loss
Financial assets and liabilities at
amortised cost
Total
Financial assets
Cash and cash equivalents 15 - 34,839 34,839
Accounts receivable 14 - 7,589 7,589
- 42,428 42,428
Financial liabilities
Loans 17 - 232,858 232,858
Obligations under finance leases 21 - 1,838 1,838
Interest rate swaps 17 11,332 - 11,332
11,332 234,696 246,028
31 December 2009 In thousands of pounds
Note Held at fair value through profit
or loss
Financial assets and liabilities at
amortised cost
Total
Financial assets
Cash and cash equivalents 15 - 50,569 50,569
Accounts receivable 14 - 8,810 8,810
- 59,379 59,379
Financial liabilities
Loans 17 - 204,050 204,050
Obligations under finance leases 21 - 1,838 1,838
Interest rate swaps 17 11,577 - 11,577
11,577 205,888 217,465
FAIR VALUE HIERARCHY The table below analyses financial instruments carried at fair value, by valuation method. The different levels that have been
defined are as follows:
• Level 1: quoted prices (unadjusted) in active markets for identical assets or liabilities.
• Level 2: inputs other than quoted prices included within Level 1 that are observable for the asset or liability, either directly (i.e. as prices) or indirectly (i.e. derived from prices).
• Level 3: inputs for the asset or liability that are not based on observable market data (unobservable inputs).
In thousands of pounds Level 1 Level 2 Level 3 Level 4
31 December 2010
Interest rate swaps - 11,332 - 11,332
31 December 2009
Interest rate swaps - 11,577 - 11,577
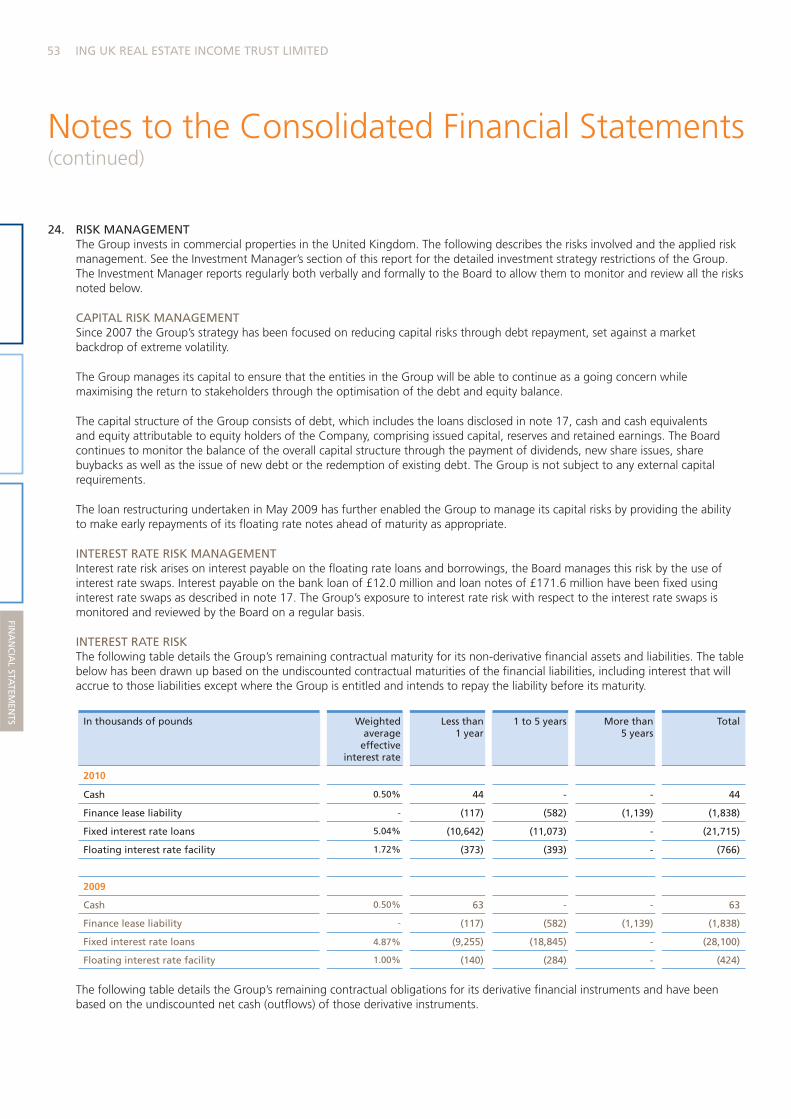
53 ING UK REAL ESTATE INCOME TRUST LIMITED
FINA
NC
IAL STA
TEMEN
TS
24. RISK MANAGEMENT The Group invests in commercial properties in the United Kingdom. The following describes the risks involved and the applied risk
management. See the Investment Manager’s section of this report for the detailed investment strategy restrictions of the Group. The Investment Manager reports regularly both verbally and formally to the Board to allow them to monitor and review all the risks noted below.
CAPITAL RISK MANAGEMENT Since 2007 the Group’s strategy has been focused on reducing capital risks through debt repayment, set against a market
backdrop of extreme volatility.
The Group manages its capital to ensure that the entities in the Group will be able to continue as a going concern while maximising the return to stakeholders through the optimisation of the debt and equity balance.
The capital structure of the Group consists of debt, which includes the loans disclosed in note 17, cash and cash equivalents and equity attributable to equity holders of the Company, comprising issued capital, reserves and retained earnings. The Board continues to monitor the balance of the overall capital structure through the payment of dividends, new share issues, share buybacks as well as the issue of new debt or the redemption of existing debt. The Group is not subject to any external capital requirements.
The loan restructuring undertaken in May 2009 has further enabled the Group to manage its capital risks by providing the ability to make early repayments of its floating rate notes ahead of maturity as appropriate.
INTEREST RATE RISK MANAGEMENT Interest rate risk arises on interest payable on the floating rate loans and borrowings, the Board manages this risk by the use of
interest rate swaps. Interest payable on the bank loan of £12.0 million and loan notes of £171.6 million have been fixed using interest rate swaps as described in note 17. The Group’s exposure to interest rate risk with respect to the interest rate swaps is monitored and reviewed by the Board on a regular basis.
INTEREST RATE RISK The following table details the Group’s remaining contractual maturity for its non-derivative financial assets and liabilities. The table
below has been drawn up based on the undiscounted contractual maturities of the financial liabilities, including interest that will accrue to those liabilities except where the Group is entitled and intends to repay the liability before its maturity.
In thousands of pounds Weighted average
effectiveinterest rate
Less than 1 year
1 to 5 years More than 5 years
Total
2010
Cash 0.50% 44 - - 44
Finance lease liability - (117) (582) (1,139) (1,838)
Fixed interest rate loans 5.04% (10,642) (11,073) - (21,715)
Floating interest rate facility 1.72% (373) (393) - (766)
2009
Cash 0.50% 63 - - 63
Finance lease liability - (117) (582) (1,139) (1,838)
Fixed interest rate loans 4.87% (9,255) (18,845) - (28,100)
Floating interest rate facility 1.00% (140) (284) - (424)
The following table details the Group’s remaining contractual obligations for its derivative financial instruments and have been based on the undiscounted net cash (outflows) of those derivative instruments.
(continued)Notes to the Consolidated Financial Statements
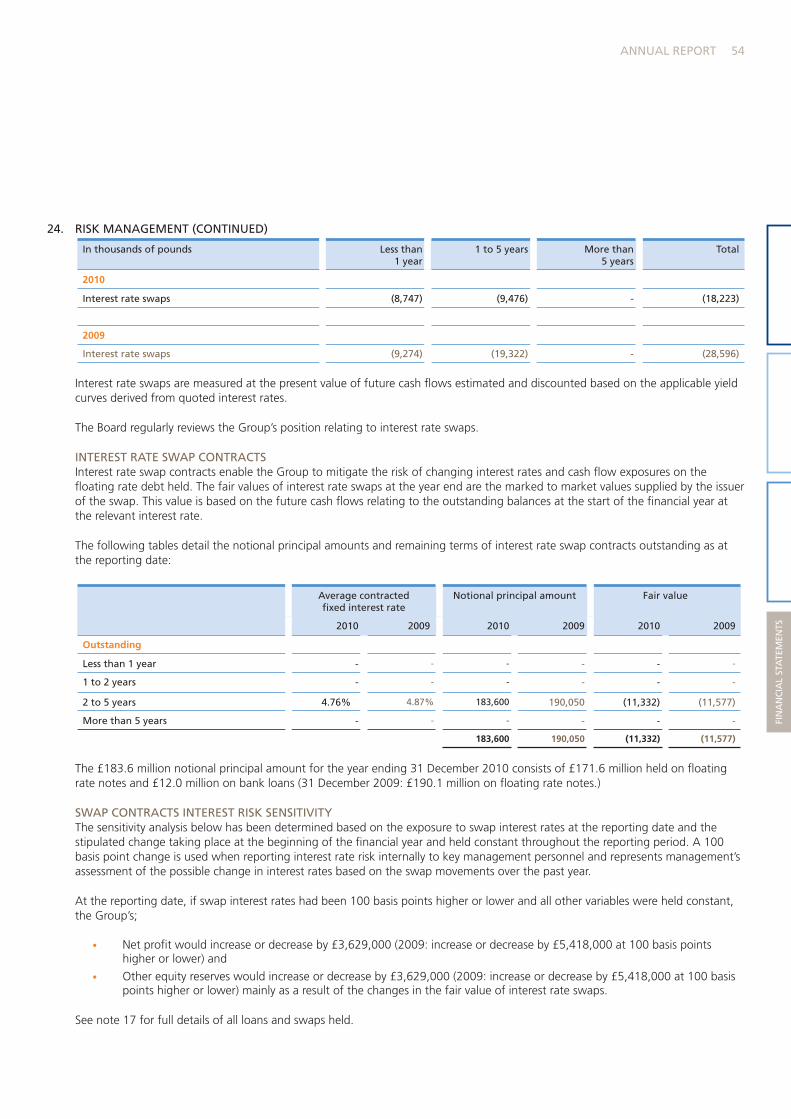
54ANNUAL REPORT
FIN
AN
CIA
L ST
ATE
MEN
TS
24. RISK MANAGEMENT (CONTINUED)
In thousands of pounds Less than 1 year
1 to 5 years More than 5 years
Total
2010
Interest rate swaps (8,747) (9,476) - (18,223)
2009
Interest rate swaps (9,274) (19,322) - (28,596)
Interest rate swaps are measured at the present value of future cash flows estimated and discounted based on the applicable yield curves derived from quoted interest rates.
The Board regularly reviews the Group’s position relating to interest rate swaps.
INTEREST RATE SWAP CONTRACTS Interest rate swap contracts enable the Group to mitigate the risk of changing interest rates and cash flow exposures on the
floating rate debt held. The fair values of interest rate swaps at the year end are the marked to market values supplied by the issuer of the swap. This value is based on the future cash flows relating to the outstanding balances at the start of the financial year at the relevant interest rate.
The following tables detail the notional principal amounts and remaining terms of interest rate swap contracts outstanding as at the reporting date:
Average contracted fixed interest rate
Notional principal amount Fair value
2010 2009 2010 2009 2010 2009
Outstanding
Less than 1 year - - - - - -
1 to 2 years - - - - - -
2 to 5 years 4.76% 4.87% 183,600 190,050 (11,332) (11,577)
More than 5 years - - - - - -
183,600 190,050 (11,332) (11,577)
The £183.6 million notional principal amount for the year ending 31 December 2010 consists of £171.6 million held on floating rate notes and £12.0 million on bank loans (31 December 2009: £190.1 million on floating rate notes.)
SWAP CONTRACTS INTEREST RISK SENSITIVITY The sensitivity analysis below has been determined based on the exposure to swap interest rates at the reporting date and the
stipulated change taking place at the beginning of the financial year and held constant throughout the reporting period. A 100 basis point change is used when reporting interest rate risk internally to key management personnel and represents management’s assessment of the possible change in interest rates based on the swap movements over the past year.
At the reporting date, if swap interest rates had been 100 basis points higher or lower and all other variables were held constant, the Group’s;
• Net profit would increase or decrease by £3,629,000 (2009: increase or decrease by £5,418,000 at 100 basis points higher or lower) and
• Other equity reserves would increase or decrease by £3,629,000 (2009: increase or decrease by £5,418,000 at 100 basis points higher or lower) mainly as a result of the changes in the fair value of interest rate swaps.
See note 17 for full details of all loans and swaps held.
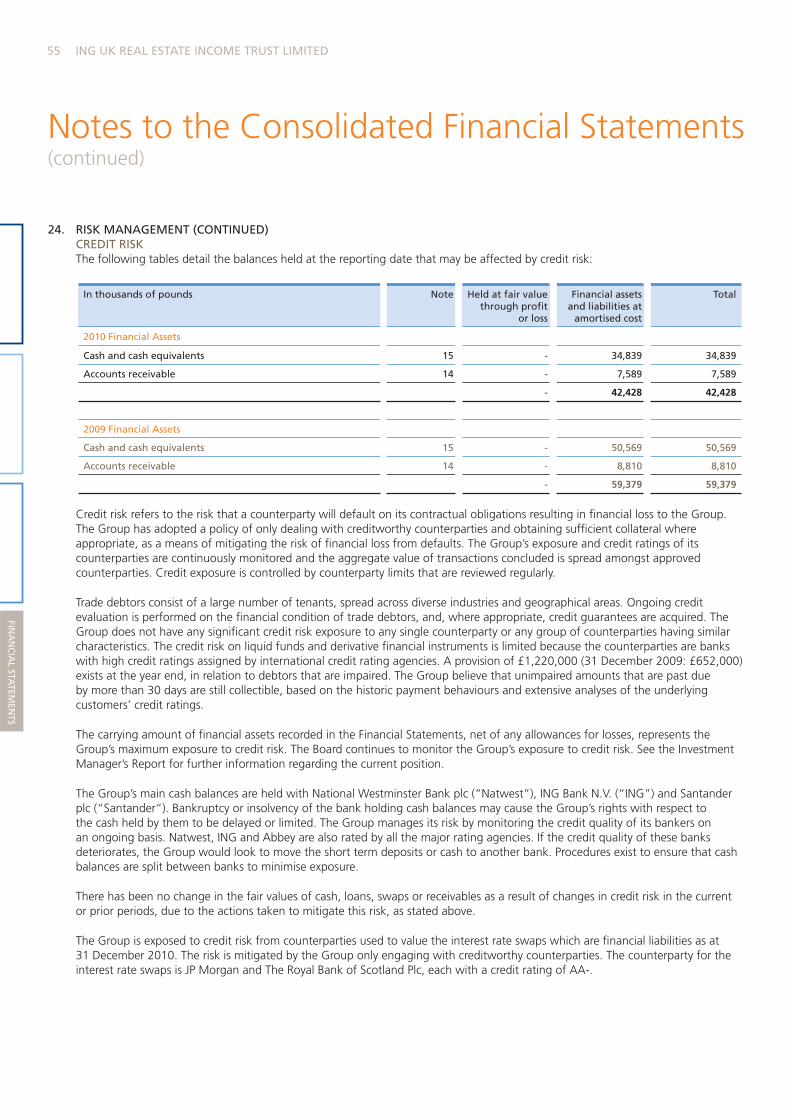
55 ING UK REAL ESTATE INCOME TRUST LIMITED
FINA
NC
IAL STA
TEMEN
TS
24. RISK MANAGEMENT (CONTINUED) CREDIT RISK The following tables detail the balances held at the reporting date that may be affected by credit risk:
In thousands of pounds Note Held at fair value through profit
or loss
Financial assets and liabilities at
amortised cost
Total
2010 Financial Assets
Cash and cash equivalents 15 - 34,839 34,839
Accounts receivable 14 - 7,589 7,589
- 42,428 42,428
2009 Financial Assets
Cash and cash equivalents 15 - 50,569 50,569
Accounts receivable 14 - 8,810 8,810
- 59,379 59,379
Credit risk refers to the risk that a counterparty will default on its contractual obligations resulting in financial loss to the Group. The Group has adopted a policy of only dealing with creditworthy counterparties and obtaining sufficient collateral where appropriate, as a means of mitigating the risk of financial loss from defaults. The Group’s exposure and credit ratings of its counterparties are continuously monitored and the aggregate value of transactions concluded is spread amongst approved counterparties. Credit exposure is controlled by counterparty limits that are reviewed regularly.
Trade debtors consist of a large number of tenants, spread across diverse industries and geographical areas. Ongoing credit evaluation is performed on the financial condition of trade debtors, and, where appropriate, credit guarantees are acquired. The Group does not have any significant credit risk exposure to any single counterparty or any group of counterparties having similar characteristics. The credit risk on liquid funds and derivative financial instruments is limited because the counterparties are banks with high credit ratings assigned by international credit rating agencies. A provision of £1,220,000 (31 December 2009: £652,000) exists at the year end, in relation to debtors that are impaired. The Group believe that unimpaired amounts that are past due by more than 30 days are still collectible, based on the historic payment behaviours and extensive analyses of the underlying customers’ credit ratings.
The carrying amount of financial assets recorded in the Financial Statements, net of any allowances for losses, represents the Group’s maximum exposure to credit risk. The Board continues to monitor the Group’s exposure to credit risk. See the Investment Manager’s Report for further information regarding the current position.
The Group’s main cash balances are held with National Westminster Bank plc (“Natwest”), ING Bank N.V. (“ING”) and Santander plc (“Santander”). Bankruptcy or insolvency of the bank holding cash balances may cause the Group’s rights with respect to the cash held by them to be delayed or limited. The Group manages its risk by monitoring the credit quality of its bankers on an ongoing basis. Natwest, ING and Abbey are also rated by all the major rating agencies. If the credit quality of these banks deteriorates, the Group would look to move the short term deposits or cash to another bank. Procedures exist to ensure that cash balances are split between banks to minimise exposure.
There has been no change in the fair values of cash, loans, swaps or receivables as a result of changes in credit risk in the current or prior periods, due to the actions taken to mitigate this risk, as stated above.
The Group is exposed to credit risk from counterparties used to value the interest rate swaps which are financial liabilities as at 31 December 2010. The risk is mitigated by the Group only engaging with creditworthy counterparties. The counterparty for the interest rate swaps is JP Morgan and The Royal Bank of Scotland Plc, each with a credit rating of AA-.
(continued)Notes to the Consolidated Financial Statements
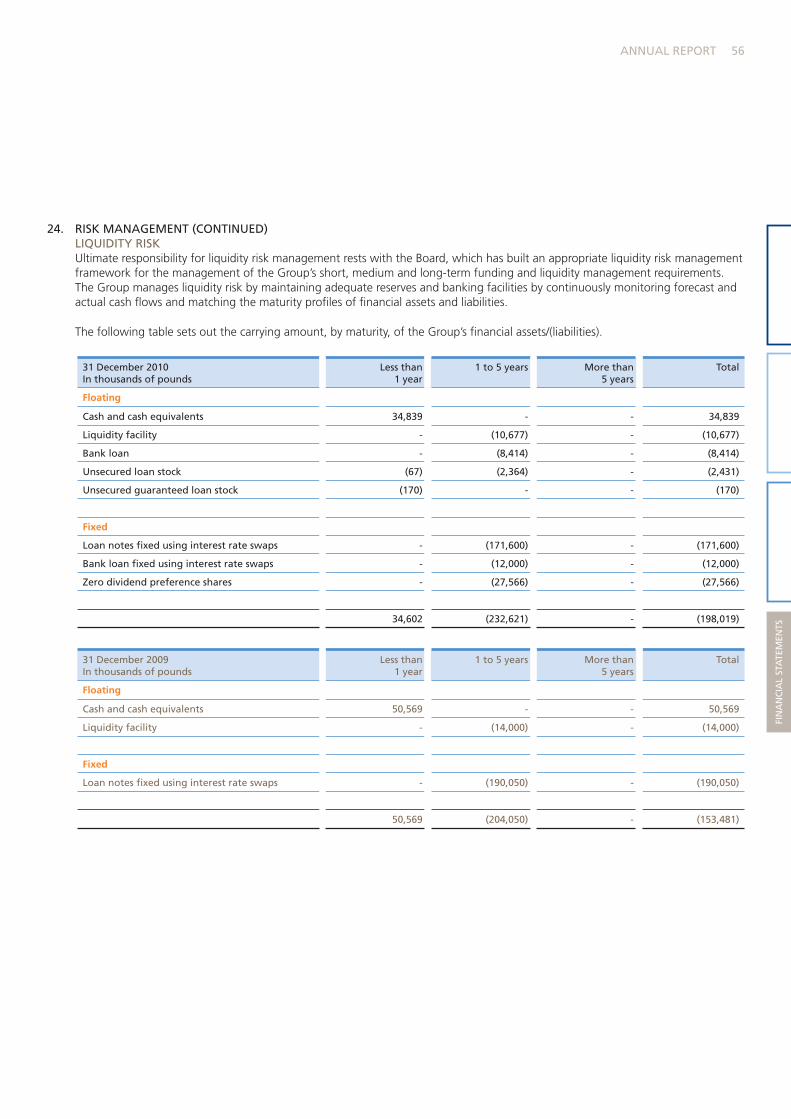
56ANNUAL REPORT
FIN
AN
CIA
L ST
ATE
MEN
TS
24. RISK MANAGEMENT (CONTINUED) LIQUIDITY RISK Ultimate responsibility for liquidity risk management rests with the Board, which has built an appropriate liquidity risk management
framework for the management of the Group’s short, medium and long-term funding and liquidity management requirements. The Group manages liquidity risk by maintaining adequate reserves and banking facilities by continuously monitoring forecast and actual cash flows and matching the maturity profiles of financial assets and liabilities.
The following table sets out the carrying amount, by maturity, of the Group’s financial assets/(liabilities).
31 December 2010 In thousands of pounds
Less than 1 year
1 to 5 years More than 5 years
Total
Floating
Cash and cash equivalents 34,839 - - 34,839
Liquidity facility - (10,677) - (10,677)
Bank loan - (8,414) - (8,414)
Unsecured loan stock (67) (2,364) - (2,431)
Unsecured guaranteed loan stock (170) - - (170)
Fixed
Loan notes fixed using interest rate swaps - (171,600) - (171,600)
Bank loan fixed using interest rate swaps - (12,000) - (12,000)
Zero dividend preference shares - (27,566) - (27,566)
34,602 (232,621) - (198,019)
31 December 2009 In thousands of pounds
Less than 1 year
1 to 5 years More than 5 years
Total
Floating
Cash and cash equivalents 50,569 - - 50,569
Liquidity facility - (14,000) - (14,000)
Fixed
Loan notes fixed using interest rate swaps - (190,050) - (190,050)
50,569 (204,050) - (153,481)

57 ING UK REAL ESTATE INCOME TRUST LIMITED
FINA
NC
IAL STA
TEMEN
TS
24. RISK MANAGEMENT (CONTINUED) MARKET RISK The Group’s activities are primarily within the real estate market, exposing it to very specific industry risks.
The yields available from investments in real estate depend primarily on the amount of revenue earned and capital appreciation generated by the relevant properties as well as expenses incurred. If properties do not generate sufficient revenues to meet operating expenses, including debt service and capital expenditure, the Group’s revenue will be adversely affected. Revenue from properties may be adversely affected by the general economic climate, local conditions such as oversupply of properties or a reduction in demand for properties in the market in which the Group operates, the attractiveness of the properties to tenants, the quality of the management, competition from other available properties and increased operating costs (including real estate taxes).
In addition, the Group’s revenue would be adversely affected if a significant number of tenants were unable to pay rent or its properties could not be rented on favourable terms. Certain significant expenditure associated with each equity investment in real estate (such as external financing costs, real estate taxes and maintenance costs) generally are not reduced when circumstances cause a reduction in revenue from properties.
By diversifying in regions, sectors, risk categories and tenants, the Investment Manager expects to lower the risk profile of the portfolio. The Board continues to oversee the profile of the portfolio to ensure risks are managed. See the Investment Manager’s Report for the geographical spread and the analysis of the top ten tenants of the portfolio.
The valuation of the Group’s property assets is subject to changes in market conditions. Such changes are taken to the Statement of Comprehensive Income and thus impact on the Group’s net result. A 5% increase or decrease in property values would increase or decrease the Group’s net result by £21.3 million.
CONCENTRATION RISK As discussed above, all of the Group’s investments are in the UK and therefore is exposed to macroeconomic changes in the UK
economy. Furthermore, the Group places reliance on a limited number of tenants for its rental income.
CURRENCY RISK The Group has no exposure to foreign currency risk.
25. RELATED PARTY TRANSACTIONS During the year the Investment Manager was paid a total of £2,882,000 (31 December 2009: £3,172,000) in respect of the
property management and administration services. As at 31 December 2010 the Group owed £830,000 to the Investment Manager (31 December 2009: £655,000).
The Group paid £250,000 to ING Bank N.V. on 25 January 2010 in respect of advisory services undertaken in 2009. A further £779,000 was paid to ING Bank N.V. during the year for works in connection with the acquisition of Rugby REIT, as detailed in the Investment Manager’s Report.
The Group has one non-independent director, who is connected with the Investment Manager. The remuneration in respect of this appointment was waived.
ING UK Real Estate Income Trust Limited has no controlling parties.
26. EVENTS AFTER THE REPORTING DATE Following the reporting date further property sales totalling £2.1 million have exchanged contracts.
On 16 February 2011 a payment of £237,000 was made to repay loan stock, with a further £36,000 repaid on 31 March 2011. On 23 February 2011 the Company established a UK subsidiary, Picton Capital Limited, as its investment management subsidiary. A dividend of £3,453,361 (1 pence per share) was approved by the Board on 31 January 2011 and paid on 28 February 2011.
(continued)Notes to the Consolidated Financial Statements

58ANNUAL REPORT
FIN
AN
CIA
L ST
ATE
MEN
TS

59
ING REAL ESTATE GLOBAL NETWORK
AUSTRALIA BELGIUM BRAZIL CHINA CZECH REPUBLIC FRANCE GERMANY HUNGARY ITALY JAPAN SOUTH KOREA THE NETHERLANDS POLAND ROMANIA SINGAPORE SPAIN SWEDEN TAIWAN THAILAND UNITED KINGDOM UNITED STATES
ING UK Real Estate Income Trust Limited Trafalgar Court, Les Banques, St. Peter Port, Guernsey, GY1 3QLT: +44 (0) 1481 745 529
www.ingreit.co.uk


